|
||||||||||||||||||||||||||||||||||||||||||||||||||||||||||||||||||||||||||||||||||||||||||||||||||||||||||||||||||||||||||||||||||||||||||||||||||||||||||||||||||||||||||||||||||||||||||||||||||||||||||||||||||||||||||||||||||||||||||||||||||||||||||||||||||||||||||||||||||||||||||||||||||||||||||||||||||||||||||
| |
| Phenotypic Information (metabolism pathway, cancer, disease, phenome) |
| |
| |
| Gene-Gene Network Information: Co-Expression Network, Interacting Genes & KEGG |
| |
|


| Gene Summary for GNPAT |
| Basic gene info. | Gene symbol | GNPAT |
| Gene name | glyceronephosphate O-acyltransferase | |
| Synonyms | DAP-AT|DAPAT|DHAPAT | |
| Cytomap | UCSC genome browser: 1q42 | |
| Genomic location | chr1 :231376918-231413719 | |
| Type of gene | protein-coding | |
| RefGenes | NM_014236.3, | |
| Ensembl id | ENSG00000116906 | |
| Description | DHAP-ATacyl-CoA:dihydroxyacetonephosphateacyltransferasedihydroxyacetone phosphate acyltransferaseglycerone-phosphate O-acyltransferase | |
| Modification date | 20141207 | |
| dbXrefs | MIM : 602744 | |
| HGNC : HGNC | ||
| Ensembl : ENSG00000116906 | ||
| HPRD : 04120 | ||
| Vega : OTTHUMG00000038024 | ||
| Protein | UniProt: go to UniProt's Cross Reference DB Table | |
| Expression | CleanEX: HS_GNPAT | |
| BioGPS: 8443 | ||
| Gene Expression Atlas: ENSG00000116906 | ||
| The Human Protein Atlas: ENSG00000116906 | ||
| Pathway | NCI Pathway Interaction Database: GNPAT | |
| KEGG: GNPAT | ||
| REACTOME: GNPAT | ||
| ConsensusPathDB | ||
| Pathway Commons: GNPAT | ||
| Metabolism | MetaCyc: GNPAT | |
| HUMANCyc: GNPAT | ||
| Regulation | Ensembl's Regulation: ENSG00000116906 | |
| miRBase: chr1 :231,376,918-231,413,719 | ||
| TargetScan: NM_014236 | ||
| cisRED: ENSG00000116906 | ||
| Context | iHOP: GNPAT | |
| cancer metabolism search in PubMed: GNPAT | ||
| UCL Cancer Institute: GNPAT | ||
| Assigned class in ccmGDB | C | |
| Top |
| Phenotypic Information for GNPAT(metabolism pathway, cancer, disease, phenome) |
| Cancer | CGAP: GNPAT |
| Familial Cancer Database: GNPAT | |
| * This gene is included in those cancer gene databases. |
|
|
|
|
|
|
| ||||||||||||||||||||||||||||||||||||||||||||||||||||||||||||||||||||||||||||||||||||||||||||||||||||||||||||||||||||||||||||||||||||||||||||||||||||||||||||||||||||||||||||||||||||||||||||||||||||||||||||||||||||||||||||||||||||||||||||||||||||||||||||||||||||||||||||||||||||||||||||||||||||||||||||||||||||
Oncogene 1 | Significant driver gene in | |||||||||||||||||||||||||||||||||||||||||||||||||||||||||||||||||||||||||||||||||||||||||||||||||||||||||||||||||||||||||||||||||||||||||||||||||||||||||||||||||||||||||||||||||||||||||||||||||||||||||||||||||||||||||||||||||||||||||||||||||||||||||||||||||||||||||||||||||||||||||||||||||||||||||||||||||||||||||
| cf) number; DB name 1 Oncogene; http://nar.oxfordjournals.org/content/35/suppl_1/D721.long, 2 Tumor Suppressor gene; https://bioinfo.uth.edu/TSGene/, 3 Cancer Gene Census; http://www.nature.com/nrc/journal/v4/n3/abs/nrc1299.html, 4 CancerGenes; http://nar.oxfordjournals.org/content/35/suppl_1/D721.long, 5 Network of Cancer Gene; http://ncg.kcl.ac.uk/index.php, 1Therapeutic Vulnerabilities in Cancer; http://cbio.mskcc.org/cancergenomics/statius/ |
| KEGG_GLYCEROPHOSPHOLIPID_METABOLISM REACTOME_PHOSPHOLIPID_METABOLISM REACTOME_PEROXISOMAL_LIPID_METABOLISM REACTOME_METABOLISM_OF_LIPIDS_AND_LIPOPROTEINS | |
| OMIM | |
| Orphanet | |
| Disease | KEGG Disease: GNPAT |
| MedGen: GNPAT (Human Medical Genetics with Condition) | |
| ClinVar: GNPAT | |
| Phenotype | MGI: GNPAT (International Mouse Phenotyping Consortium) |
| PhenomicDB: GNPAT | |
| Mutations for GNPAT |
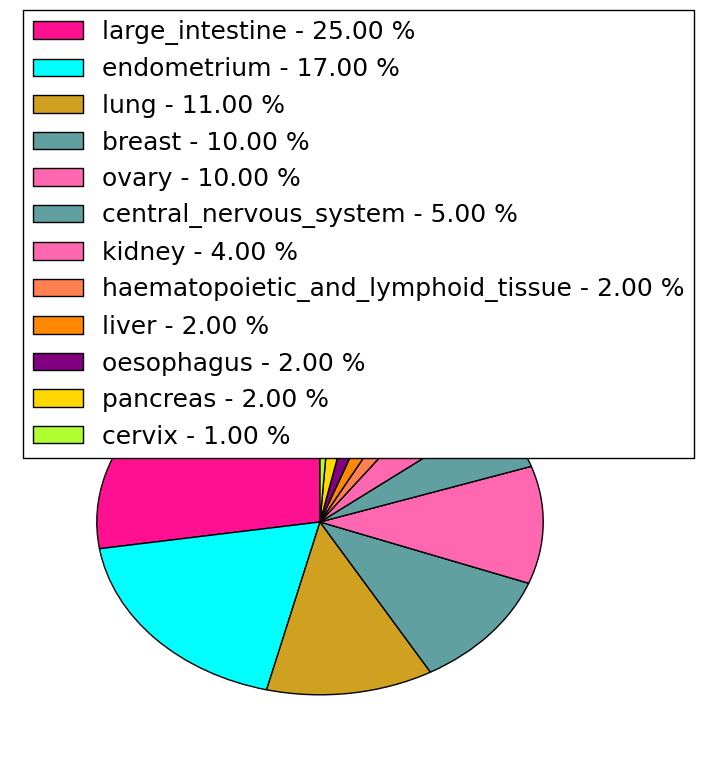
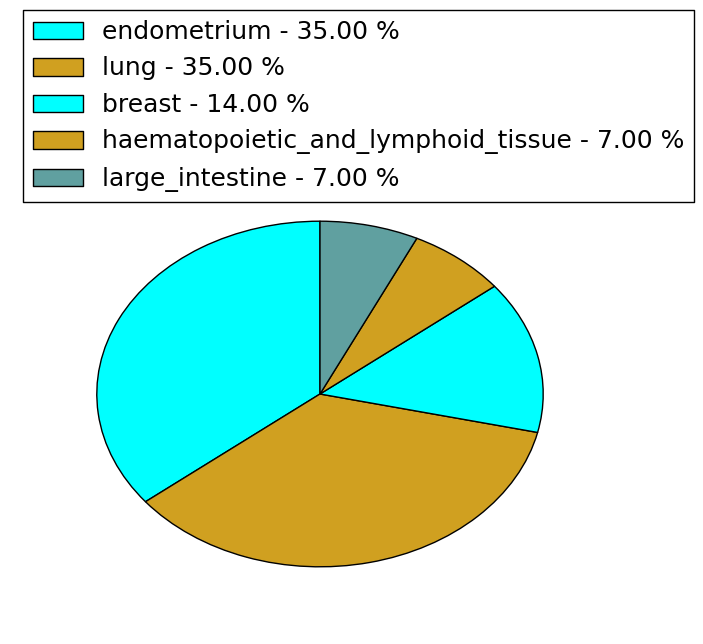
| * Under tables are showing count per each tissue to give us broad intuition about tissue specific mutation patterns.You can go to the detailed page for each mutation database's web site. |
| - Statistics for Tissue and Mutation type | Top |
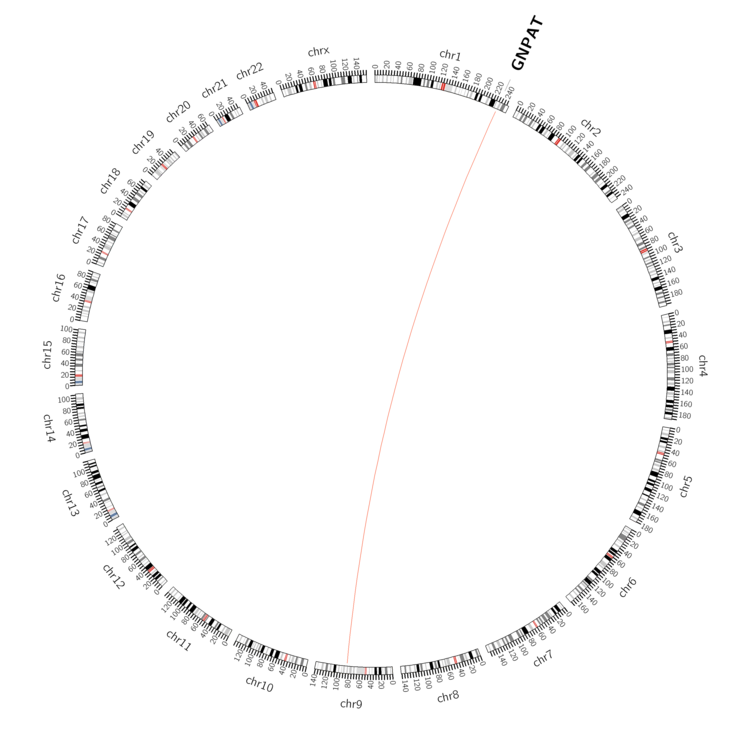 |
| - For Inter-chromosomal Variations |
| * Inter-chromosomal variantions includes 'interchromosomal amplicon to amplicon', 'interchromosomal amplicon to non-amplified dna', 'interchromosomal insertion', 'Interchromosomal unknown type'. |
 |
| - For Intra-chromosomal Variations |
| There's no intra-chromosomal structural variation. |
| Sample | Symbol_a | Chr_a | Start_a | End_a | Symbol_b | Chr_b | Start_b | End_b |
| ovary | GNPAT | chr1 | 231396783 | 231396803 | chr9 | 83731475 | 83731495 |
| cf) Tissue number; Tissue name (1;Breast, 2;Central_nervous_system, 3;Haematopoietic_and_lymphoid_tissue, 4;Large_intestine, 5;Liver, 6;Lung, 7;Ovary, 8;Pancreas, 9;Prostate, 10;Skin, 11;Soft_tissue, 12;Upper_aerodigestive_tract) |
| * From mRNA Sanger sequences, Chitars2.0 arranged chimeric transcripts. This table shows GNPAT related fusion information. |
| ID | Head Gene | Tail Gene | Accession | Gene_a | qStart_a | qEnd_a | Chromosome_a | tStart_a | tEnd_a | Gene_a | qStart_a | qEnd_a | Chromosome_a | tStart_a | tEnd_a |
| DA174856 | PLP1 | 1 | 103 | X | 103031789 | 103031891 | GNPAT | 102 | 526 | 1 | 231410993 | 231413439 | |
| AW810786 | GNPAT | 6 | 210 | 1 | 231393186 | 231393390 | GNPAT | 203 | 534 | 1 | 231392635 | 231392966 | |
| AK023953 | NFIA | 586 | 870 | 1 | 61926695 | 61926976 | GNPAT | 871 | 2774 | 1 | 231398550 | 231413668 | |
| Top |
| Mutation type/ Tissue ID | brca | cns | cerv | endome | haematopo | kidn | Lintest | liver | lung | ns | ovary | pancre | prost | skin | stoma | thyro | urina | |||
| Total # sample | 1 | 1 | ||||||||||||||||||
| GAIN (# sample) | 1 | 1 | ||||||||||||||||||
| LOSS (# sample) |
| cf) Tissue ID; Tissue type (1; Breast, 2; Central_nervous_system, 3; Cervix, 4; Endometrium, 5; Haematopoietic_and_lymphoid_tissue, 6; Kidney, 7; Large_intestine, 8; Liver, 9; Lung, 10; NS, 11; Ovary, 12; Pancreas, 13; Prostate, 14; Skin, 15; Stomach, 16; Thyroid, 17; Urinary_tract) |
| Top |
|
 |
| Top |
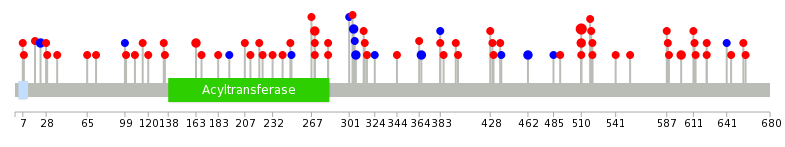
| Stat. for Non-Synonymous SNVs (# total SNVs=67) | (# total SNVs=14) |
 |  |
(# total SNVs=1) | (# total SNVs=2) |
 |  |
| Top |
| * When you move the cursor on each content, you can see more deailed mutation information on the Tooltip. Those are primary_site,primary_histology,mutation(aa),pubmedID. |
| GRCh37 position | Mutation(aa) | Unique sampleID count |
| chr1:231408064-231408064 | p.V510A | 5 |
| chr1:231408063-231408063 | p.V510I | 3 |
| chr1:231398518-231398518 | p.R163Q | 2 |
| chr1:231406610-231406610 | p.S462S | 2 |
| chr1:231401902-231401902 | p.E305E | 2 |
| chr1:231401908-231401908 | p.T307T | 2 |
| chr1:231401795-231401795 | p.R270G | 2 |
| chr1:231411021-231411021 | p.Y600H | 2 |
| chr1:231408094-231408094 | p.V520D | 2 |
| chr1:231377193-231377193 | p.L23L | 2 |
| Top |
|
 |
| Point Mutation/ Tissue ID | 1 | 2 | 3 | 4 | 5 | 6 | 7 | 8 | 9 | 10 | 11 | 12 | 13 | 14 | 15 | 16 | 17 | 18 | 19 | 20 |
| # sample | 5 | 1 | 14 | 1 | 2 | 2 | 9 | 2 | 3 | 1 | 3 | 2 | 2 | 10 | ||||||
| # mutation | 5 | 1 | 9 | 1 | 2 | 2 | 9 | 2 | 3 | 1 | 3 | 2 | 2 | 15 | ||||||
| nonsynonymous SNV | 3 | 1 | 9 | 1 | 2 | 2 | 6 | 2 | 3 | 1 | 2 | 2 | 2 | 11 | ||||||
| synonymous SNV | 2 | 3 | 1 | 4 |
| cf) Tissue ID; Tissue type (1; BLCA[Bladder Urothelial Carcinoma], 2; BRCA[Breast invasive carcinoma], 3; CESC[Cervical squamous cell carcinoma and endocervical adenocarcinoma], 4; COAD[Colon adenocarcinoma], 5; GBM[Glioblastoma multiforme], 6; Glioma Low Grade, 7; HNSC[Head and Neck squamous cell carcinoma], 8; KICH[Kidney Chromophobe], 9; KIRC[Kidney renal clear cell carcinoma], 10; KIRP[Kidney renal papillary cell carcinoma], 11; LAML[Acute Myeloid Leukemia], 12; LUAD[Lung adenocarcinoma], 13; LUSC[Lung squamous cell carcinoma], 14; OV[Ovarian serous cystadenocarcinoma ], 15; PAAD[Pancreatic adenocarcinoma], 16; PRAD[Prostate adenocarcinoma], 17; SKCM[Skin Cutaneous Melanoma], 18:STAD[Stomach adenocarcinoma], 19:THCA[Thyroid carcinoma], 20:UCEC[Uterine Corpus Endometrial Carcinoma]) |
| Top |
| * We represented just top 10 SNVs. When you move the cursor on each content, you can see more deailed mutation information on the Tooltip. Those are primary_site, primary_histology, mutation(aa), pubmedID. |
| Genomic Position | Mutation(aa) | Unique sampleID count |
| chr1:231408064 | p.V510A | 5 |
| chr1:231403468 | p.R270G | 2 |
| chr1:231406610 | p.S462S | 2 |
| chr1:231401795 | p.V366V | 2 |
| chr1:231402070 | p.A431T | 1 |
| chr1:231396261 | p.L623V | 1 |
| chr1:231406515 | p.K90N | 1 |
| chr1:231401089 | p.A437V | 1 |
| chr1:231409726 | p.V641V | 1 |
| chr1:231402128 | p.L99L | 1 |
| * Copy number data were extracted from TCGA using R package TCGA-Assembler. The URLs of all public data files on TCGA DCC data server were gathered on Jan-05-2015. Function ProcessCNAData in TCGA-Assembler package was used to obtain gene-level copy number value which is calculated as the average copy number of the genomic region of a gene. |
 |
| cf) Tissue ID[Tissue type]: BLCA[Bladder Urothelial Carcinoma], BRCA[Breast invasive carcinoma], CESC[Cervical squamous cell carcinoma and endocervical adenocarcinoma], COAD[Colon adenocarcinoma], GBM[Glioblastoma multiforme], Glioma Low Grade, HNSC[Head and Neck squamous cell carcinoma], KICH[Kidney Chromophobe], KIRC[Kidney renal clear cell carcinoma], KIRP[Kidney renal papillary cell carcinoma], LAML[Acute Myeloid Leukemia], LUAD[Lung adenocarcinoma], LUSC[Lung squamous cell carcinoma], OV[Ovarian serous cystadenocarcinoma ], PAAD[Pancreatic adenocarcinoma], PRAD[Prostate adenocarcinoma], SKCM[Skin Cutaneous Melanoma], STAD[Stomach adenocarcinoma], THCA[Thyroid carcinoma], UCEC[Uterine Corpus Endometrial Carcinoma] |
| Top |
| Gene Expression for GNPAT |
| * CCLE gene expression data were extracted from CCLE_Expression_Entrez_2012-10-18.res: Gene-centric RMA-normalized mRNA expression data. |
 |
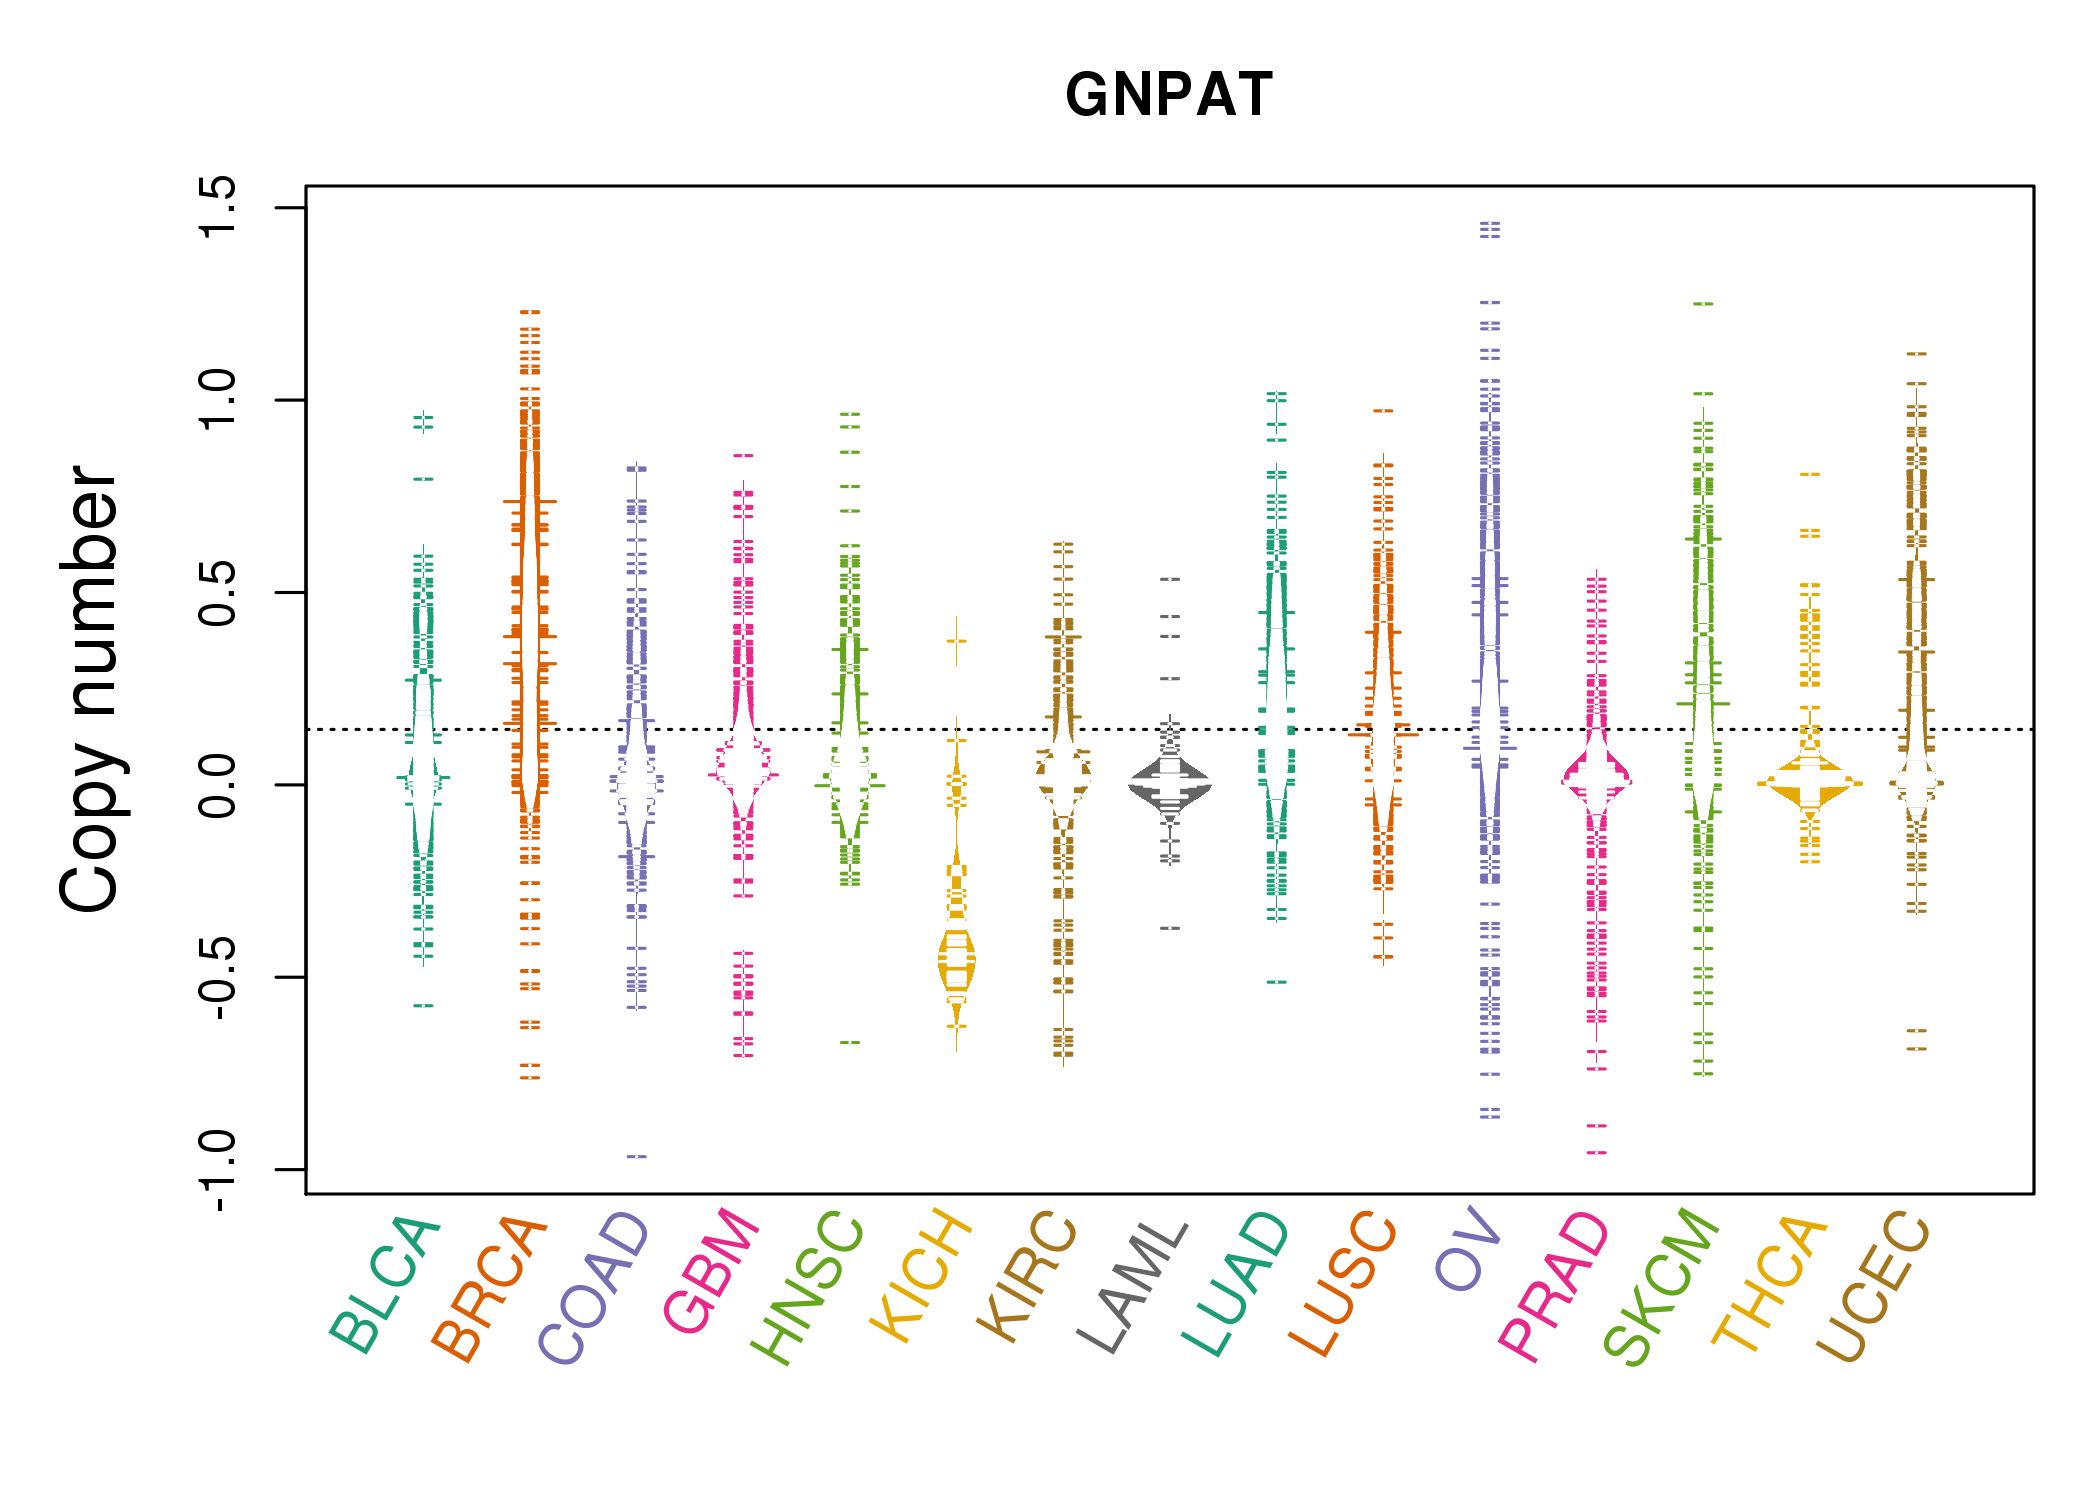
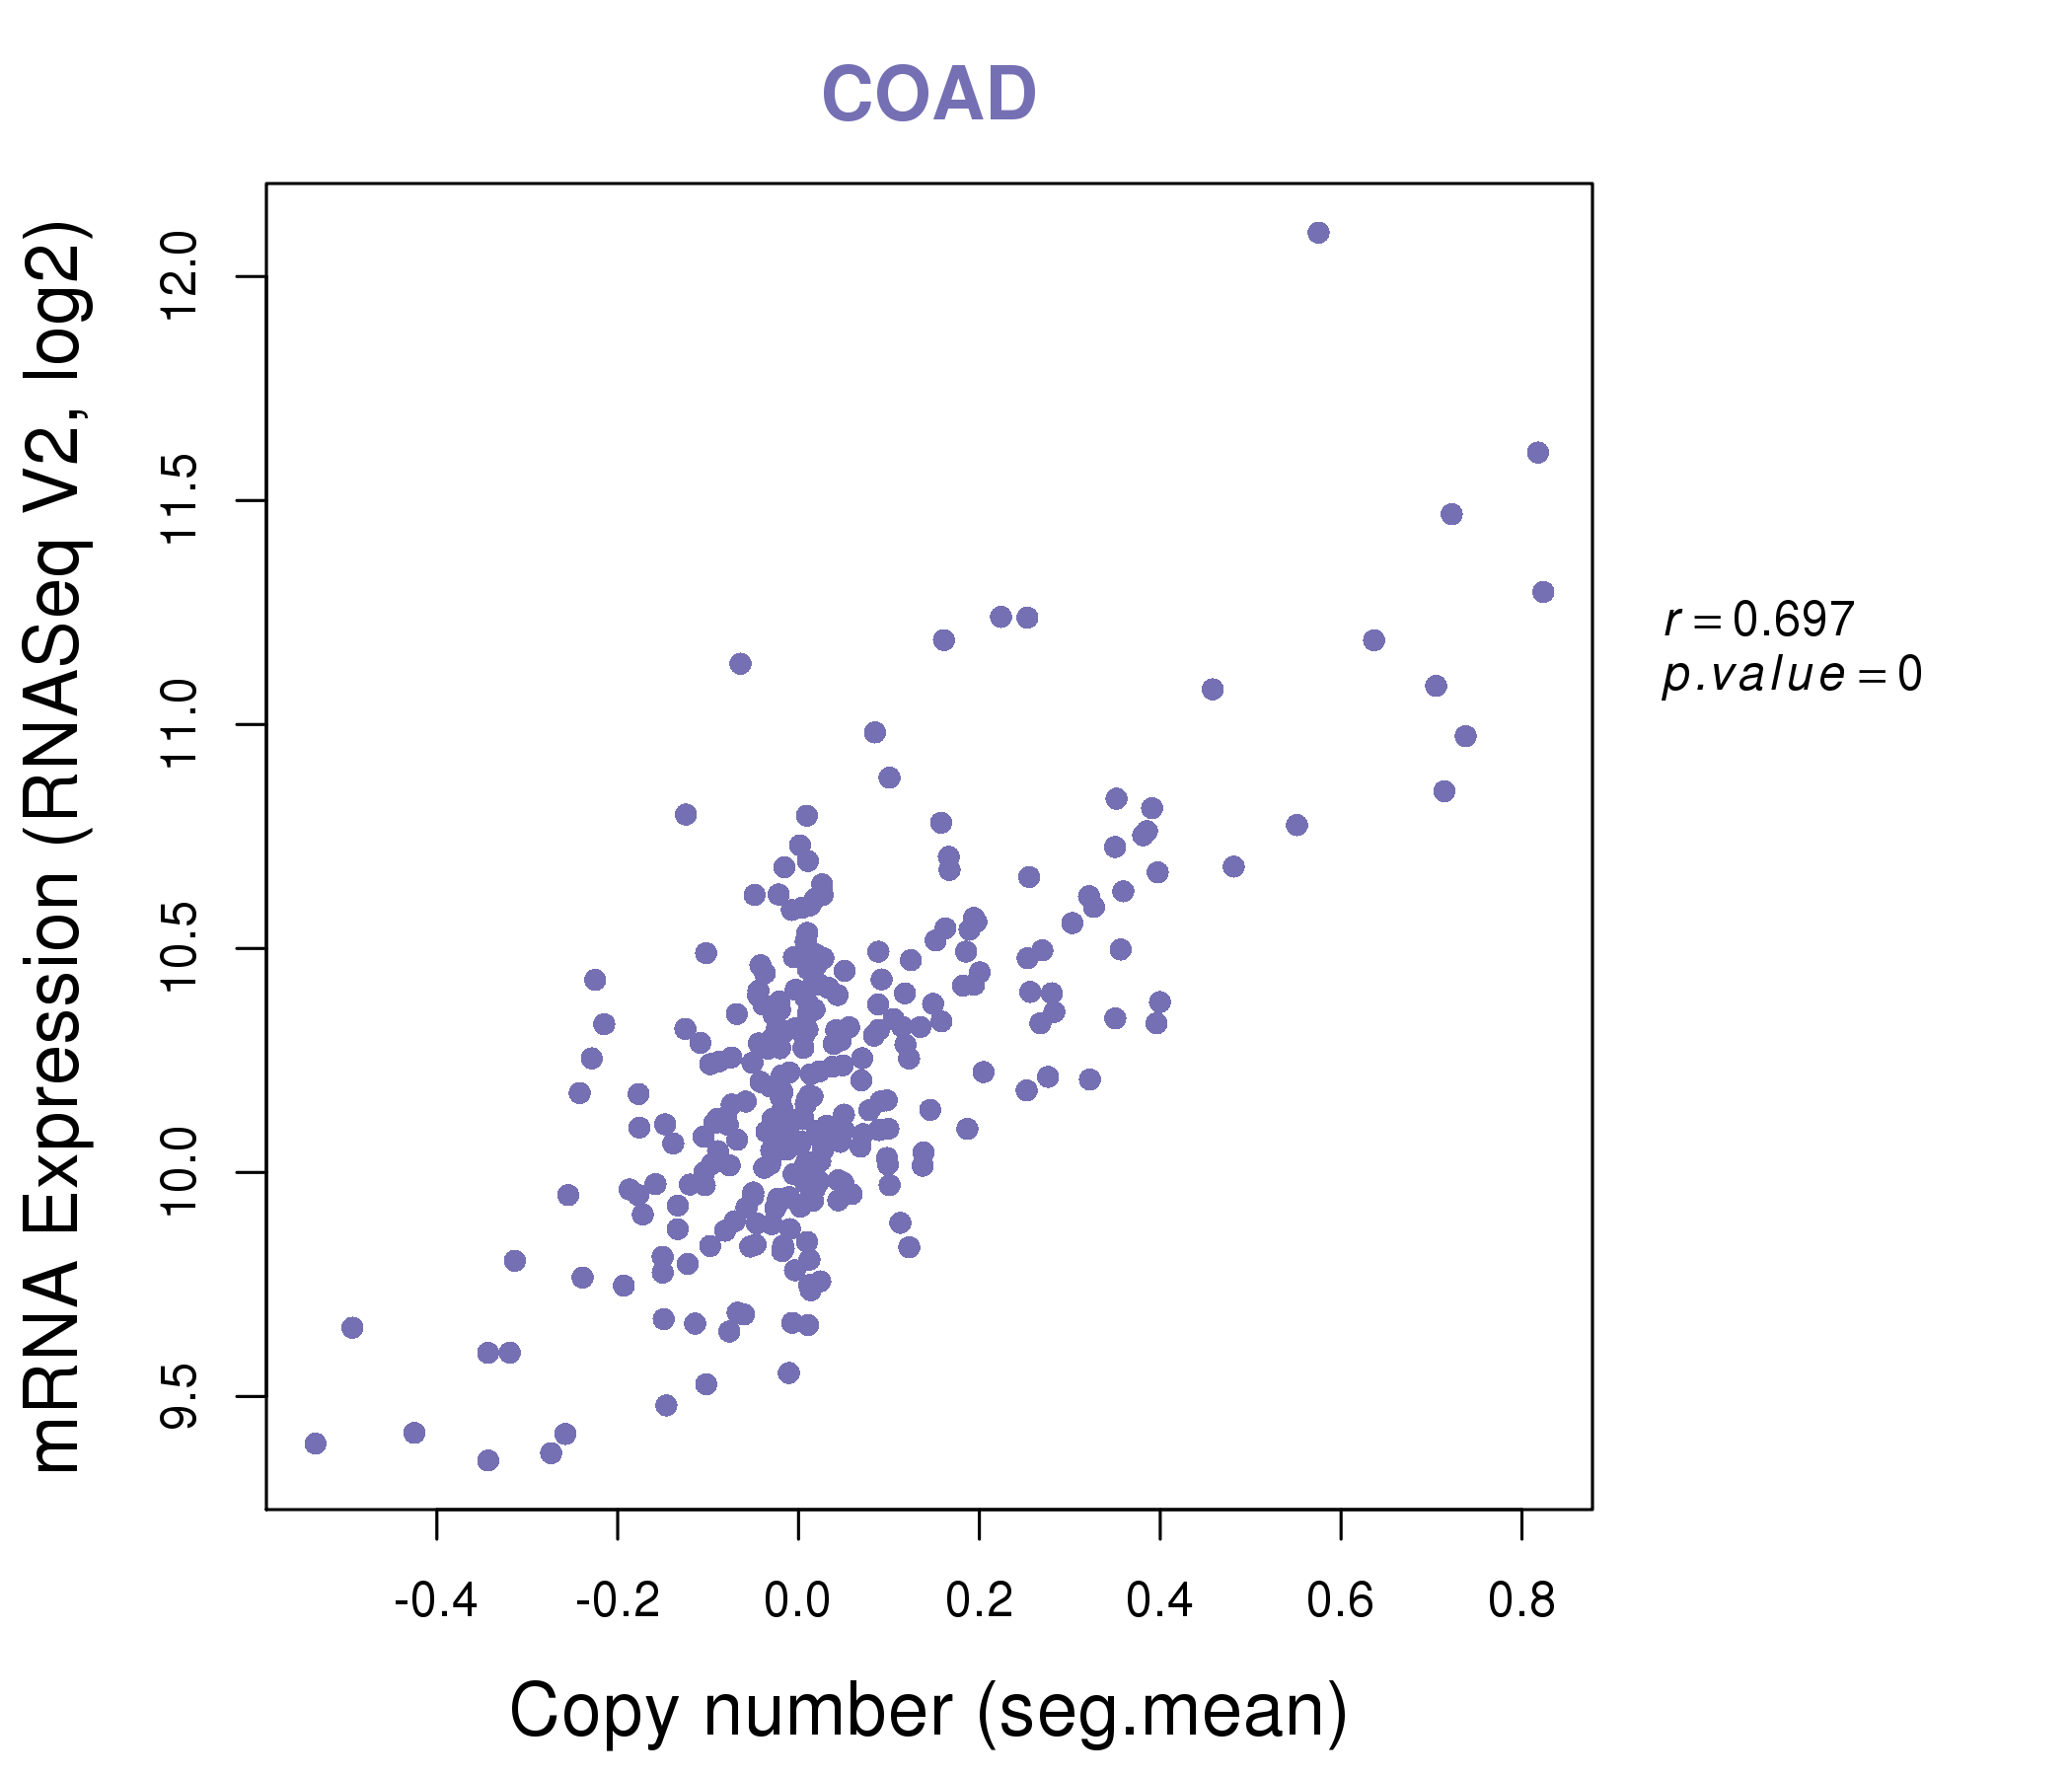
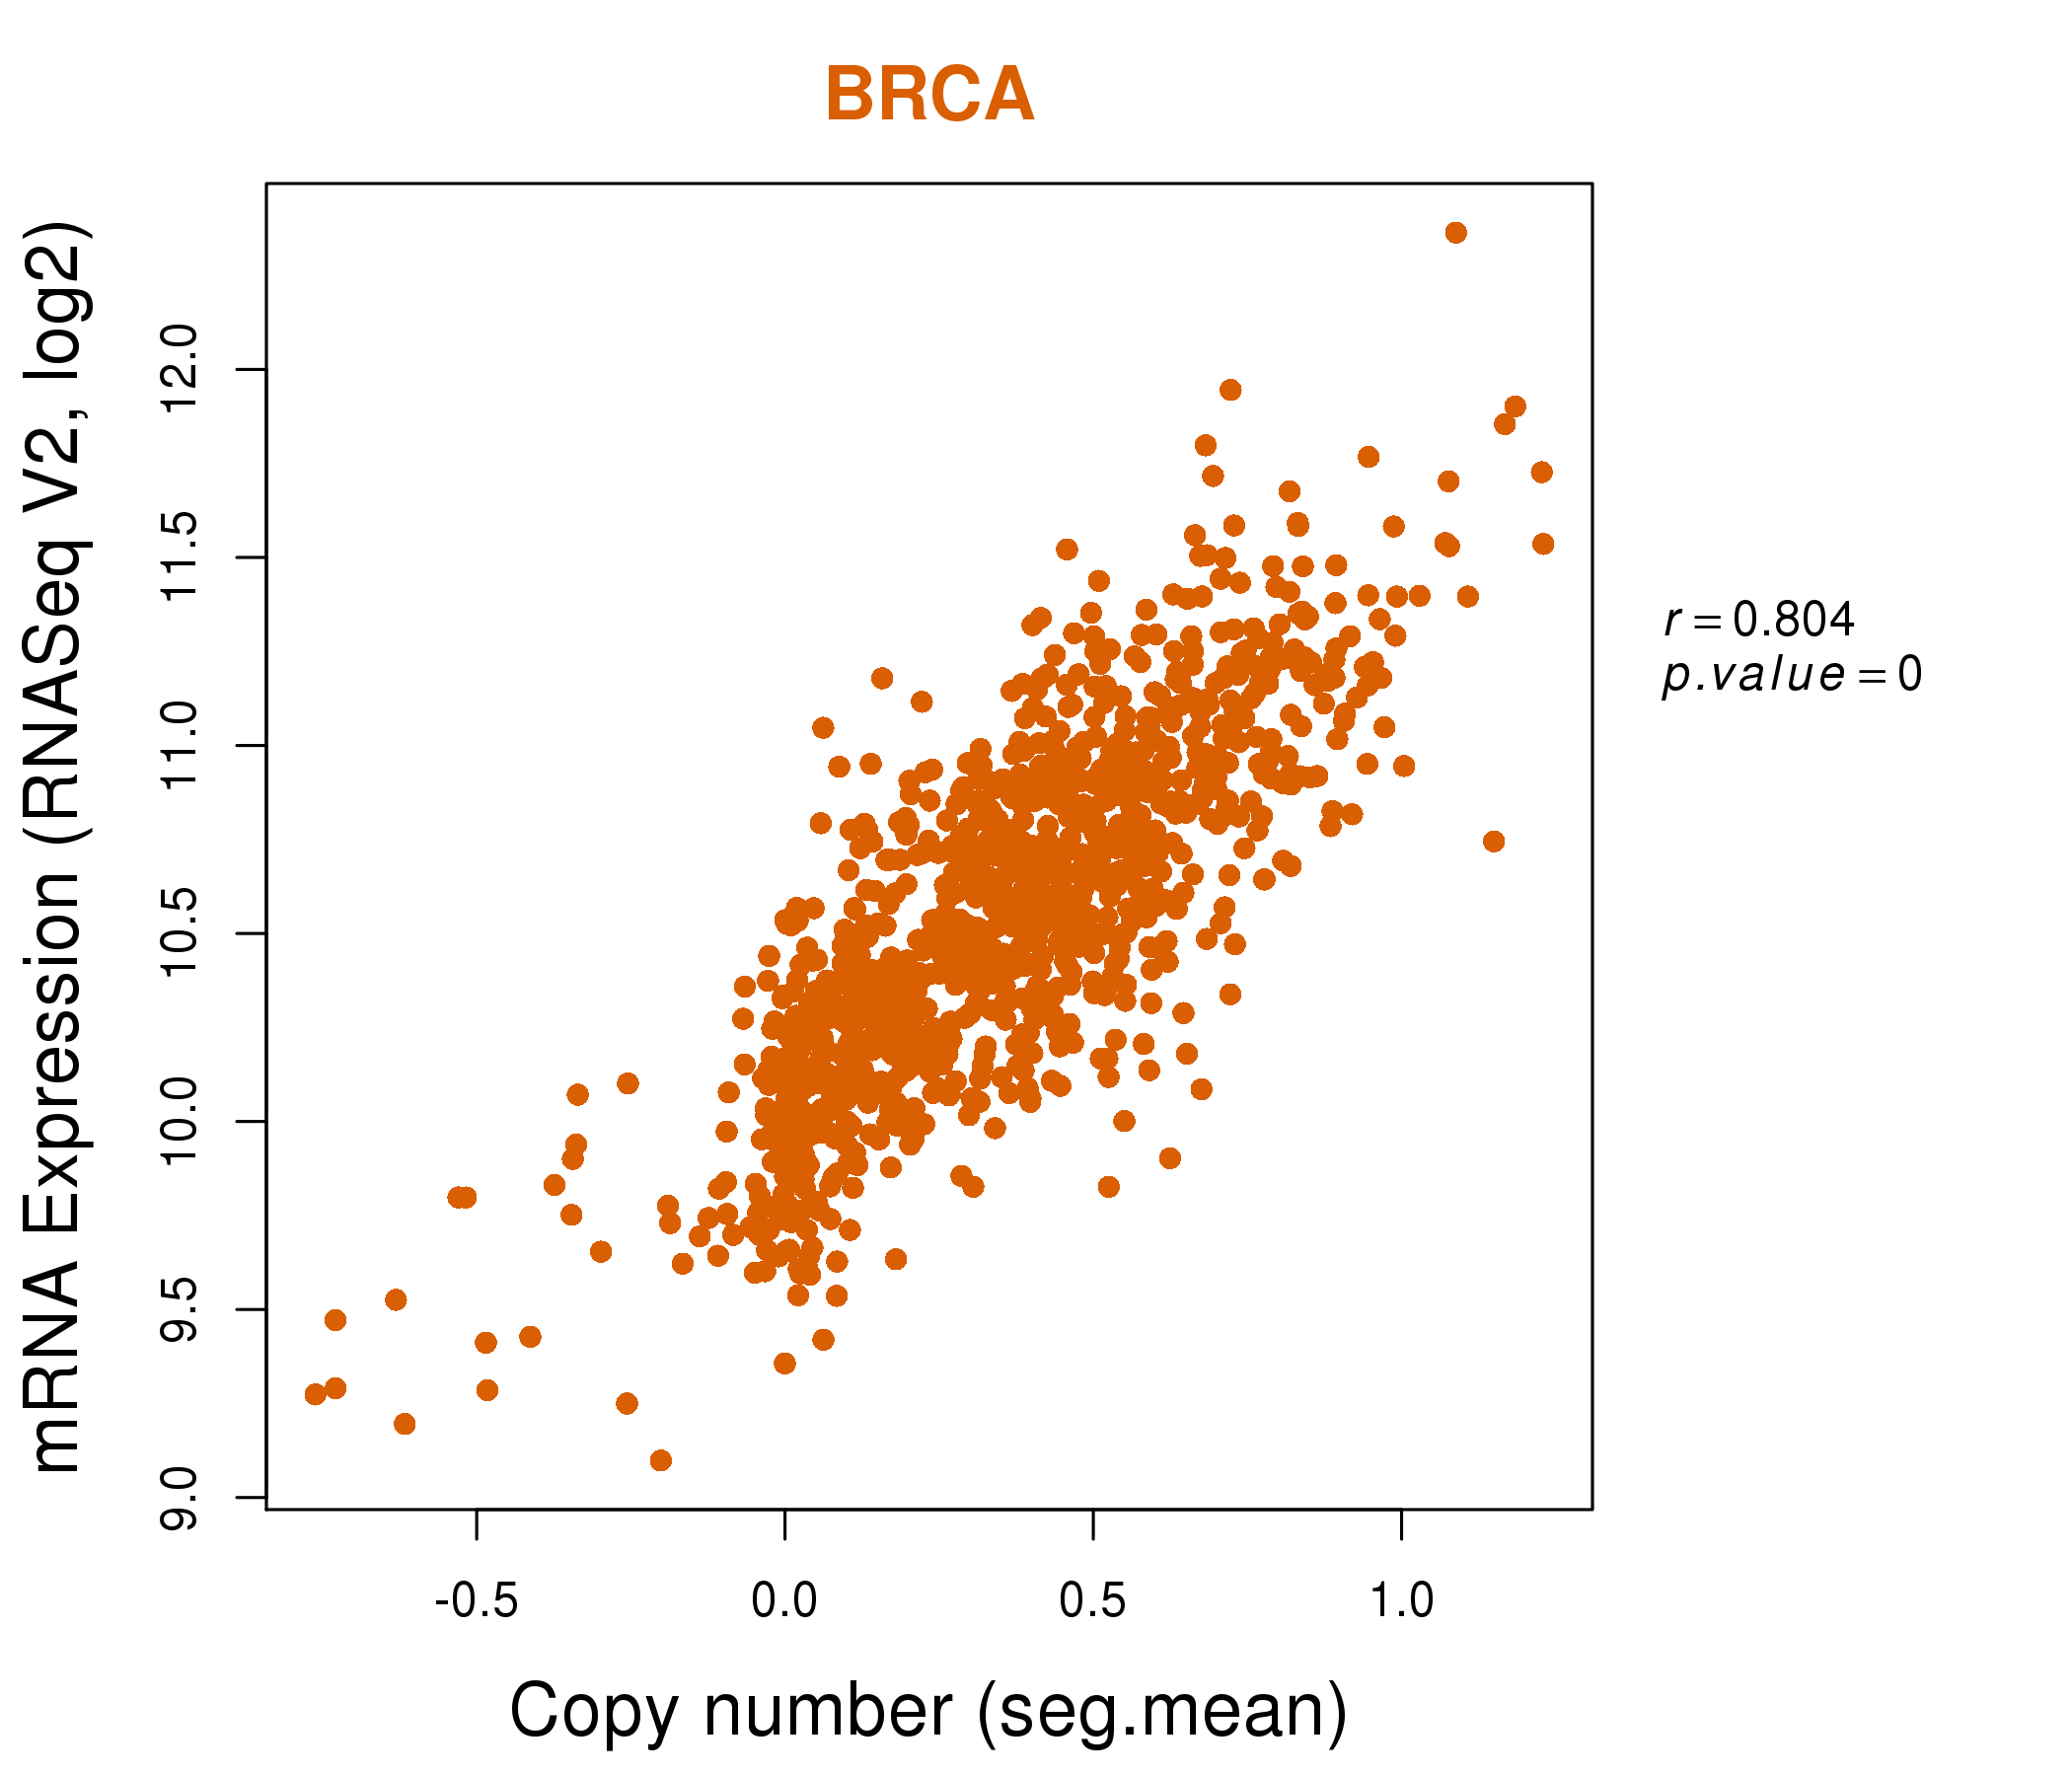
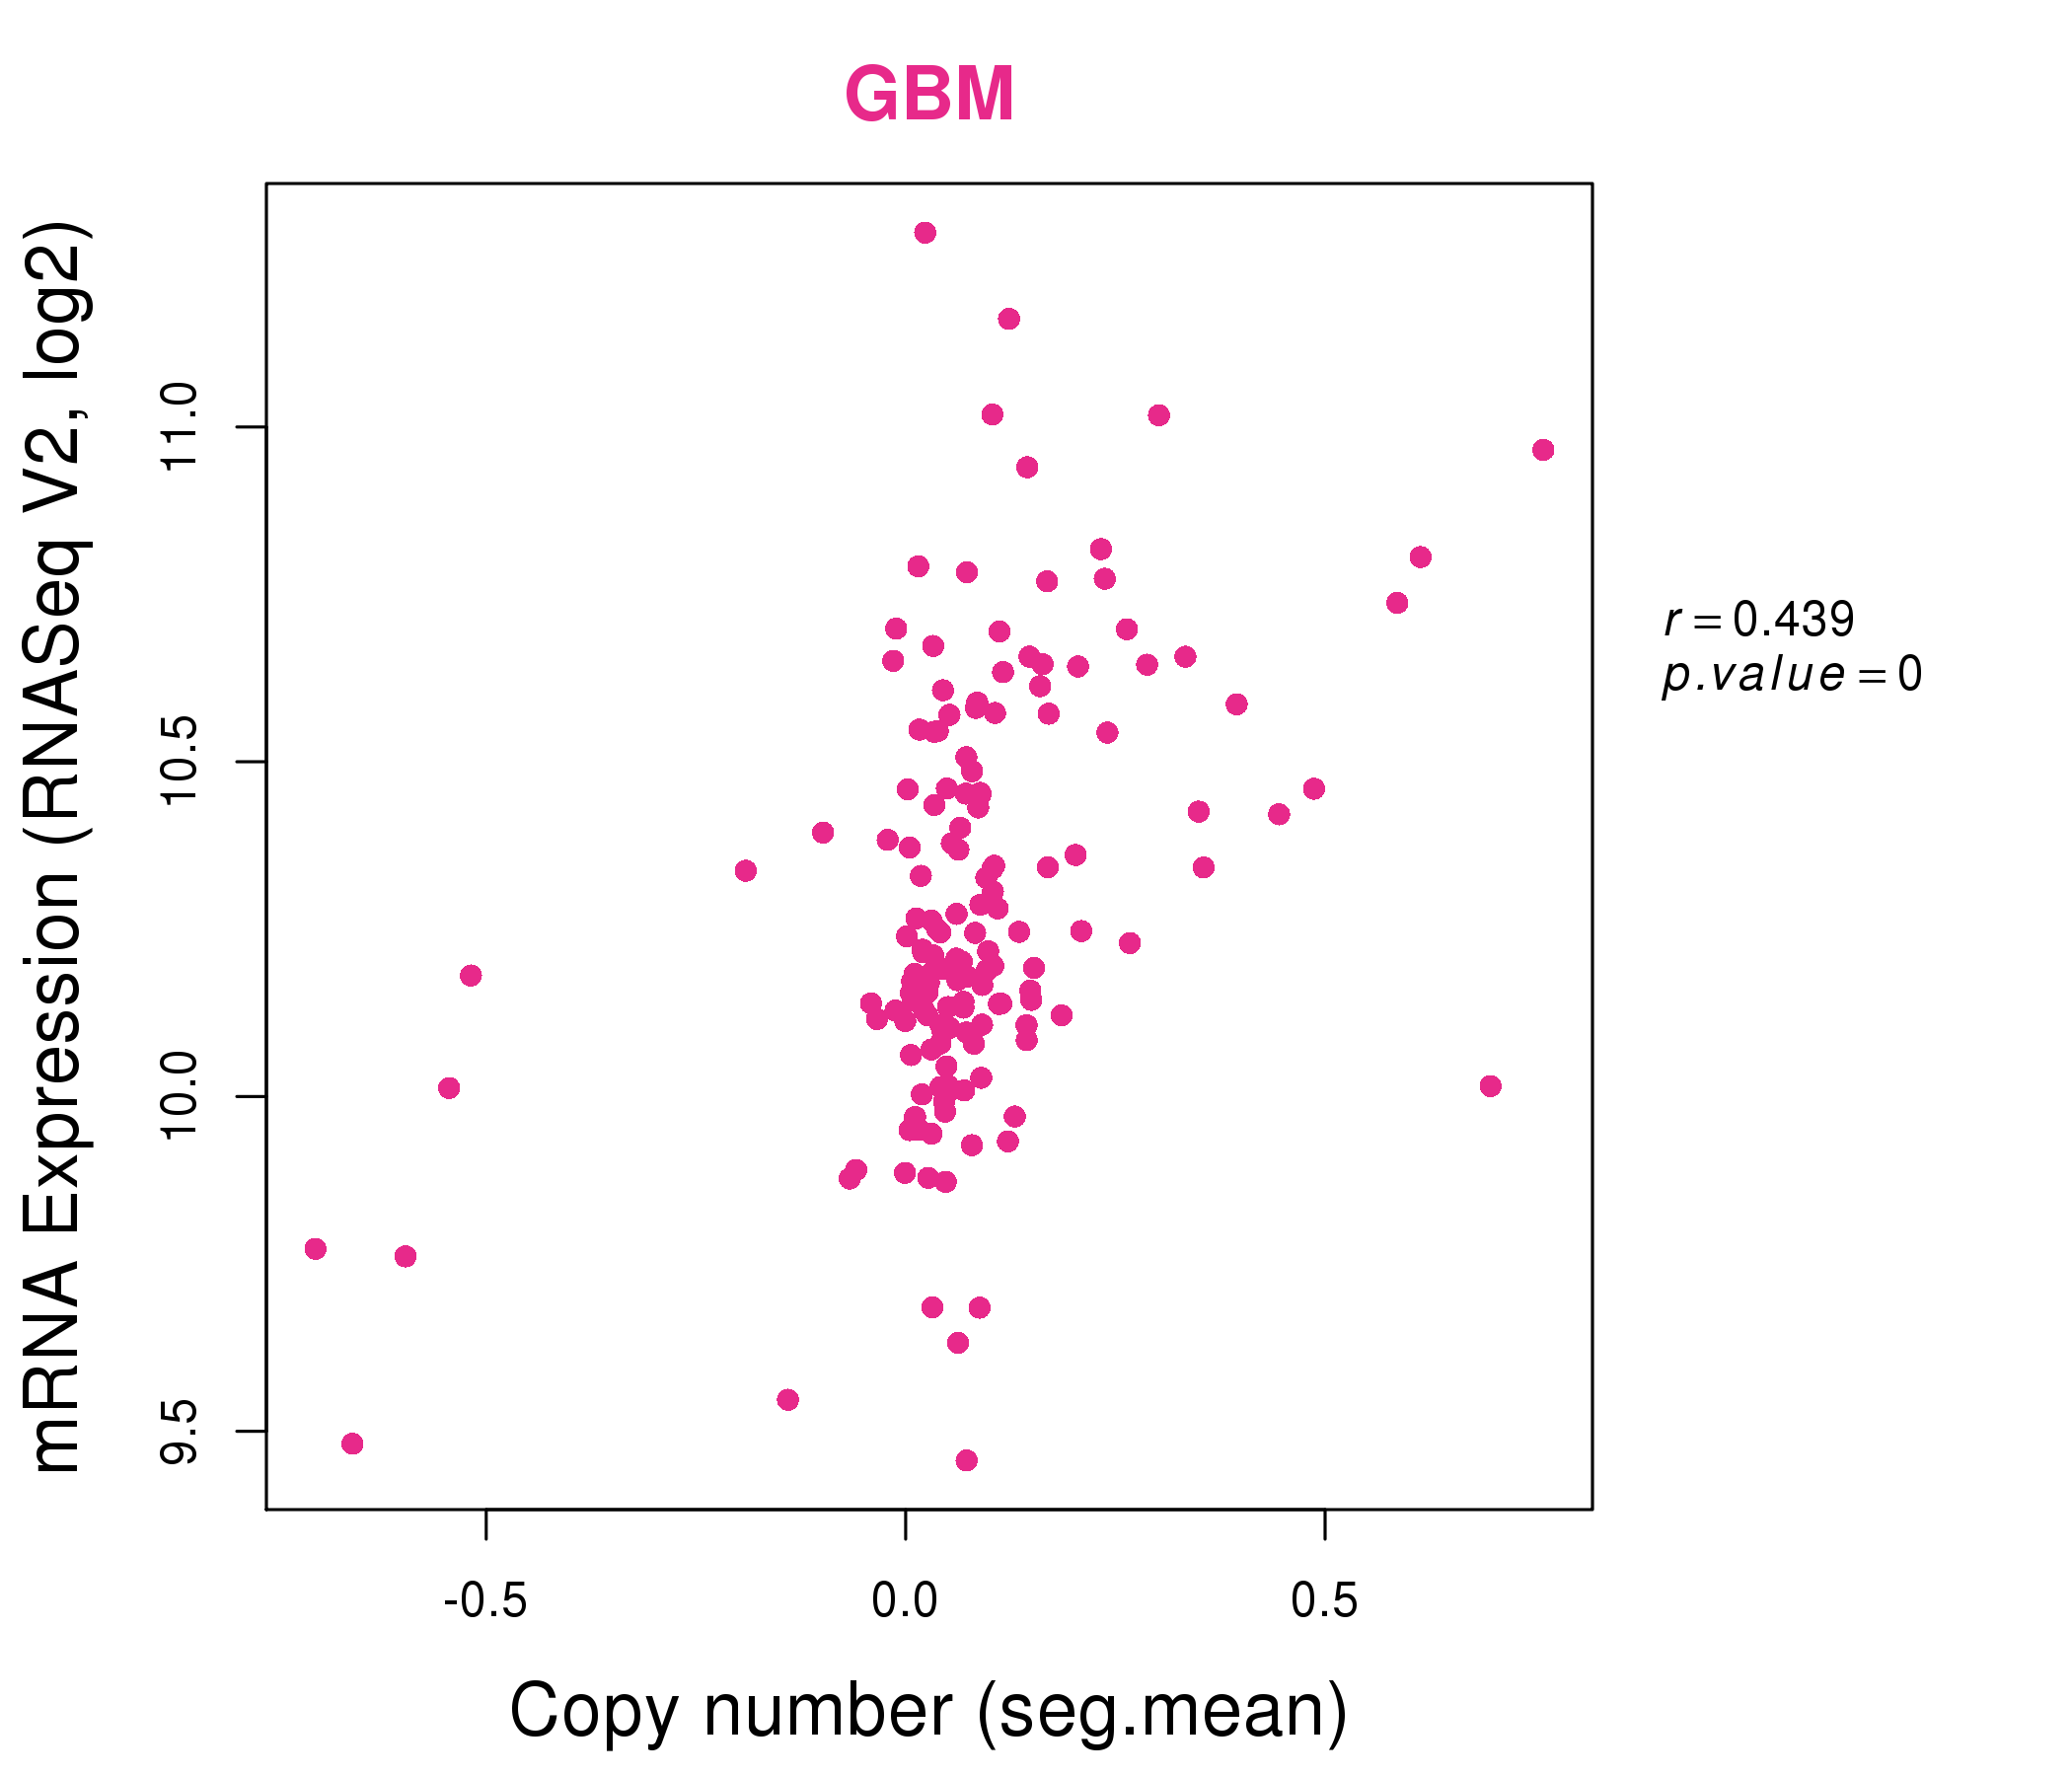
| * Normalized gene expression data of RNASeqV2 was extracted from TCGA using R package TCGA-Assembler. The URLs of all public data files on TCGA DCC data server were gathered at Jan-05-2015. Only eight cancer types have enough normal control samples for differential expression analysis. (t test, adjusted p<0.05 (using Benjamini-Hochberg FDR)) |
 |
| Top |
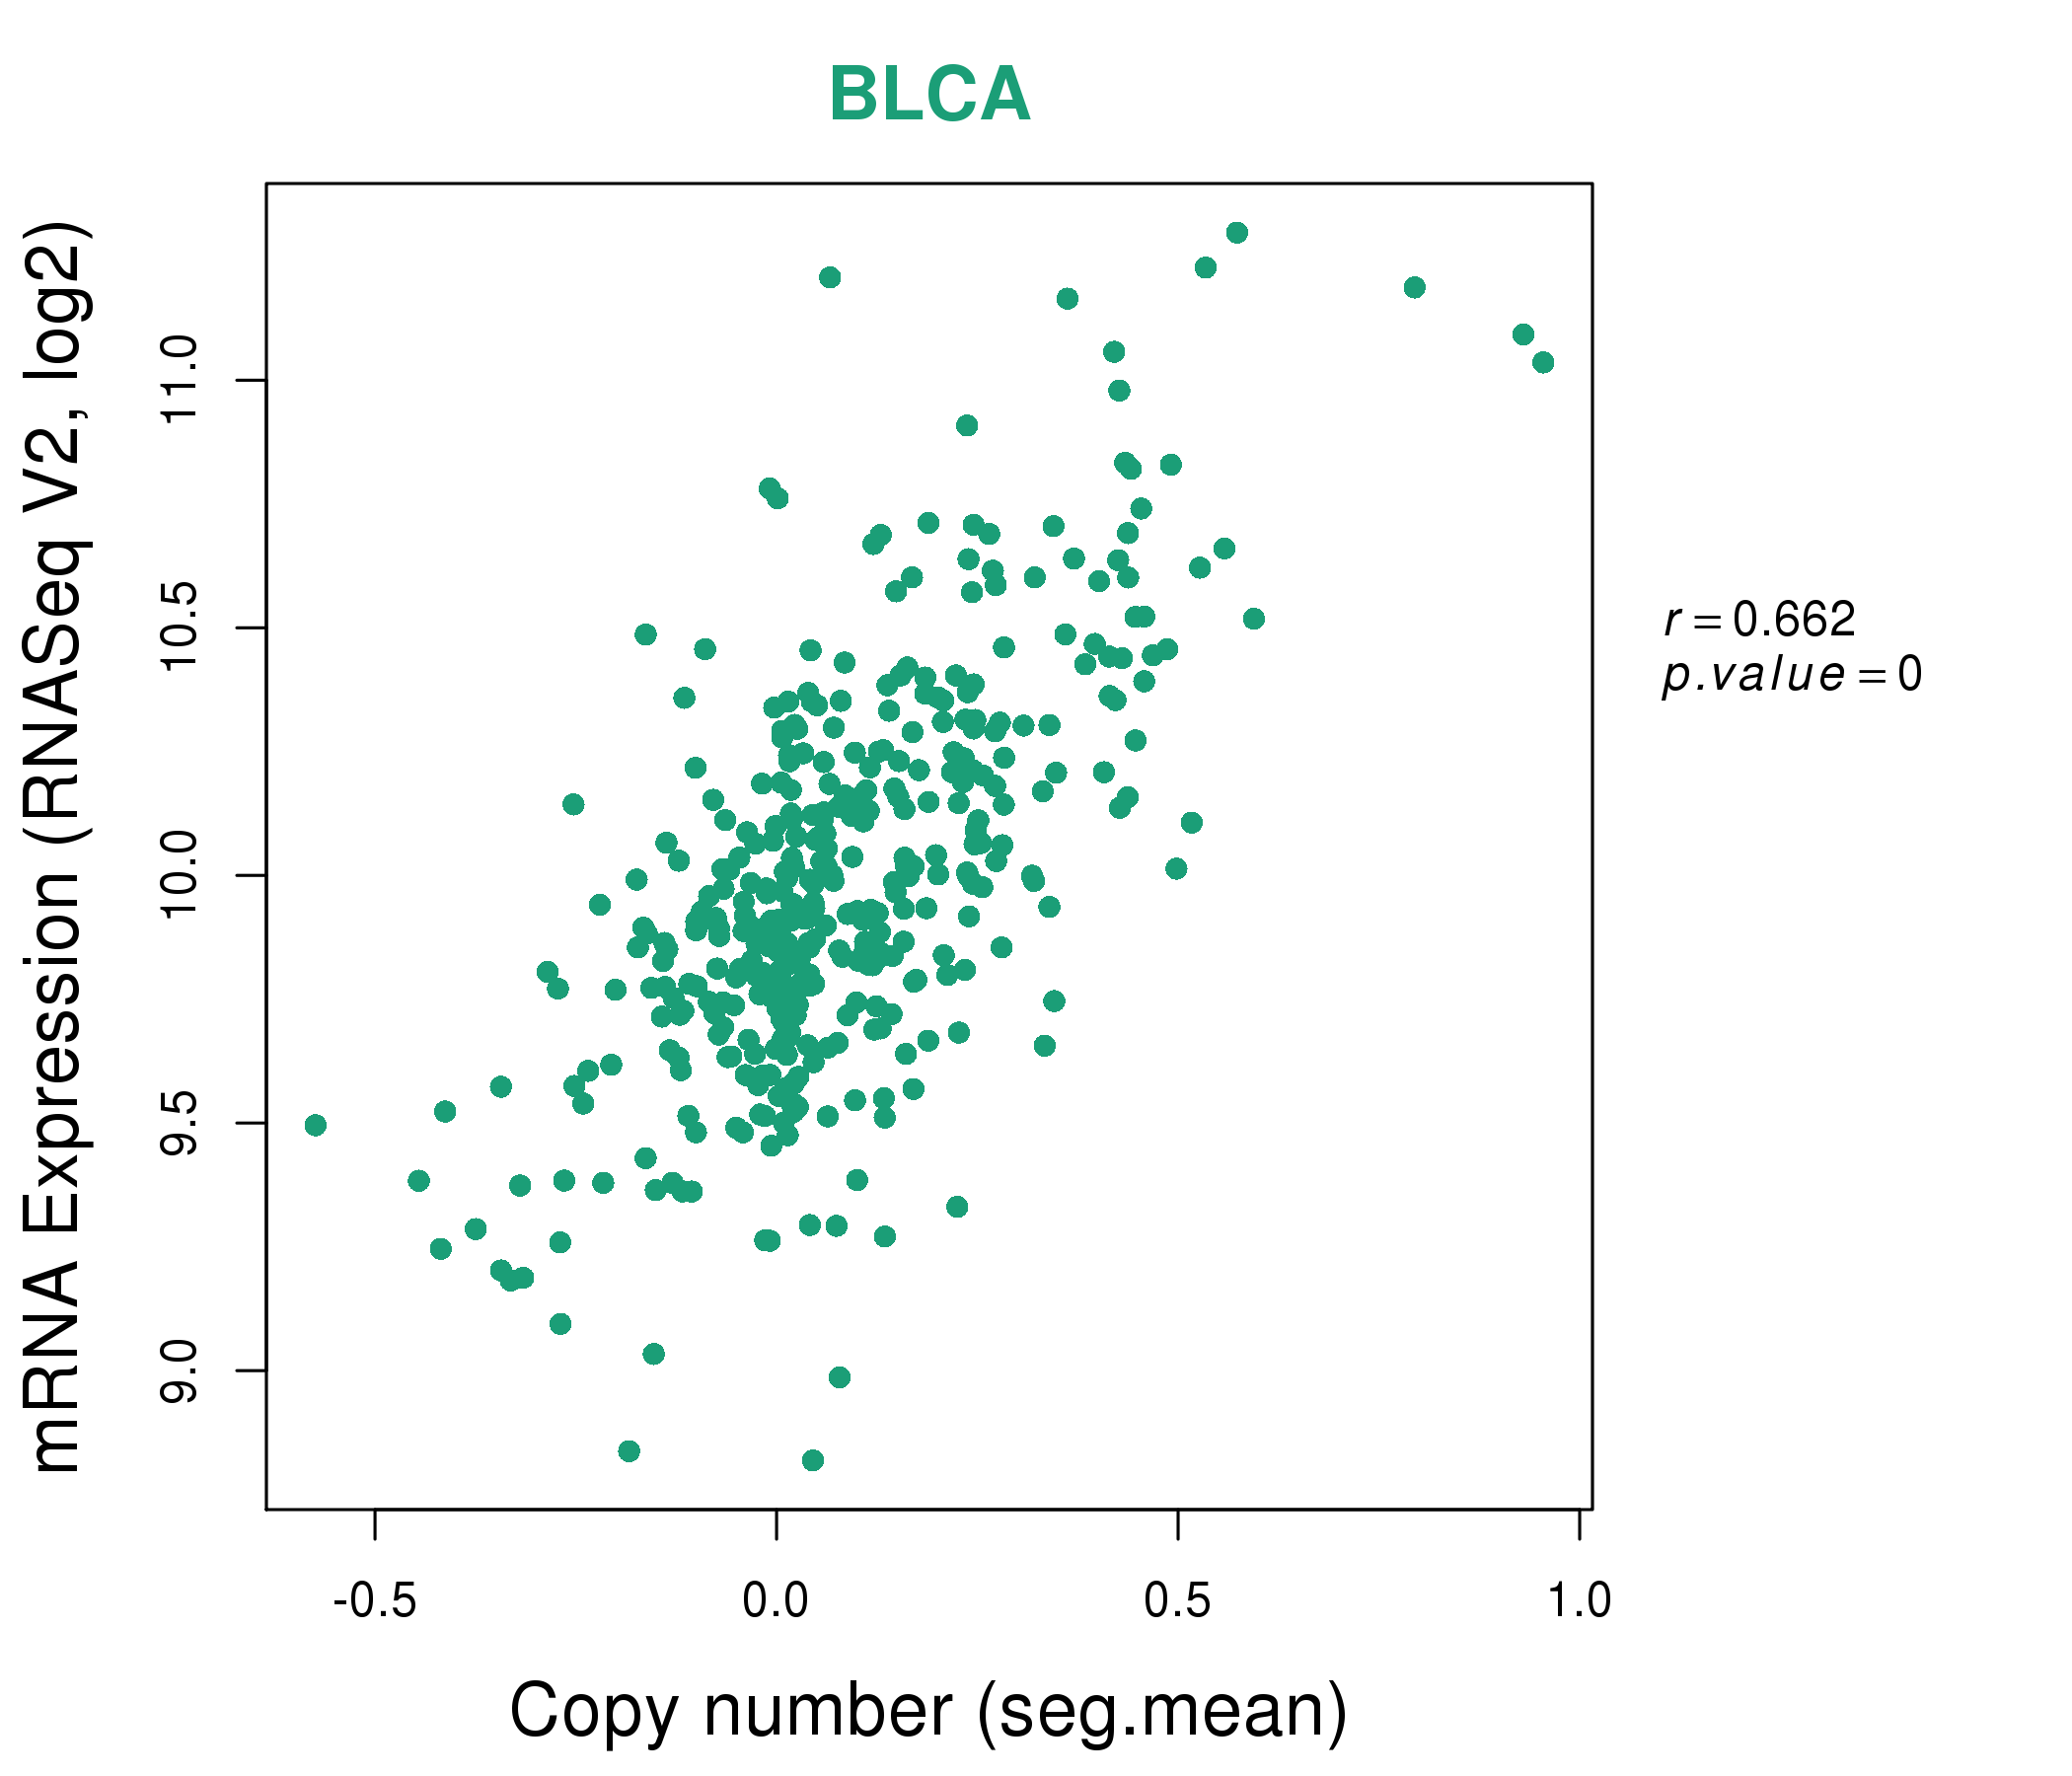
| * This plots show the correlation between CNV and gene expression. |
: Open all plots for all cancer types
 |
|
 |
|
| Top |
| Gene-Gene Network Information |
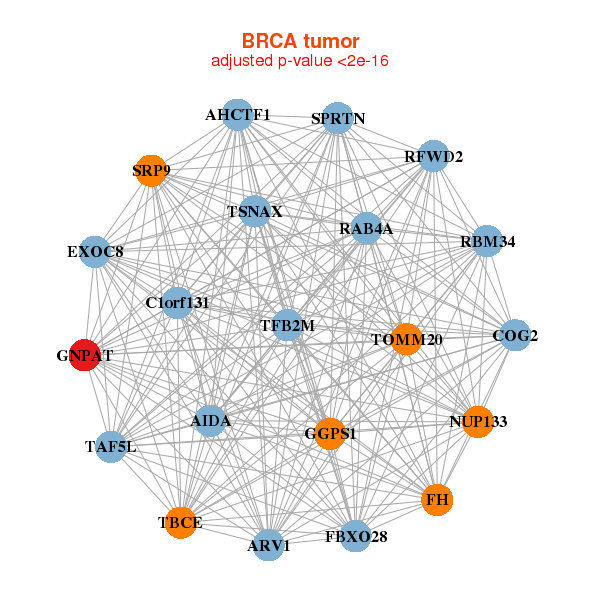
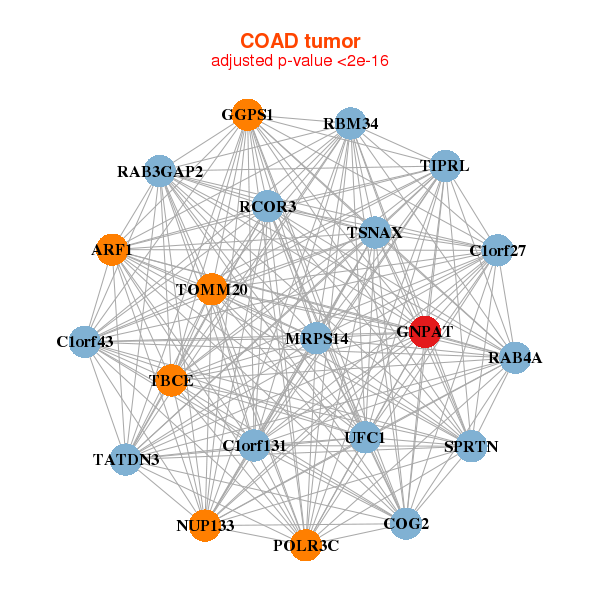
| * Co-Expression network figures were drawn using R package igraph. Only the top 20 genes with the highest correlations were shown. Red circle: input gene, orange circle: cell metabolism gene, sky circle: other gene |
: Open all plots for all cancer types
 |
|
| AHCTF1,AIDA,ARV1,SPRTN,C1orf131,COG2,EXOC8, FBXO28,FH,GGPS1,GNPAT,NUP133,RAB4A,RBM34, RFWD2,SRP9,TAF5L,TBCE,TFB2M,TOMM20,TSNAX | ACAT1,AK3,ATPAF1,TCAIM,CSDE1,DLD,GHITM, GKAP1,GNPAT,HADHB,HOXA10,HSPB6,ISCA1P1,NRD1, PGM1,PHYH,PPP3CB,RRAGD,SETD3,SUCLA2,TBX15 |
 |
|
| ARF1,SPRTN,C1orf131,C1orf27,C1orf43,COG2,GGPS1, GNPAT,MRPS14,NUP133,POLR3C,RAB3GAP2,RAB4A,RBM34, RCOR3,TATDN3,TBCE,TIPRL,TOMM20,TSNAX,UFC1 | ARL3,CAMLG,CBY1,CRYZL1,EIF4A2,ELP2,FAM172A, FAM175A,MTFR1L,GNPAT,H2AFV,HIBADH,ISCU,LZTFL1, MEAF6,MFF,CMC4,POLR1D,RYK,TTC33,ZNF639 |
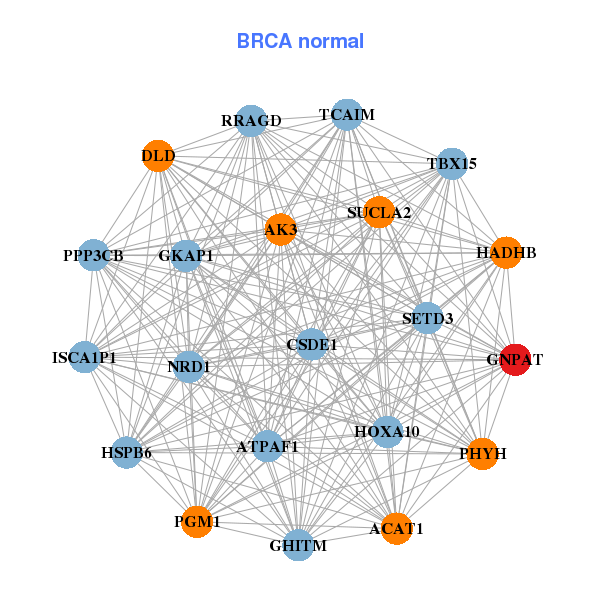
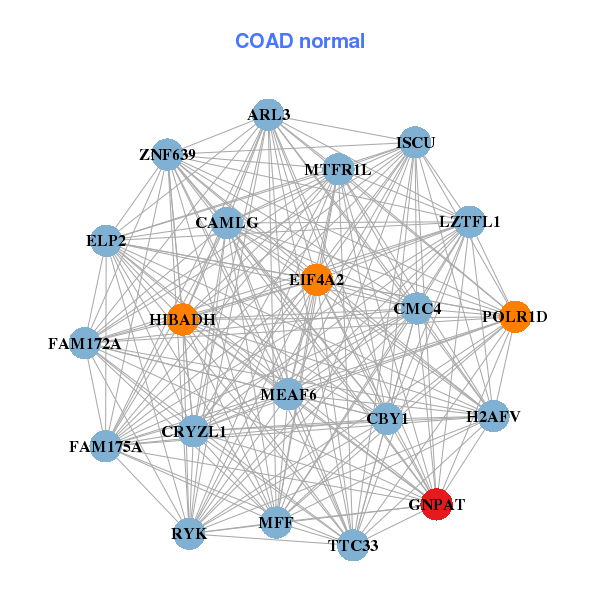
| * Co-Expression network figures were drawn using R package igraph. Only the top 20 genes with the highest correlations were shown. Red circle: input gene, orange circle: cell metabolism gene, sky circle: other gene |
: Open all plots for all cancer types
| Top |
: Open all interacting genes' information including KEGG pathway for all interacting genes from DAVID
| Top |
| Pharmacological Information for GNPAT |
| There's no related Drug. |
| Top |
| Cross referenced IDs for GNPAT |
| * We obtained these cross-references from Uniprot database. It covers 150 different DBs, 18 categories. http://www.uniprot.org/help/cross_references_section |
: Open all cross reference information
|
Copyright © 2016-Present - The Univsersity of Texas Health Science Center at Houston @ |