|
|||||||||||||||||||||||||||||||||||||||||||||||||||||||||||||||||||||||||||||||||||||||||||||||||||||||||||||||||||||||||||||||||||||||||||||||||||||||||||||||||||||||||||||||||||||||||||||||||||||||||||||||||||||||||||||||||||||||||||||||||||||||||||||||||||||||||||||||||||||||||||||||||||||||||||||||||||||||||||||||||||||||||||||||||||
| |
| Phenotypic Information (metabolism pathway, cancer, disease, phenome) |
| |
| |
| Gene-Gene Network Information: Co-Expression Network, Interacting Genes & KEGG |
| |
|


| Gene Summary for ACSS1 |
| Top |
| Phenotypic Information for ACSS1(metabolism pathway, cancer, disease, phenome) |
| Cancer | CGAP: ACSS1 |
| Familial Cancer Database: ACSS1 | |
| * This gene is included in those cancer gene databases. |
|
|
|
|
|
|
| |||||||||||||||||||||||||||||||||||||||||||||||||||||||||||||||||||||||||||||||||||||||||||||||||||||||||||||||||||||||||||||||||||||||||||||||||||||||||||||||||||||||||||||||||||||||||||||||||||||||||||||||||||||||||||||||||||||||||||||||||||||||||||||||||||||||||||||||||||||||||||||||||||||||||||||||||||||||||||||||||||||||||||||
Oncogene 1 | Significant driver gene in | ||||||||||||||||||||||||||||||||||||||||||||||||||||||||||||||||||||||||||||||||||||||||||||||||||||||||||||||||||||||||||||||||||||||||||||||||||||||||||||||||||||||||||||||||||||||||||||||||||||||||||||||||||||||||||||||||||||||||||||||||||||||||||||||||||||||||||||||||||||||||||||||||||||||||||||||||||||||||||||||||||||||||||||||||||
| cf) number; DB name 1 Oncogene; http://nar.oxfordjournals.org/content/35/suppl_1/D721.long, 2 Tumor Suppressor gene; https://bioinfo.uth.edu/TSGene/, 3 Cancer Gene Census; http://www.nature.com/nrc/journal/v4/n3/abs/nrc1299.html, 4 CancerGenes; http://nar.oxfordjournals.org/content/35/suppl_1/D721.long, 5 Network of Cancer Gene; http://ncg.kcl.ac.uk/index.php, 1Therapeutic Vulnerabilities in Cancer; http://cbio.mskcc.org/cancergenomics/statius/ |
| KEGG_GLYCOLYSIS_GLUCONEOGENESIS KEGG_PYRUVATE_METABOLISM KEGG_PROPANOATE_METABOLISM | |
| OMIM | |
| Orphanet | |
| Disease | KEGG Disease: ACSS1 |
| MedGen: ACSS1 (Human Medical Genetics with Condition) | |
| ClinVar: ACSS1 | |
| Phenotype | MGI: ACSS1 (International Mouse Phenotyping Consortium) |
| PhenomicDB: ACSS1 | |
| Mutations for ACSS1 |
| * Under tables are showing count per each tissue to give us broad intuition about tissue specific mutation patterns.You can go to the detailed page for each mutation database's web site. |
| There's no structural variation information in COSMIC data for this gene. |
| * From mRNA Sanger sequences, Chitars2.0 arranged chimeric transcripts. This table shows ACSS1 related fusion information. |
| ID | Head Gene | Tail Gene | Accession | Gene_a | qStart_a | qEnd_a | Chromosome_a | tStart_a | tEnd_a | Gene_a | qStart_a | qEnd_a | Chromosome_a | tStart_a | tEnd_a |
| BG951421 | ACSS1 | 4 | 220 | 20 | 24987624 | 24987843 | SPTLC1 | 202 | 439 | 9 | 94794795 | 94800648 | |
| BF790853 | ACSS1 | 1 | 102 | 20 | 24987732 | 24987837 | ZNF131 | 94 | 652 | 5 | 43175422 | 43175989 | |
| Top |
| Mutation type/ Tissue ID | brca | cns | cerv | endome | haematopo | kidn | Lintest | liver | lung | ns | ovary | pancre | prost | skin | stoma | thyro | urina | |||
| Total # sample | 1 | 1 | 1 | |||||||||||||||||
| GAIN (# sample) | 1 | 1 | ||||||||||||||||||
| LOSS (# sample) | 1 |
| cf) Tissue ID; Tissue type (1; Breast, 2; Central_nervous_system, 3; Cervix, 4; Endometrium, 5; Haematopoietic_and_lymphoid_tissue, 6; Kidney, 7; Large_intestine, 8; Liver, 9; Lung, 10; NS, 11; Ovary, 12; Pancreas, 13; Prostate, 14; Skin, 15; Stomach, 16; Thyroid, 17; Urinary_tract) |
| Top |
|
 |
| Top |
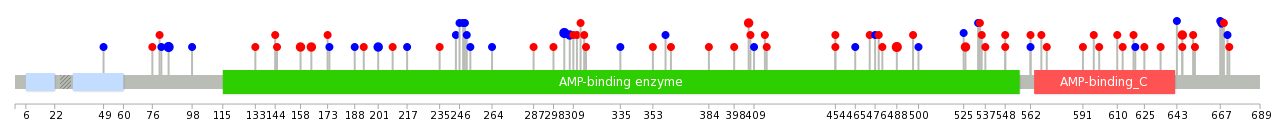
| Stat. for Non-Synonymous SNVs (# total SNVs=36) | (# total SNVs=17) |
 |  |
(# total SNVs=0) | (# total SNVs=0) |
| Top |
| * When you move the cursor on each content, you can see more deailed mutation information on the Tooltip. Those are primary_site,primary_histology,mutation(aa),pubmedID. |
| GRCh37 position | Mutation(aa) | Unique sampleID count |
| chr20:25003624-25003624 | p.I304I | 3 |
| chr20:25038484-25038484 | p.T85T | 3 |
| chr20:24994289-24994289 | p.V488M | 3 |
| chr20:25003615-25003615 | p.T307T | 2 |
| chr20:25011552-25011552 | p.K158N | 2 |
| chr20:24988532-24988532 | p.R646W | 2 |
| chr20:24994175-24994175 | p.P526T | 2 |
| chr20:25011423-25011423 | p.A201A | 2 |
| chr20:24988464-24988464 | p.P668P | 2 |
| chr20:25000676-25000676 | p.D406H | 2 |
| Top |
|
 |
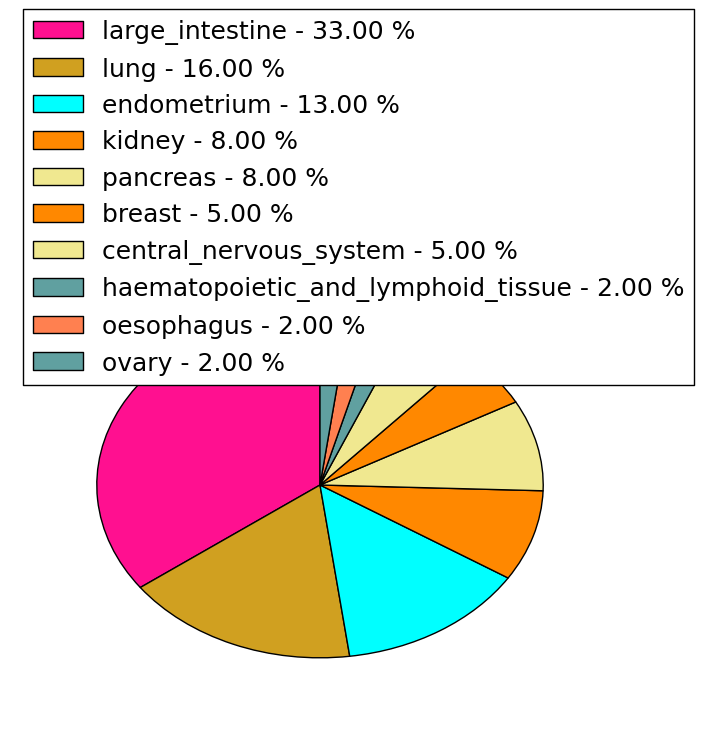
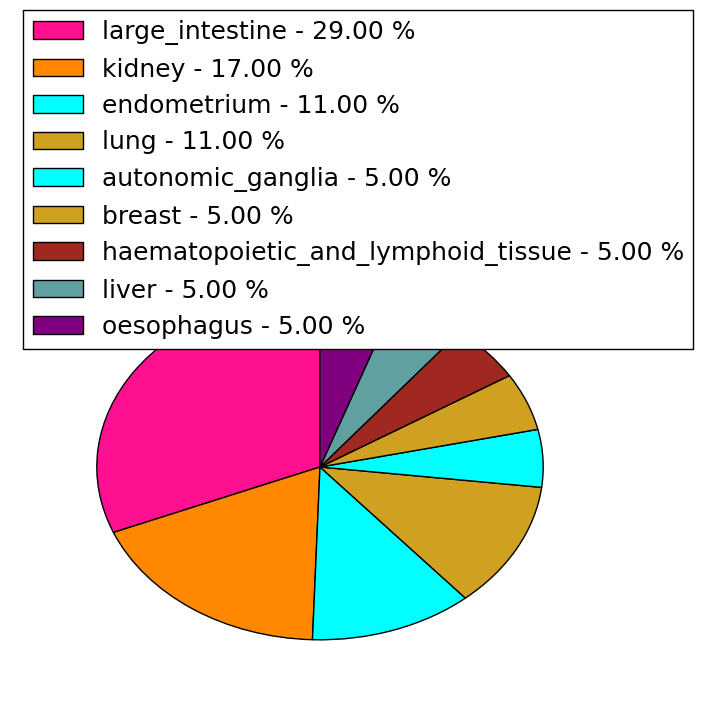
| Point Mutation/ Tissue ID | 1 | 2 | 3 | 4 | 5 | 6 | 7 | 8 | 9 | 10 | 11 | 12 | 13 | 14 | 15 | 16 | 17 | 18 | 19 | 20 |
| # sample | 1 | 1 | 7 | 5 | 6 | 5 | 6 | 1 | 1 | 6 | 13 | 7 | ||||||||
| # mutation | 1 | 1 | 7 | 5 | 5 | 6 | 6 | 1 | 1 | 6 | 14 | 7 | ||||||||
| nonsynonymous SNV | 5 | 3 | 3 | 3 | 4 | 1 | 1 | 1 | 8 | 5 | ||||||||||
| synonymous SNV | 1 | 1 | 2 | 2 | 2 | 3 | 2 | 5 | 6 | 2 |
| cf) Tissue ID; Tissue type (1; BLCA[Bladder Urothelial Carcinoma], 2; BRCA[Breast invasive carcinoma], 3; CESC[Cervical squamous cell carcinoma and endocervical adenocarcinoma], 4; COAD[Colon adenocarcinoma], 5; GBM[Glioblastoma multiforme], 6; Glioma Low Grade, 7; HNSC[Head and Neck squamous cell carcinoma], 8; KICH[Kidney Chromophobe], 9; KIRC[Kidney renal clear cell carcinoma], 10; KIRP[Kidney renal papillary cell carcinoma], 11; LAML[Acute Myeloid Leukemia], 12; LUAD[Lung adenocarcinoma], 13; LUSC[Lung squamous cell carcinoma], 14; OV[Ovarian serous cystadenocarcinoma ], 15; PAAD[Pancreatic adenocarcinoma], 16; PRAD[Prostate adenocarcinoma], 17; SKCM[Skin Cutaneous Melanoma], 18:STAD[Stomach adenocarcinoma], 19:THCA[Thyroid carcinoma], 20:UCEC[Uterine Corpus Endometrial Carcinoma]) |
| Top |
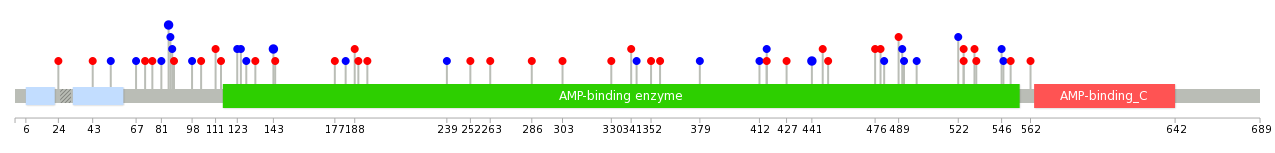
| * We represented just top 10 SNVs. When you move the cursor on each content, you can see more deailed mutation information on the Tooltip. Those are primary_site, primary_histology, mutation(aa), pubmedID. |
| Genomic Position | Mutation(aa) | Unique sampleID count |
| chr20:25004117 | p.T85T,ACSS1 | 2 |
| chr20:24993469 | p.T441T,ACSS1 | 2 |
| chr20:25038484 | p.D143D,ACSS1 | 2 |
| chr20:24994697 | p.L128L,ACSS1 | 1 |
| chr20:24988532 | p.P86P,ACSS1 | 1 |
| chr20:25011536 | p.V522V,ACSS1 | 1 |
| chr20:24995843 | p.P357S,ACSS1 | 1 |
| chr20:25004162 | p.F352L,ACSS1 | 1 |
| chr20:24988539 | p.Q125Q,ACSS1 | 1 |
| chr20:25011592 | p.I499I,ACSS1 | 1 |
| * Copy number data were extracted from TCGA using R package TCGA-Assembler. The URLs of all public data files on TCGA DCC data server were gathered on Jan-05-2015. Function ProcessCNAData in TCGA-Assembler package was used to obtain gene-level copy number value which is calculated as the average copy number of the genomic region of a gene. |
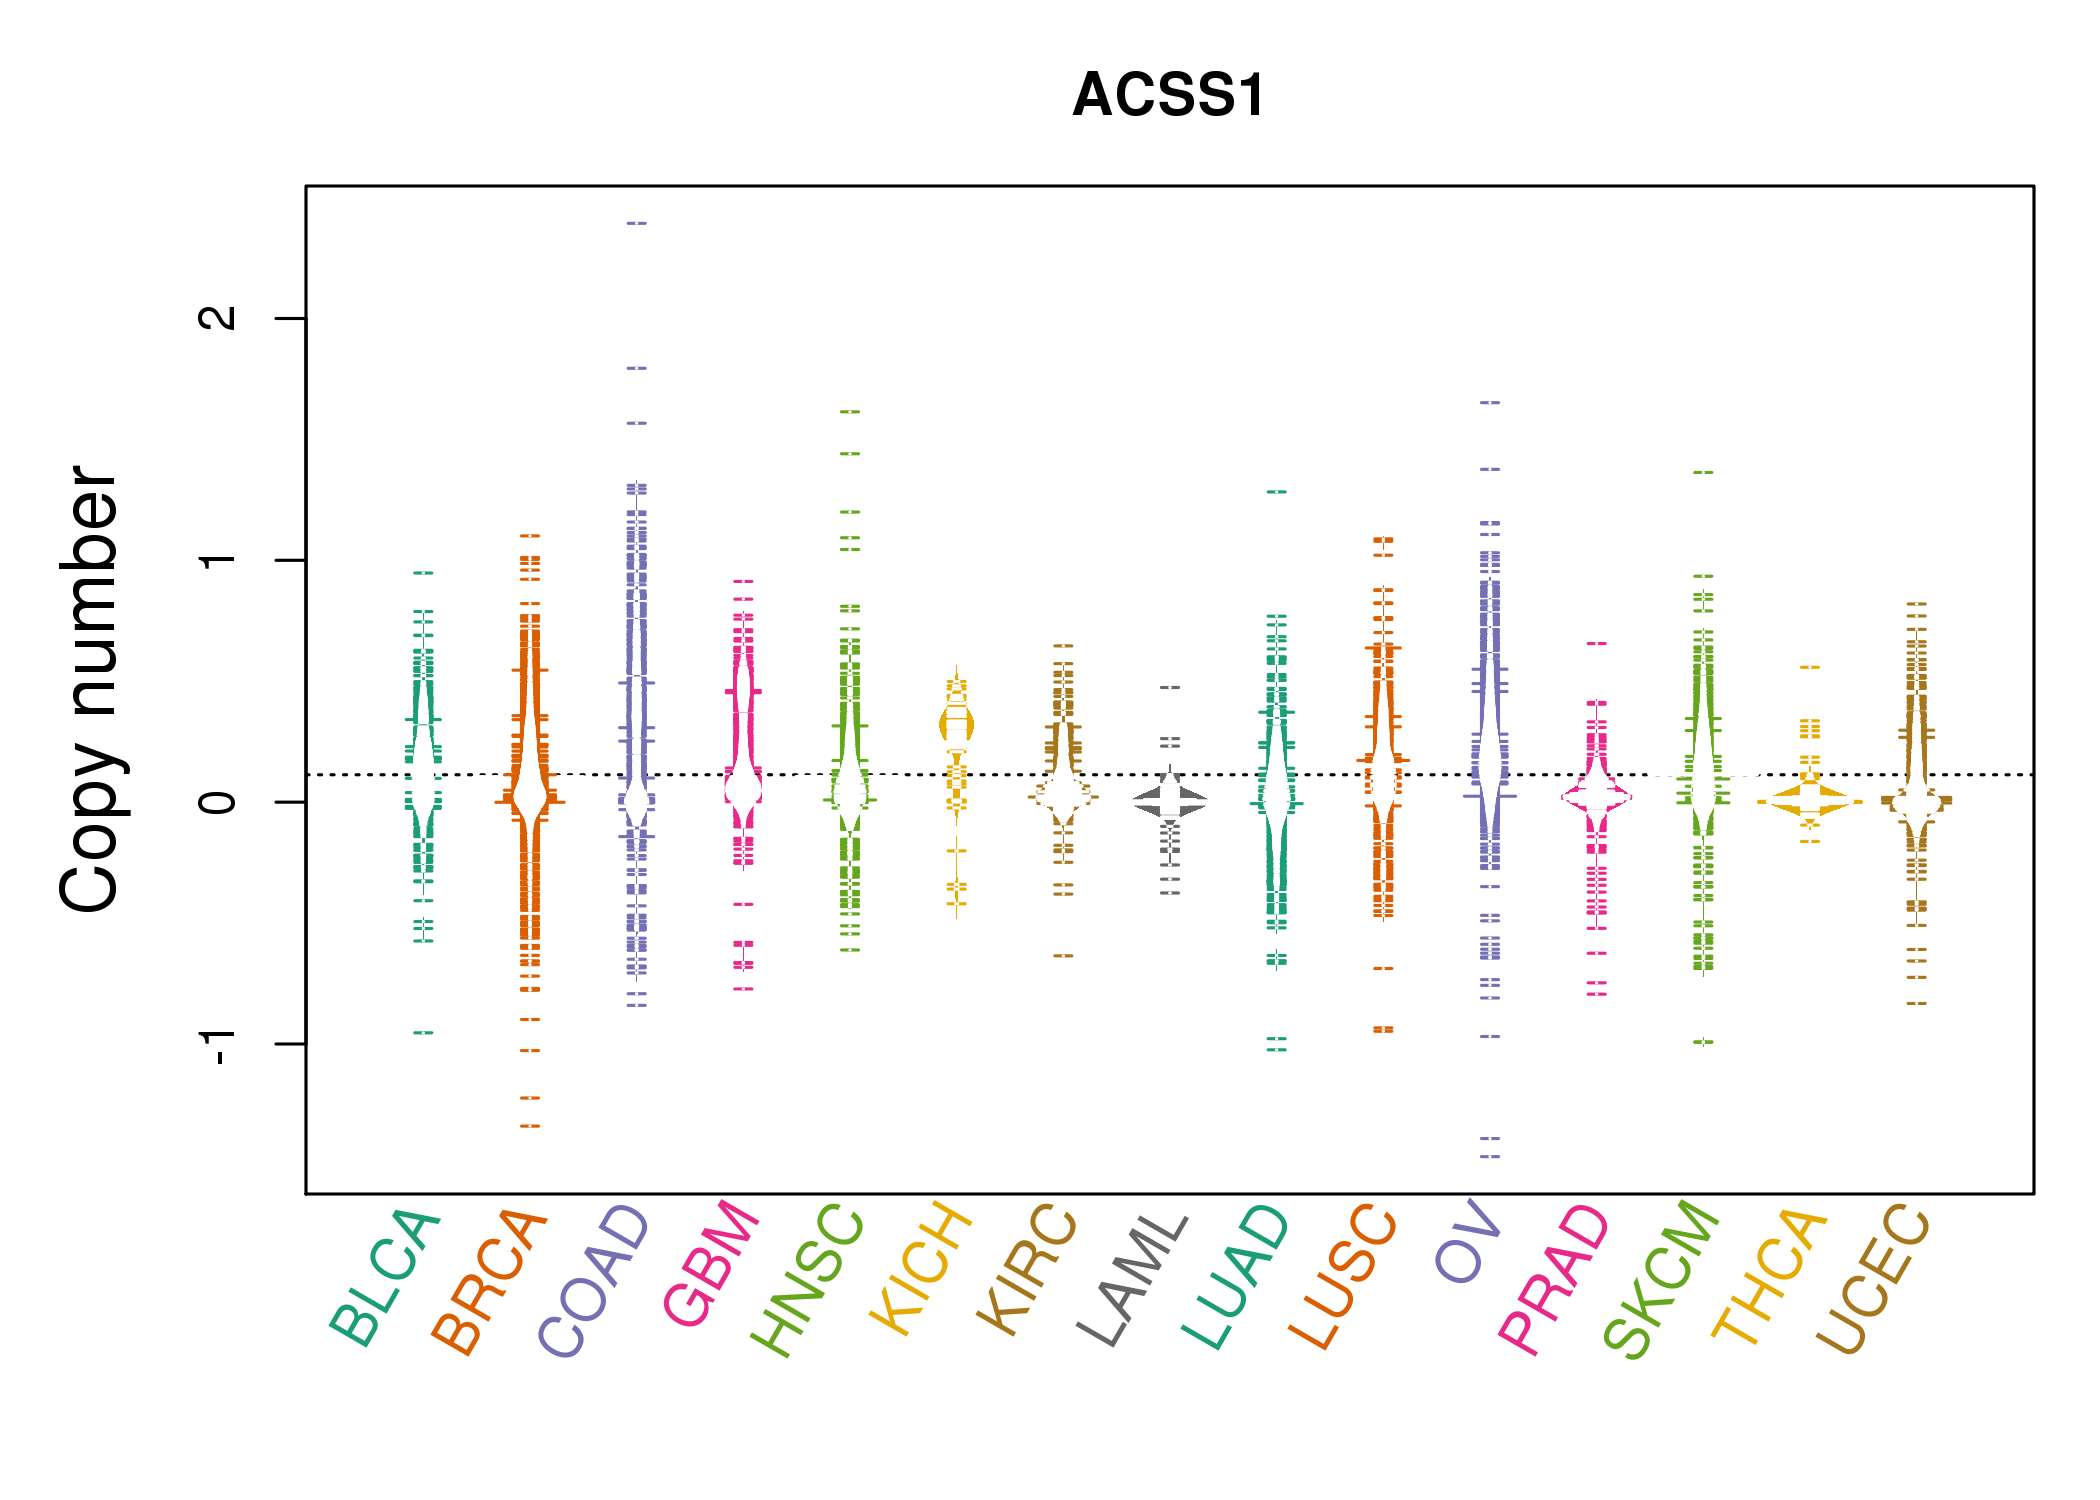 |
| cf) Tissue ID[Tissue type]: BLCA[Bladder Urothelial Carcinoma], BRCA[Breast invasive carcinoma], CESC[Cervical squamous cell carcinoma and endocervical adenocarcinoma], COAD[Colon adenocarcinoma], GBM[Glioblastoma multiforme], Glioma Low Grade, HNSC[Head and Neck squamous cell carcinoma], KICH[Kidney Chromophobe], KIRC[Kidney renal clear cell carcinoma], KIRP[Kidney renal papillary cell carcinoma], LAML[Acute Myeloid Leukemia], LUAD[Lung adenocarcinoma], LUSC[Lung squamous cell carcinoma], OV[Ovarian serous cystadenocarcinoma ], PAAD[Pancreatic adenocarcinoma], PRAD[Prostate adenocarcinoma], SKCM[Skin Cutaneous Melanoma], STAD[Stomach adenocarcinoma], THCA[Thyroid carcinoma], UCEC[Uterine Corpus Endometrial Carcinoma] |
| Top |
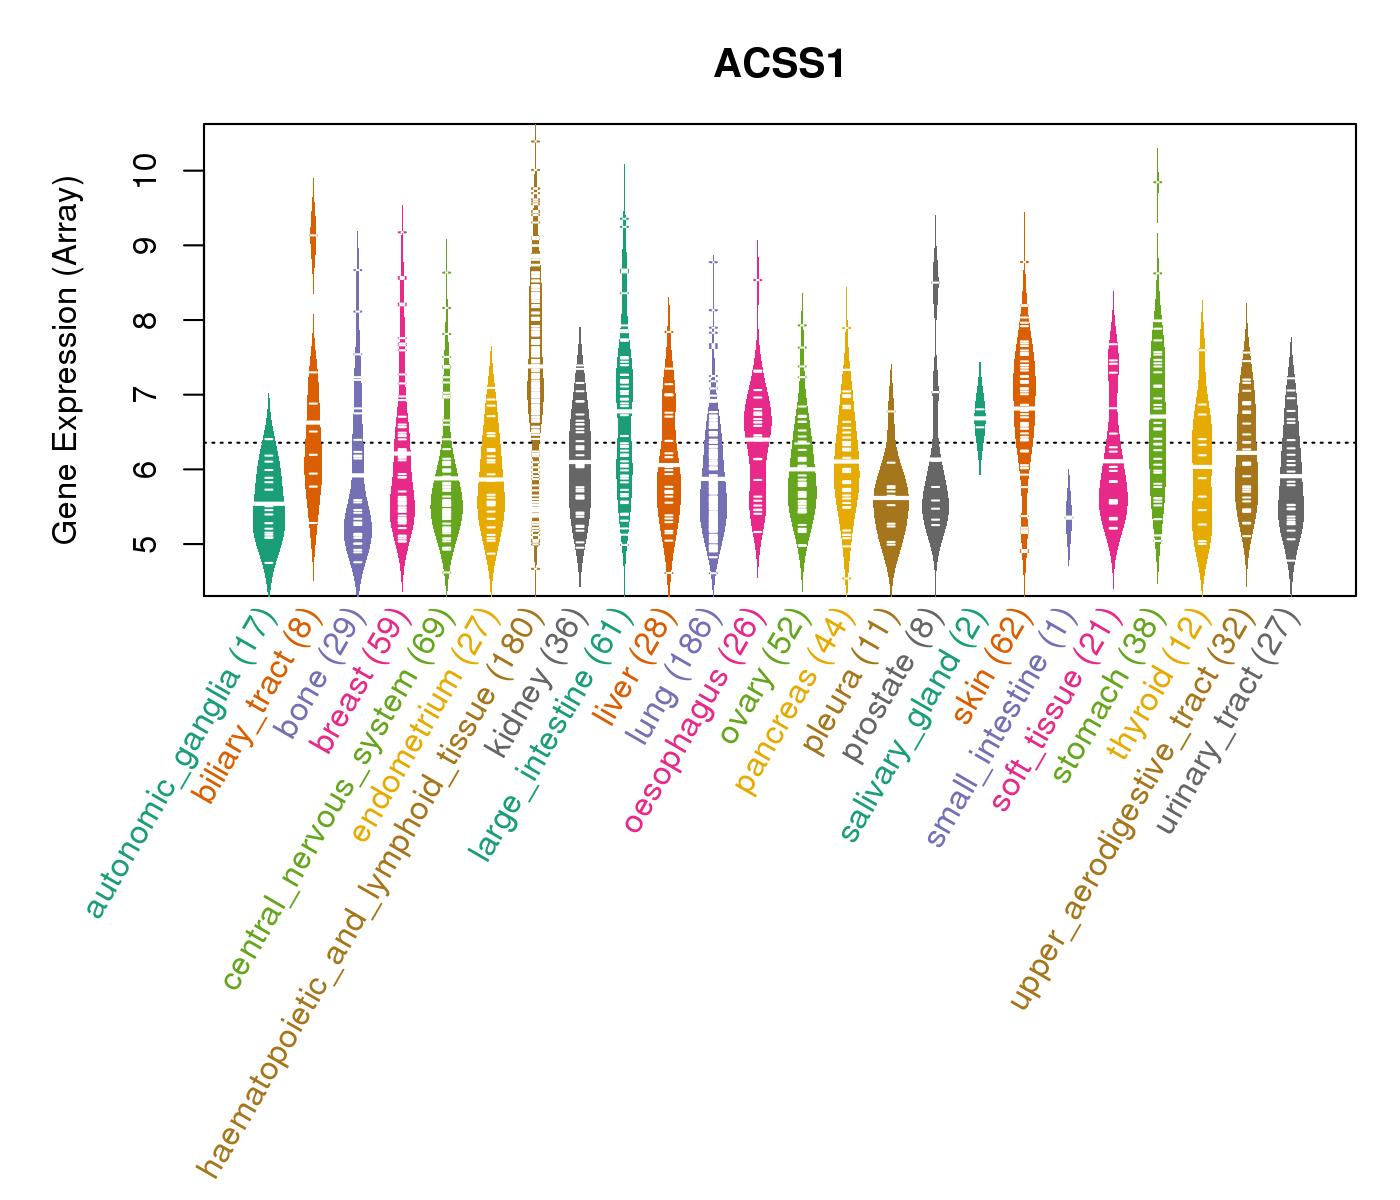
| Gene Expression for ACSS1 |
| * CCLE gene expression data were extracted from CCLE_Expression_Entrez_2012-10-18.res: Gene-centric RMA-normalized mRNA expression data. |
 |
| * Normalized gene expression data of RNASeqV2 was extracted from TCGA using R package TCGA-Assembler. The URLs of all public data files on TCGA DCC data server were gathered at Jan-05-2015. Only eight cancer types have enough normal control samples for differential expression analysis. (t test, adjusted p<0.05 (using Benjamini-Hochberg FDR)) |
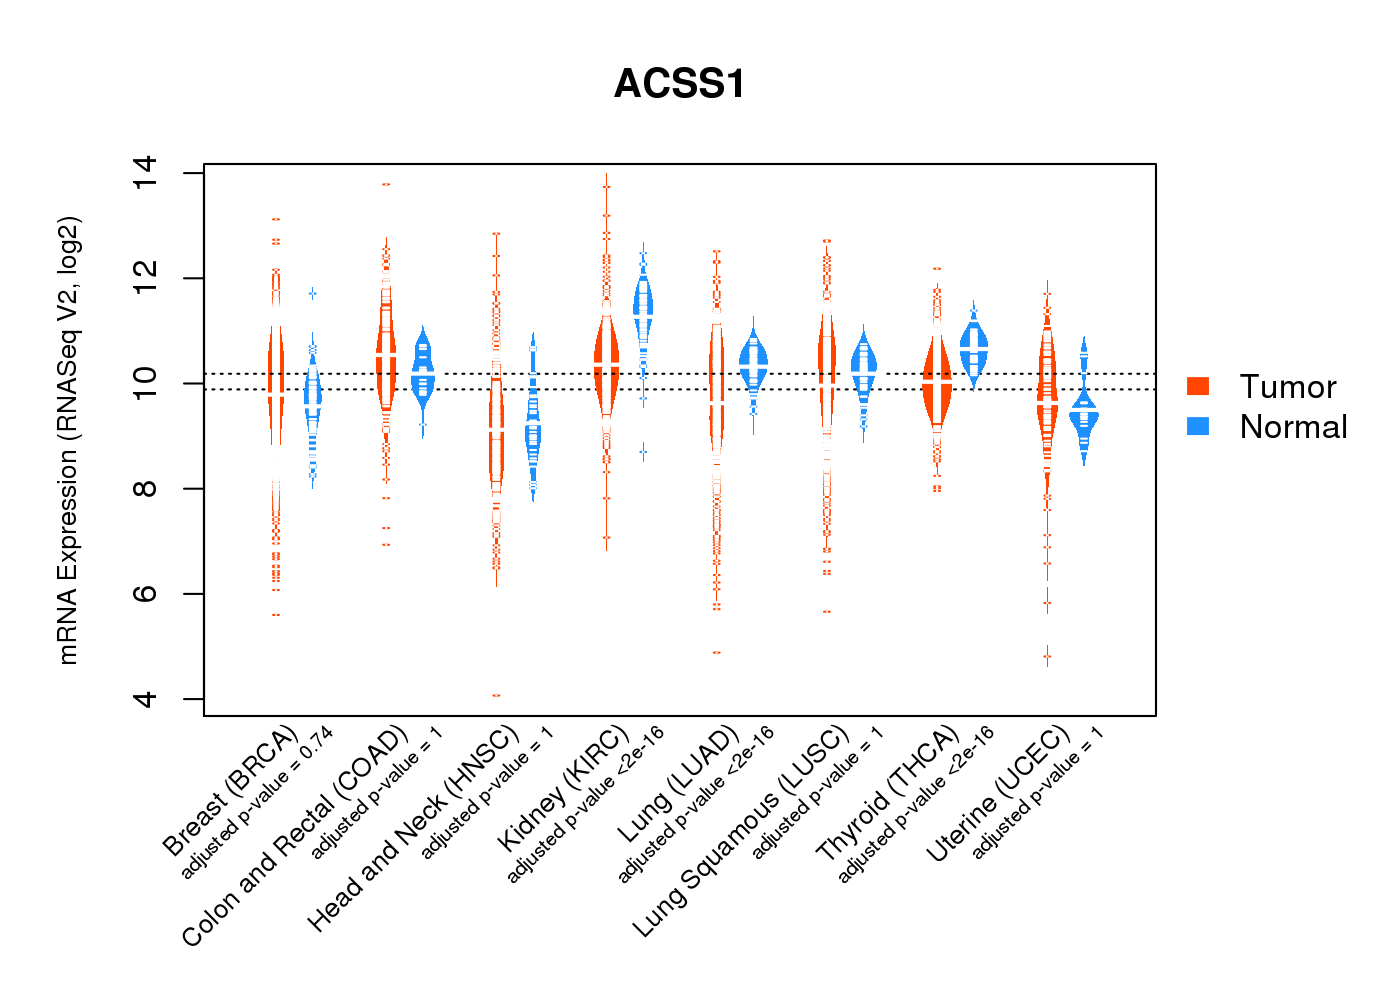 |
| Top |
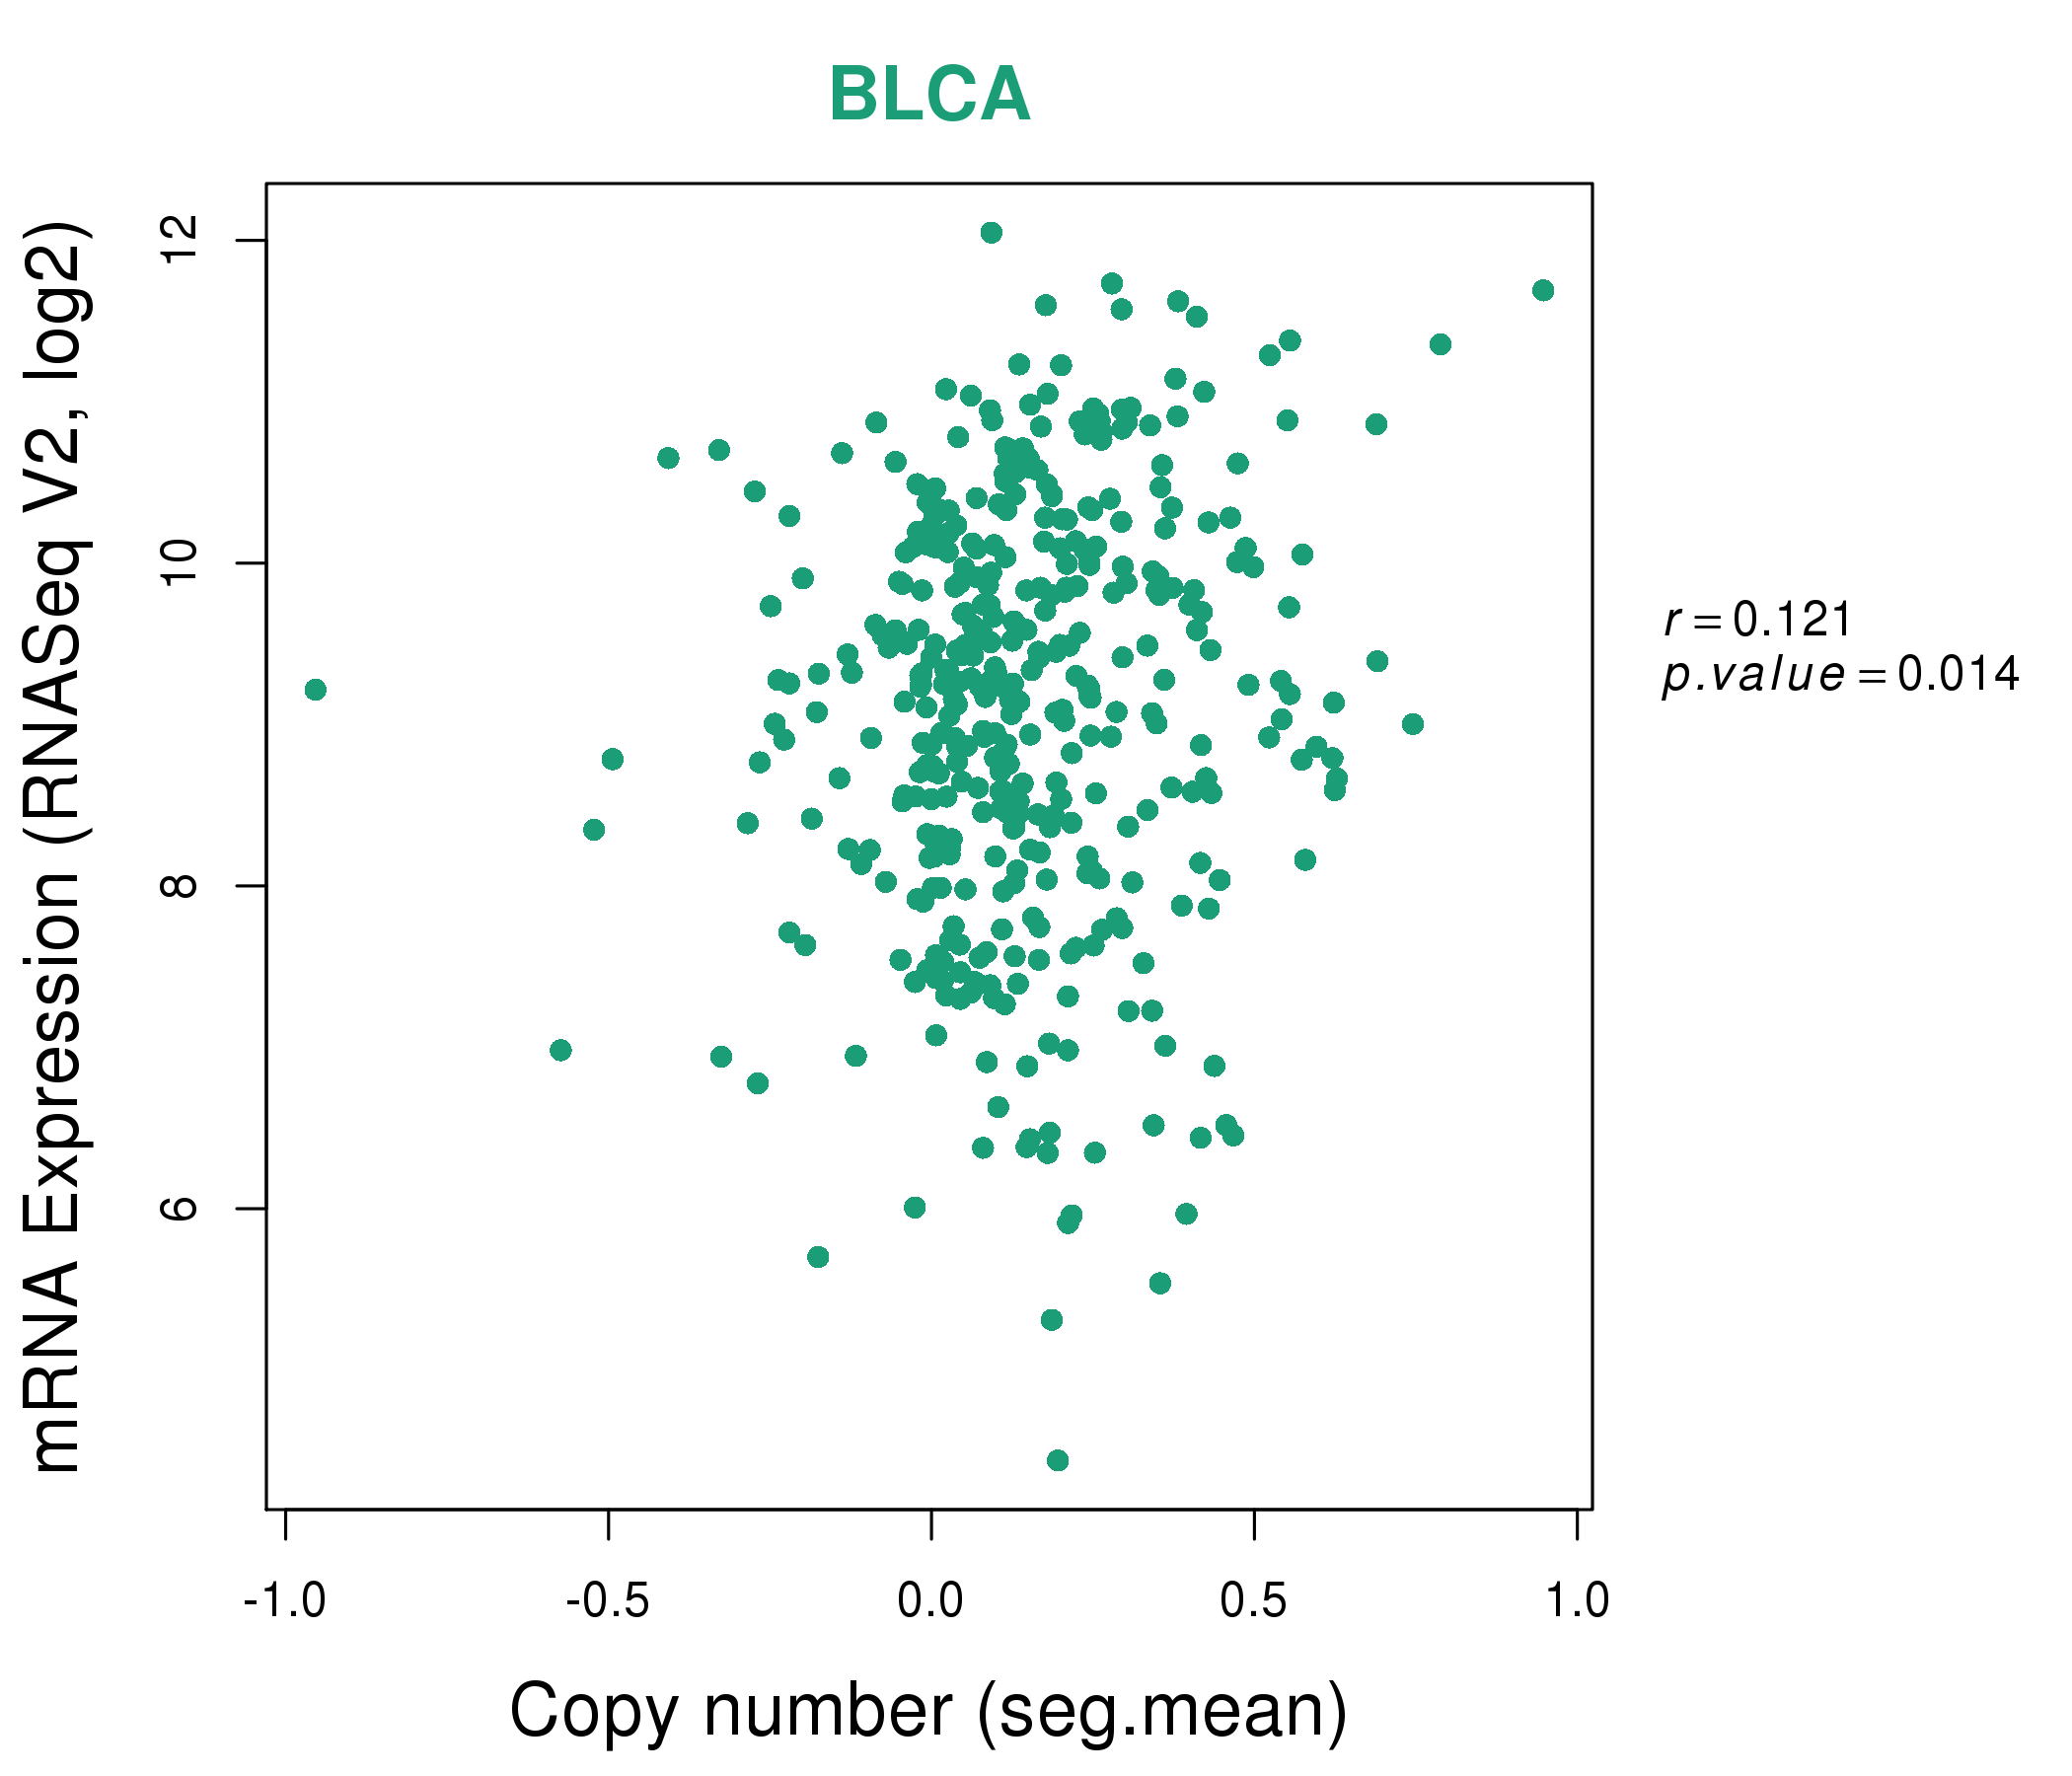
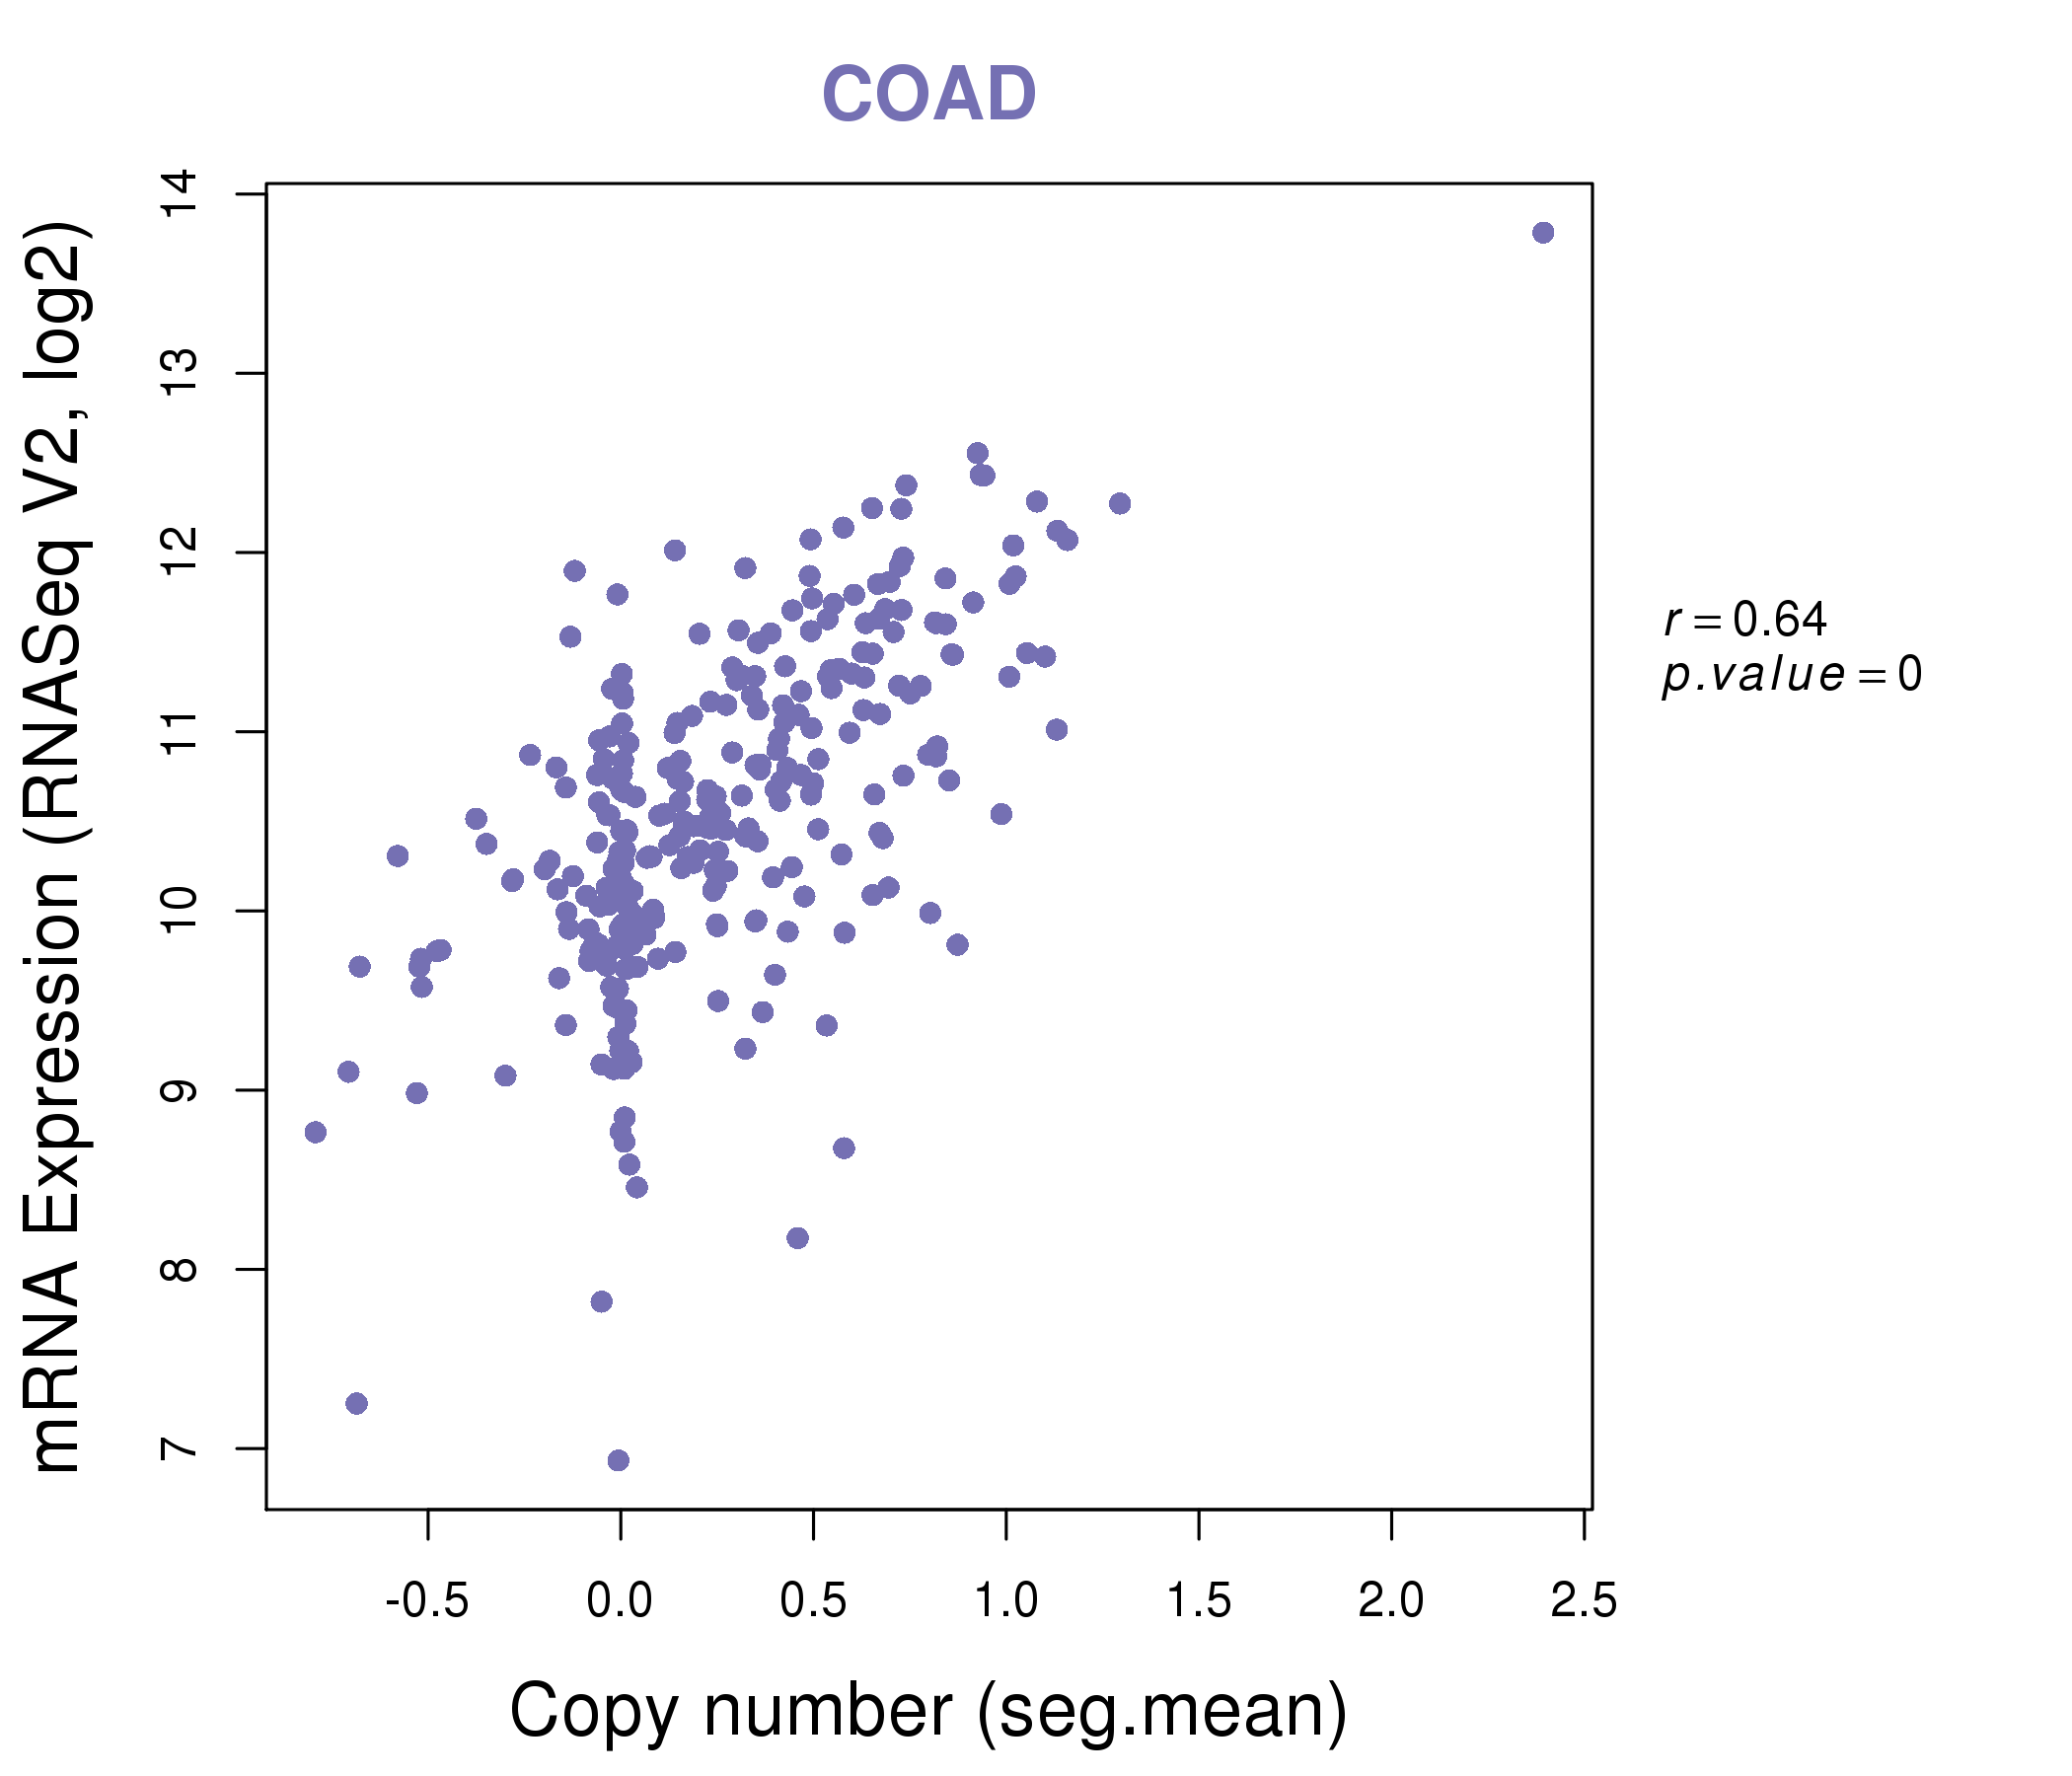
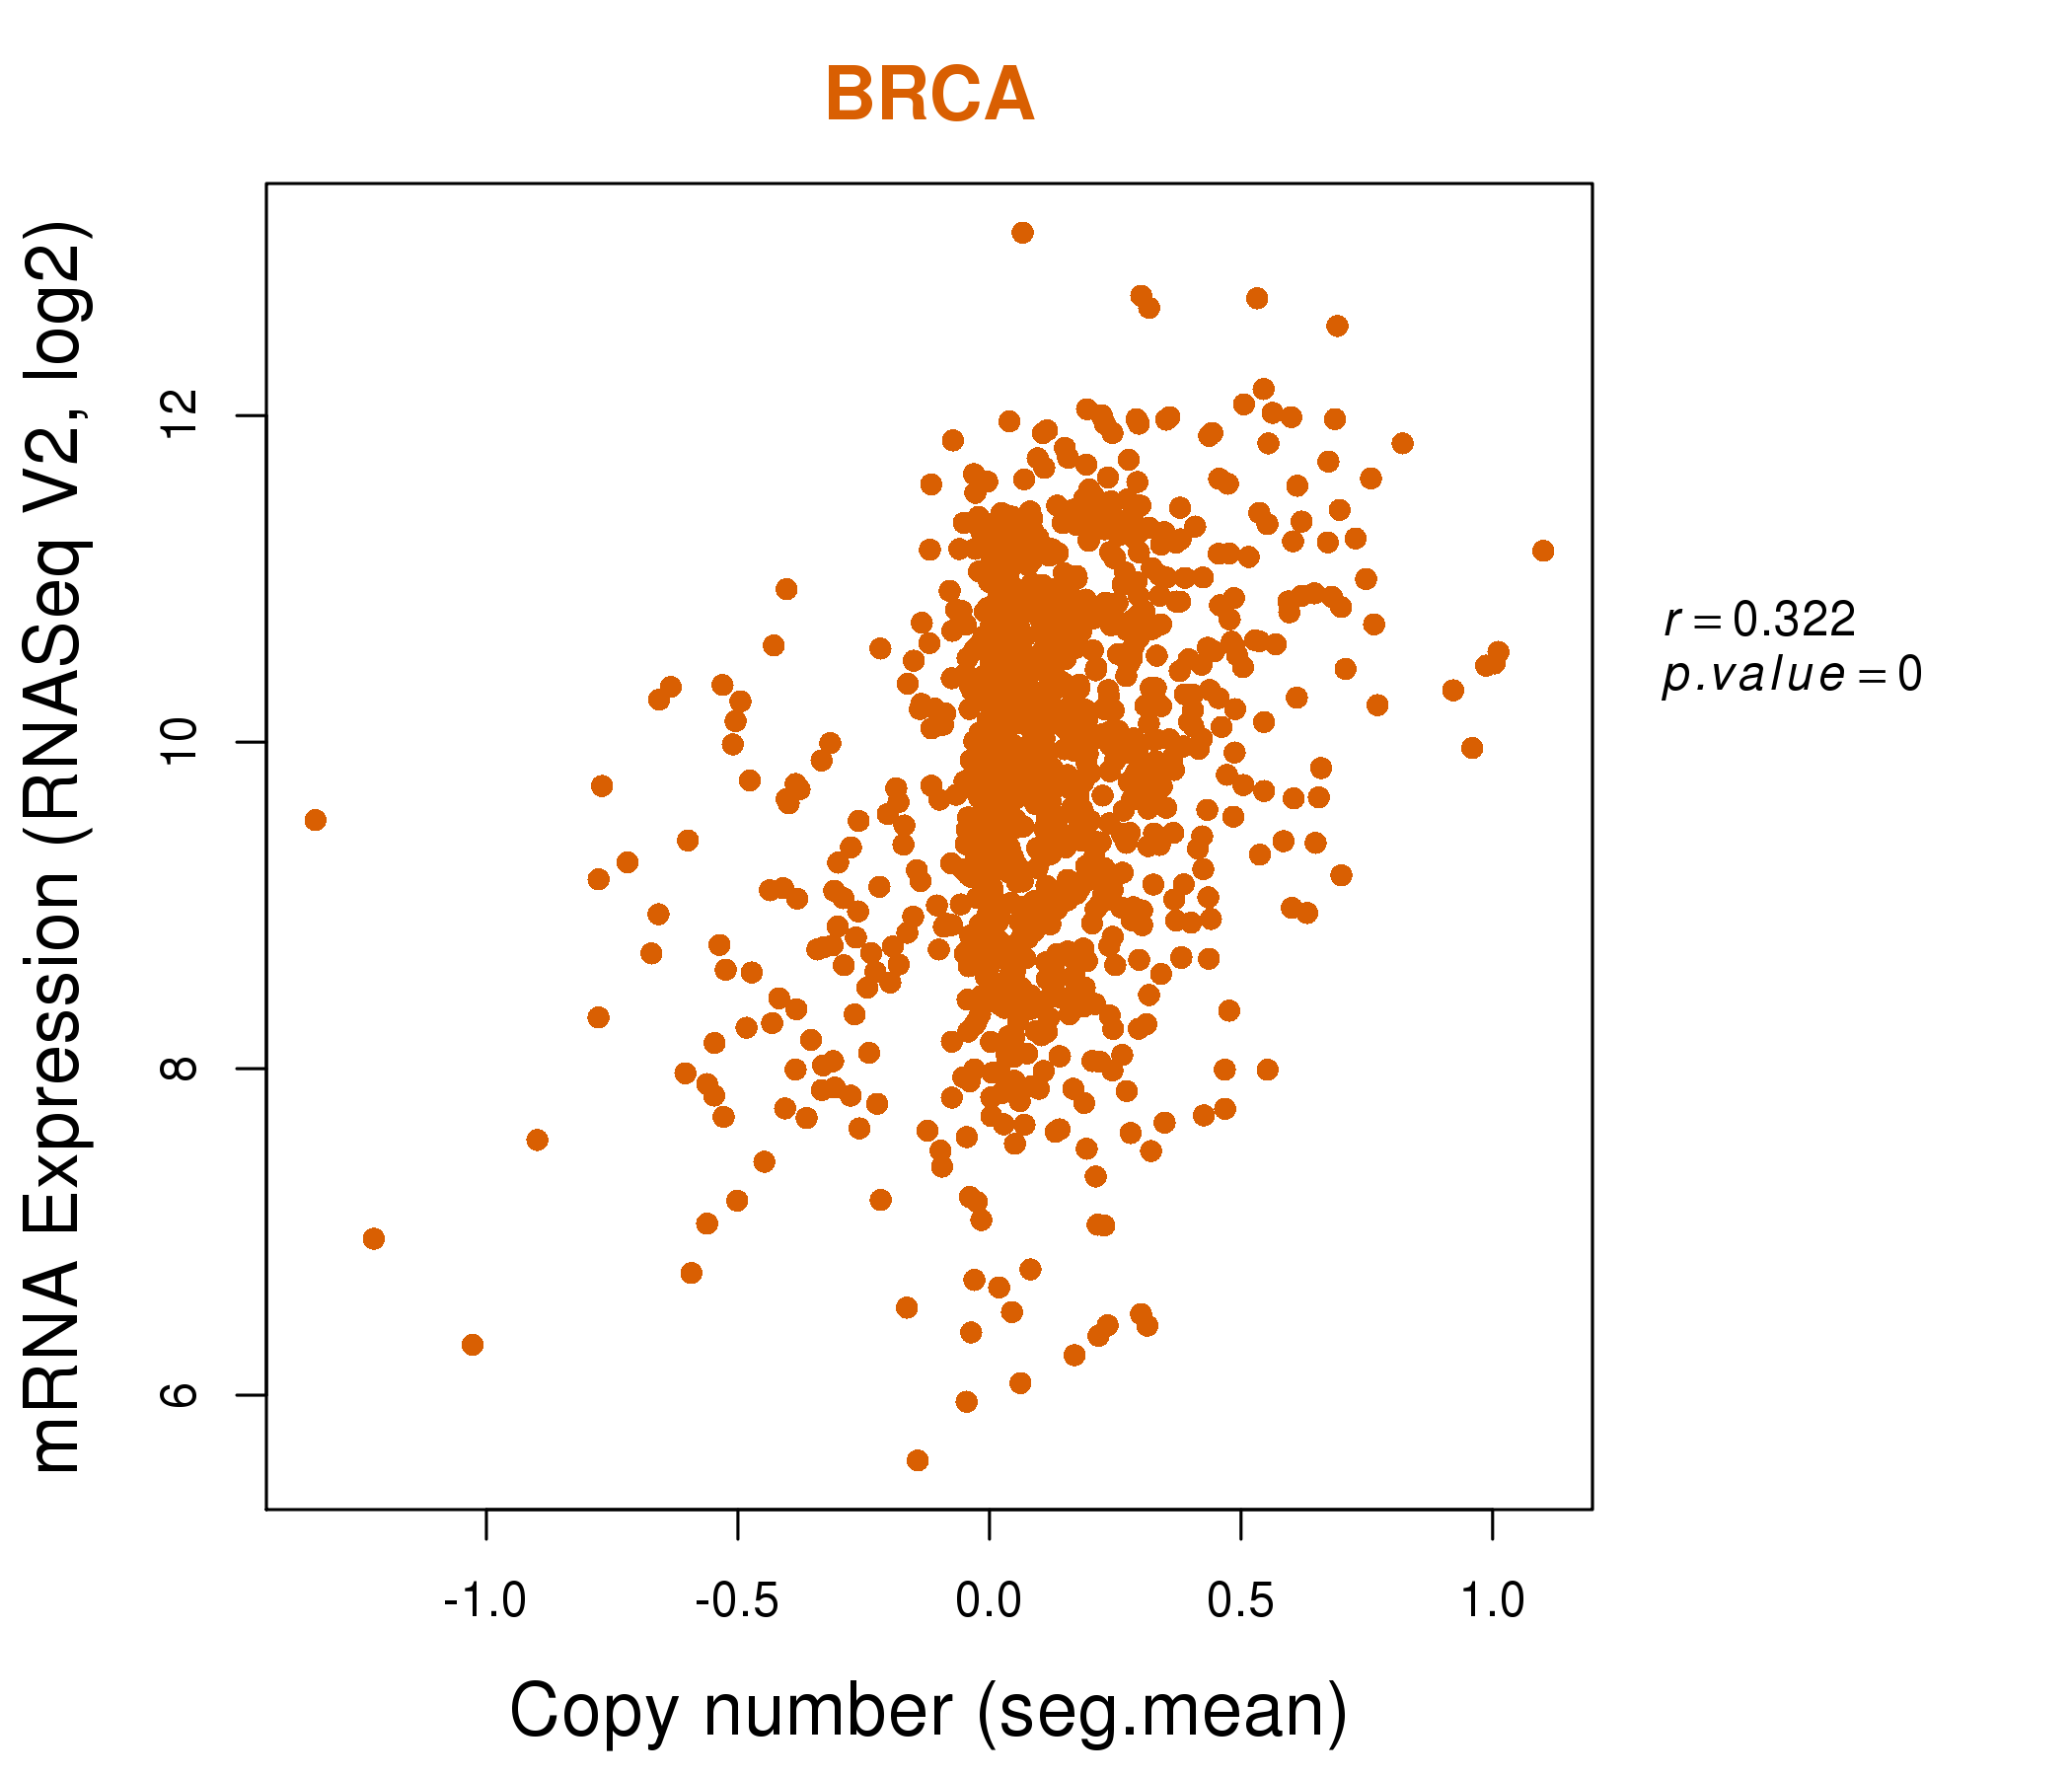
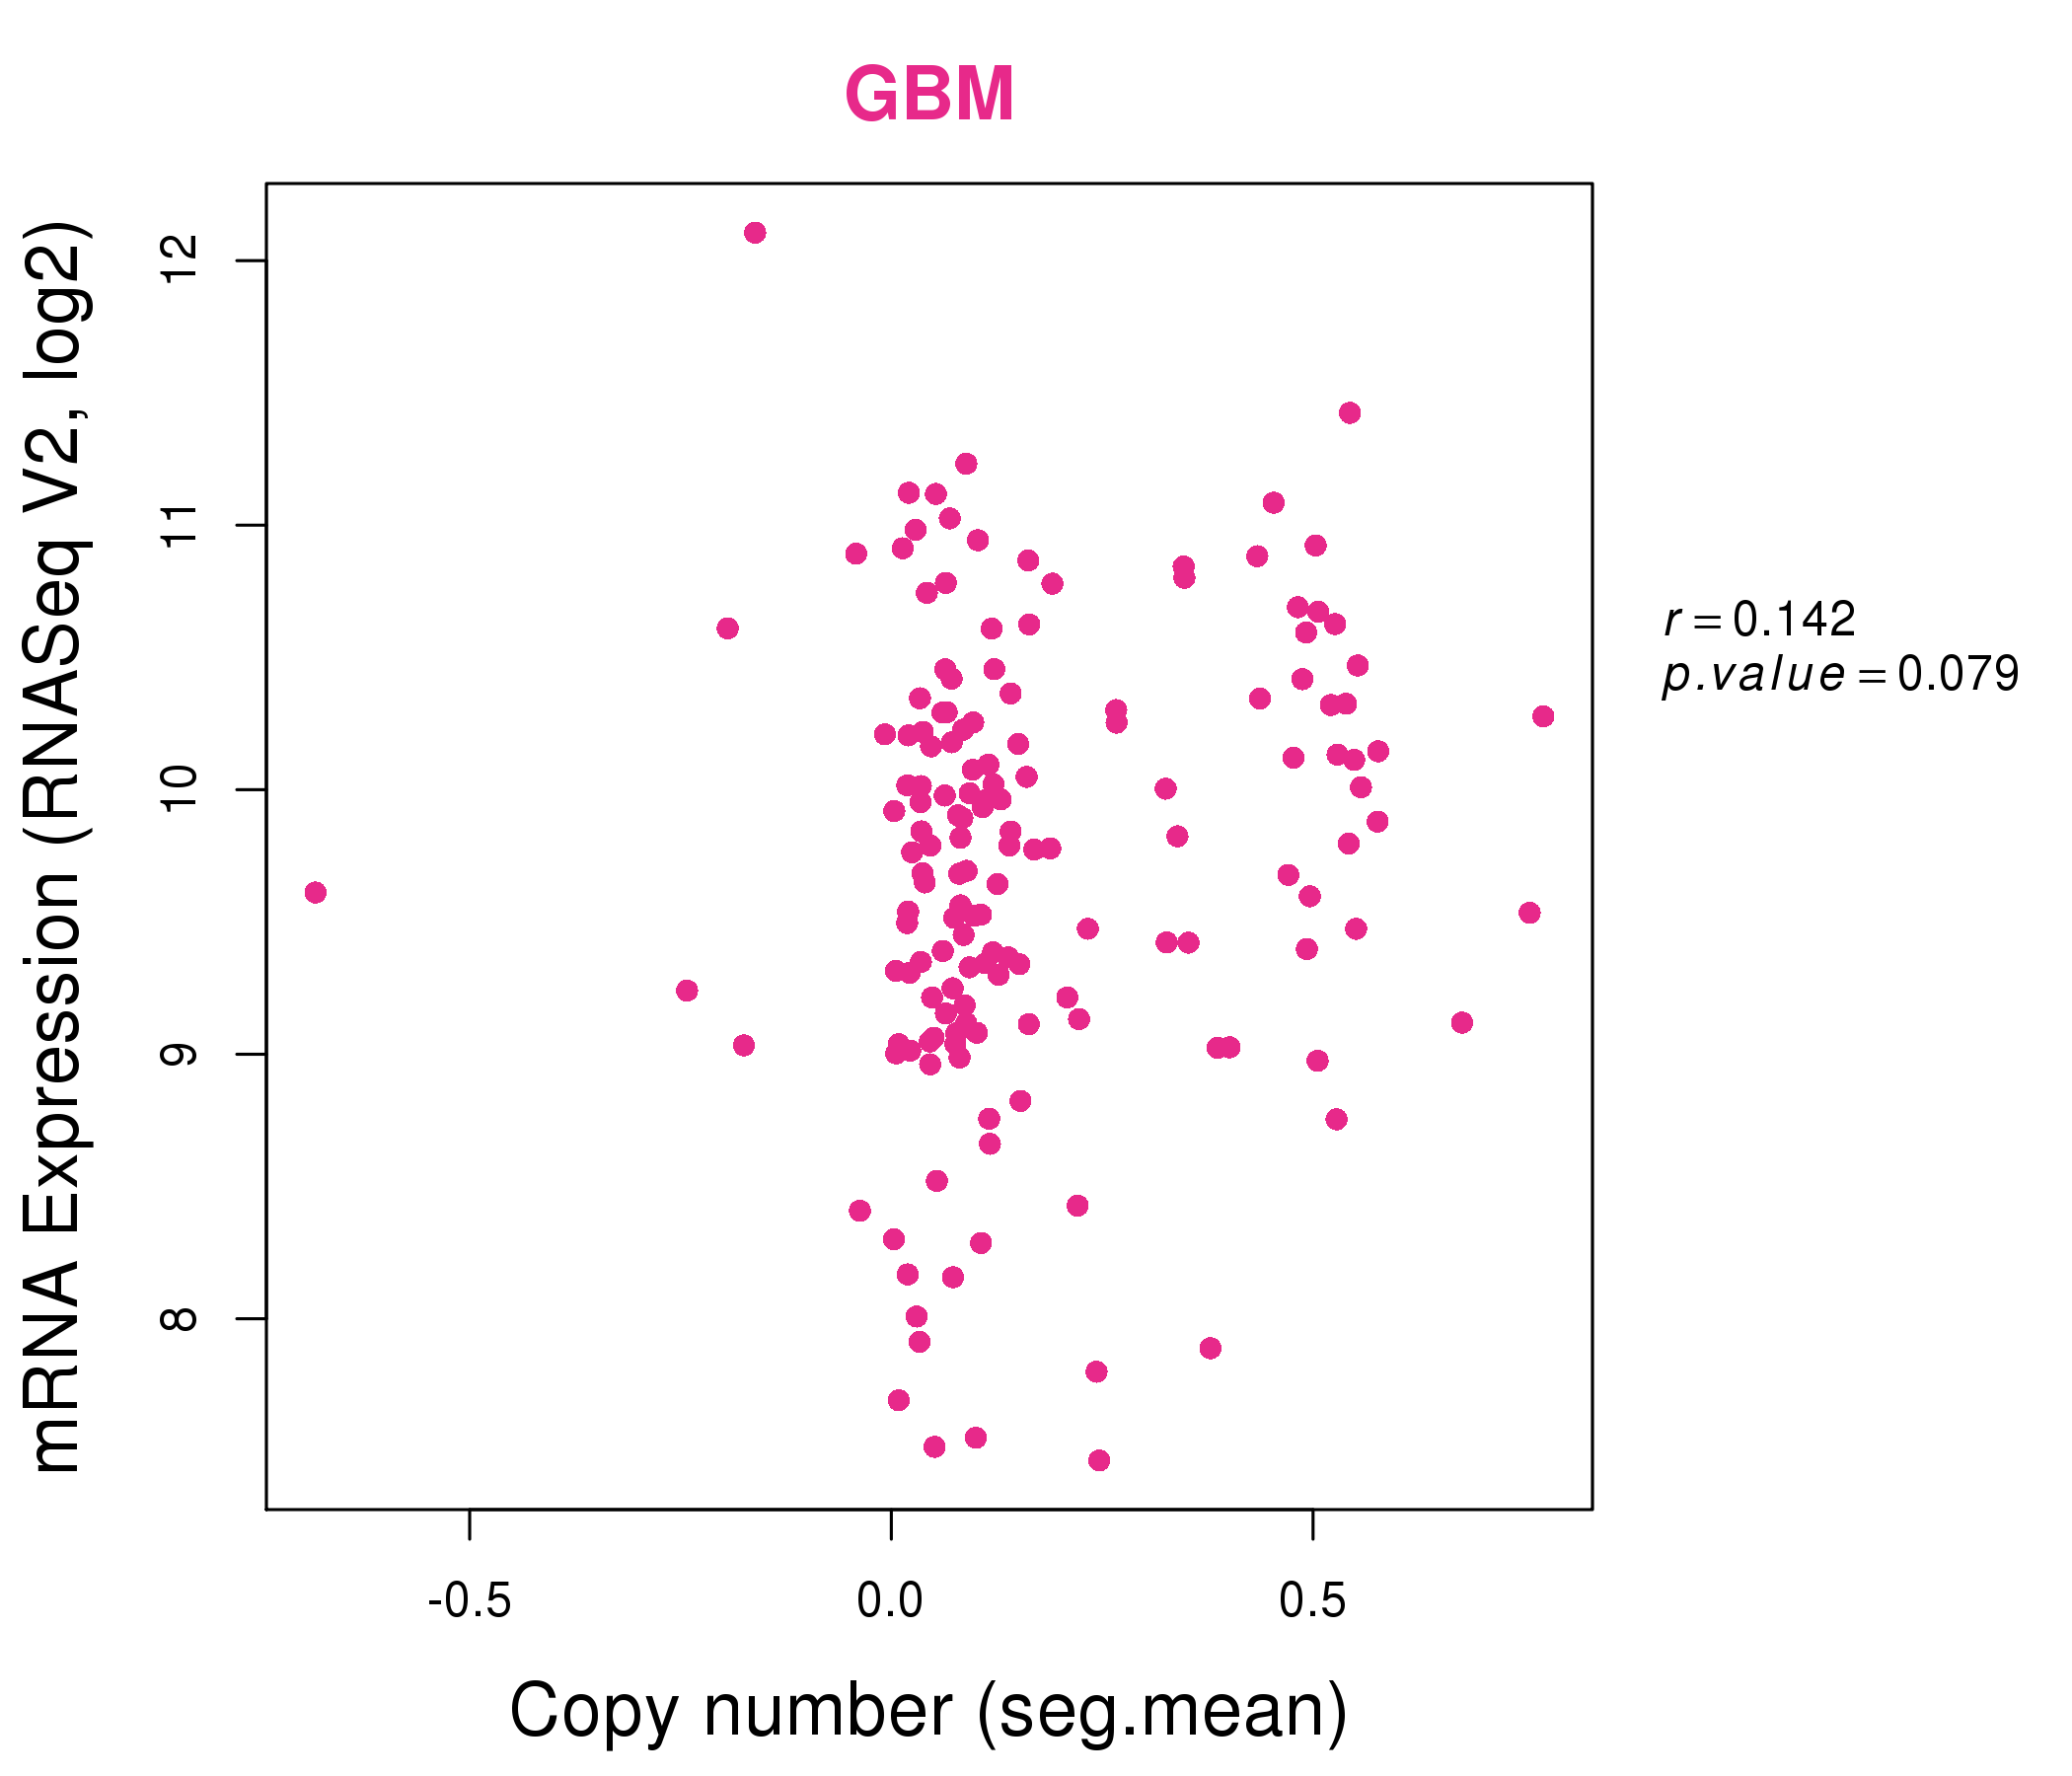
| * This plots show the correlation between CNV and gene expression. |
: Open all plots for all cancer types
 |
|
 |
|
| Top |
| Gene-Gene Network Information |
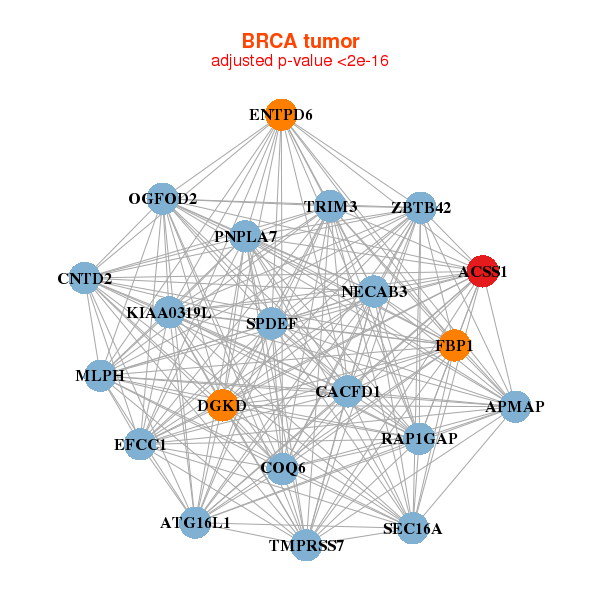
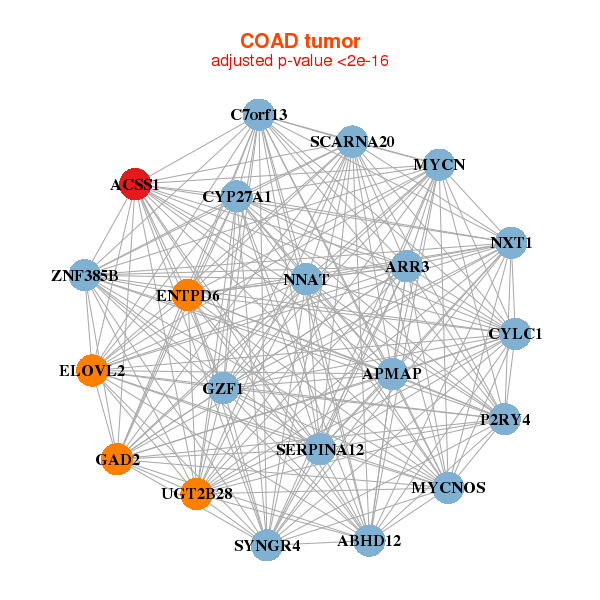
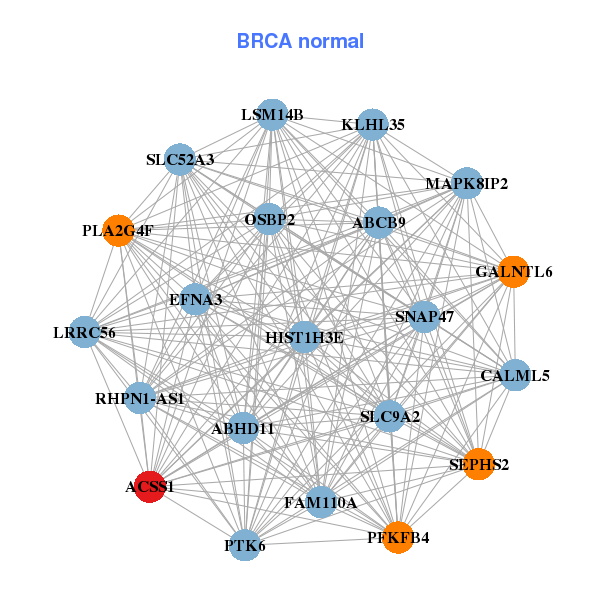
| * Co-Expression network figures were drawn using R package igraph. Only the top 20 genes with the highest correlations were shown. Red circle: input gene, orange circle: cell metabolism gene, sky circle: other gene |
: Open all plots for all cancer types
 |
| ||||
| ACSS1,ATG16L1,APMAP,CACFD1,EFCC1,CNTD2,COQ6, DGKD,ENTPD6,FBP1,KIAA0319L,MLPH,NECAB3,OGFOD2, PNPLA7,RAP1GAP,SEC16A,SPDEF,TMPRSS7,TRIM3,ZBTB42 | ABCB9,ABHD11,ACSS1,SLC52A3,RHPN1-AS1,CALML5,EFNA3, FAM110A,GALNTL6,HIST1H3E,KLHL35,LRRC56,LSM14B,MAPK8IP2, OSBP2,PFKFB4,PLA2G4F,PTK6,SEPHS2,SLC9A2,SNAP47 | ||||
 |
| ||||
| ABHD12,ACSS1,ARR3,APMAP,C7orf13,CYLC1,CYP27A1, ELOVL2,ENTPD6,GAD2,GZF1,MYCN,MYCNOS,NNAT, NXT1,P2RY4,SCARNA20,SERPINA12,SYNGR4,UGT2B28,ZNF385B | ACSS1,ALX3,MLLT4-AS1,CACNA2D4,CDK18,COX19,CYB561D1, CYP2S1,DEAF1,GAL3ST1,GHDC,HNF1A,KIF12,MFI2, MGAT3,OXER1,RALGPS1,SIDT2,SMPD3,TMED4,TSNARE1 |
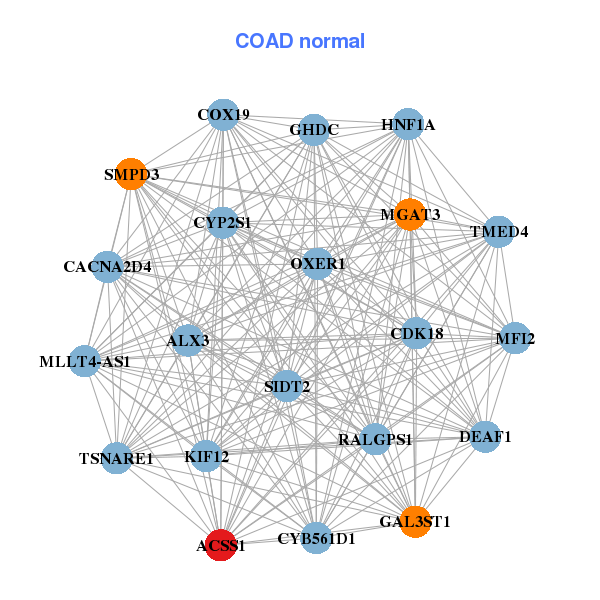
| * Co-Expression network figures were drawn using R package igraph. Only the top 20 genes with the highest correlations were shown. Red circle: input gene, orange circle: cell metabolism gene, sky circle: other gene |
: Open all plots for all cancer types
| Top |
: Open all interacting genes' information including KEGG pathway for all interacting genes from DAVID
| Top |
| Pharmacological Information for ACSS1 |
| DB Category | DB Name | DB's ID and Url link |
| * Gene Centered Interaction Network. |
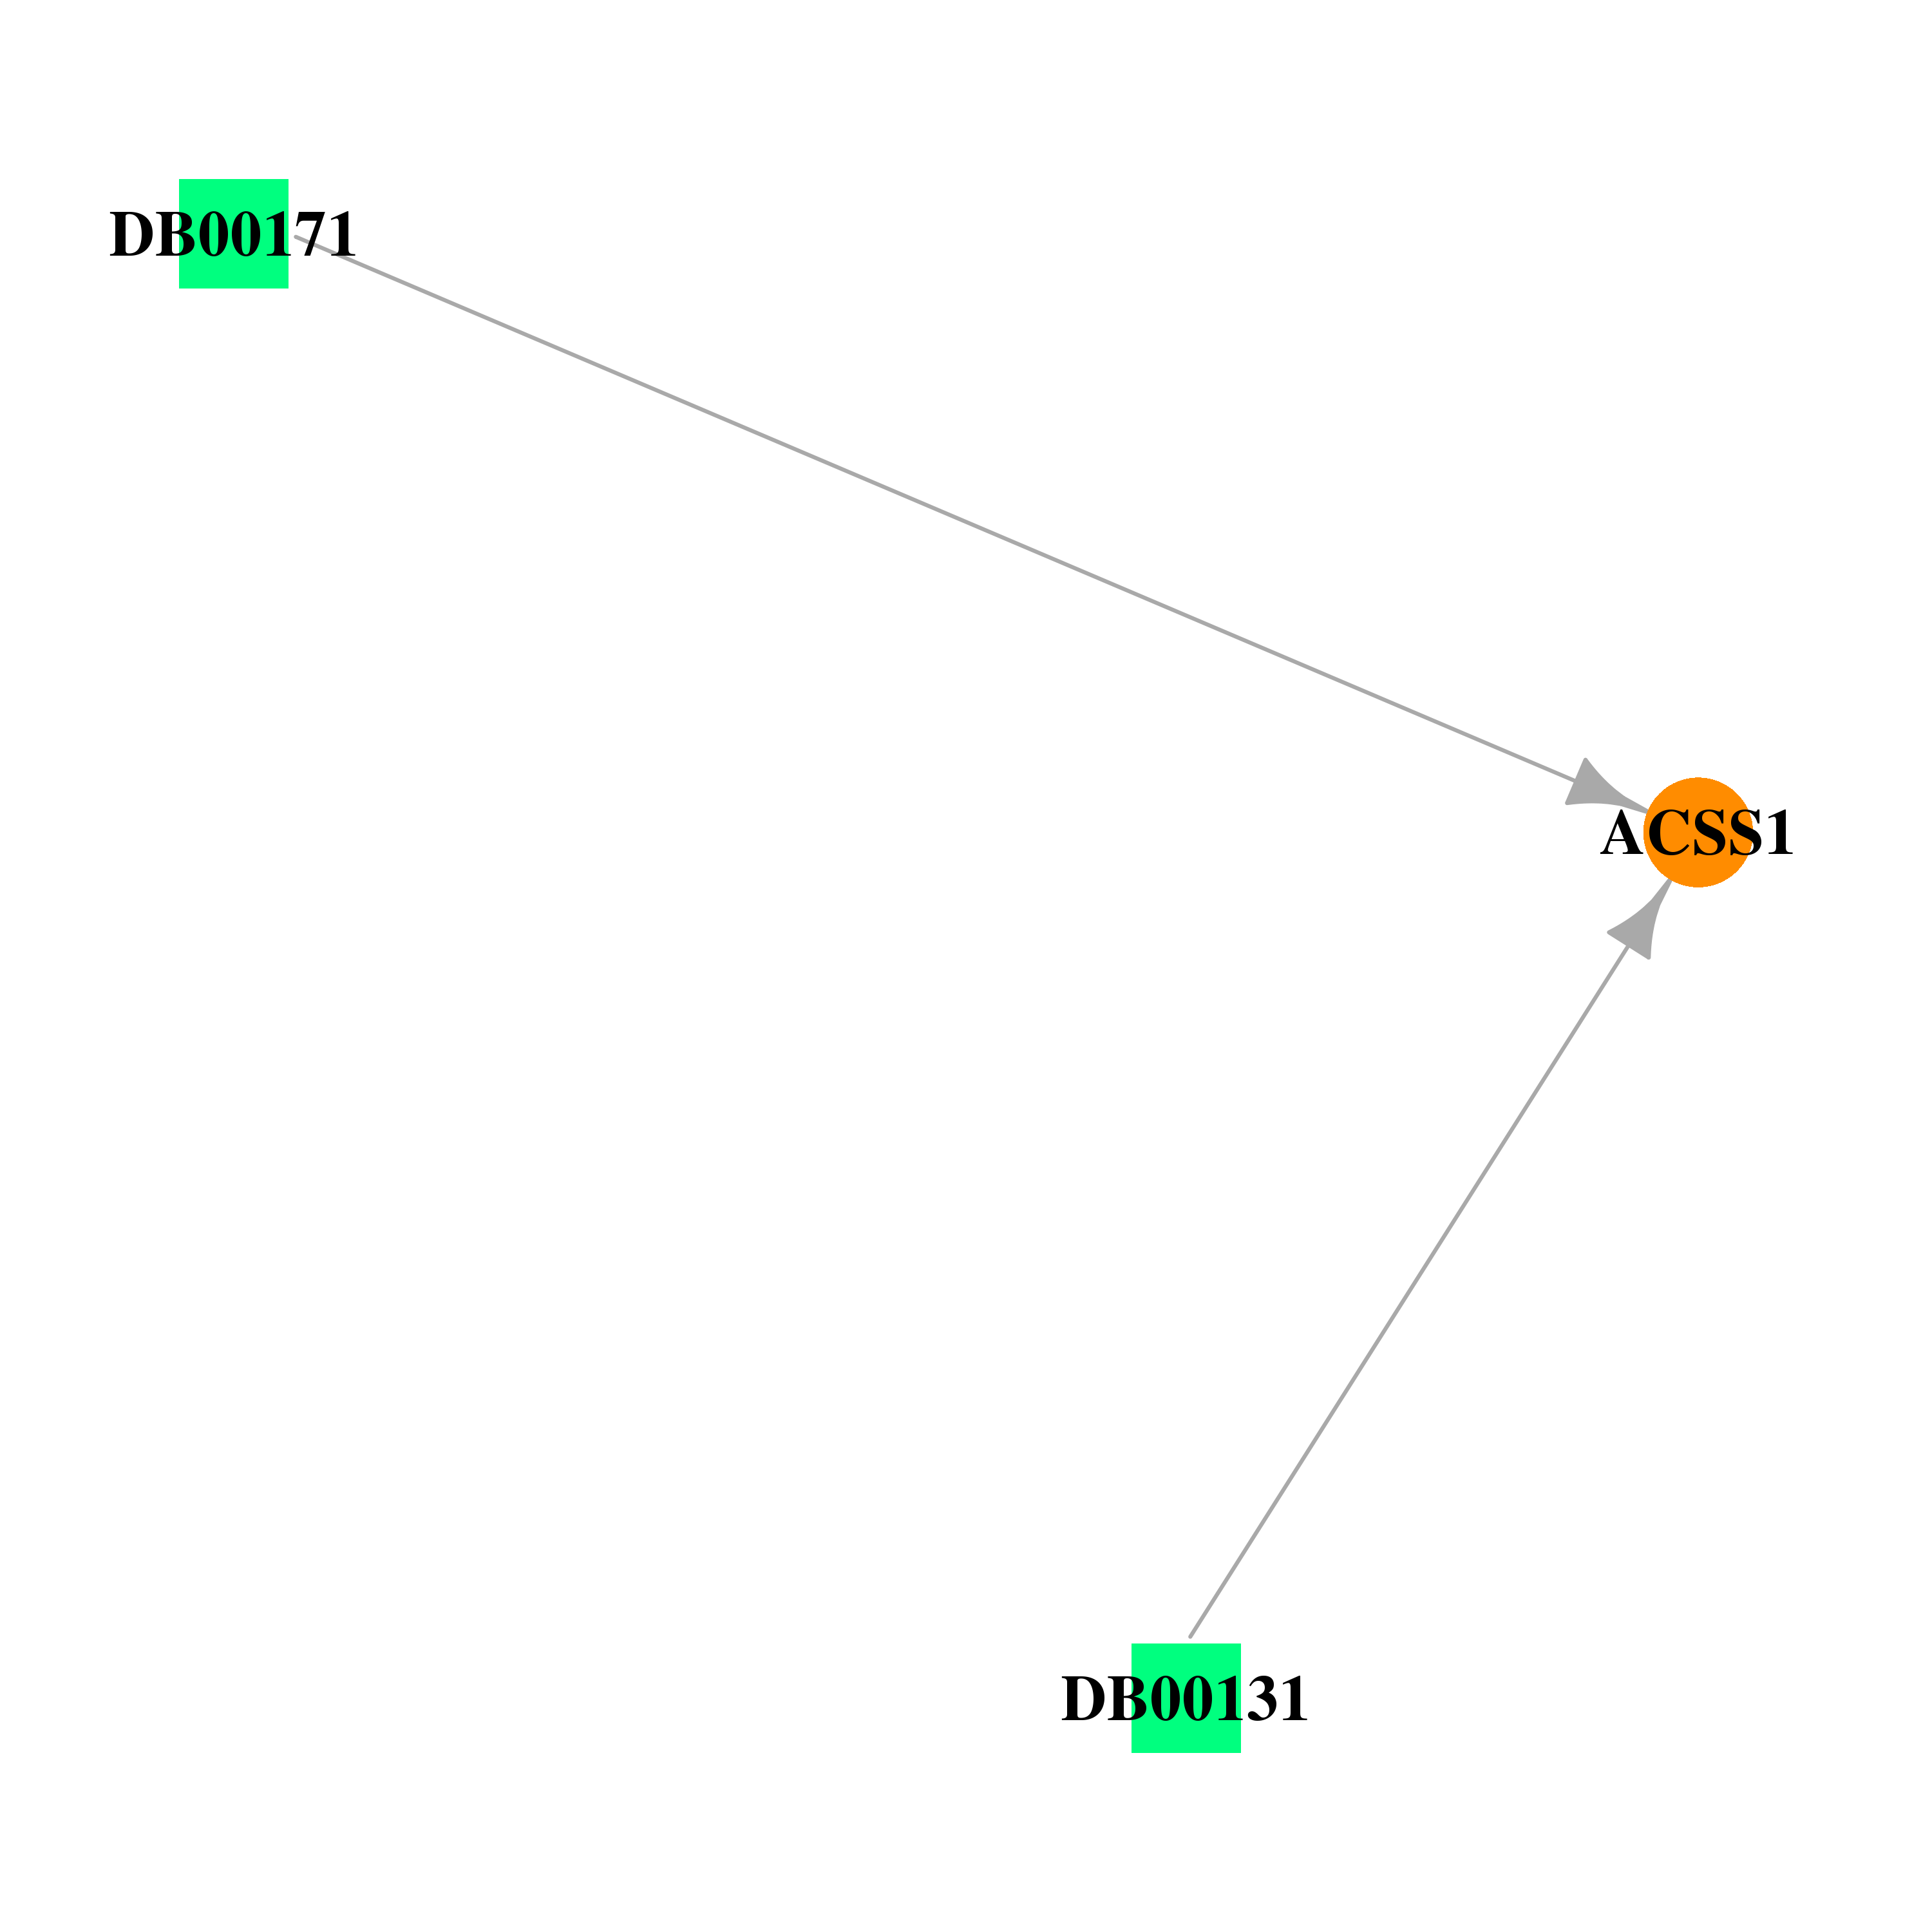 |
| * Drug Centered Interaction Network. |
| DrugBank ID | Target Name | Drug Groups | Generic Name | Drug Centered Network | Drug Structure |
| DB00131 | acyl-CoA synthetase short-chain family member 1 | approved; nutraceutical | Adenosine monophosphate | 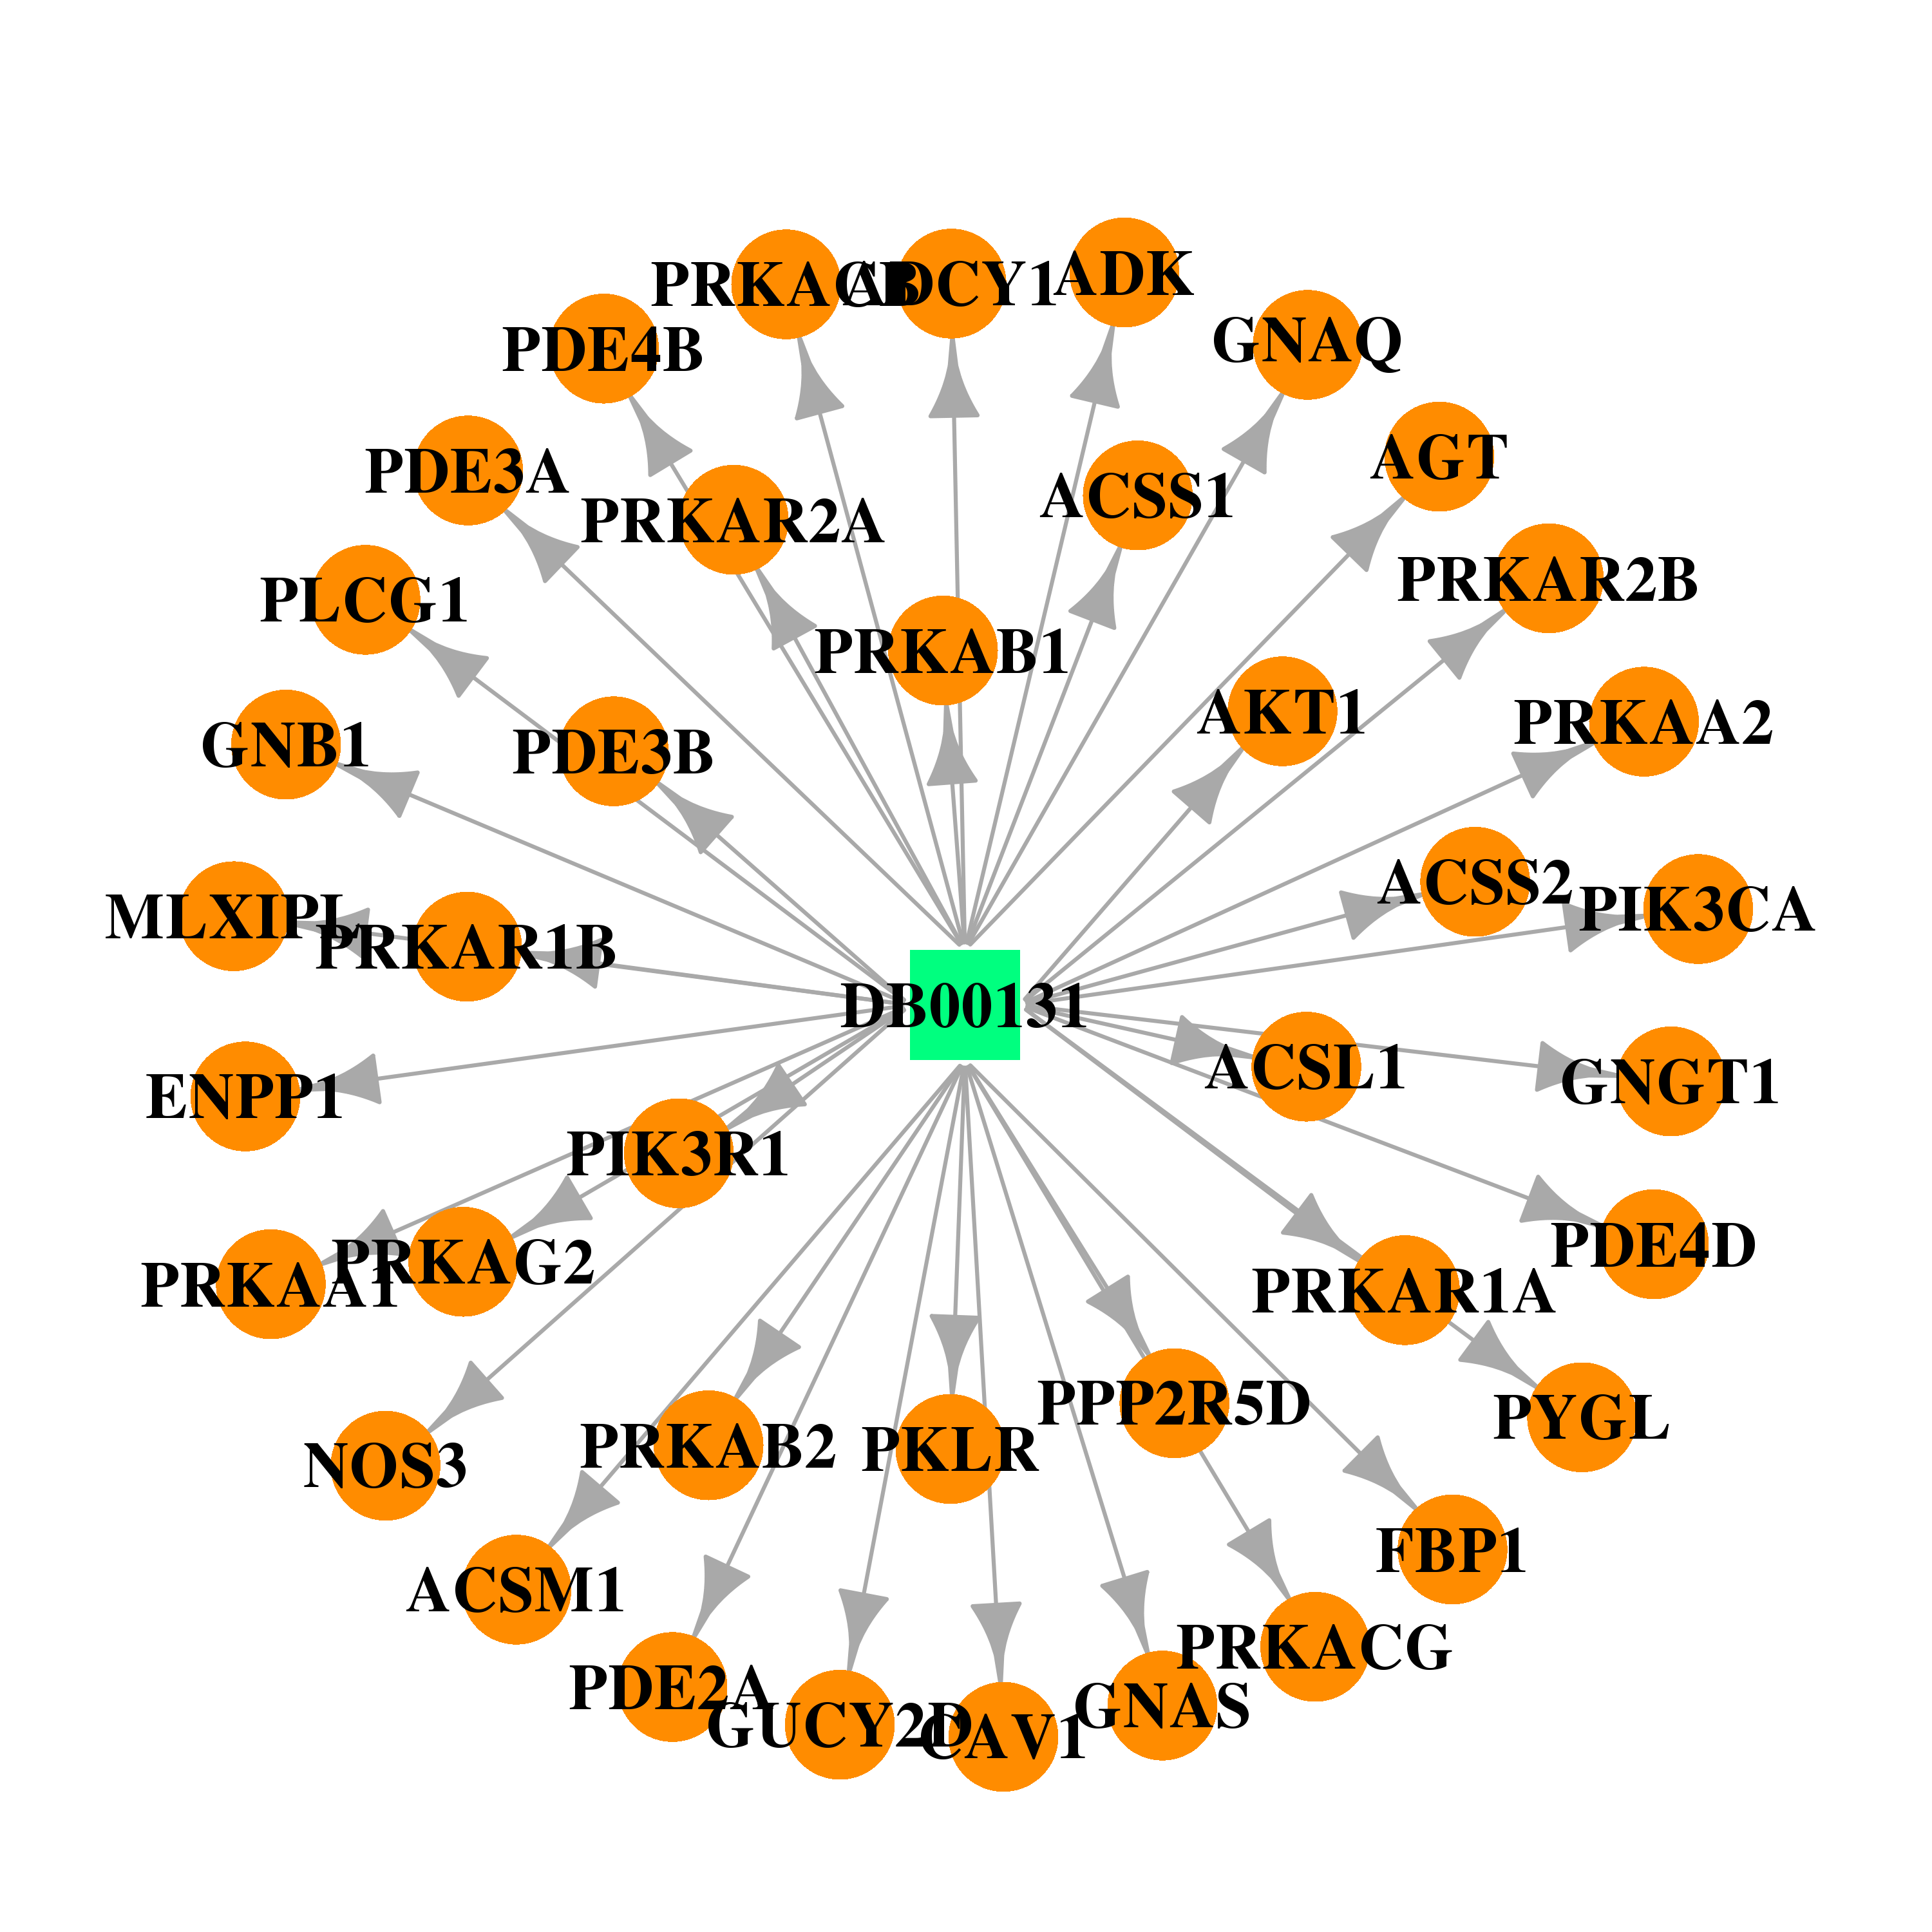 | 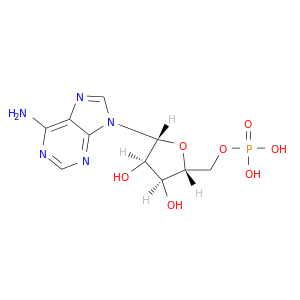 |
| DB00171 | acyl-CoA synthetase short-chain family member 1 | approved; nutraceutical | Adenosine triphosphate |  |  |
| Top |
| Cross referenced IDs for ACSS1 |
| * We obtained these cross-references from Uniprot database. It covers 150 different DBs, 18 categories. http://www.uniprot.org/help/cross_references_section |
: Open all cross reference information
|
Copyright © 2016-Present - The Univsersity of Texas Health Science Center at Houston @ |