|
||||||||||||||||||||
| |
| Phenotypic Information (metabolism pathway, cancer, disease, phenome) |
| |
| |
| Gene-Gene Network Information: Co-Expression Network, Interacting Genes & KEGG |
| |
|


| Gene Summary for TUBB6 |
| Top |
| Phenotypic Information for TUBB6(metabolism pathway, cancer, disease, phenome) |
| Cancer | CGAP: TUBB6 |
| Familial Cancer Database: TUBB6 | |
| * This gene is included in those cancer gene databases. |
|
|
|
|
|
| . | ||||||||||||||
Oncogene 1 | Significant driver gene in | |||||||||||||||||||
| cf) number; DB name 1 Oncogene; http://nar.oxfordjournals.org/content/35/suppl_1/D721.long, 2 Tumor Suppressor gene; https://bioinfo.uth.edu/TSGene/, 3 Cancer Gene Census; http://www.nature.com/nrc/journal/v4/n3/abs/nrc1299.html, 4 CancerGenes; http://nar.oxfordjournals.org/content/35/suppl_1/D721.long, 5 Network of Cancer Gene; http://ncg.kcl.ac.uk/index.php, 1Therapeutic Vulnerabilities in Cancer; http://cbio.mskcc.org/cancergenomics/statius/ |
| REACTOME_METABOLISM_OF_PROTEINS | |
| OMIM | |
| Orphanet | |
| Disease | KEGG Disease: TUBB6 |
| MedGen: TUBB6 (Human Medical Genetics with Condition) | |
| ClinVar: TUBB6 | |
| Phenotype | MGI: TUBB6 (International Mouse Phenotyping Consortium) |
| PhenomicDB: TUBB6 | |
| Mutations for TUBB6 |
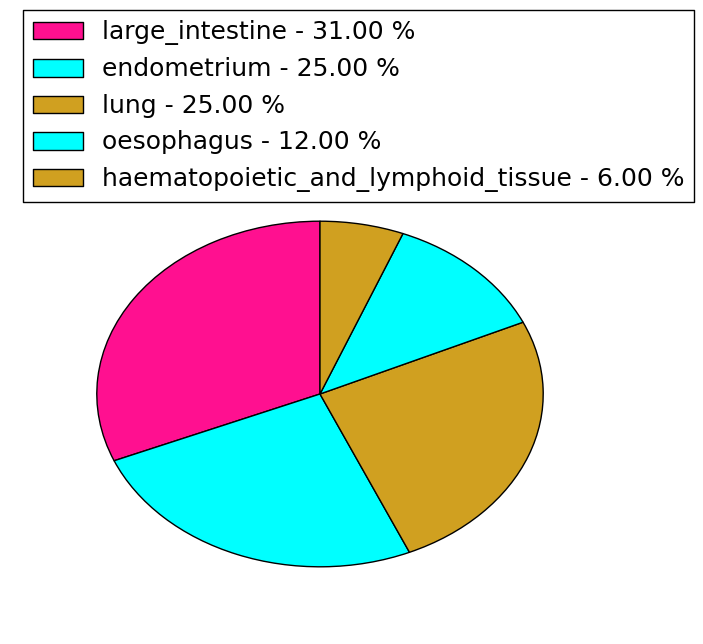
| * Under tables are showing count per each tissue to give us broad intuition about tissue specific mutation patterns.You can go to the detailed page for each mutation database's web site. |
| - Statistics for Tissue and Mutation type | Top |
 |
| - For Inter-chromosomal Variations |
| There's no inter-chromosomal structural variation. |
| - For Intra-chromosomal Variations |
| * Intra-chromosomal variantions includes 'intrachromosomal amplicon to amplicon', 'intrachromosomal amplicon to non-amplified dna', 'intrachromosomal deletion', 'intrachromosomal fold-back inversion', 'intrachromosomal inversion', 'intrachromosomal tandem duplication', 'Intrachromosomal unknown type', 'intrachromosomal with inverted orientation', 'intrachromosomal with non-inverted orientation'. |
 |
| Sample | Symbol_a | Chr_a | Start_a | End_a | Symbol_b | Chr_b | Start_b | End_b |
| pancreas | TUBB6 | chr18 | 12315240 | 12315260 | TUBB6 | chr18 | 12315952 | 12315972 |
| cf) Tissue number; Tissue name (1;Breast, 2;Central_nervous_system, 3;Haematopoietic_and_lymphoid_tissue, 4;Large_intestine, 5;Liver, 6;Lung, 7;Ovary, 8;Pancreas, 9;Prostate, 10;Skin, 11;Soft_tissue, 12;Upper_aerodigestive_tract) |
| * From mRNA Sanger sequences, Chitars2.0 arranged chimeric transcripts. This table shows TUBB6 related fusion information. |
| ID | Head Gene | Tail Gene | Accession | Gene_a | qStart_a | qEnd_a | Chromosome_a | tStart_a | tEnd_a | Gene_a | qStart_a | qEnd_a | Chromosome_a | tStart_a | tEnd_a |
| BU927907 | IL4I1 | 3 | 229 | 19 | 50410779 | 50411007 | TUBB6 | 224 | 429 | 18 | 12326345 | 12326549 | |
| BF095880 | ADI1 | 1 | 432 | 2 | 3502501 | 3504659 | TUBB6 | 429 | 487 | 18 | 12326076 | 12326134 | |
| AA416878 | RYR2 | 134 | 155 | 1 | 237787094 | 237787116 | TUBB6 | 152 | 496 | 18 | 12324898 | 12325242 | |
| Top |
| There's no copy number variation information in COSMIC data for this gene. |
| Top |
|
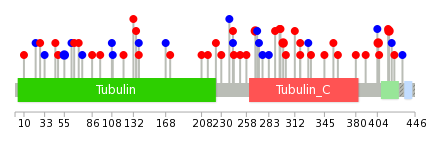 |
| Top |
| Stat. for Non-Synonymous SNVs (# total SNVs=22) | (# total SNVs=16) |
 |  |
(# total SNVs=0) | (# total SNVs=0) |
| Top |
| * When you move the cursor on each content, you can see more deailed mutation information on the Tooltip. Those are primary_site,primary_histology,mutation(aa),pubmedID. |
| GRCh37 position | Mutation(aa) | Unique sampleID count |
| chr18:12326001-12326001 | p.E405K | 2 |
| chr18:12325590-12325590 | p.P268S | 2 |
| chr18:12326037-12326037 | p.D417N | 2 |
| chr18:12308793-12308793 | p.S55S | 2 |
| chr18:12325685-12325685 | p.M299I | 2 |
| chr18:12325539-12325539 | p.R251C | 1 |
| chr18:12308320-12308320 | p.G10V | 1 |
| chr18:12325692-12325692 | p.A302T | 1 |
| chr18:12311032-12311032 | p.R86Q | 1 |
| chr18:12325306-12325306 | p.P173L | 1 |
| Top |
|
 |
| Point Mutation/ Tissue ID | 1 | 2 | 3 | 4 | 5 | 6 | 7 | 8 | 9 | 10 | 11 | 12 | 13 | 14 | 15 | 16 | 17 | 18 | 19 | 20 |
| # sample | 2 | 1 | 7 | 4 | 1 | 3 | 1 | 7 | 10 | 9 | ||||||||||
| # mutation | 2 | 1 | 8 | 4 | 1 | 3 | 1 | 8 | 11 | 9 | ||||||||||
| nonsynonymous SNV | 2 | 1 | 4 | 3 | 1 | 7 | 7 | 5 | ||||||||||||
| synonymous SNV | 4 | 1 | 3 | 1 | 1 | 4 | 4 |
| cf) Tissue ID; Tissue type (1; BLCA[Bladder Urothelial Carcinoma], 2; BRCA[Breast invasive carcinoma], 3; CESC[Cervical squamous cell carcinoma and endocervical adenocarcinoma], 4; COAD[Colon adenocarcinoma], 5; GBM[Glioblastoma multiforme], 6; Glioma Low Grade, 7; HNSC[Head and Neck squamous cell carcinoma], 8; KICH[Kidney Chromophobe], 9; KIRC[Kidney renal clear cell carcinoma], 10; KIRP[Kidney renal papillary cell carcinoma], 11; LAML[Acute Myeloid Leukemia], 12; LUAD[Lung adenocarcinoma], 13; LUSC[Lung squamous cell carcinoma], 14; OV[Ovarian serous cystadenocarcinoma ], 15; PAAD[Pancreatic adenocarcinoma], 16; PRAD[Prostate adenocarcinoma], 17; SKCM[Skin Cutaneous Melanoma], 18:STAD[Stomach adenocarcinoma], 19:THCA[Thyroid carcinoma], 20:UCEC[Uterine Corpus Endometrial Carcinoma]) |
| Top |
| * We represented just top 10 SNVs. When you move the cursor on each content, you can see more deailed mutation information on the Tooltip. Those are primary_site, primary_histology, mutation(aa), pubmedID. |
| Genomic Position | Mutation(aa) | Unique sampleID count |
| chr18:12326037 | p.P268S | 2 |
| chr18:12325590 | p.D417N | 2 |
| chr18:12325637 | p.V5V | 1 |
| chr18:12308306 | p.S168S | 1 |
| chr18:12325866 | p.A283A | 1 |
| chr18:12325150 | p.H28R | 1 |
| chr18:12325505 | p.S172L | 1 |
| chr18:12325643 | p.T285T | 1 |
| chr18:12308711 | p.Y36H | 1 |
| chr18:12325927 | p.P173L | 1 |
| * Copy number data were extracted from TCGA using R package TCGA-Assembler. The URLs of all public data files on TCGA DCC data server were gathered on Jan-05-2015. Function ProcessCNAData in TCGA-Assembler package was used to obtain gene-level copy number value which is calculated as the average copy number of the genomic region of a gene. |
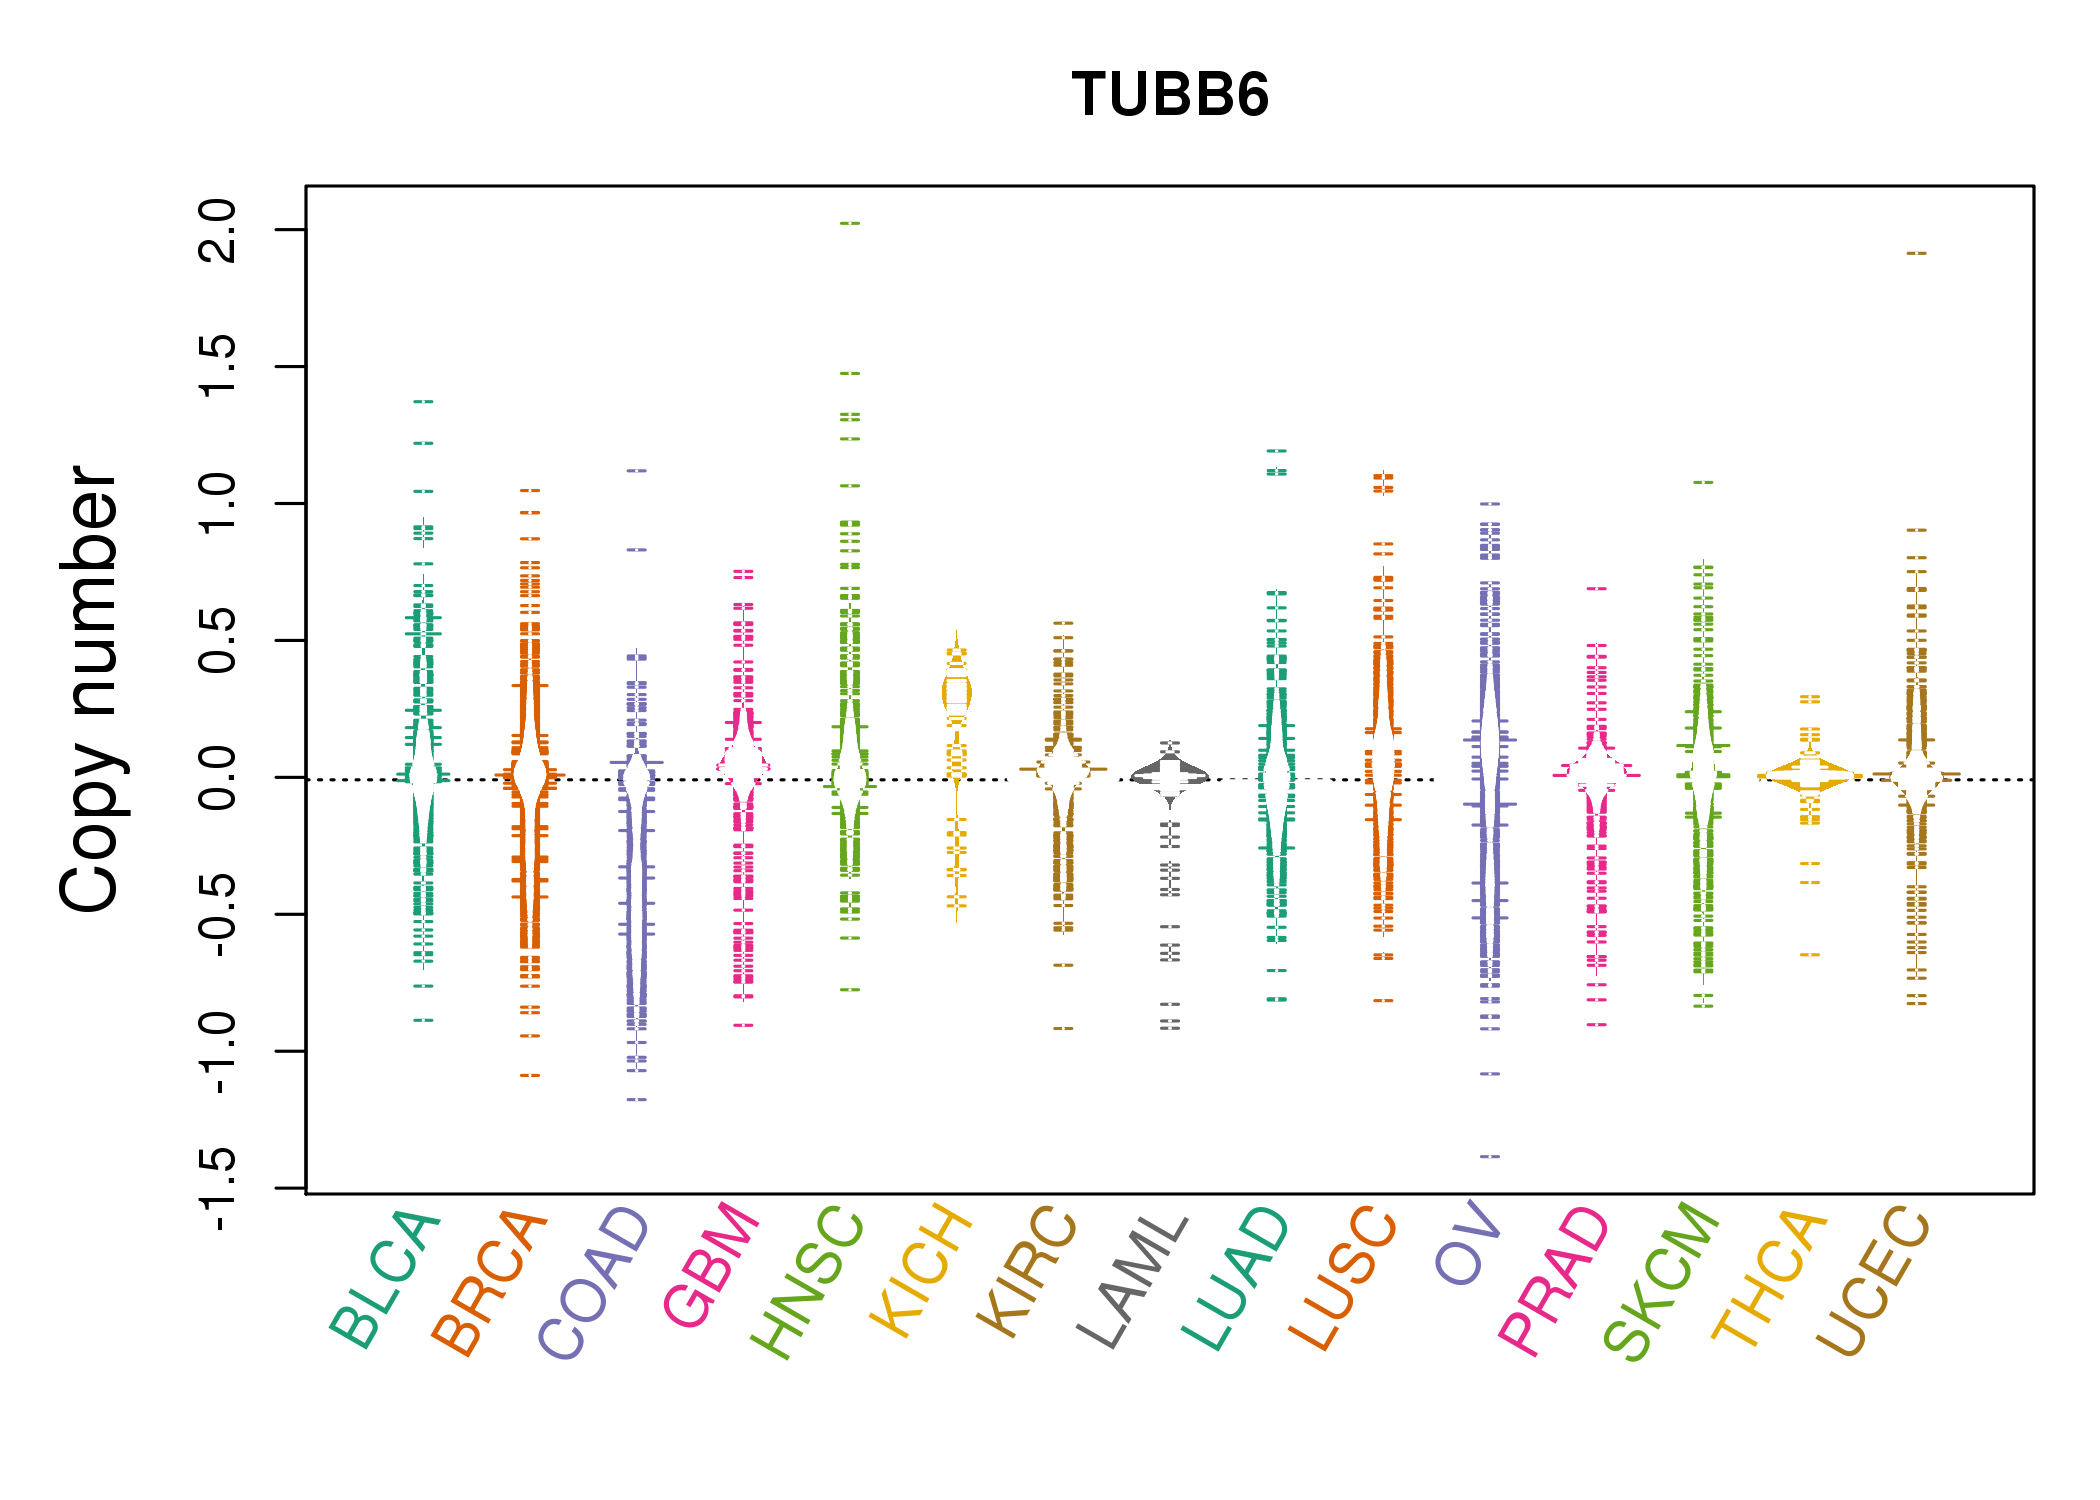 |
| cf) Tissue ID[Tissue type]: BLCA[Bladder Urothelial Carcinoma], BRCA[Breast invasive carcinoma], CESC[Cervical squamous cell carcinoma and endocervical adenocarcinoma], COAD[Colon adenocarcinoma], GBM[Glioblastoma multiforme], Glioma Low Grade, HNSC[Head and Neck squamous cell carcinoma], KICH[Kidney Chromophobe], KIRC[Kidney renal clear cell carcinoma], KIRP[Kidney renal papillary cell carcinoma], LAML[Acute Myeloid Leukemia], LUAD[Lung adenocarcinoma], LUSC[Lung squamous cell carcinoma], OV[Ovarian serous cystadenocarcinoma ], PAAD[Pancreatic adenocarcinoma], PRAD[Prostate adenocarcinoma], SKCM[Skin Cutaneous Melanoma], STAD[Stomach adenocarcinoma], THCA[Thyroid carcinoma], UCEC[Uterine Corpus Endometrial Carcinoma] |
| Top |
| Gene Expression for TUBB6 |
| * CCLE gene expression data were extracted from CCLE_Expression_Entrez_2012-10-18.res: Gene-centric RMA-normalized mRNA expression data. |
 |
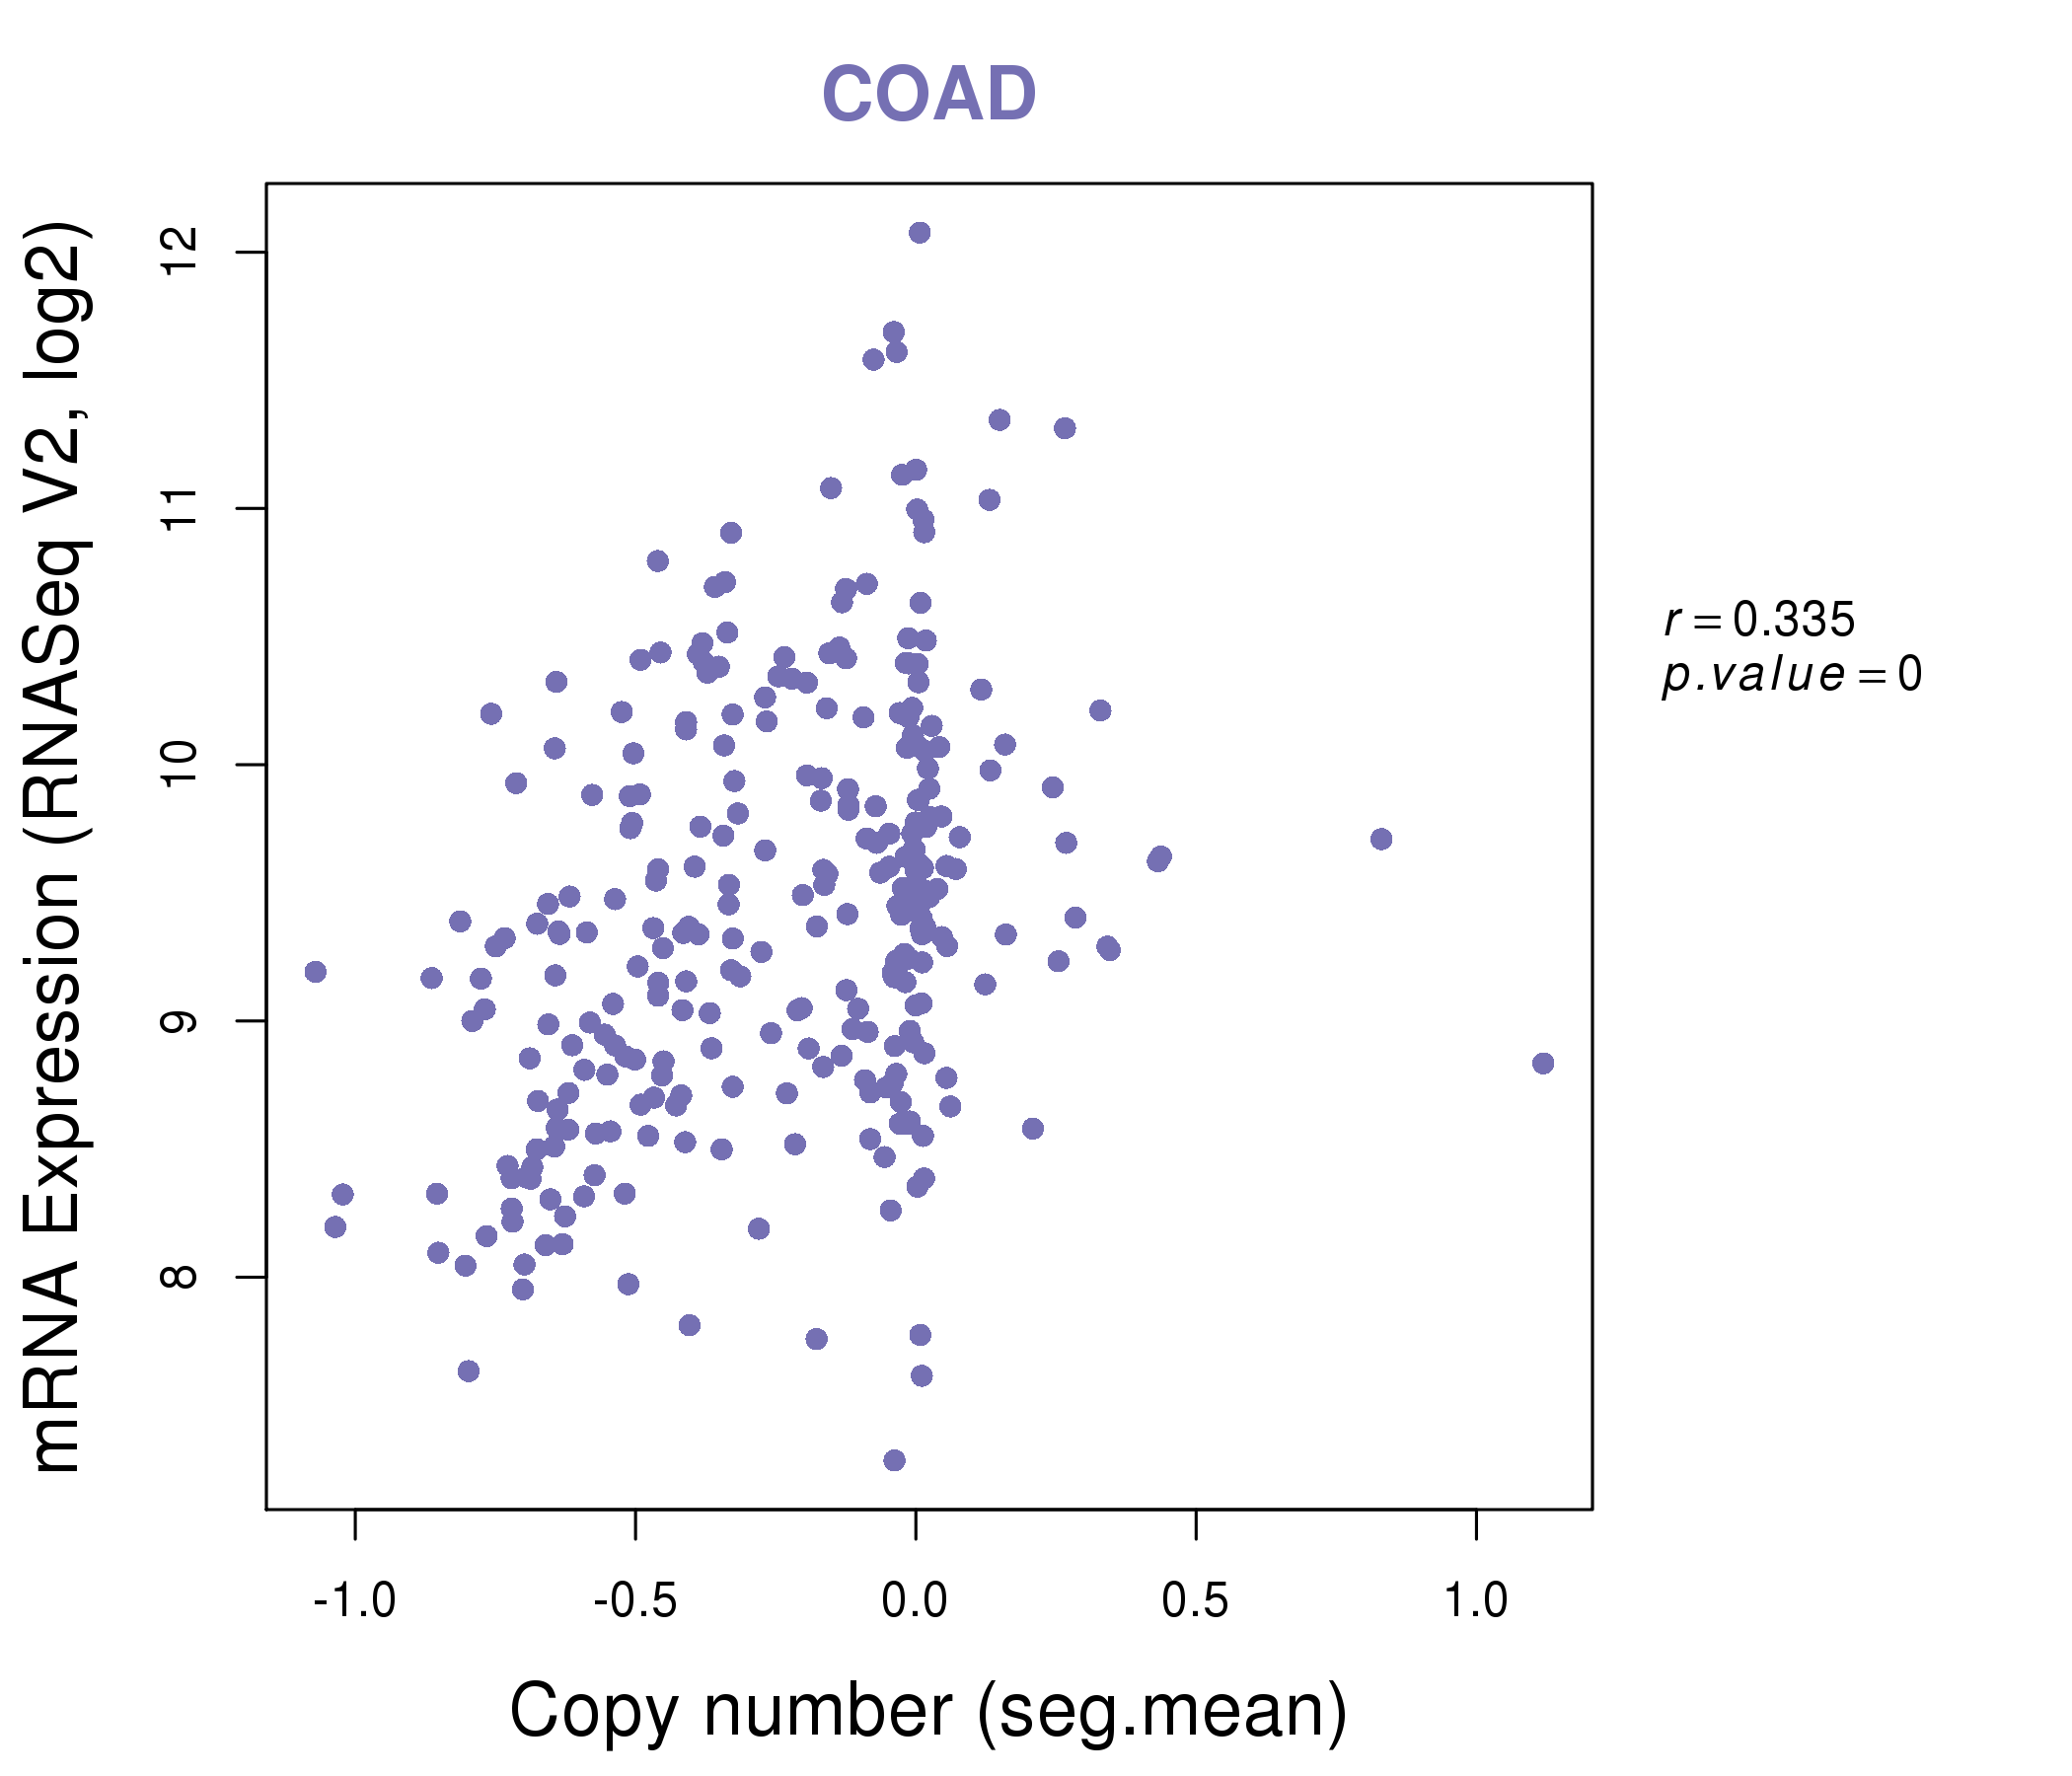
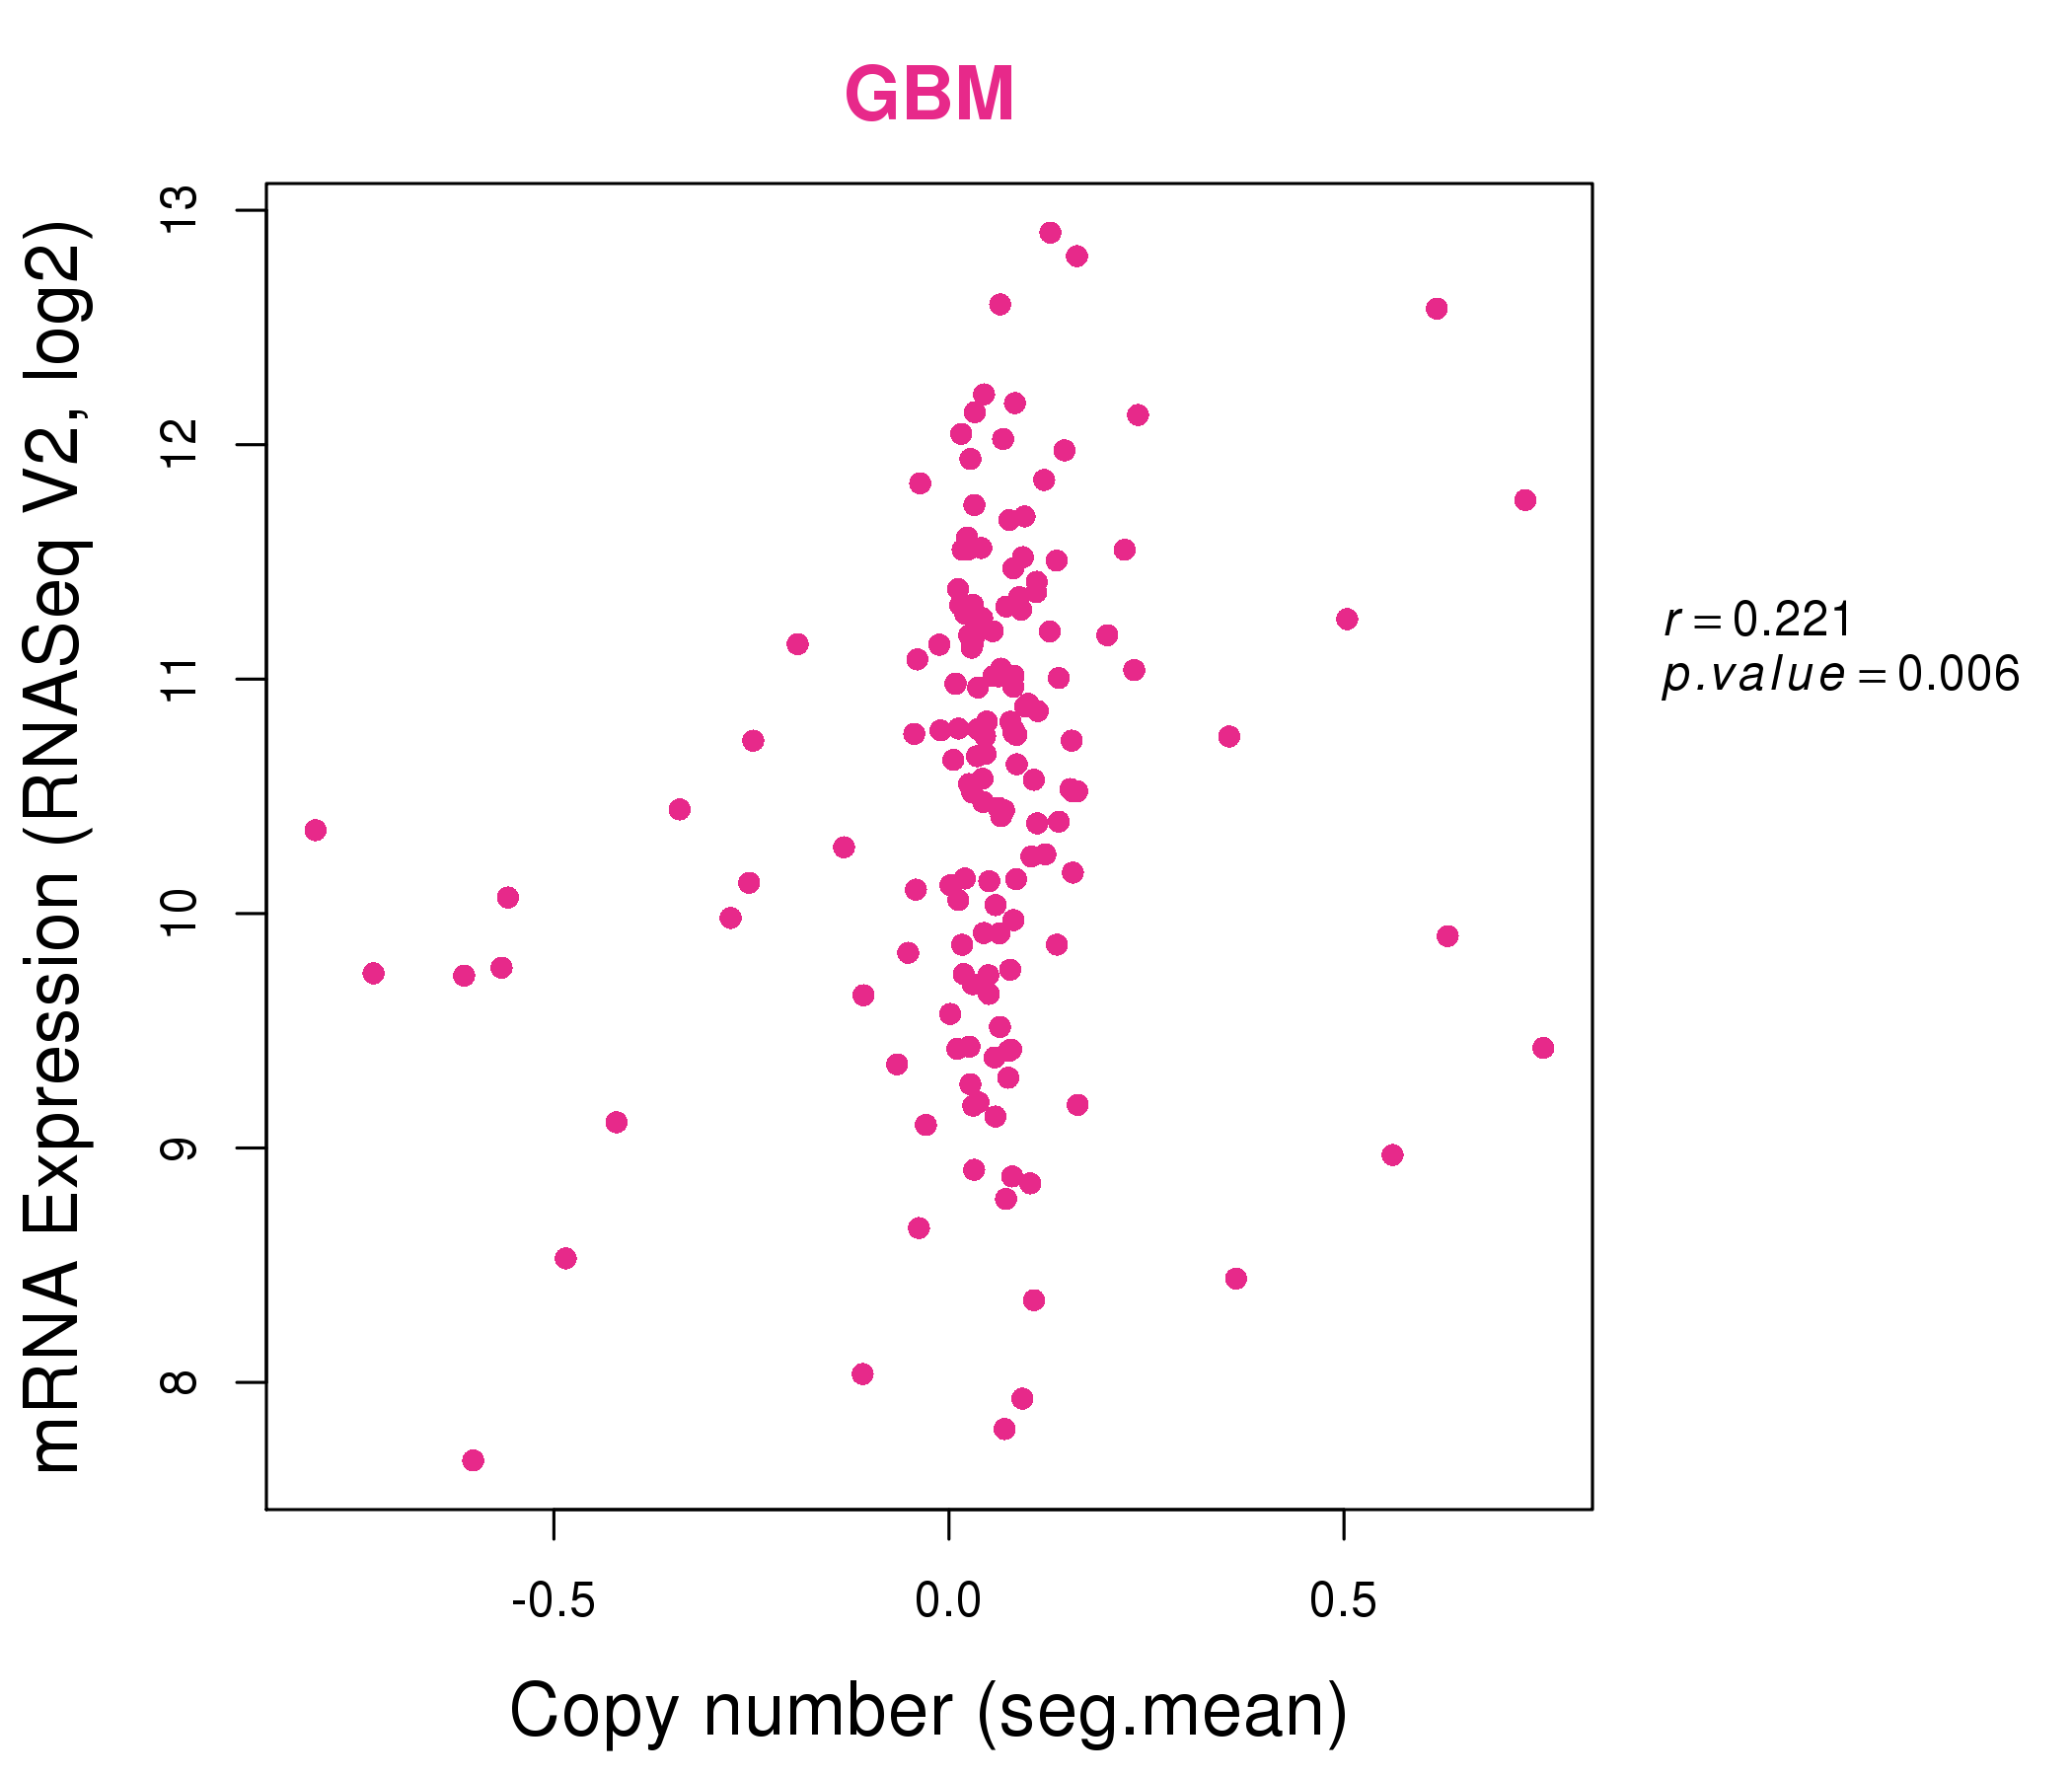
| * Normalized gene expression data of RNASeqV2 was extracted from TCGA using R package TCGA-Assembler. The URLs of all public data files on TCGA DCC data server were gathered at Jan-05-2015. Only eight cancer types have enough normal control samples for differential expression analysis. (t test, adjusted p<0.05 (using Benjamini-Hochberg FDR)) |
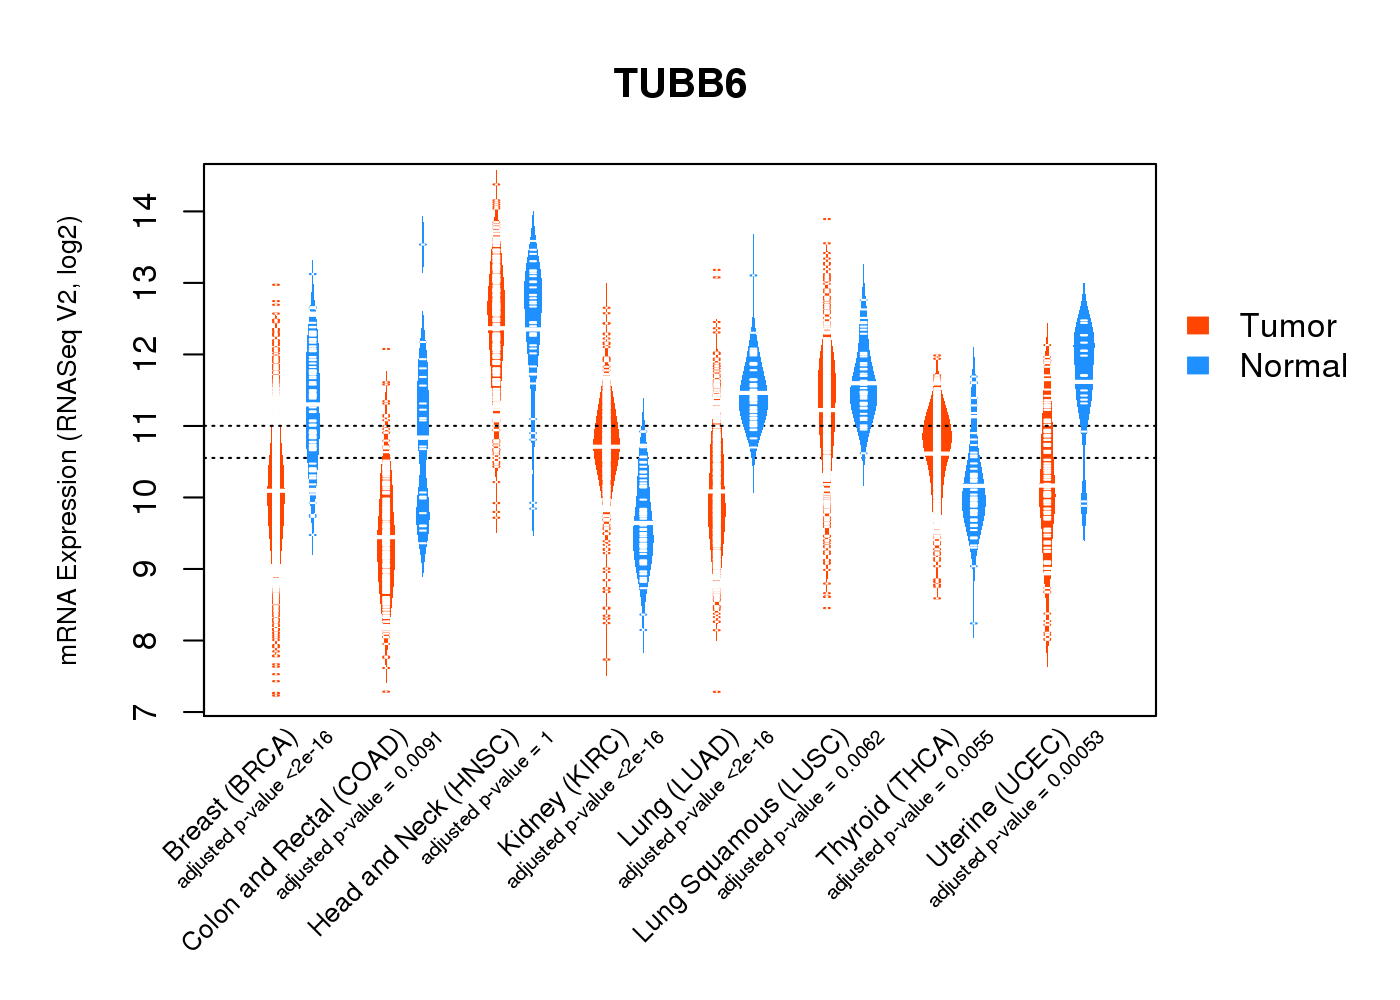 |
| Top |
| * This plots show the correlation between CNV and gene expression. |
: Open all plots for all cancer types
 |
|
 |
|

| Top |
| Gene-Gene Network Information |
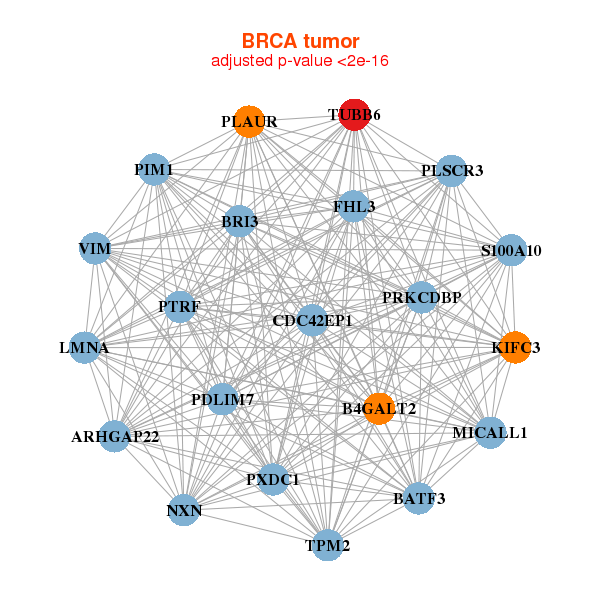
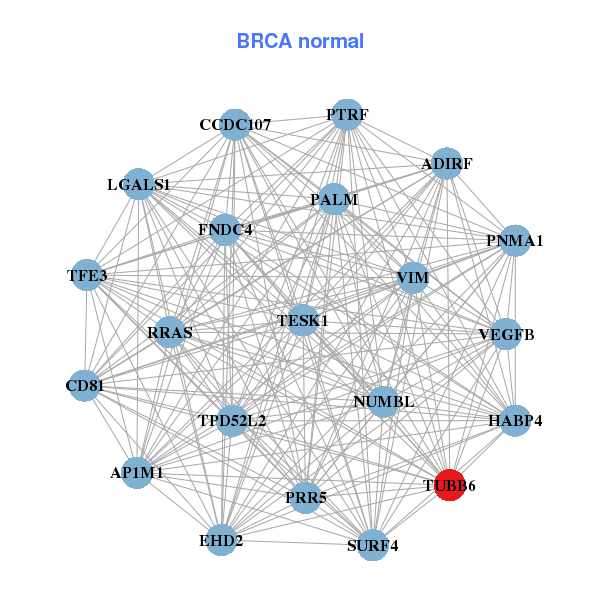
| * Co-Expression network figures were drawn using R package igraph. Only the top 20 genes with the highest correlations were shown. Red circle: input gene, orange circle: cell metabolism gene, sky circle: other gene |
: Open all plots for all cancer types
 |
|
| ARHGAP22,B4GALT2,BATF3,BRI3,PXDC1,CDC42EP1,FHL3, KIFC3,LMNA,MICALL1,NXN,PDLIM7,PIM1,PLAUR, PLSCR3,PRKCDBP,PTRF,S100A10,TPM2,TUBB6,VIM | AP1M1,ADIRF,CCDC107,CD81,EHD2,FNDC4,HABP4, LGALS1,NUMBL,PALM,PNMA1,PRR5,PTRF,RRAS, SURF4,TESK1,TFE3,TPD52L2,TUBB6,VEGFB,VIM |
 |
|
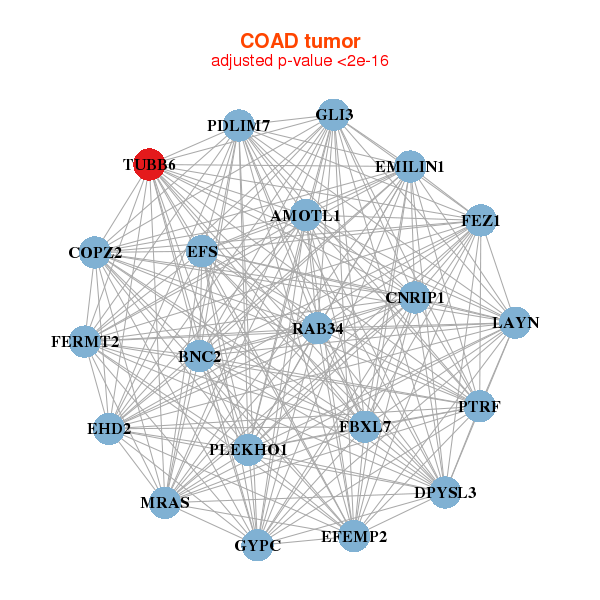
| AMOTL1,BNC2,CNRIP1,COPZ2,DPYSL3,EFEMP2,EFS, EHD2,EMILIN1,FBXL7,FERMT2,FEZ1,GLI3,GYPC, LAYN,MRAS,PDLIM7,PLEKHO1,PTRF,RAB34,TUBB6 | BVES,CALD1,CSRP1,DNAJB5,DPYSL3,FERMT2,ITGB1BP2, LOC401093,MSRB3,MYLK,NCS1,PDLIM3,PDLIM4,PDLIM7, PTRF,SYNPO2,TPM1,TPM2,TSPAN2,TUBA1A,TUBB6 |

| * Co-Expression network figures were drawn using R package igraph. Only the top 20 genes with the highest correlations were shown. Red circle: input gene, orange circle: cell metabolism gene, sky circle: other gene |
: Open all plots for all cancer types
| Top |
: Open all interacting genes' information including KEGG pathway for all interacting genes from DAVID
| Top |
| Pharmacological Information for TUBB6 |
| There's no related Drug. |
| Top |
| Cross referenced IDs for TUBB6 |
| * We obtained these cross-references from Uniprot database. It covers 150 different DBs, 18 categories. http://www.uniprot.org/help/cross_references_section |
: Open all cross reference information
|
Copyright © 2016-Present - The Univsersity of Texas Health Science Center at Houston @ |