|
|||||||||||||||||||||||||||||||||||||||||||||||||||||||||||||||||||||||||||||||||||||||||||||||||||||||||||||||||||||||||||||||||||||||||||||||||||||||||||||||||||||||||||||||||||||||||||||||||||||||||||||||||||||||||||||||||||||||||||||||||||||||||||||||||||||||||||||||||||||||||||||||||||||||||||||||||||||||||||||||||||||||||||||||||||
| |
| Phenotypic Information (metabolism pathway, cancer, disease, phenome) |
| |
| |
| Gene-Gene Network Information: Co-Expression Network, Interacting Genes & KEGG |
| |
|


| Gene Summary for NT5C1A |
| Top |
| Phenotypic Information for NT5C1A(metabolism pathway, cancer, disease, phenome) |
| Cancer | CGAP: NT5C1A |
| Familial Cancer Database: NT5C1A | |
| * This gene is included in those cancer gene databases. |
|
|
|
|
|
|
| |||||||||||||||||||||||||||||||||||||||||||||||||||||||||||||||||||||||||||||||||||||||||||||||||||||||||||||||||||||||||||||||||||||||||||||||||||||||||||||||||||||||||||||||||||||||||||||||||||||||||||||||||||||||||||||||||||||||||||||||||||||||||||||||||||||||||||||||||||||||||||||||||||||||||||||||||||||||||||||||||||||||||||||
Oncogene 1 | Significant driver gene in | ||||||||||||||||||||||||||||||||||||||||||||||||||||||||||||||||||||||||||||||||||||||||||||||||||||||||||||||||||||||||||||||||||||||||||||||||||||||||||||||||||||||||||||||||||||||||||||||||||||||||||||||||||||||||||||||||||||||||||||||||||||||||||||||||||||||||||||||||||||||||||||||||||||||||||||||||||||||||||||||||||||||||||||||||||
| cf) number; DB name 1 Oncogene; http://nar.oxfordjournals.org/content/35/suppl_1/D721.long, 2 Tumor Suppressor gene; https://bioinfo.uth.edu/TSGene/, 3 Cancer Gene Census; http://www.nature.com/nrc/journal/v4/n3/abs/nrc1299.html, 4 CancerGenes; http://nar.oxfordjournals.org/content/35/suppl_1/D721.long, 5 Network of Cancer Gene; http://ncg.kcl.ac.uk/index.php, 1Therapeutic Vulnerabilities in Cancer; http://cbio.mskcc.org/cancergenomics/statius/ |
| KEGG_PURINE_METABOLISM KEGG_PYRIMIDINE_METABOLISM KEGG_NICOTINATE_AND_NICOTINAMIDE_METABOLISM REACTOME_METABOLISM_OF_NUCLEOTIDES REACTOME_PURINE_METABOLISM REACTOME_PYRIMIDINE_METABOLISM | |
| OMIM | |
| Orphanet | |
| Disease | KEGG Disease: NT5C1A |
| MedGen: NT5C1A (Human Medical Genetics with Condition) | |
| ClinVar: NT5C1A | |
| Phenotype | MGI: NT5C1A (International Mouse Phenotyping Consortium) |
| PhenomicDB: NT5C1A | |
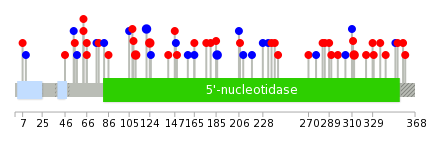
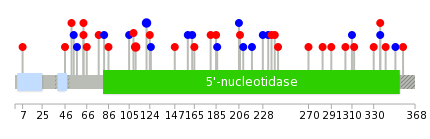
| Mutations for NT5C1A |
| * Under tables are showing count per each tissue to give us broad intuition about tissue specific mutation patterns.You can go to the detailed page for each mutation database's web site. |
| There's no structural variation information in COSMIC data for this gene. |
| * From mRNA Sanger sequences, Chitars2.0 arranged chimeric transcripts. This table shows NT5C1A related fusion information. |
| ID | Head Gene | Tail Gene | Accession | Gene_a | qStart_a | qEnd_a | Chromosome_a | tStart_a | tEnd_a | Gene_a | qStart_a | qEnd_a | Chromosome_a | tStart_a | tEnd_a |
| Top |
| Mutation type/ Tissue ID | brca | cns | cerv | endome | haematopo | kidn | Lintest | liver | lung | ns | ovary | pancre | prost | skin | stoma | thyro | urina | |||
| Total # sample | 1 | |||||||||||||||||||
| GAIN (# sample) | ||||||||||||||||||||
| LOSS (# sample) | 1 |
| cf) Tissue ID; Tissue type (1; Breast, 2; Central_nervous_system, 3; Cervix, 4; Endometrium, 5; Haematopoietic_and_lymphoid_tissue, 6; Kidney, 7; Large_intestine, 8; Liver, 9; Lung, 10; NS, 11; Ovary, 12; Pancreas, 13; Prostate, 14; Skin, 15; Stomach, 16; Thyroid, 17; Urinary_tract) |
| Top |
|
 |
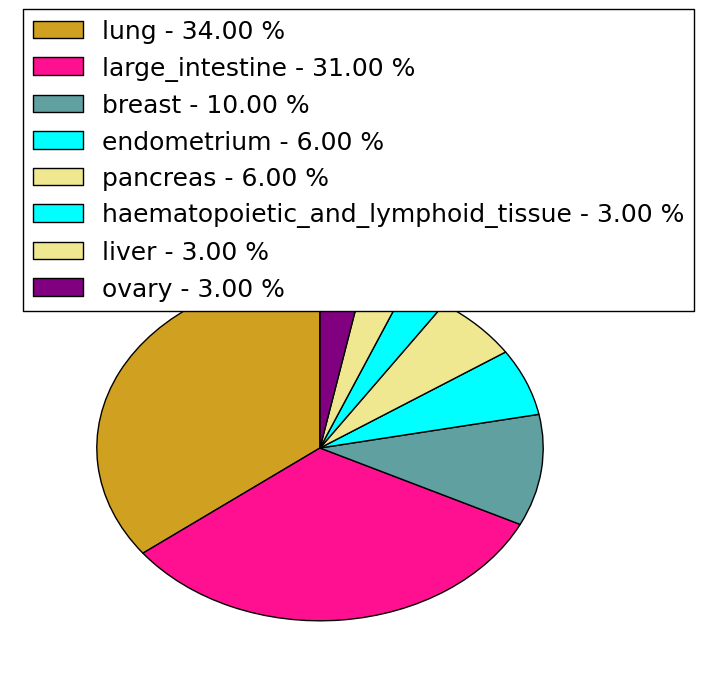
| Top |
| Stat. for Non-Synonymous SNVs (# total SNVs=29) | (# total SNVs=14) |
 | 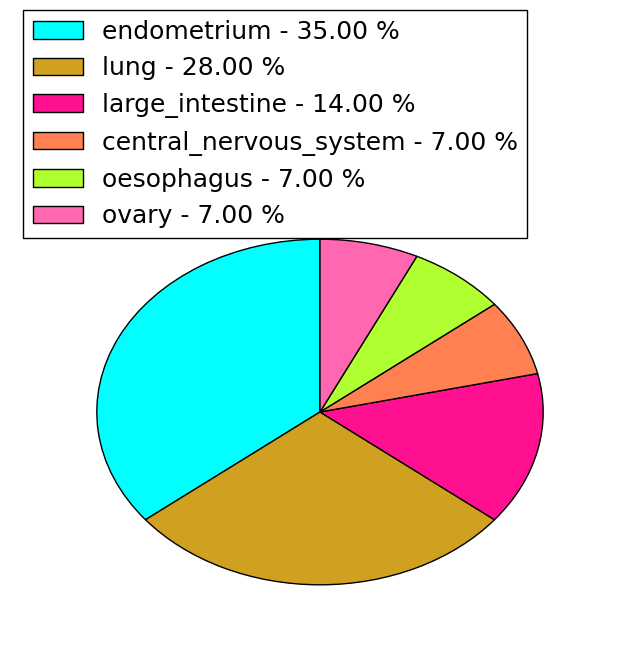 |
(# total SNVs=1) | (# total SNVs=0) |
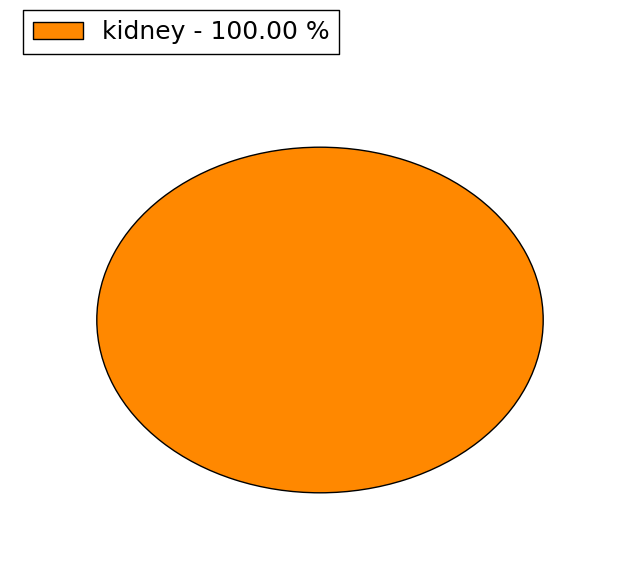 |
| Top |
| * When you move the cursor on each content, you can see more deailed mutation information on the Tooltip. Those are primary_site,primary_histology,mutation(aa),pubmedID. |
| GRCh37 position | Mutation(aa) | Unique sampleID count |
| chr1:40131256-40131256 | p.V124I | 2 |
| chr1:40124965-40124965 | p.A312V | 2 |
| chr1:40131263-40131263 | p.F121F | 2 |
| chr1:40131848-40131848 | p.E66Q | 2 |
| chr1:40131295-40131295 | p.R111W | 2 |
| chr1:40126934-40126934 | p.G186G | 2 |
| chr1:40131251-40131251 | p.L125L | 1 |
| chr1:40124933-40124933 | p.P323S | 1 |
| chr1:40131815-40131815 | p.E77K | 1 |
| chr1:40125092-40125092 | p.R270W | 1 |
| Top |
|
 |
| Point Mutation/ Tissue ID | 1 | 2 | 3 | 4 | 5 | 6 | 7 | 8 | 9 | 10 | 11 | 12 | 13 | 14 | 15 | 16 | 17 | 18 | 19 | 20 |
| # sample | 2 | 7 | 1 | 2 | 1 | 7 | 4 | 2 | 1 | 7 | 5 | 6 | ||||||||
| # mutation | 2 | 7 | 1 | 2 | 1 | 7 | 4 | 2 | 1 | 7 | 5 | 6 | ||||||||
| nonsynonymous SNV | 2 | 5 | 1 | 1 | 6 | 2 | 1 | 1 | 3 | 4 | 2 | |||||||||
| synonymous SNV | 2 | 1 | 1 | 1 | 2 | 1 | 4 | 1 | 4 |
| cf) Tissue ID; Tissue type (1; BLCA[Bladder Urothelial Carcinoma], 2; BRCA[Breast invasive carcinoma], 3; CESC[Cervical squamous cell carcinoma and endocervical adenocarcinoma], 4; COAD[Colon adenocarcinoma], 5; GBM[Glioblastoma multiforme], 6; Glioma Low Grade, 7; HNSC[Head and Neck squamous cell carcinoma], 8; KICH[Kidney Chromophobe], 9; KIRC[Kidney renal clear cell carcinoma], 10; KIRP[Kidney renal papillary cell carcinoma], 11; LAML[Acute Myeloid Leukemia], 12; LUAD[Lung adenocarcinoma], 13; LUSC[Lung squamous cell carcinoma], 14; OV[Ovarian serous cystadenocarcinoma ], 15; PAAD[Pancreatic adenocarcinoma], 16; PRAD[Prostate adenocarcinoma], 17; SKCM[Skin Cutaneous Melanoma], 18:STAD[Stomach adenocarcinoma], 19:THCA[Thyroid carcinoma], 20:UCEC[Uterine Corpus Endometrial Carcinoma]) |
| Top |
| * We represented just top 10 SNVs. When you move the cursor on each content, you can see more deailed mutation information on the Tooltip. Those are primary_site, primary_histology, mutation(aa), pubmedID. |
| Genomic Position | Mutation(aa) | Unique sampleID count |
| chr1:40131263 | p.F121F | 2 |
| chr1:40131295 | p.R111W | 2 |
| chr1:40131873 | p.V124F | 1 |
| chr1:40124988 | p.A239D | 1 |
| chr1:40126873 | p.H236Y | 1 |
| chr1:40131882 | p.F233F | 1 |
| chr1:40125029 | p.R109W | 1 |
| chr1:40126874 | p.R357W | 1 |
| chr1:40131889 | p.H228H | 1 |
| chr1:40125052 | p.A105A | 1 |
| * Copy number data were extracted from TCGA using R package TCGA-Assembler. The URLs of all public data files on TCGA DCC data server were gathered on Jan-05-2015. Function ProcessCNAData in TCGA-Assembler package was used to obtain gene-level copy number value which is calculated as the average copy number of the genomic region of a gene. |
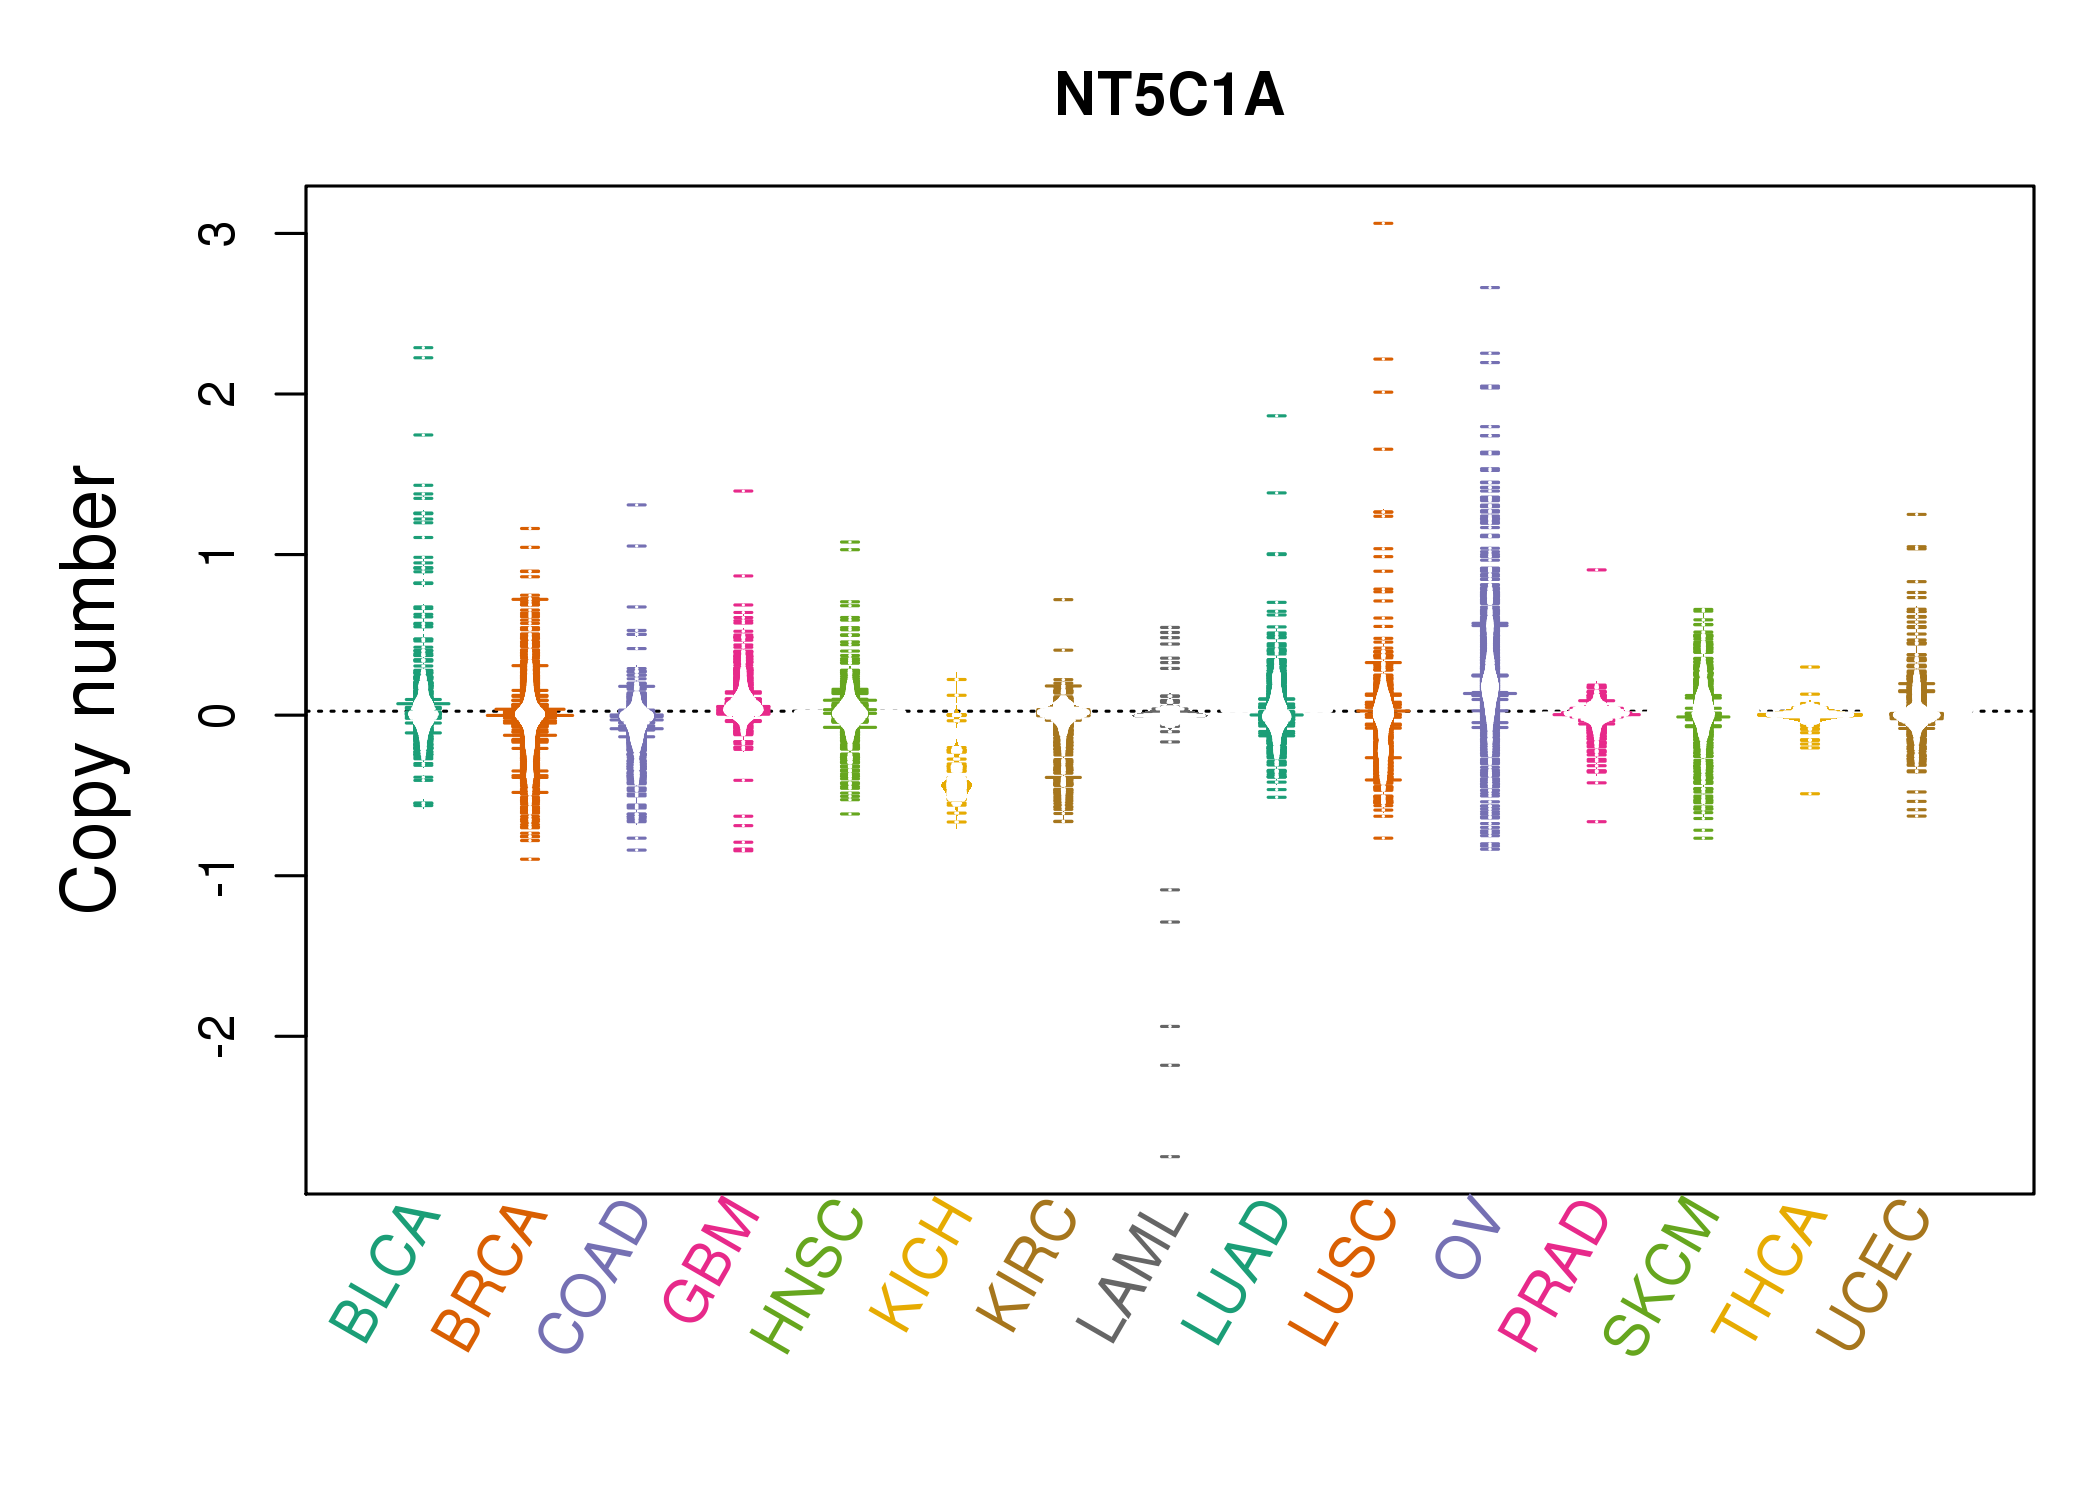 |
| cf) Tissue ID[Tissue type]: BLCA[Bladder Urothelial Carcinoma], BRCA[Breast invasive carcinoma], CESC[Cervical squamous cell carcinoma and endocervical adenocarcinoma], COAD[Colon adenocarcinoma], GBM[Glioblastoma multiforme], Glioma Low Grade, HNSC[Head and Neck squamous cell carcinoma], KICH[Kidney Chromophobe], KIRC[Kidney renal clear cell carcinoma], KIRP[Kidney renal papillary cell carcinoma], LAML[Acute Myeloid Leukemia], LUAD[Lung adenocarcinoma], LUSC[Lung squamous cell carcinoma], OV[Ovarian serous cystadenocarcinoma ], PAAD[Pancreatic adenocarcinoma], PRAD[Prostate adenocarcinoma], SKCM[Skin Cutaneous Melanoma], STAD[Stomach adenocarcinoma], THCA[Thyroid carcinoma], UCEC[Uterine Corpus Endometrial Carcinoma] |
| Top |
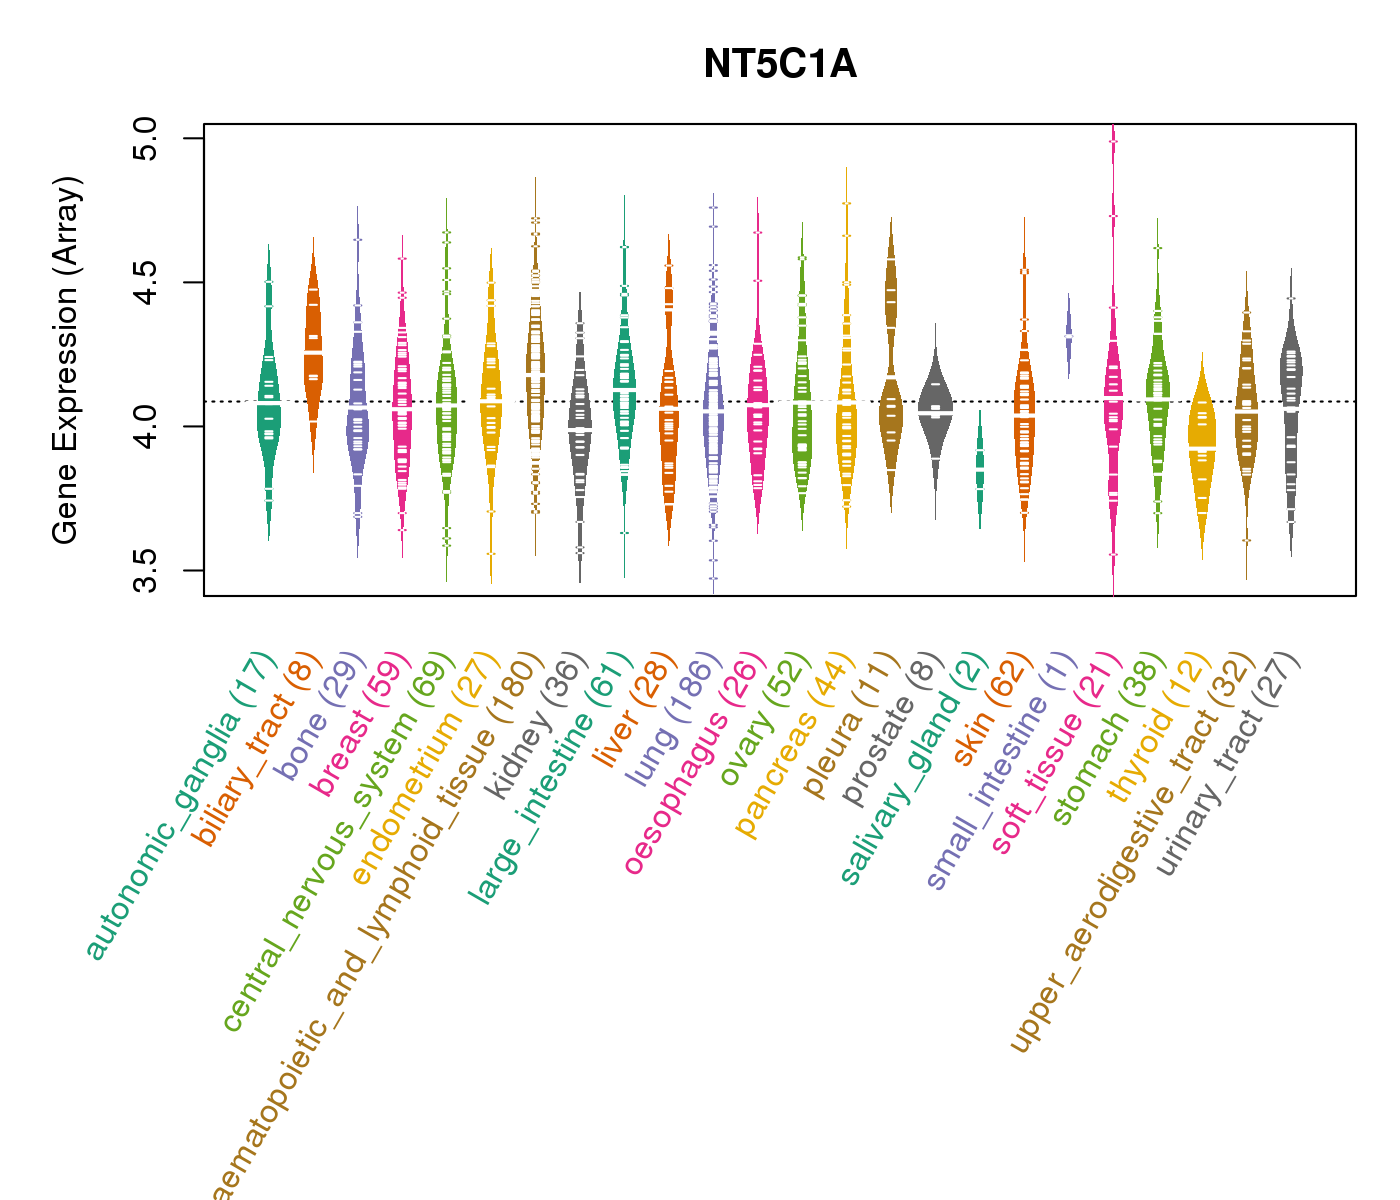
| Gene Expression for NT5C1A |
| * CCLE gene expression data were extracted from CCLE_Expression_Entrez_2012-10-18.res: Gene-centric RMA-normalized mRNA expression data. |
 |
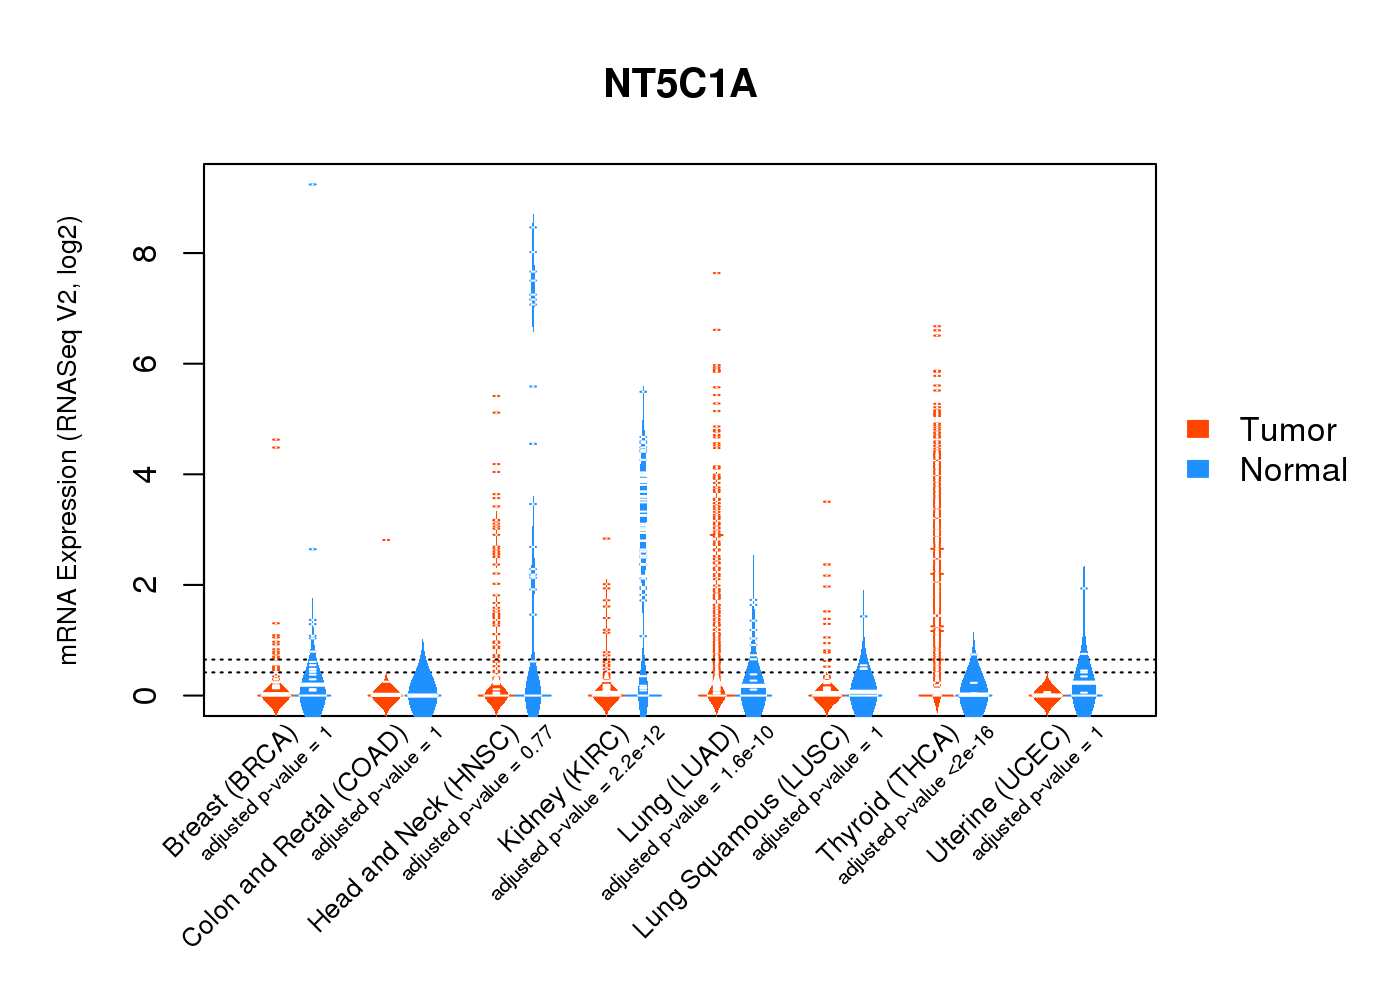
| * Normalized gene expression data of RNASeqV2 was extracted from TCGA using R package TCGA-Assembler. The URLs of all public data files on TCGA DCC data server were gathered at Jan-05-2015. Only eight cancer types have enough normal control samples for differential expression analysis. (t test, adjusted p<0.05 (using Benjamini-Hochberg FDR)) |
 |
| Top |
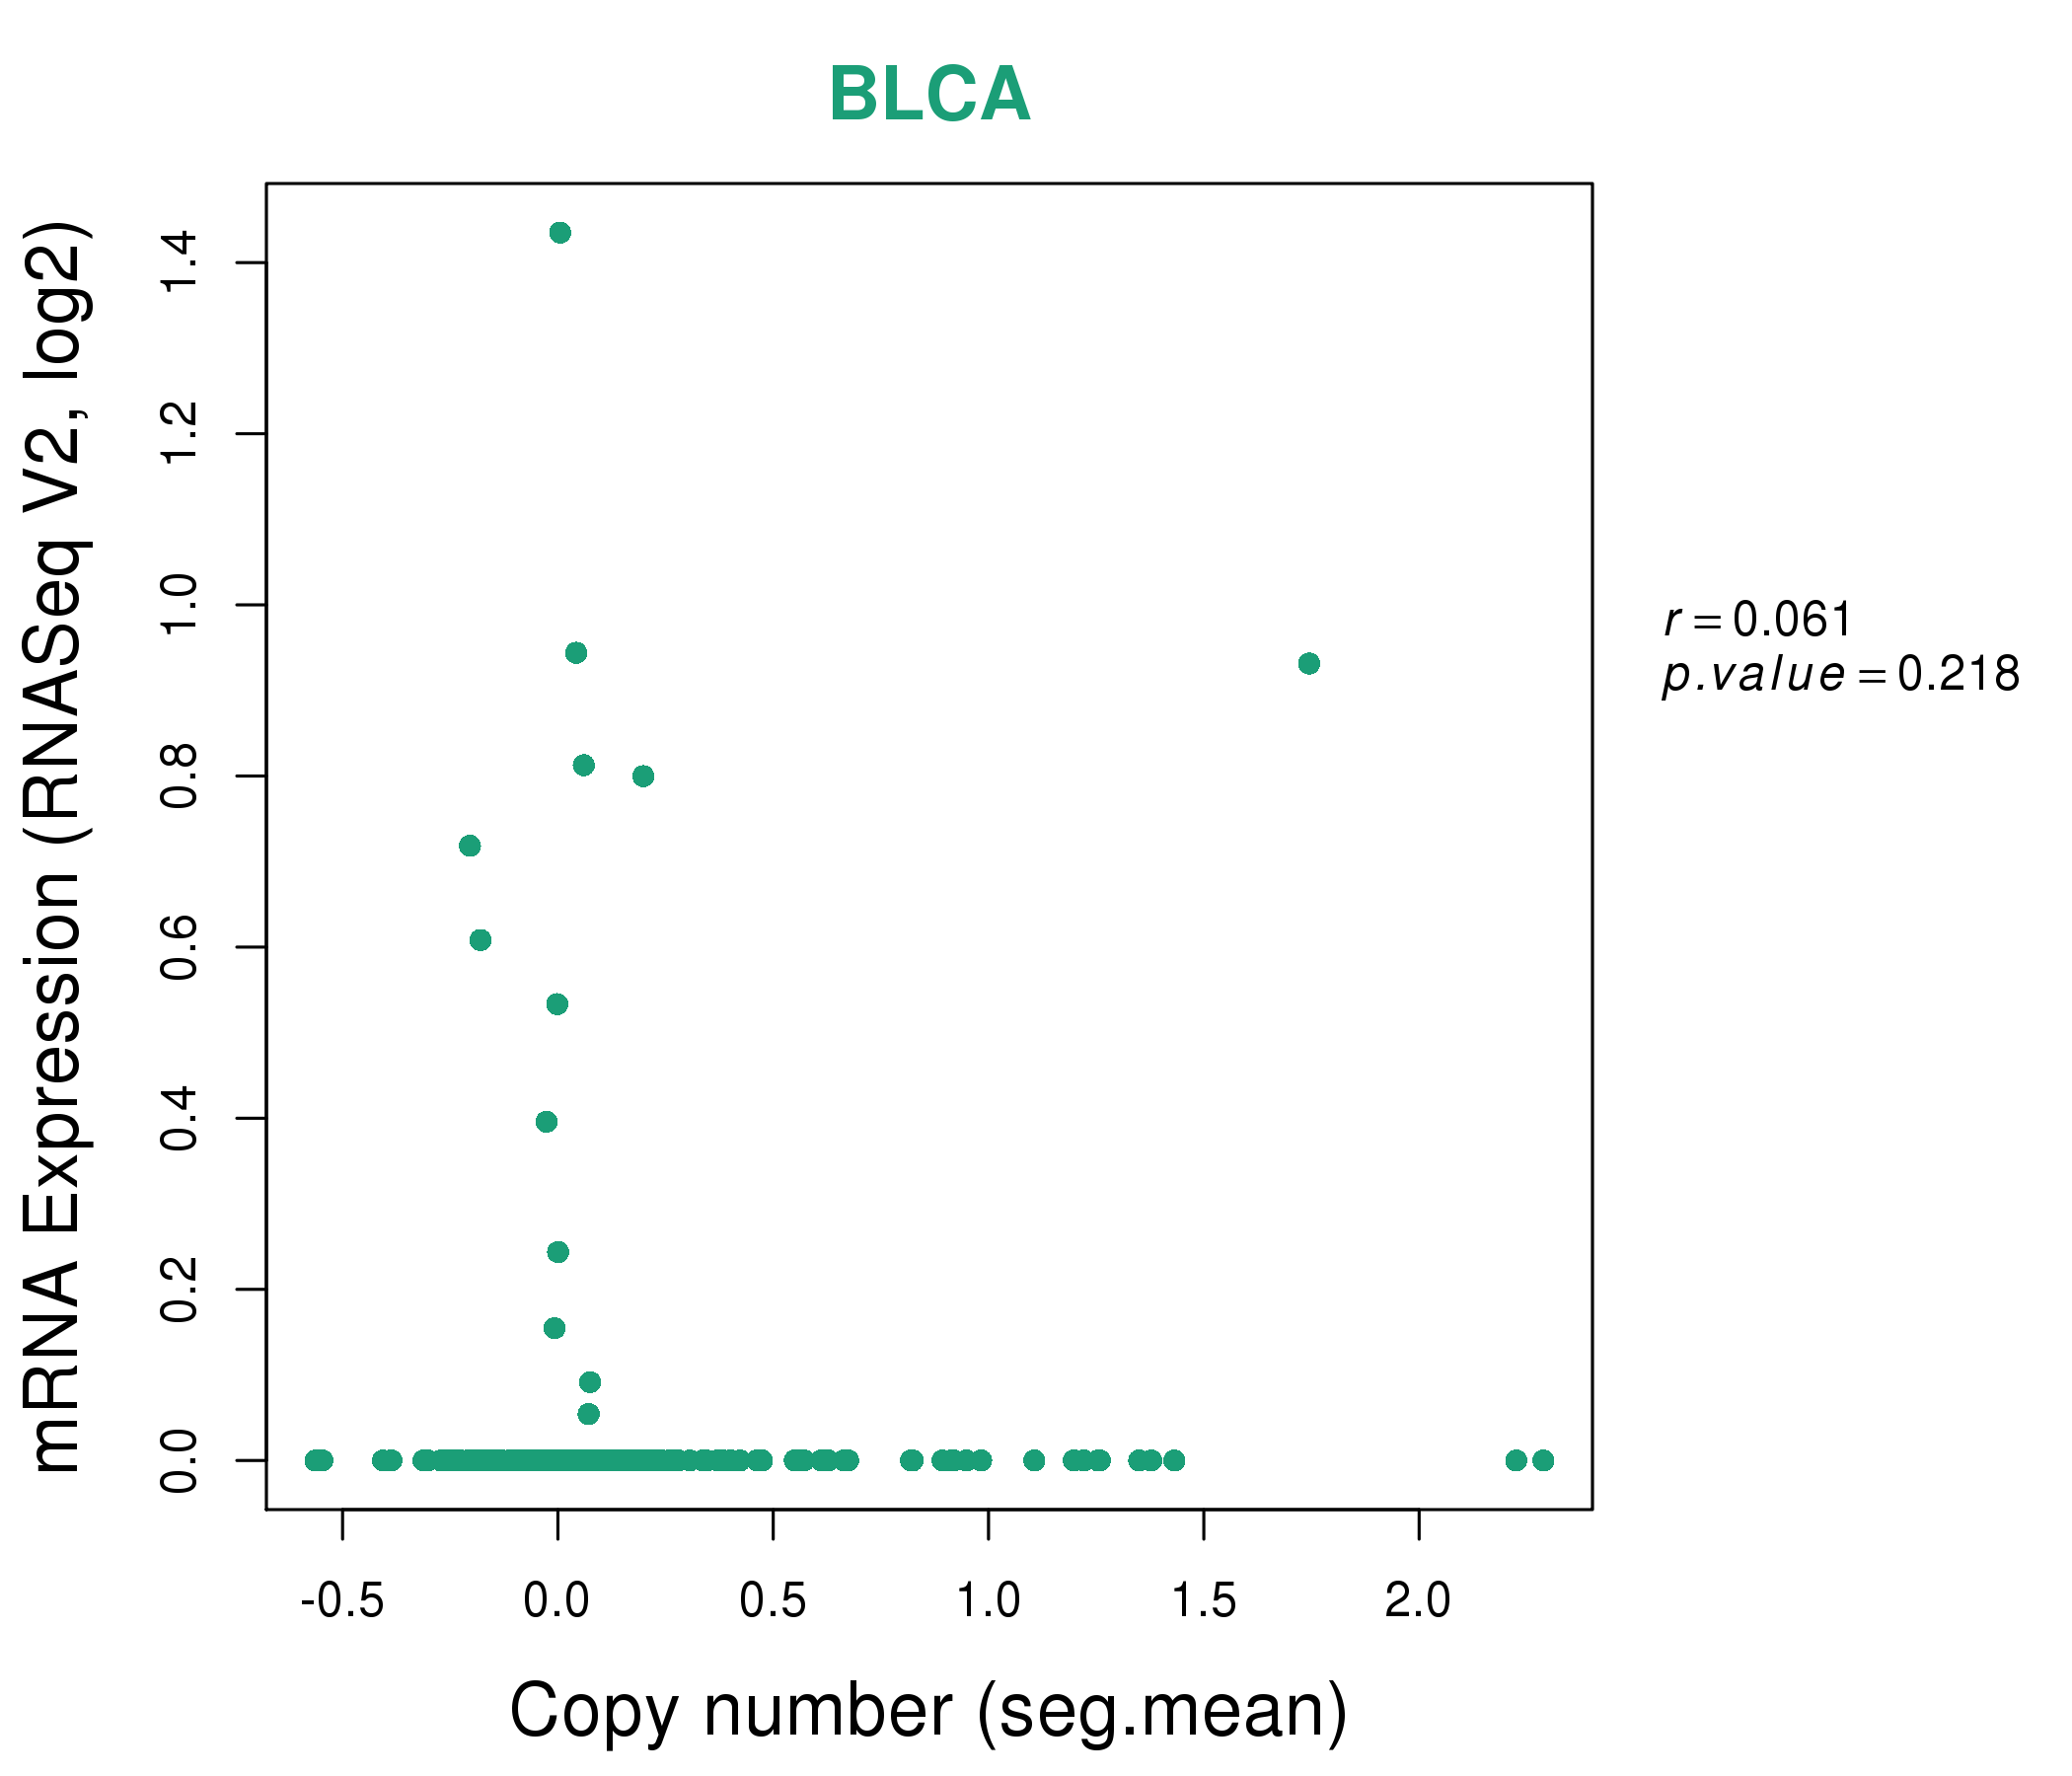
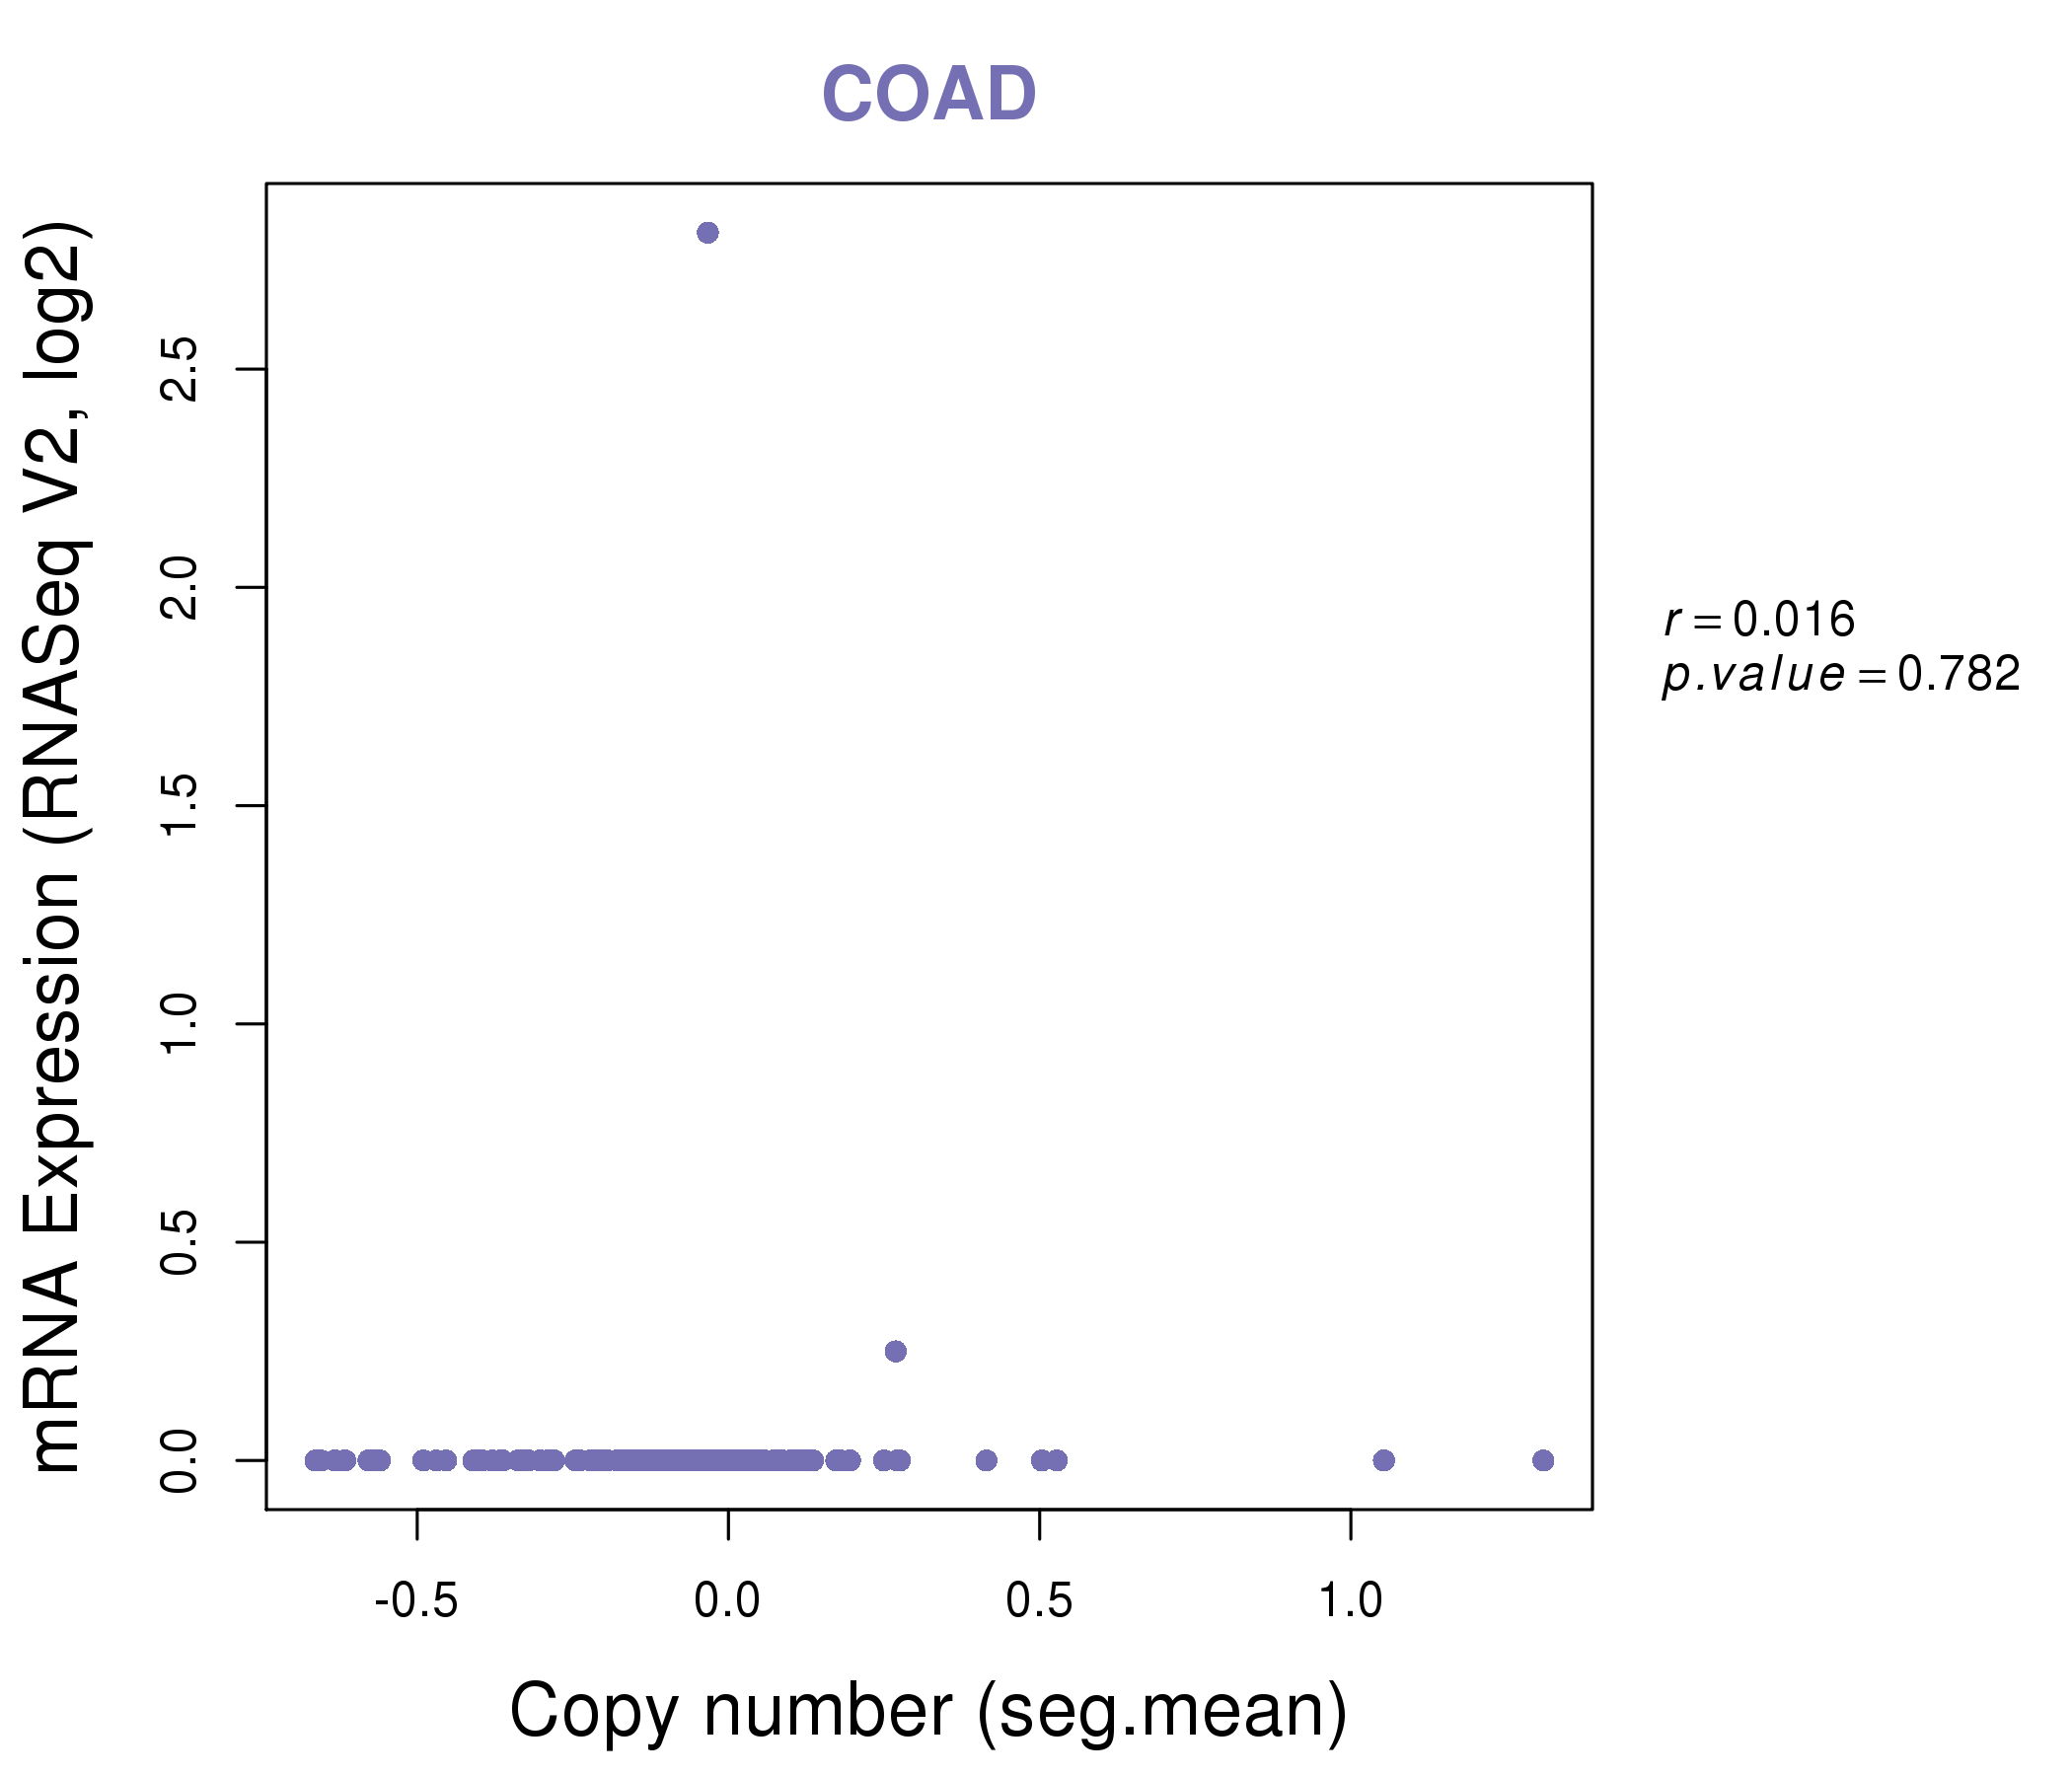
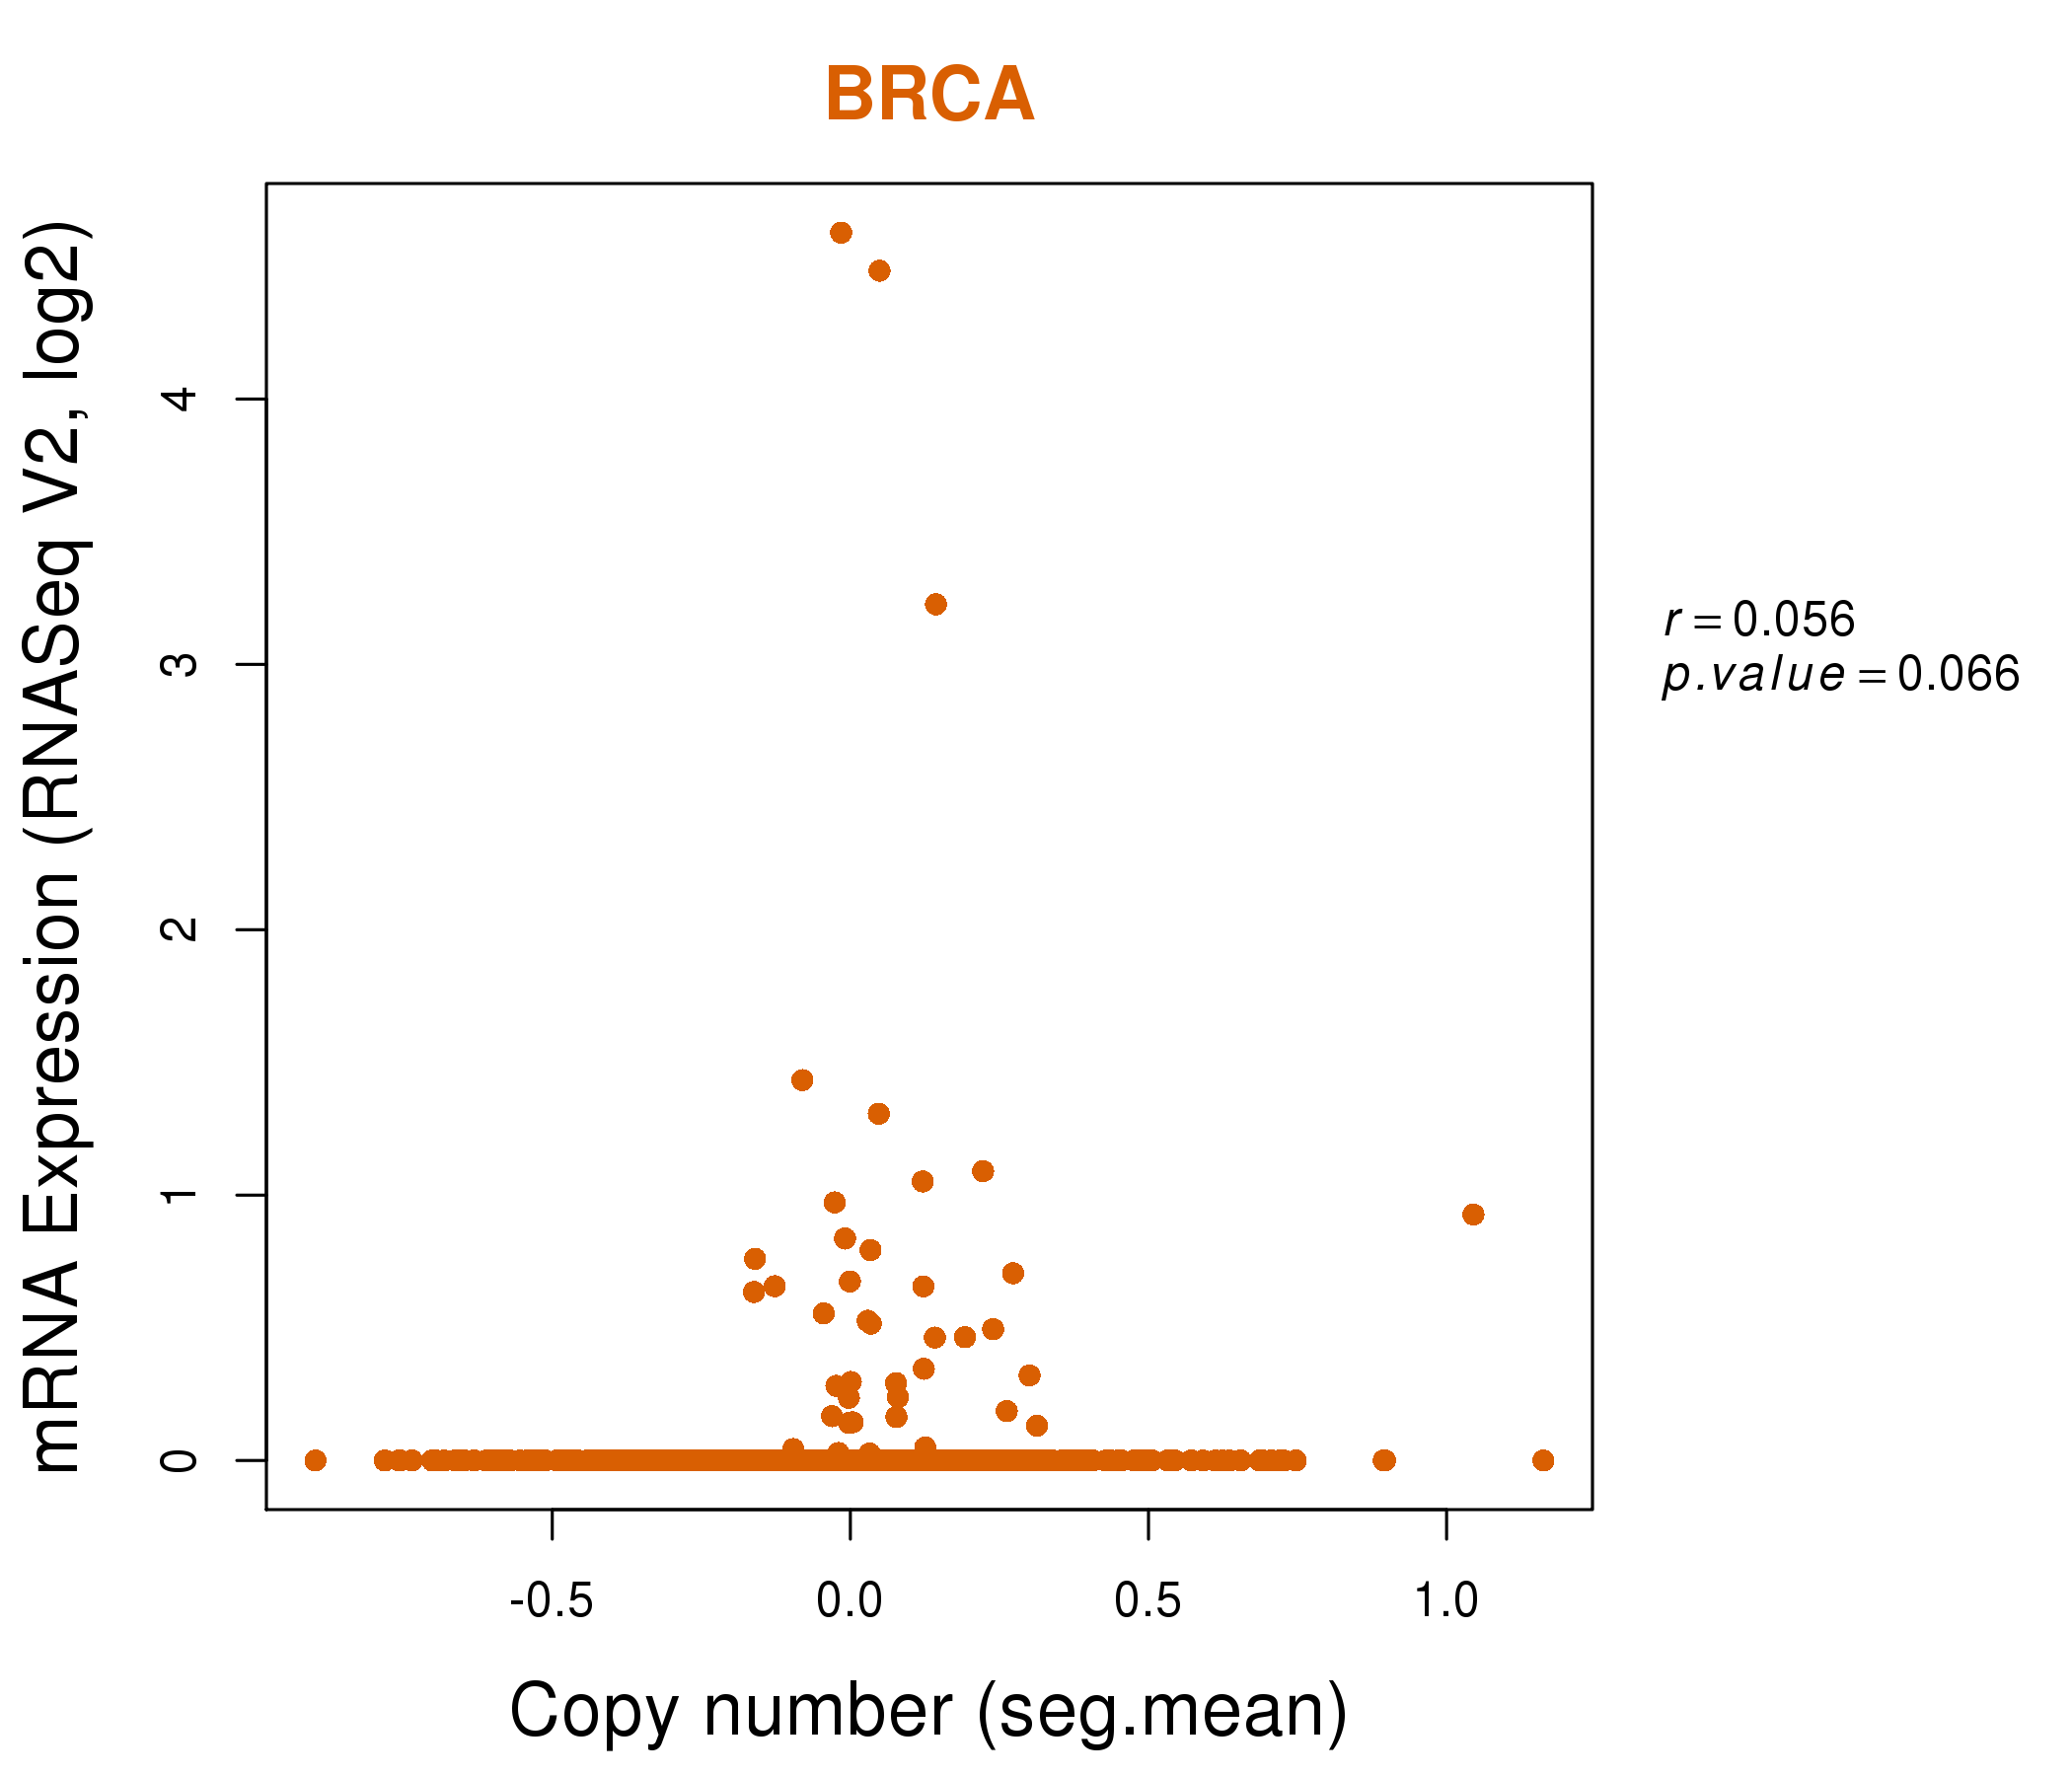
| * This plots show the correlation between CNV and gene expression. |
: Open all plots for all cancer types
 |
|
 |
|

| Top |
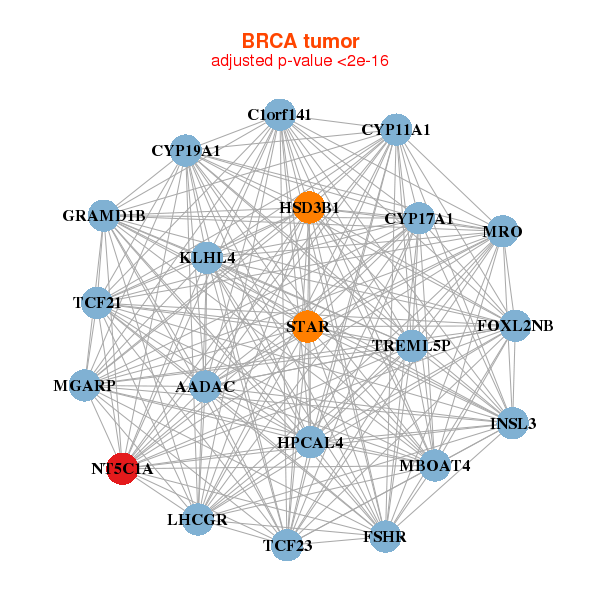
| Gene-Gene Network Information |
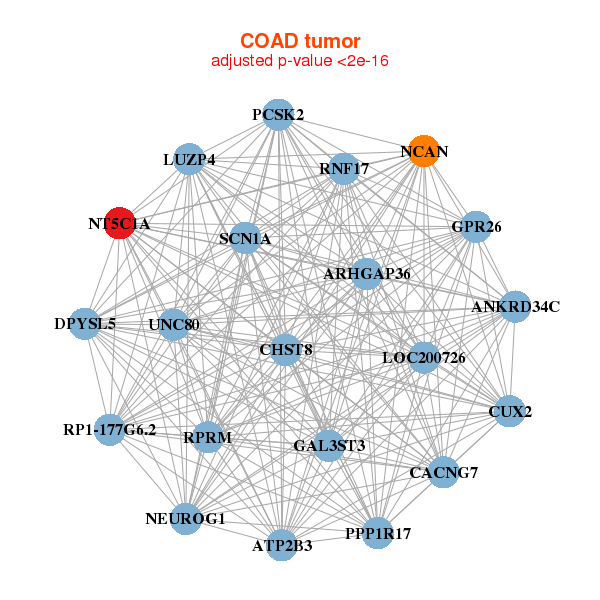
| * Co-Expression network figures were drawn using R package igraph. Only the top 20 genes with the highest correlations were shown. Red circle: input gene, orange circle: cell metabolism gene, sky circle: other gene |
: Open all plots for all cancer types
 |
| ||||
| AADAC,C1orf141,FOXL2NB,MGARP,CYP11A1,CYP17A1,CYP19A1, FSHR,GRAMD1B,HPCAL4,HSD3B1,INSL3,KLHL4,LHCGR, MBOAT4,MRO,NT5C1A,STAR,TCF21,TCF23,TREML5P | ABRA,ACTN2,APOBEC2,C10orf71,MIR1-1HG,CACNA1S,CAV3, CHRND,DUSP26,FBP2,HSPB3,LDB3,LMOD3,MURC, MYL3,MYLK2,MYO18B,MYOZ1,NT5C1A,TNNC1,TNNC2 | ||||
 |
| ||||
| ANKRD34C,ARHGAP36,ATP2B3,PPP1R17,CACNG7,CHST8,CUX2, DPYSL5,GAL3ST3,GPR26,LOC200726,LUZP4,NCAN,NEUROG1, NT5C1A,PCSK2,RNF17,RP1-177G6.2,RPRM,SCN1A,UNC80 | ADRA2B,NATD1,CCDC101,DUSP26,HDAC11,LIFR,LIN28B, MCOLN3,MKS1,NAA11,NT5C1A,OR13G1,PNLIPRP3,PRSS38, RTBDN,SELV,SLURP1,SPZ1,TRIM43,XAGE2,ZNF645 |
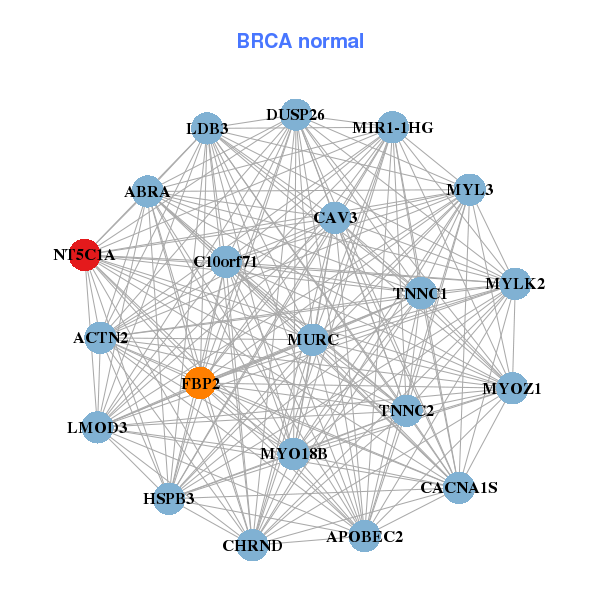
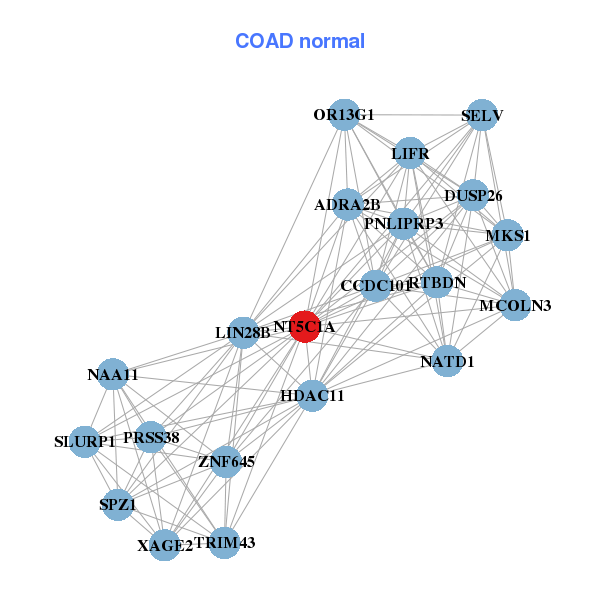
| * Co-Expression network figures were drawn using R package igraph. Only the top 20 genes with the highest correlations were shown. Red circle: input gene, orange circle: cell metabolism gene, sky circle: other gene |
: Open all plots for all cancer types
| Top |
: Open all interacting genes' information including KEGG pathway for all interacting genes from DAVID
| Top |
| Pharmacological Information for NT5C1A |
| DB Category | DB Name | DB's ID and Url link |
| * Gene Centered Interaction Network. |
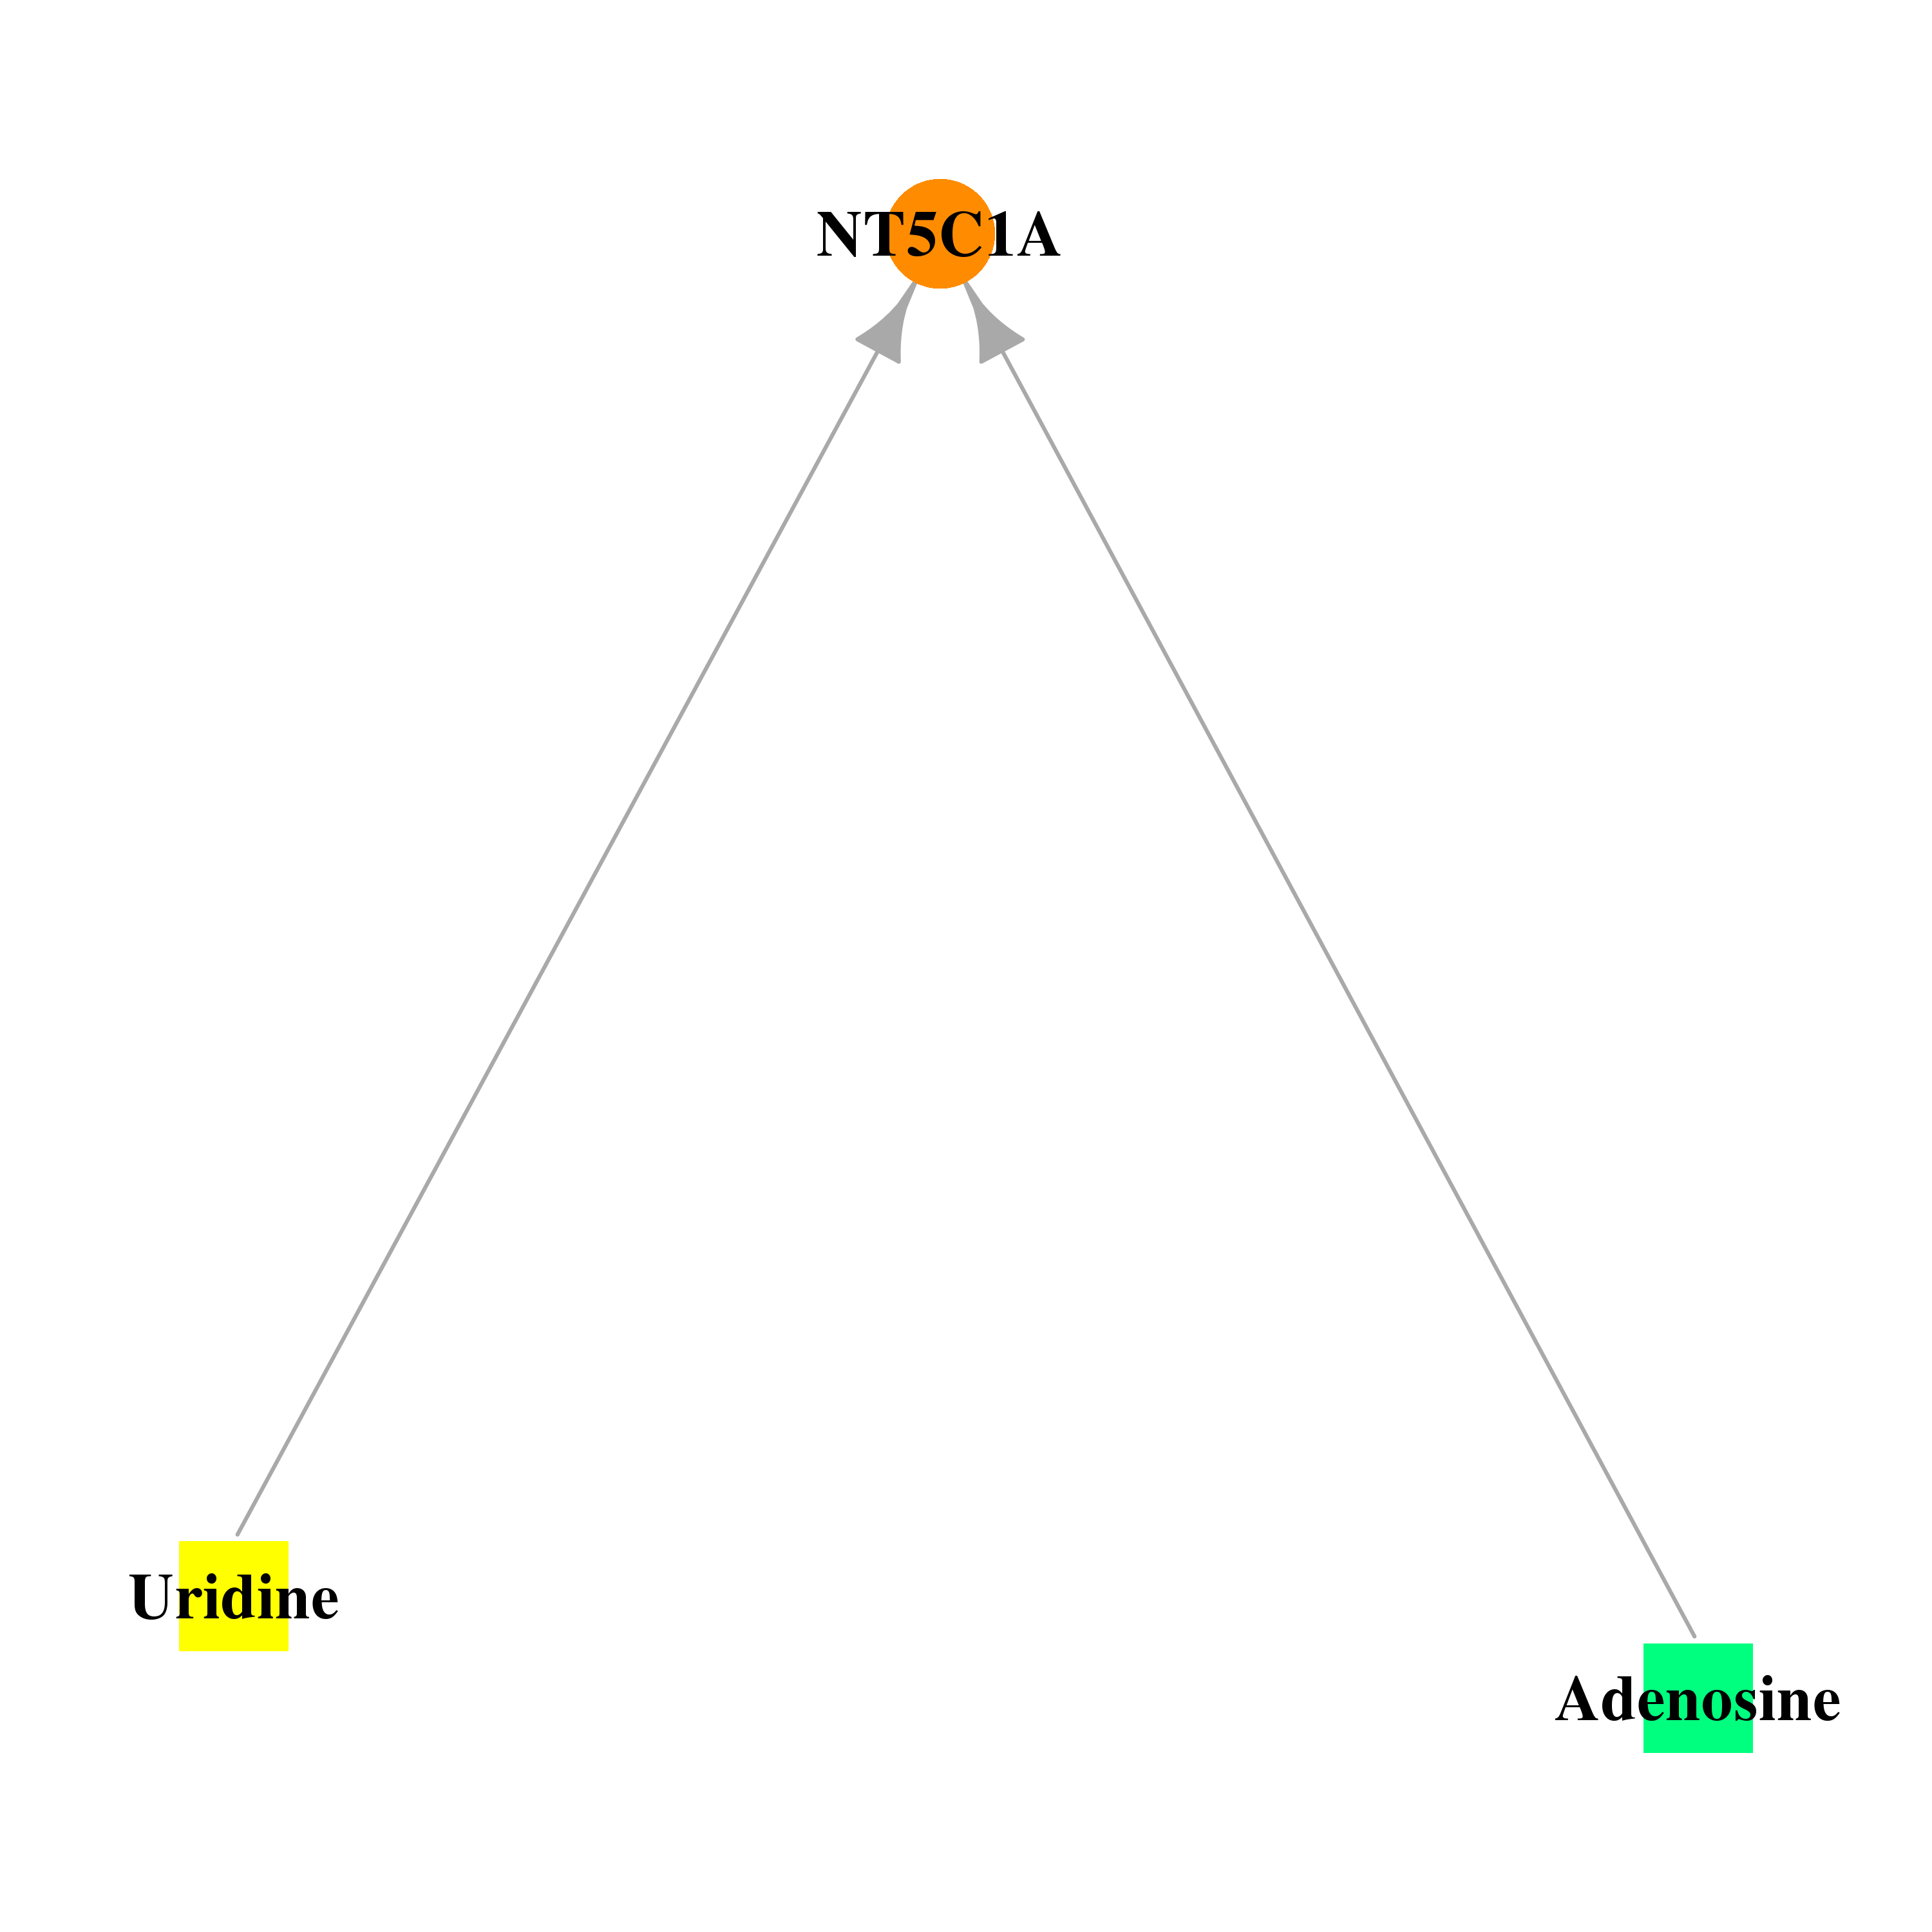 |
| * Drug Centered Interaction Network. |
| DrugBank ID | Target Name | Drug Groups | Generic Name | Drug Centered Network | Drug Structure |
| DB00640 | 5'-nucleotidase, cytosolic IA | approved; investigational | Adenosine | 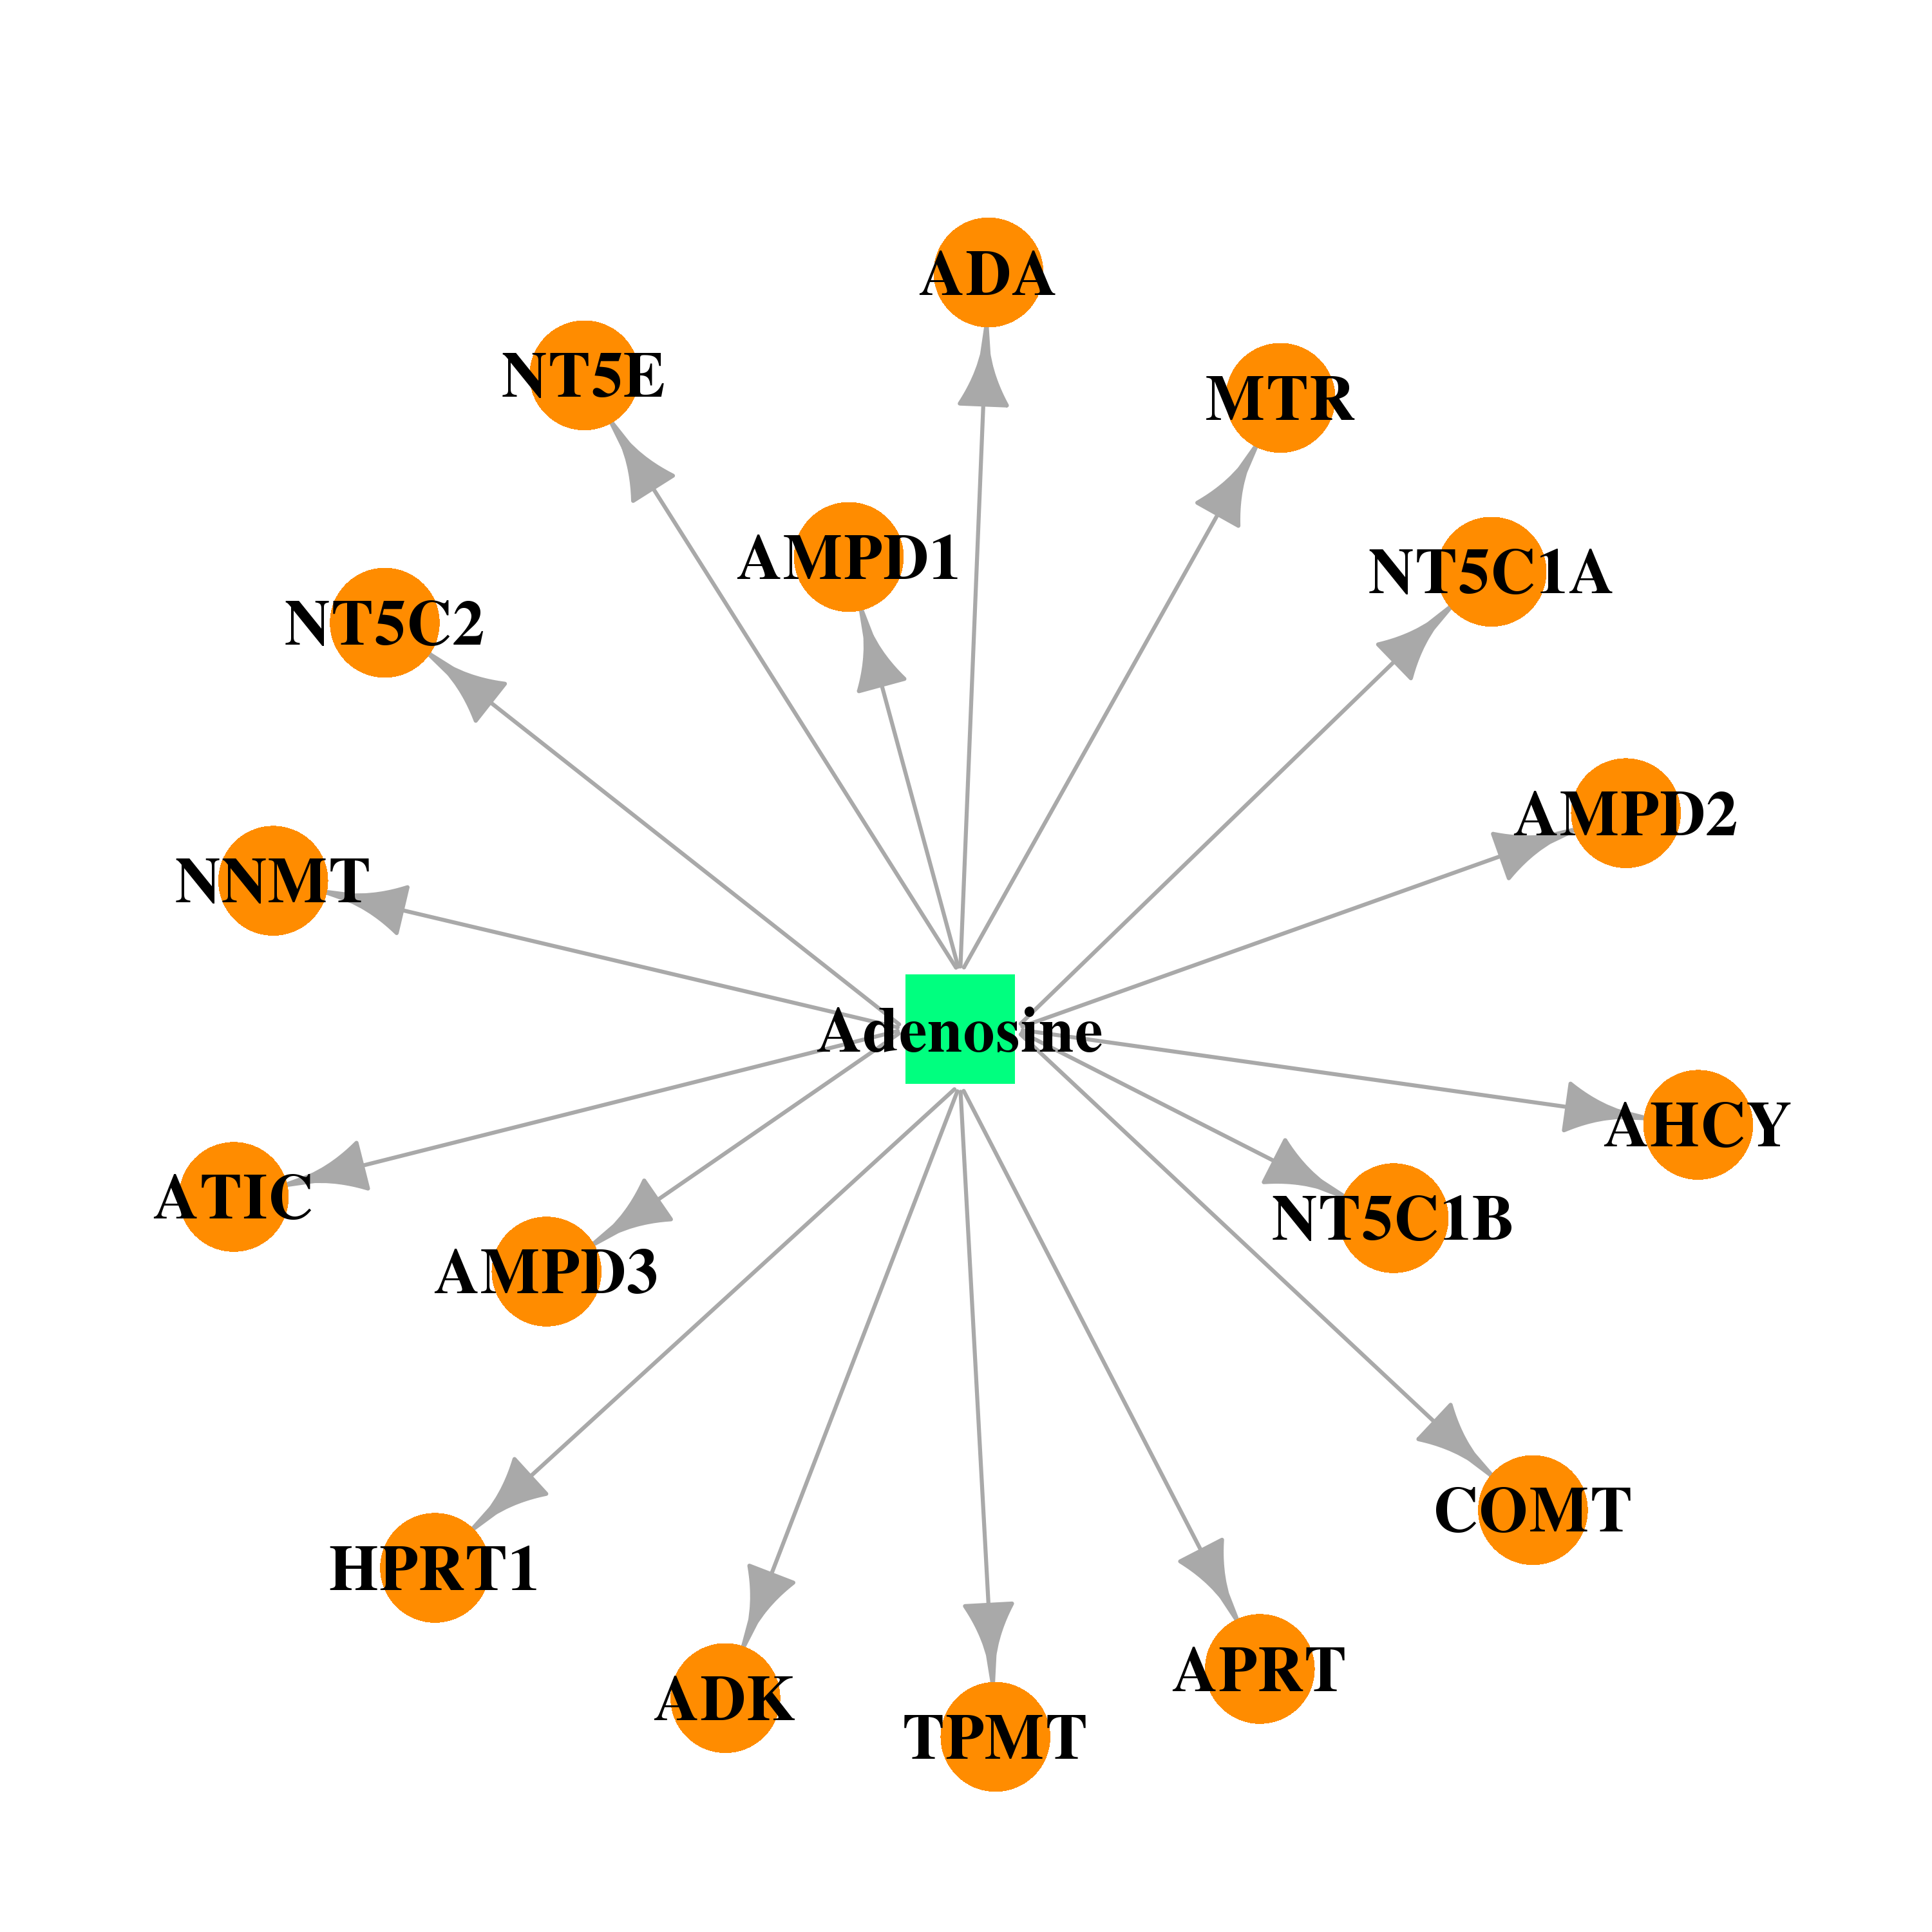 | 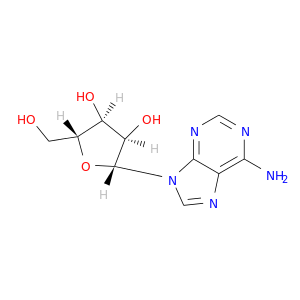 |
| DB02745 | 5'-nucleotidase, cytosolic IA | experimental | Uridine | 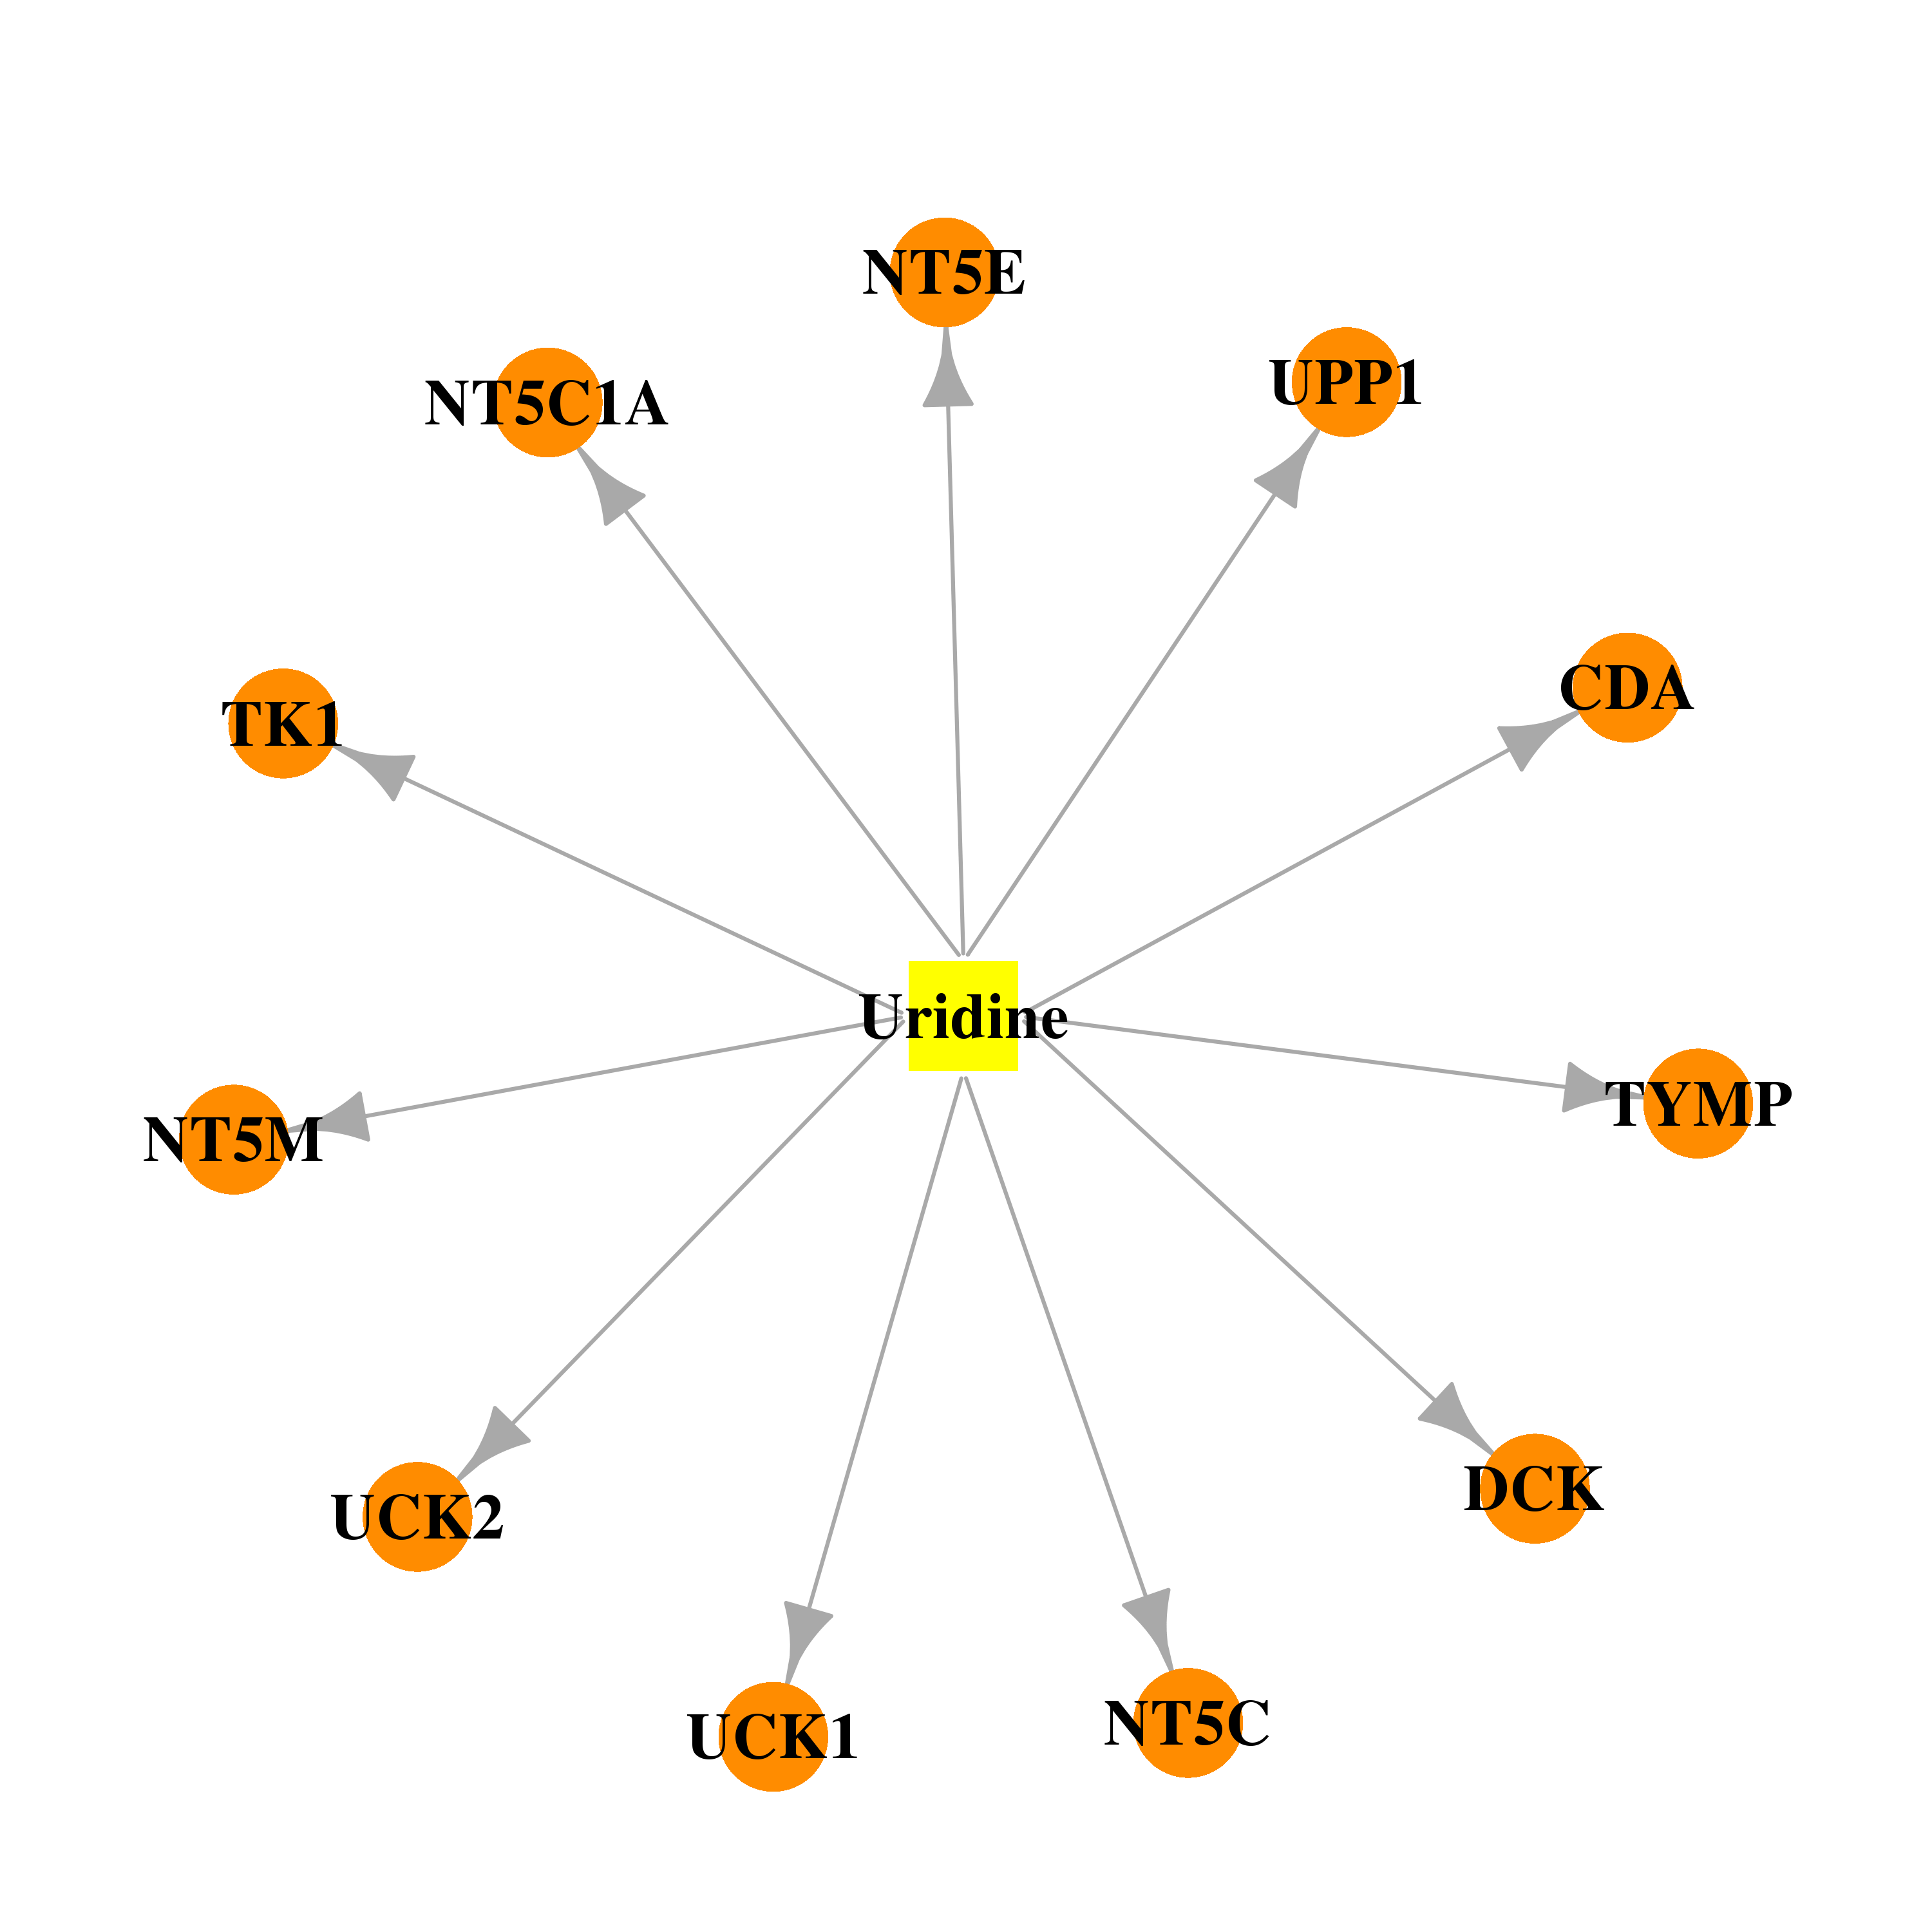 |  |
| Top |
| Cross referenced IDs for NT5C1A |
| * We obtained these cross-references from Uniprot database. It covers 150 different DBs, 18 categories. http://www.uniprot.org/help/cross_references_section |
: Open all cross reference information
|
Copyright © 2016-Present - The Univsersity of Texas Health Science Center at Houston @ |