|
||||||||||||||||||||||||||||||||||||||||||||||||||||||||||||||||||||||||||||||||||||||||||||||||||||||||||||||||||||||||||||||||||||||||||||||||||||||||||||||||||||||||||||||||||||||||||||||||||||||||||||||||||||||||||||||||||||||||||||||||||||||||||||||||||||||||||||||||||||||||||||||||||||||||||||||||||||||||||
| |
| Phenotypic Information (metabolism pathway, cancer, disease, phenome) |
| |
| |
| Gene-Gene Network Information: Co-Expression Network, Interacting Genes & KEGG |
| |
|


| Gene Summary for PLA2G12B |
| Basic gene info. | Gene symbol | PLA2G12B |
| Gene name | phospholipase A2, group XIIB | |
| Synonyms | GXIIB|GXIIIsPLA2|PLA2G13 | |
| Cytomap | UCSC genome browser: 10q22.1 | |
| Genomic location | chr10 :74694937-74714510 | |
| Type of gene | protein-coding | |
| RefGenes | NM_032562.3, | |
| Ensembl id | ENSG00000138308 | |
| Description | group XIIB secretory phospholipase A2-like proteingroup XIII secreted phospholipase A2group XIII secretory phospholipase A2-like proteinphospholipase A2, group XIIIsPLA2-GXIIB | |
| Modification date | 20141207 | |
| dbXrefs | MIM : 611653 | |
| HGNC : HGNC | ||
| Ensembl : ENSG00000138308 | ||
| HPRD : 10155 | ||
| Vega : OTTHUMG00000018446 | ||
| Protein | UniProt: go to UniProt's Cross Reference DB Table | |
| Expression | CleanEX: HS_PLA2G12B | |
| BioGPS: 84647 | ||
| Gene Expression Atlas: ENSG00000138308 | ||
| The Human Protein Atlas: ENSG00000138308 | ||
| Pathway | NCI Pathway Interaction Database: PLA2G12B | |
| KEGG: PLA2G12B | ||
| REACTOME: PLA2G12B | ||
| ConsensusPathDB | ||
| Pathway Commons: PLA2G12B | ||
| Metabolism | MetaCyc: PLA2G12B | |
| HUMANCyc: PLA2G12B | ||
| Regulation | Ensembl's Regulation: ENSG00000138308 | |
| miRBase: chr10 :74,694,937-74,714,510 | ||
| TargetScan: NM_032562 | ||
| cisRED: ENSG00000138308 | ||
| Context | iHOP: PLA2G12B | |
| cancer metabolism search in PubMed: PLA2G12B | ||
| UCL Cancer Institute: PLA2G12B | ||
| Assigned class in ccmGDB | C | |
| Top |
| Phenotypic Information for PLA2G12B(metabolism pathway, cancer, disease, phenome) |
| Cancer | CGAP: PLA2G12B |
| Familial Cancer Database: PLA2G12B | |
| * This gene is included in those cancer gene databases. |
|
|
|
|
|
| . | ||||||||||||||||||||||||||||||||||||||||||||||||||||||||||||||||||||||||||||||||||||||||||||||||||||||||||||||||||||||||||||||||||||||||||||||||||||||||||||||||||||||||||||||||||||||||||||||||||||||||||||||||||||||||||||||||||||||||||||||||||||||||||||||||||||||||||||||||||||||||||||||||||||||||||||||||||||
Oncogene 1 | Significant driver gene in | |||||||||||||||||||||||||||||||||||||||||||||||||||||||||||||||||||||||||||||||||||||||||||||||||||||||||||||||||||||||||||||||||||||||||||||||||||||||||||||||||||||||||||||||||||||||||||||||||||||||||||||||||||||||||||||||||||||||||||||||||||||||||||||||||||||||||||||||||||||||||||||||||||||||||||||||||||||||||
| cf) number; DB name 1 Oncogene; http://nar.oxfordjournals.org/content/35/suppl_1/D721.long, 2 Tumor Suppressor gene; https://bioinfo.uth.edu/TSGene/, 3 Cancer Gene Census; http://www.nature.com/nrc/journal/v4/n3/abs/nrc1299.html, 4 CancerGenes; http://nar.oxfordjournals.org/content/35/suppl_1/D721.long, 5 Network of Cancer Gene; http://ncg.kcl.ac.uk/index.php, 1Therapeutic Vulnerabilities in Cancer; http://cbio.mskcc.org/cancergenomics/statius/ |
| KEGG_GLYCEROPHOSPHOLIPID_METABOLISM KEGG_ARACHIDONIC_ACID_METABOLISM KEGG_LINOLEIC_ACID_METABOLISM KEGG_ALPHA_LINOLENIC_ACID_METABOLISM | |
| Mutations for PLA2G12B |
| * Under tables are showing count per each tissue to give us broad intuition about tissue specific mutation patterns.You can go to the detailed page for each mutation database's web site. |
| There's no structural variation information in COSMIC data for this gene. |
| * From mRNA Sanger sequences, Chitars2.0 arranged chimeric transcripts. This table shows PLA2G12B related fusion information. |
| ID | Head Gene | Tail Gene | Accession | Gene_a | qStart_a | qEnd_a | Chromosome_a | tStart_a | tEnd_a | Gene_a | qStart_a | qEnd_a | Chromosome_a | tStart_a | tEnd_a |
| Top |
| Mutation type/ Tissue ID | brca | cns | cerv | endome | haematopo | kidn | Lintest | liver | lung | ns | ovary | pancre | prost | skin | stoma | thyro | urina | |||
| Total # sample | 1 | |||||||||||||||||||
| GAIN (# sample) | 1 | |||||||||||||||||||
| LOSS (# sample) |
| cf) Tissue ID; Tissue type (1; Breast, 2; Central_nervous_system, 3; Cervix, 4; Endometrium, 5; Haematopoietic_and_lymphoid_tissue, 6; Kidney, 7; Large_intestine, 8; Liver, 9; Lung, 10; NS, 11; Ovary, 12; Pancreas, 13; Prostate, 14; Skin, 15; Stomach, 16; Thyroid, 17; Urinary_tract) |
| Top |
|
 |
| Top |
| Stat. for Non-Synonymous SNVs (# total SNVs=7) | (# total SNVs=7) |
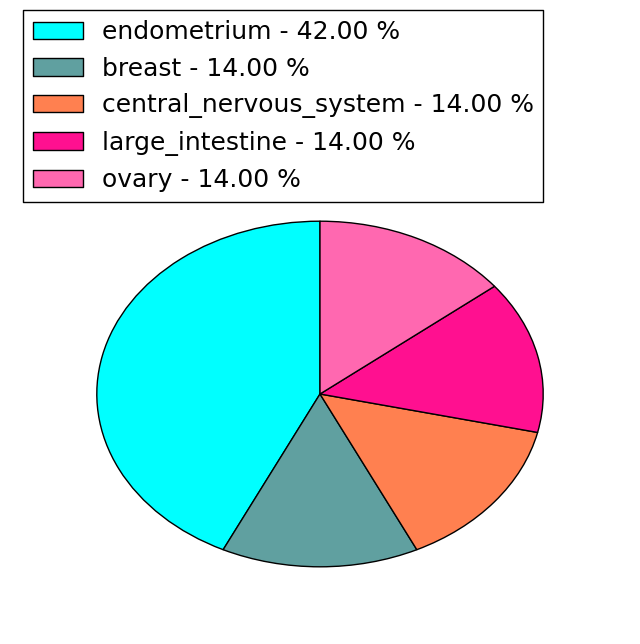 | 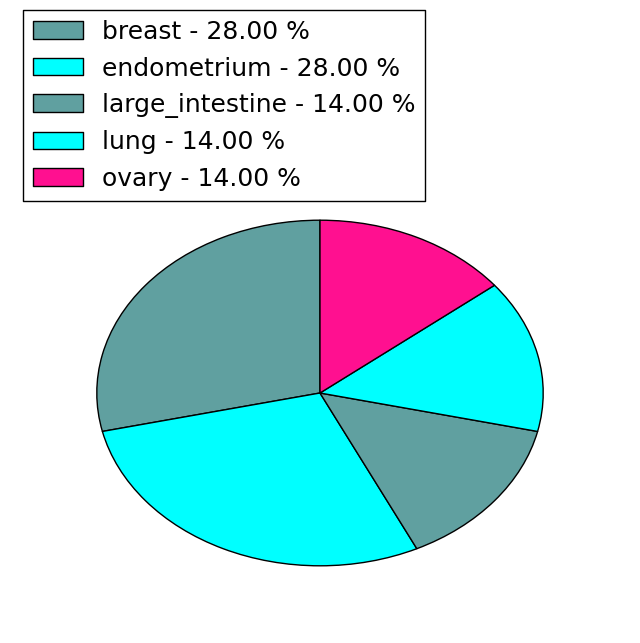 |
(# total SNVs=2) | (# total SNVs=0) |
 |
| Top |
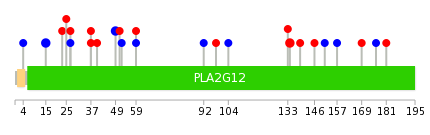
| * When you move the cursor on each content, you can see more deailed mutation information on the Tooltip. Those are primary_site,primary_histology,mutation(aa),pubmedID. |
| GRCh37 position | Mutation(aa) | Unique sampleID count |
| chr10:74700957-74700957 | p.R146W | 2 |
| chr10:74700992-74700992 | p.R134Q | 2 |
| chr10:74714297-74714297 | p.Y49Y | 2 |
| chr10:74714335-74714339 | p.L36fs*7 | 1 |
| chr10:74700926-74700926 | p.? | 1 |
| chr10:74702498-74702498 | p.G71E | 1 |
| chr10:74714363-74714363 | p.T27T | 1 |
| chr10:74700940-74700940 | p.V151V | 1 |
| chr10:74714239-74714239 | p.R69* | 1 |
| chr10:74714364-74714364 | p.T27M | 1 |
| Top |
|
 |
| Point Mutation/ Tissue ID | 1 | 2 | 3 | 4 | 5 | 6 | 7 | 8 | 9 | 10 | 11 | 12 | 13 | 14 | 15 | 16 | 17 | 18 | 19 | 20 |
| # sample | 2 | 3 | 1 | 4 | 2 | 5 | 4 | 4 | ||||||||||||
| # mutation | 2 | 2 | 1 | 4 | 2 | 8 | 4 | 4 | ||||||||||||
| nonsynonymous SNV | 1 | 1 | 3 | 1 | 4 | 3 | 2 | |||||||||||||
| synonymous SNV | 2 | 1 | 1 | 1 | 4 | 1 | 2 |
| cf) Tissue ID; Tissue type (1; BLCA[Bladder Urothelial Carcinoma], 2; BRCA[Breast invasive carcinoma], 3; CESC[Cervical squamous cell carcinoma and endocervical adenocarcinoma], 4; COAD[Colon adenocarcinoma], 5; GBM[Glioblastoma multiforme], 6; Glioma Low Grade, 7; HNSC[Head and Neck squamous cell carcinoma], 8; KICH[Kidney Chromophobe], 9; KIRC[Kidney renal clear cell carcinoma], 10; KIRP[Kidney renal papillary cell carcinoma], 11; LAML[Acute Myeloid Leukemia], 12; LUAD[Lung adenocarcinoma], 13; LUSC[Lung squamous cell carcinoma], 14; OV[Ovarian serous cystadenocarcinoma ], 15; PAAD[Pancreatic adenocarcinoma], 16; PRAD[Prostate adenocarcinoma], 17; SKCM[Skin Cutaneous Melanoma], 18:STAD[Stomach adenocarcinoma], 19:THCA[Thyroid carcinoma], 20:UCEC[Uterine Corpus Endometrial Carcinoma]) |
| Top |
| * We represented just top 10 SNVs. When you move the cursor on each content, you can see more deailed mutation information on the Tooltip. Those are primary_site, primary_histology, mutation(aa), pubmedID. |
| Genomic Position | Mutation(aa) | Unique sampleID count |
| chr10:74714297 | p.G15G | 2 |
| chr10:74700992 | p.R134Q | 2 |
| chr10:74714335 | p.Y49Y | 2 |
| chr10:74714399 | p.R37G | 2 |
| chr10:74700957 | p.A4A | 1 |
| chr10:74700977 | p.F133L | 1 |
| chr10:74714325 | p.G104G | 1 |
| chr10:74700994 | p.P98L | 1 |
| chr10:74714363 | p.F92F | 1 |
| chr10:74701081 | p.G59G | 1 |
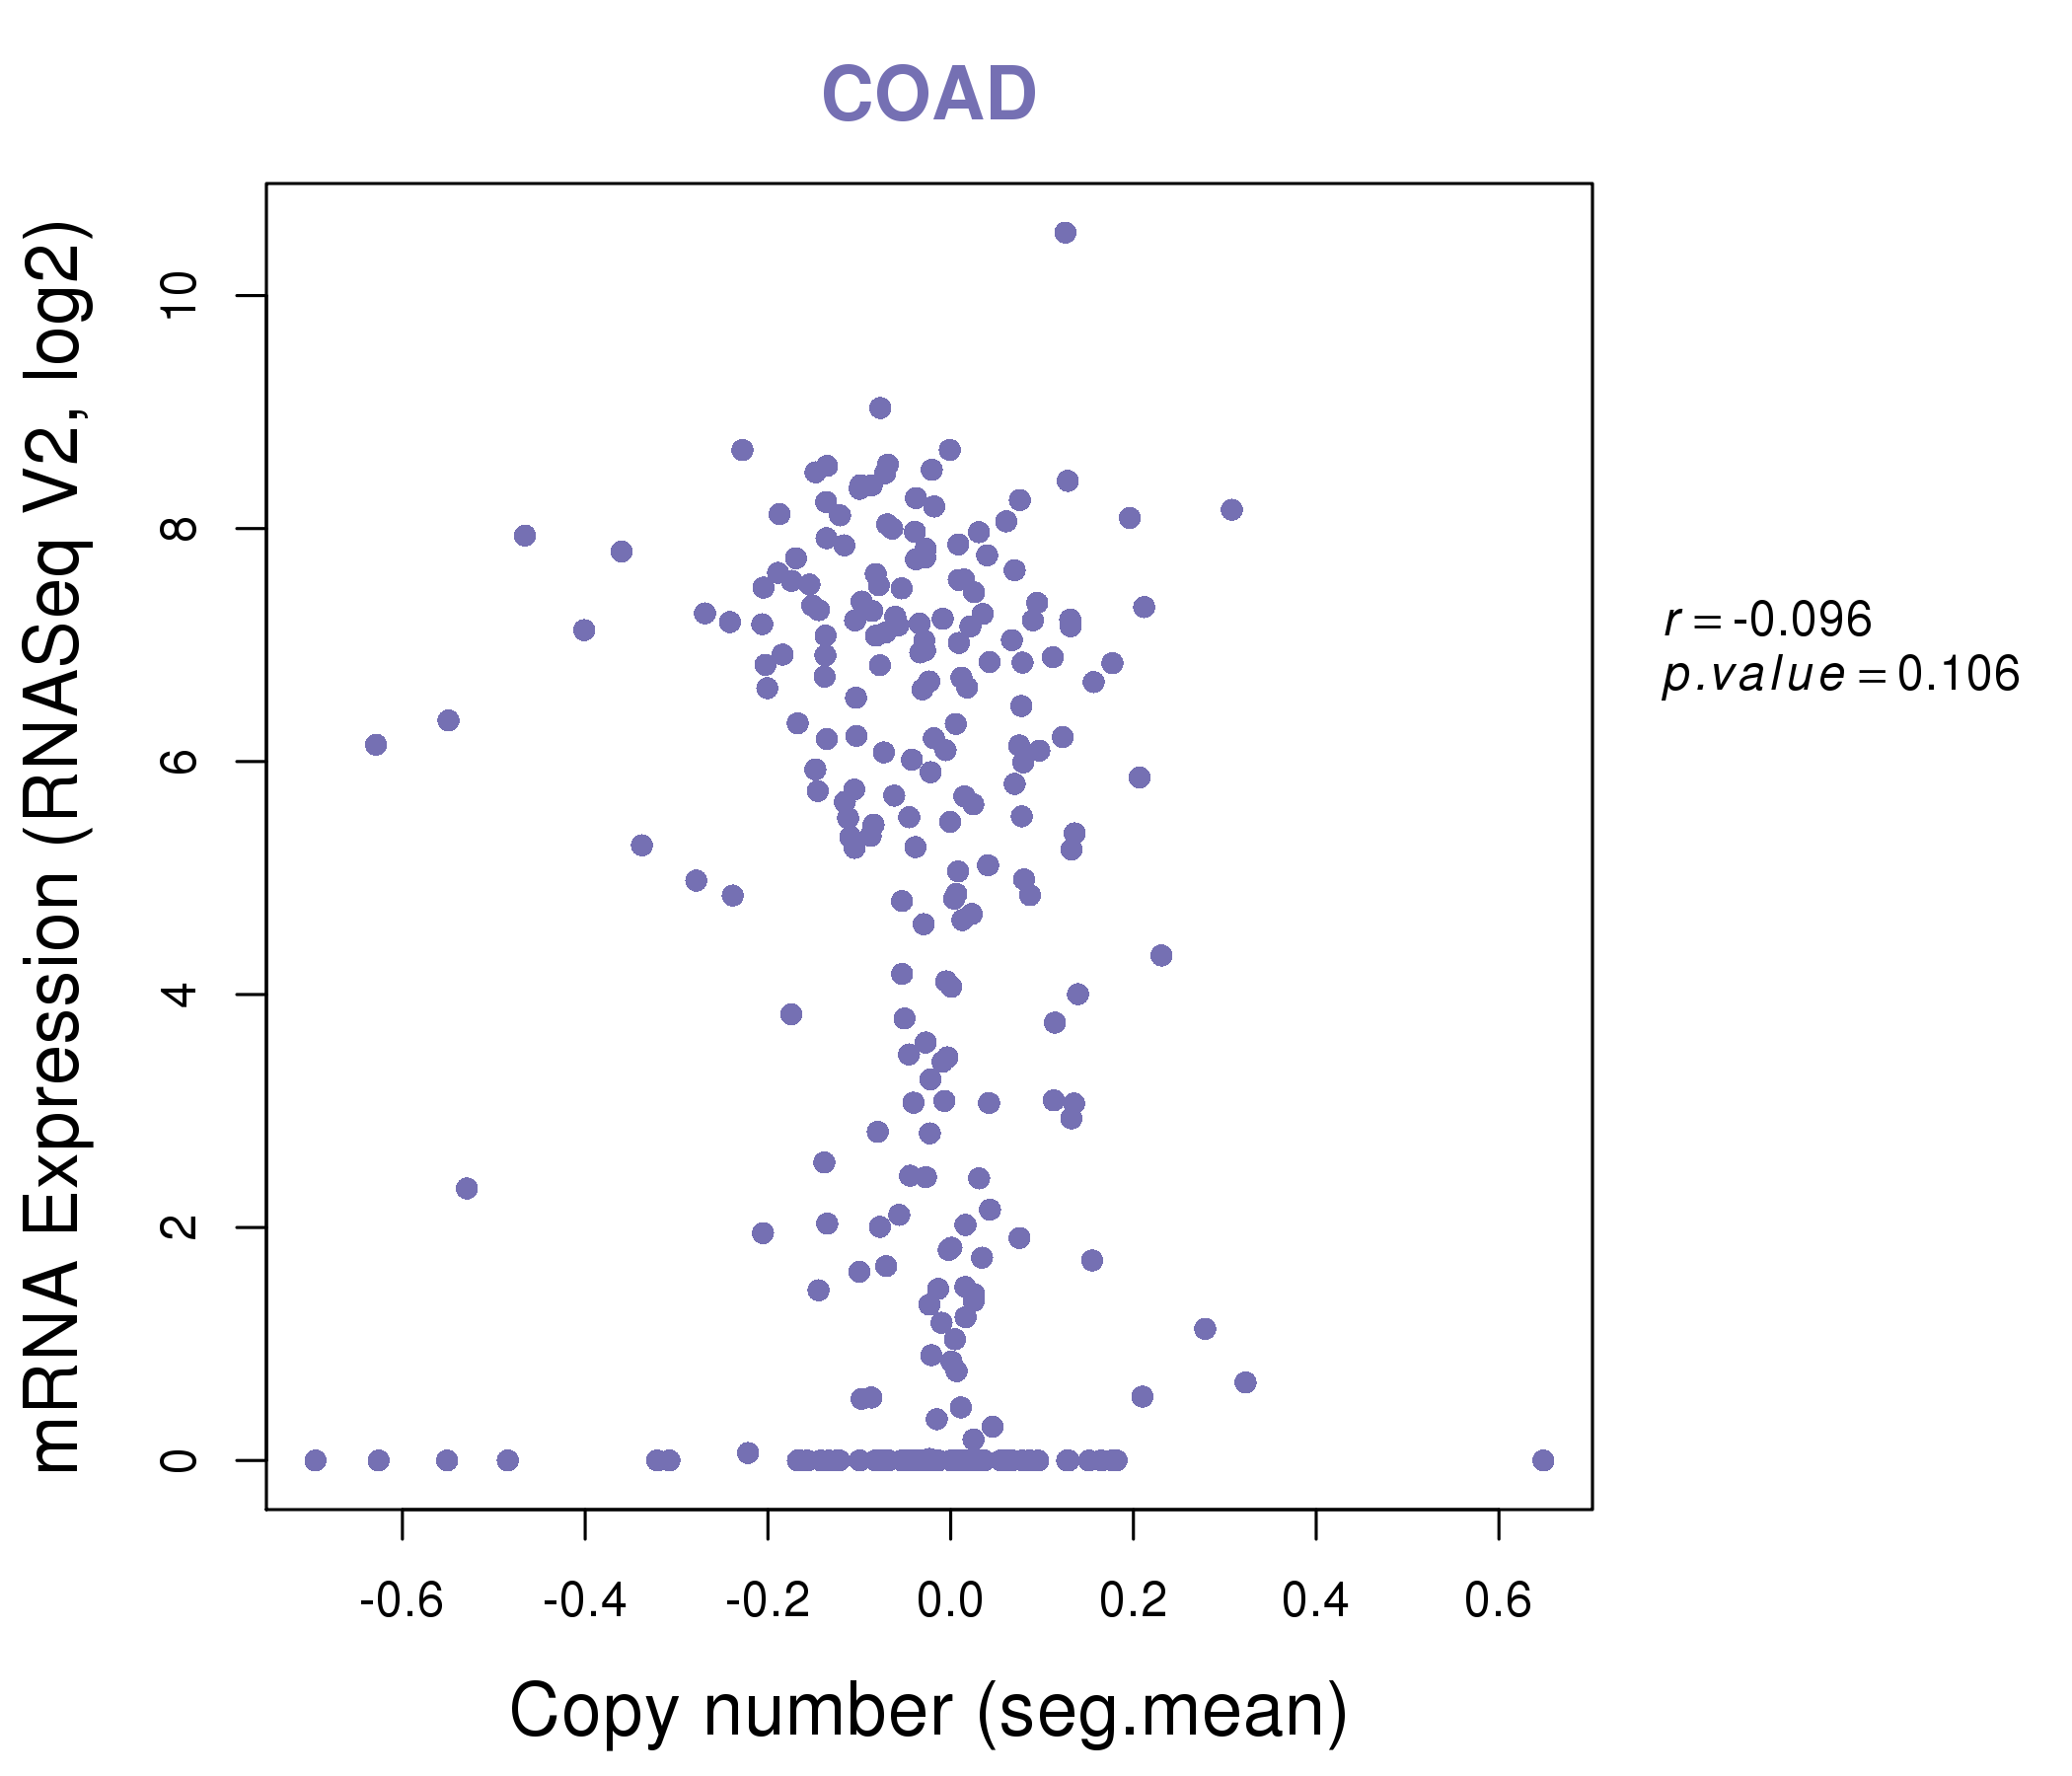
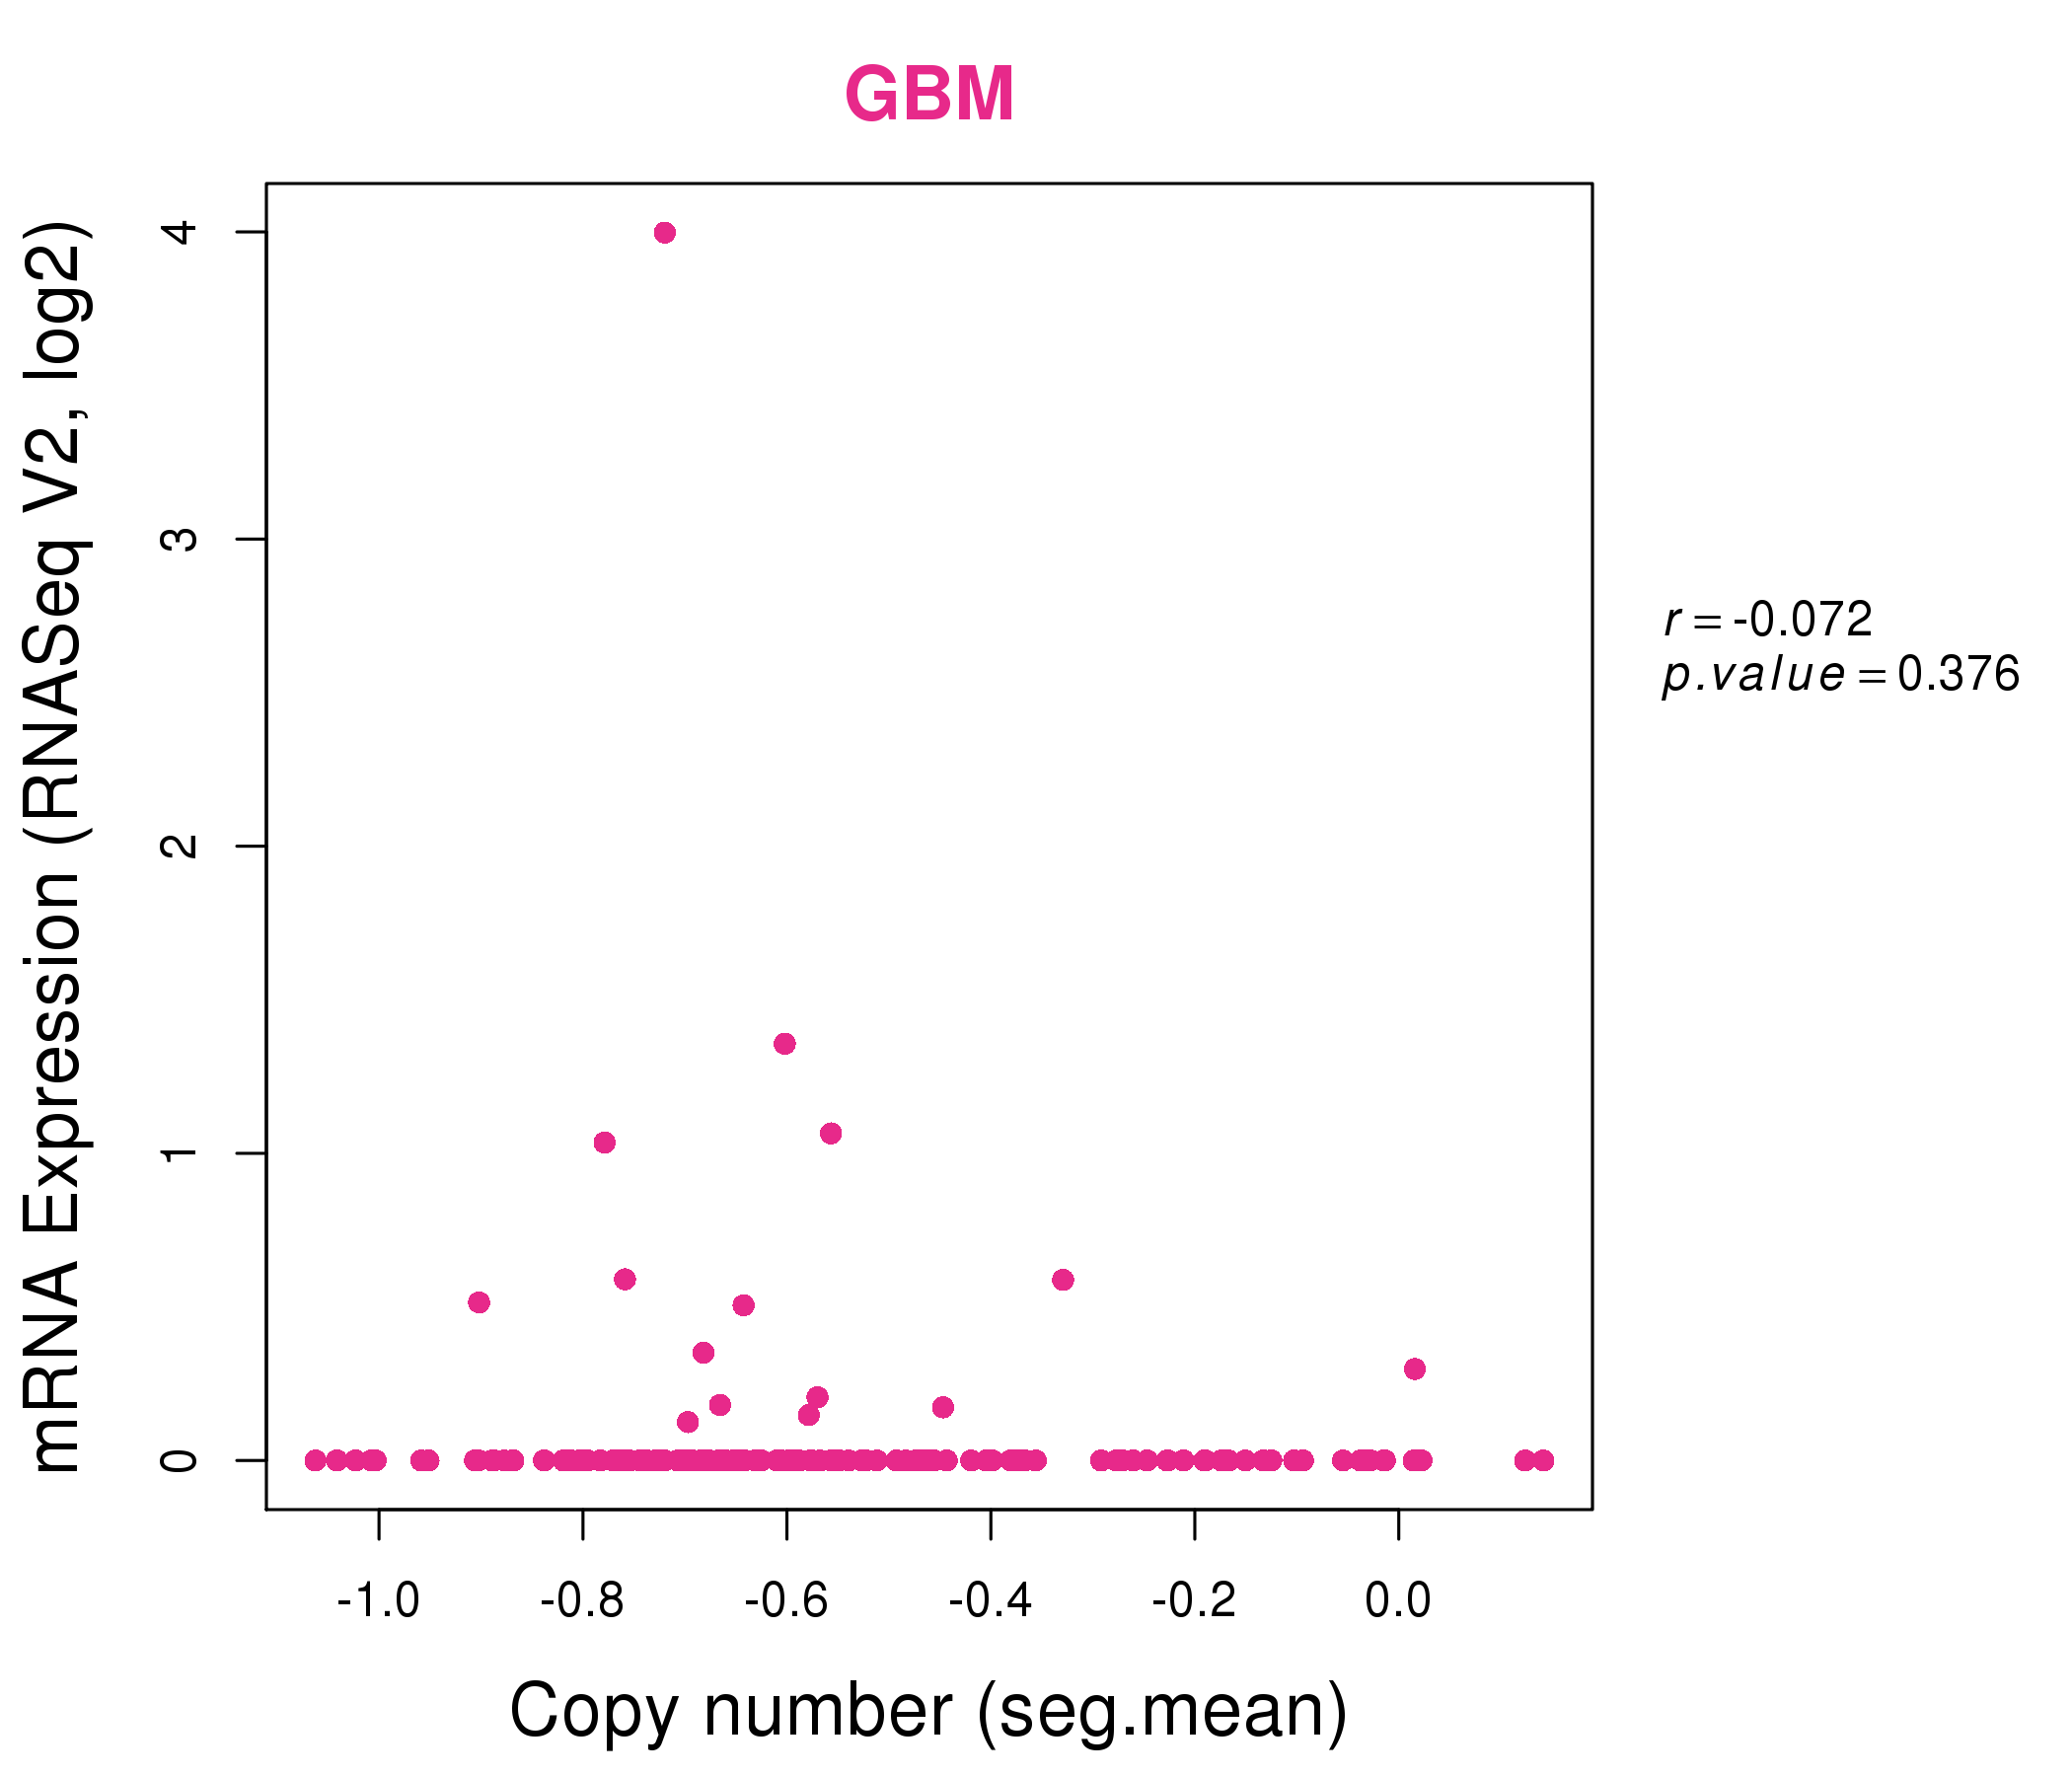
| * Copy number data were extracted from TCGA using R package TCGA-Assembler. The URLs of all public data files on TCGA DCC data server were gathered on Jan-05-2015. Function ProcessCNAData in TCGA-Assembler package was used to obtain gene-level copy number value which is calculated as the average copy number of the genomic region of a gene. |
 |
| cf) Tissue ID[Tissue type]: BLCA[Bladder Urothelial Carcinoma], BRCA[Breast invasive carcinoma], CESC[Cervical squamous cell carcinoma and endocervical adenocarcinoma], COAD[Colon adenocarcinoma], GBM[Glioblastoma multiforme], Glioma Low Grade, HNSC[Head and Neck squamous cell carcinoma], KICH[Kidney Chromophobe], KIRC[Kidney renal clear cell carcinoma], KIRP[Kidney renal papillary cell carcinoma], LAML[Acute Myeloid Leukemia], LUAD[Lung adenocarcinoma], LUSC[Lung squamous cell carcinoma], OV[Ovarian serous cystadenocarcinoma ], PAAD[Pancreatic adenocarcinoma], PRAD[Prostate adenocarcinoma], SKCM[Skin Cutaneous Melanoma], STAD[Stomach adenocarcinoma], THCA[Thyroid carcinoma], UCEC[Uterine Corpus Endometrial Carcinoma] |
| Top |
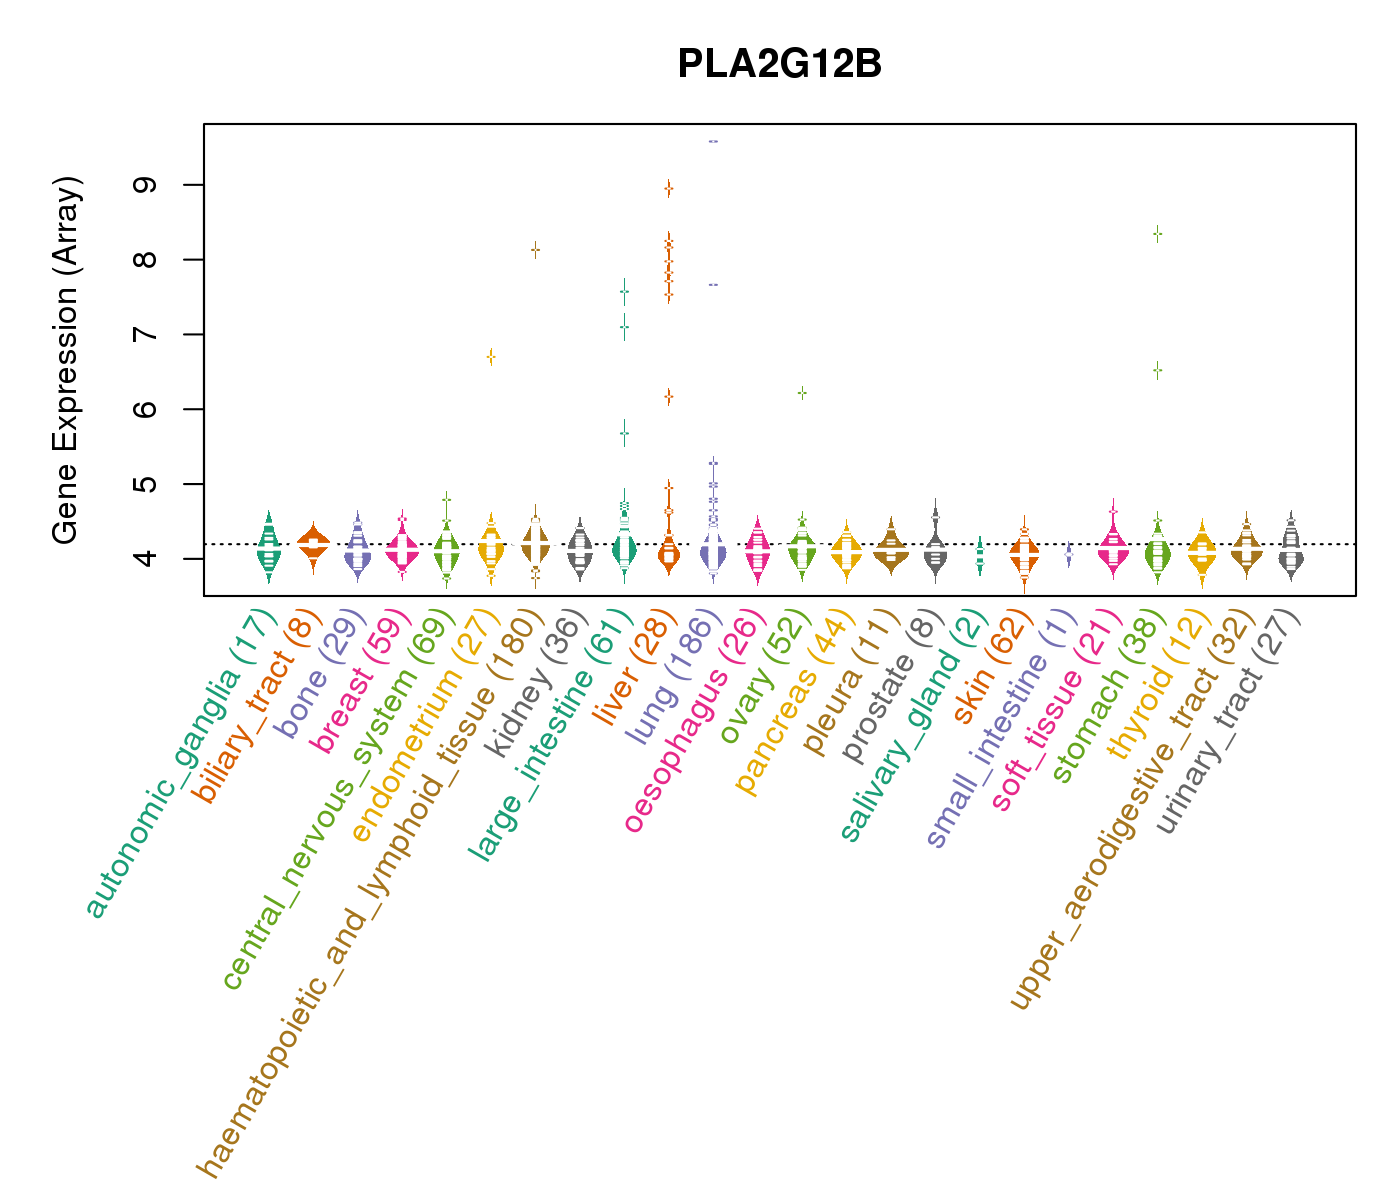
| Gene Expression for PLA2G12B |
| * CCLE gene expression data were extracted from CCLE_Expression_Entrez_2012-10-18.res: Gene-centric RMA-normalized mRNA expression data. |
 |
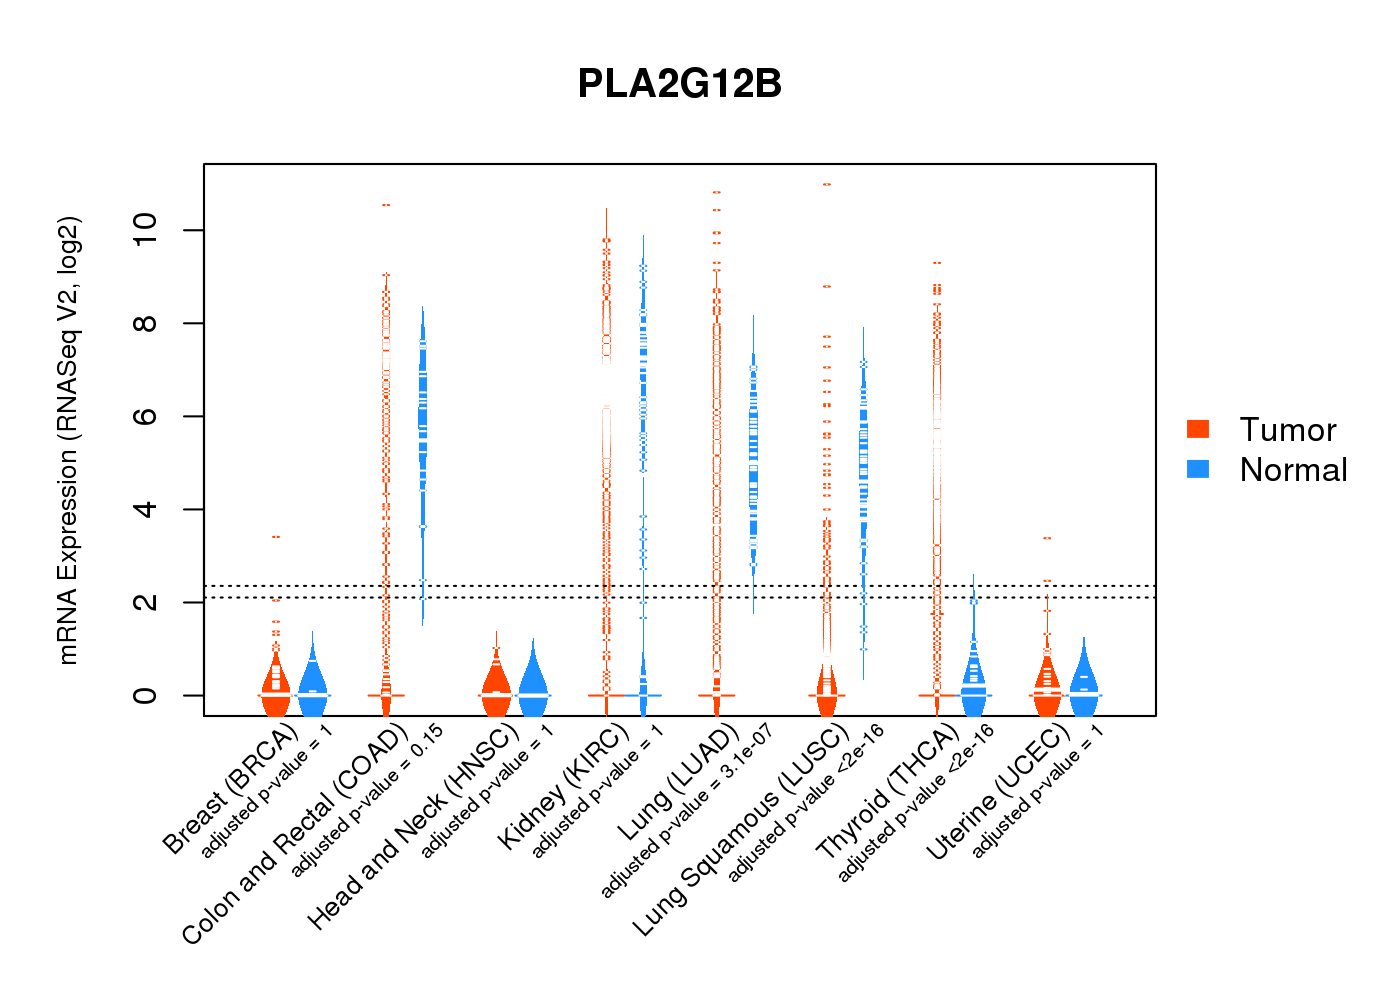
| * Normalized gene expression data of RNASeqV2 was extracted from TCGA using R package TCGA-Assembler. The URLs of all public data files on TCGA DCC data server were gathered at Jan-05-2015. Only eight cancer types have enough normal control samples for differential expression analysis. (t test, adjusted p<0.05 (using Benjamini-Hochberg FDR)) |
 |
| Top |
| * This plots show the correlation between CNV and gene expression. |
: Open all plots for all cancer types
 |
|
 |
|

| Top |
| Gene-Gene Network Information |
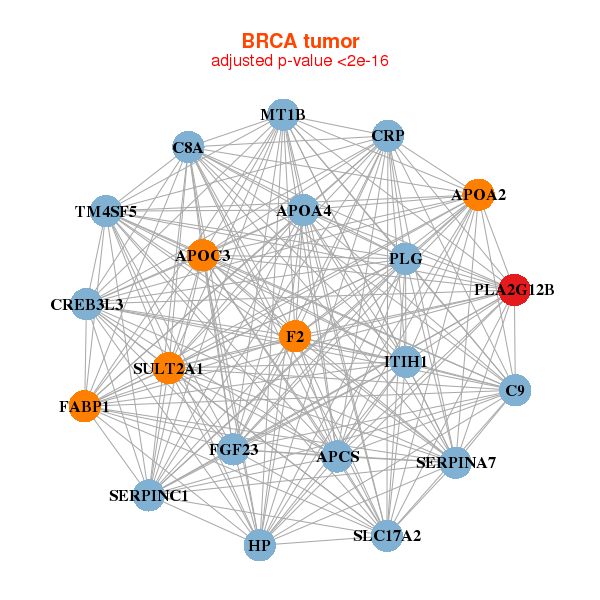
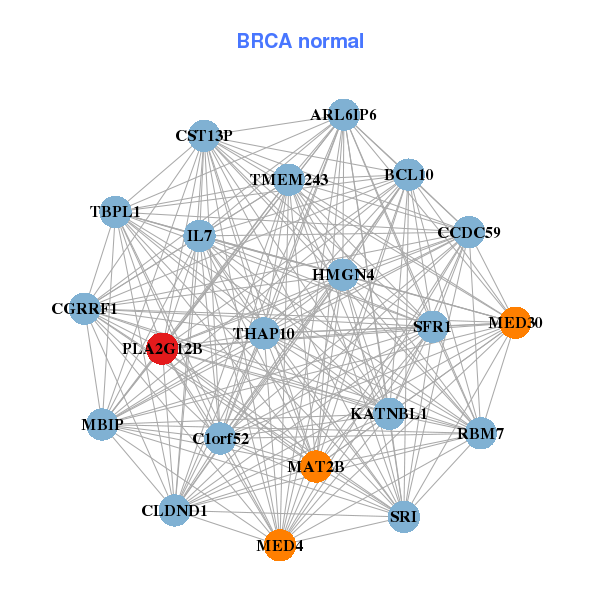
| * Co-Expression network figures were drawn using R package igraph. Only the top 20 genes with the highest correlations were shown. Red circle: input gene, orange circle: cell metabolism gene, sky circle: other gene |
: Open all plots for all cancer types
 |
|
| APCS,APOA2,APOA4,APOC3,C8A,C9,CREB3L3, CRP,F2,FABP1,FGF23,HP,ITIH1,MT1B, PLA2G12B,PLG,SERPINA7,SERPINC1,SLC17A2,SULT2A1,TM4SF5 | ARL6IP6,BCL10,SFR1,KATNBL1,C1orf52,TMEM243,CCDC59, CGRRF1,CLDND1,CST13P,HMGN4,IL7,MAT2B,MBIP, MED30,MED4,PLA2G12B,RBM7,SRI,TBPL1,THAP10 |
 |
|
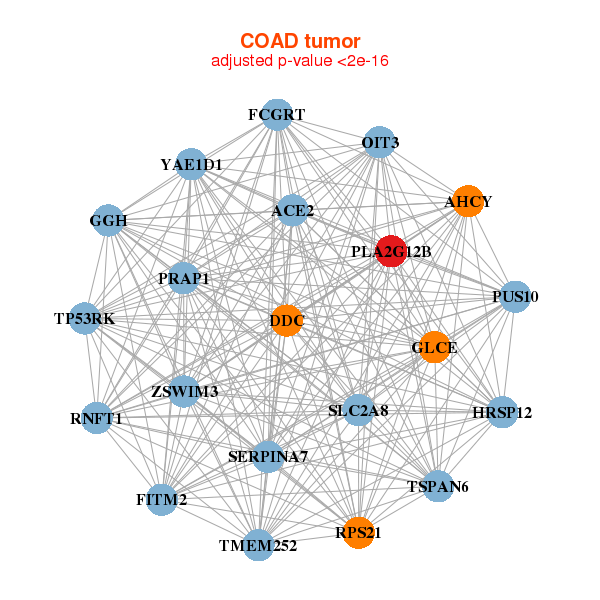
| ACE2,AHCY,YAE1D1,TMEM252,DDC,FCGRT,FITM2, GGH,GLCE,HRSP12,OIT3,PLA2G12B,PRAP1,PUS10, RNFT1,RPS21,SERPINA7,SLC2A8,TP53RK,TSPAN6,ZSWIM3 | ACE2,ALPI,AQP11,TMEM253,CHN2,DEPDC7,DGAT1, FADS6,SLC52A1,KRT14,MS4A8,NAT8B,OIT3,PLA2G12B, PRAP1,SLC15A1,SLC23A1,TM4SF20,TM6SF2,AGMO,USH1G |
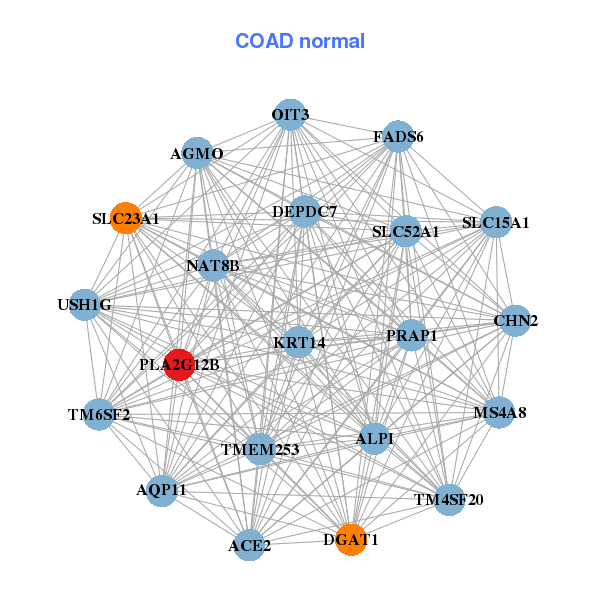
| * Co-Expression network figures were drawn using R package igraph. Only the top 20 genes with the highest correlations were shown. Red circle: input gene, orange circle: cell metabolism gene, sky circle: other gene |
: Open all plots for all cancer types
| Top |
: Open all interacting genes' information including KEGG pathway for all interacting genes from DAVID
| Top |
| Pharmacological Information for PLA2G12B |
| There's no related Drug. |
| Top |
| Cross referenced IDs for PLA2G12B |
| * We obtained these cross-references from Uniprot database. It covers 150 different DBs, 18 categories. http://www.uniprot.org/help/cross_references_section |
: Open all cross reference information
|
Copyright © 2016-Present - The Univsersity of Texas Health Science Center at Houston @ |