|
||||||||||||||||||||||||||||||||||||||||||||||||||||||||||||||||||||||||||||||||||||||||||||||||||||||||||||||||||||||||||||||||||||||||||||||||||||||||||||||||||||||||||||||||||||||||||||||||||||||||||||||||||||||||||||||||||||||||||||||||||||||||||||||||||||||||||||||||||||||||||||||||||||||||||||||||||||||||||
| |
| Phenotypic Information (metabolism pathway, cancer, disease, phenome) |
| |
| |
| Gene-Gene Network Information: Co-Expression Network, Interacting Genes & KEGG |
| |
|


| Gene Summary for DGAT2 |
| Basic gene info. | Gene symbol | DGAT2 |
| Gene name | diacylglycerol O-acyltransferase 2 | |
| Synonyms | ARAT|GS1999FULL | |
| Cytomap | UCSC genome browser: 11q13.5 | |
| Genomic location | chr11 :75479777-75512581 | |
| Type of gene | protein-coding | |
| RefGenes | NM_001253891.1, NM_032564.4, | |
| Ensembl id | ENSG00000062282 | |
| Description | acyl-CoA retinol O-fatty-acyltransferasediacylglycerol O-acyltransferase homolog 2diacylglycerol O-acyltransferase-like protein 2diglyceride acyltransferase 2retinol O-fatty-acyltransferase | |
| Modification date | 20141207 | |
| dbXrefs | MIM : 606983 | |
| HGNC : HGNC | ||
| Ensembl : ENSG00000062282 | ||
| HPRD : 07376 | ||
| Vega : OTTHUMG00000165338 | ||
| Protein | UniProt: go to UniProt's Cross Reference DB Table | |
| Expression | CleanEX: HS_DGAT2 | |
| BioGPS: 84649 | ||
| Gene Expression Atlas: ENSG00000062282 | ||
| The Human Protein Atlas: ENSG00000062282 | ||
| Pathway | NCI Pathway Interaction Database: DGAT2 | |
| KEGG: DGAT2 | ||
| REACTOME: DGAT2 | ||
| ConsensusPathDB | ||
| Pathway Commons: DGAT2 | ||
| Metabolism | MetaCyc: DGAT2 | |
| HUMANCyc: DGAT2 | ||
| Regulation | Ensembl's Regulation: ENSG00000062282 | |
| miRBase: chr11 :75,479,777-75,512,581 | ||
| TargetScan: NM_001253891 | ||
| cisRED: ENSG00000062282 | ||
| Context | iHOP: DGAT2 | |
| cancer metabolism search in PubMed: DGAT2 | ||
| UCL Cancer Institute: DGAT2 | ||
| Assigned class in ccmGDB | C | |
| Top |
| Phenotypic Information for DGAT2(metabolism pathway, cancer, disease, phenome) |
| Cancer | CGAP: DGAT2 |
| Familial Cancer Database: DGAT2 | |
| * This gene is included in those cancer gene databases. |
|
|
|
|
|
|
| ||||||||||||||||||||||||||||||||||||||||||||||||||||||||||||||||||||||||||||||||||||||||||||||||||||||||||||||||||||||||||||||||||||||||||||||||||||||||||||||||||||||||||||||||||||||||||||||||||||||||||||||||||||||||||||||||||||||||||||||||||||||||||||||||||||||||||||||||||||||||||||||||||||||||||||||||||||
Oncogene 1 | Significant driver gene in | |||||||||||||||||||||||||||||||||||||||||||||||||||||||||||||||||||||||||||||||||||||||||||||||||||||||||||||||||||||||||||||||||||||||||||||||||||||||||||||||||||||||||||||||||||||||||||||||||||||||||||||||||||||||||||||||||||||||||||||||||||||||||||||||||||||||||||||||||||||||||||||||||||||||||||||||||||||||||
| cf) number; DB name 1 Oncogene; http://nar.oxfordjournals.org/content/35/suppl_1/D721.long, 2 Tumor Suppressor gene; https://bioinfo.uth.edu/TSGene/, 3 Cancer Gene Census; http://www.nature.com/nrc/journal/v4/n3/abs/nrc1299.html, 4 CancerGenes; http://nar.oxfordjournals.org/content/35/suppl_1/D721.long, 5 Network of Cancer Gene; http://ncg.kcl.ac.uk/index.php, 1Therapeutic Vulnerabilities in Cancer; http://cbio.mskcc.org/cancergenomics/statius/ |
| KEGG_GLYCEROLIPID_METABOLISM KEGG_RETINOL_METABOLISM REACTOME_PHOSPHOLIPID_METABOLISM REACTOME_METABOLISM_OF_LIPIDS_AND_LIPOPROTEINS | |
| OMIM | |
| Orphanet | |
| Disease | KEGG Disease: DGAT2 |
| MedGen: DGAT2 (Human Medical Genetics with Condition) | |
| ClinVar: DGAT2 | |
| Phenotype | MGI: DGAT2 (International Mouse Phenotyping Consortium) |
| PhenomicDB: DGAT2 | |
| Mutations for DGAT2 |
| * Under tables are showing count per each tissue to give us broad intuition about tissue specific mutation patterns.You can go to the detailed page for each mutation database's web site. |
| - Statistics for Tissue and Mutation type | Top |
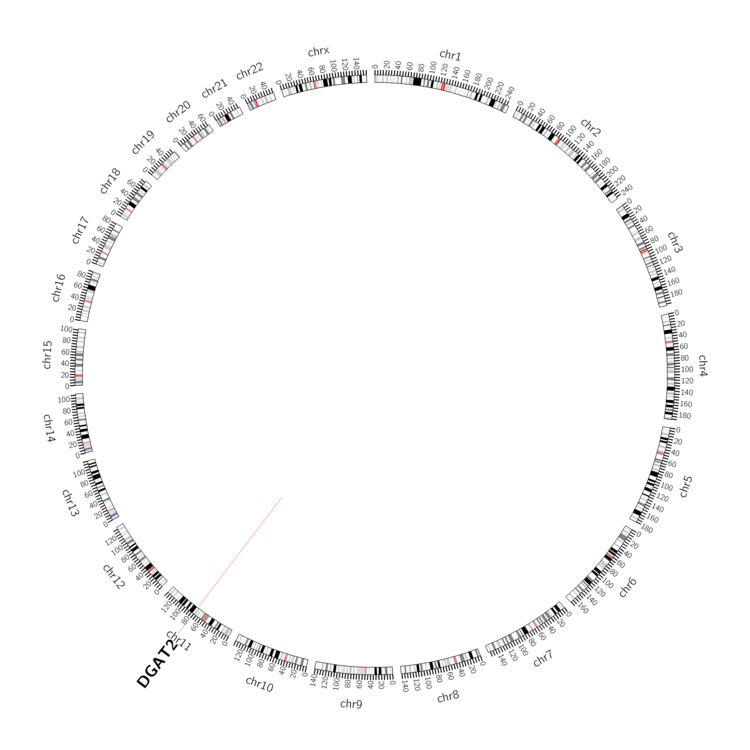 |
| - For Inter-chromosomal Variations |
| There's no inter-chromosomal structural variation. |
| - For Intra-chromosomal Variations |
| * Intra-chromosomal variantions includes 'intrachromosomal amplicon to amplicon', 'intrachromosomal amplicon to non-amplified dna', 'intrachromosomal deletion', 'intrachromosomal fold-back inversion', 'intrachromosomal inversion', 'intrachromosomal tandem duplication', 'Intrachromosomal unknown type', 'intrachromosomal with inverted orientation', 'intrachromosomal with non-inverted orientation'. |
 |
| Sample | Symbol_a | Chr_a | Start_a | End_a | Symbol_b | Chr_b | Start_b | End_b |
| ovary | DGAT2 | chr11 | 75484116 | 75484136 | DGAT2 | chr11 | 75484171 | 75484191 |
| ovary | DGAT2 | chr11 | 75511782 | 75511802 | DGAT2 | chr11 | 75505015 | 75505035 |
| cf) Tissue number; Tissue name (1;Breast, 2;Central_nervous_system, 3;Haematopoietic_and_lymphoid_tissue, 4;Large_intestine, 5;Liver, 6;Lung, 7;Ovary, 8;Pancreas, 9;Prostate, 10;Skin, 11;Soft_tissue, 12;Upper_aerodigestive_tract) |
| * From mRNA Sanger sequences, Chitars2.0 arranged chimeric transcripts. This table shows DGAT2 related fusion information. |
| ID | Head Gene | Tail Gene | Accession | Gene_a | qStart_a | qEnd_a | Chromosome_a | tStart_a | tEnd_a | Gene_a | qStart_a | qEnd_a | Chromosome_a | tStart_a | tEnd_a |
| AA694250 | DGAT2 | 38 | 326 | 11 | 75512291 | 75512579 | TMBIM6 | 313 | 435 | 12 | 50158116 | 50158239 | |
| CB153782 | DGAT2 | 1 | 226 | 11 | 75512301 | 75512526 | DOCK4 | 219 | 293 | 7 | 111516955 | 111517029 | |
| Top |
| Mutation type/ Tissue ID | brca | cns | cerv | endome | haematopo | kidn | Lintest | liver | lung | ns | ovary | pancre | prost | skin | stoma | thyro | urina | |||
| Total # sample | 3 | 1 | ||||||||||||||||||
| GAIN (# sample) | 3 | 1 | ||||||||||||||||||
| LOSS (# sample) |
| cf) Tissue ID; Tissue type (1; Breast, 2; Central_nervous_system, 3; Cervix, 4; Endometrium, 5; Haematopoietic_and_lymphoid_tissue, 6; Kidney, 7; Large_intestine, 8; Liver, 9; Lung, 10; NS, 11; Ovary, 12; Pancreas, 13; Prostate, 14; Skin, 15; Stomach, 16; Thyroid, 17; Urinary_tract) |
| Top |
|
 |
| Top |
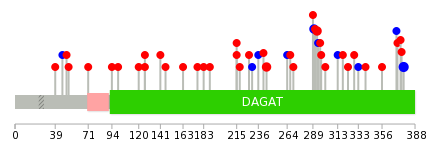
| Stat. for Non-Synonymous SNVs (# total SNVs=33) | (# total SNVs=6) |
 |  |
(# total SNVs=0) | (# total SNVs=0) |
| Top |
| * When you move the cursor on each content, you can see more deailed mutation information on the Tooltip. Those are primary_site,primary_histology,mutation(aa),pubmedID. |
| GRCh37 position | Mutation(aa) | Unique sampleID count |
| chr11:75511517-75511517 | p.F377F | 3 |
| chr11:75508299-75508299 | p.S244C | 2 |
| chr11:75501756-75501756 | p.R137* | 2 |
| chr11:75509332-75509332 | p.F290F | 2 |
| chr11:75509333-75509333 | p.E291* | 2 |
| chr11:75509339-75509339 | p.G293S | 2 |
| chr11:75508258-75508258 | p.S230S | 1 |
| chr11:75495695-75495695 | p.D52N | 1 |
| chr11:75509344-75509344 | p.S294S | 1 |
| chr11:75511452-75511452 | p.D356N | 1 |
| Top |
|
 |
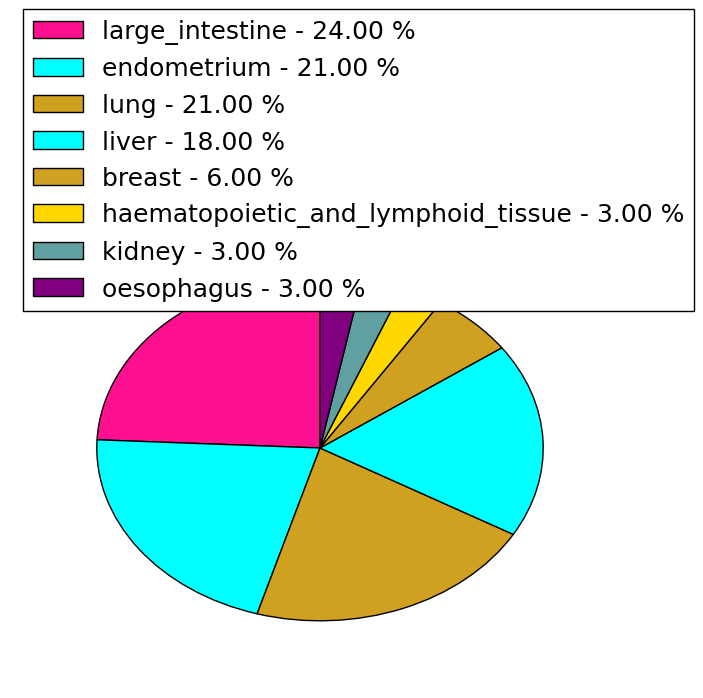
| Point Mutation/ Tissue ID | 1 | 2 | 3 | 4 | 5 | 6 | 7 | 8 | 9 | 10 | 11 | 12 | 13 | 14 | 15 | 16 | 17 | 18 | 19 | 20 |
| # sample | 2 | 6 | 1 | 1 | 3 | 9 | 2 | 7 | ||||||||||||
| # mutation | 2 | 6 | 1 | 1 | 3 | 10 | 2 | 7 | ||||||||||||
| nonsynonymous SNV | 2 | 4 | 1 | 3 | 6 | 1 | 6 | |||||||||||||
| synonymous SNV | 2 | 1 | 4 | 1 | 1 |
| cf) Tissue ID; Tissue type (1; BLCA[Bladder Urothelial Carcinoma], 2; BRCA[Breast invasive carcinoma], 3; CESC[Cervical squamous cell carcinoma and endocervical adenocarcinoma], 4; COAD[Colon adenocarcinoma], 5; GBM[Glioblastoma multiforme], 6; Glioma Low Grade, 7; HNSC[Head and Neck squamous cell carcinoma], 8; KICH[Kidney Chromophobe], 9; KIRC[Kidney renal clear cell carcinoma], 10; KIRP[Kidney renal papillary cell carcinoma], 11; LAML[Acute Myeloid Leukemia], 12; LUAD[Lung adenocarcinoma], 13; LUSC[Lung squamous cell carcinoma], 14; OV[Ovarian serous cystadenocarcinoma ], 15; PAAD[Pancreatic adenocarcinoma], 16; PRAD[Prostate adenocarcinoma], 17; SKCM[Skin Cutaneous Melanoma], 18:STAD[Stomach adenocarcinoma], 19:THCA[Thyroid carcinoma], 20:UCEC[Uterine Corpus Endometrial Carcinoma]) |
| Top |
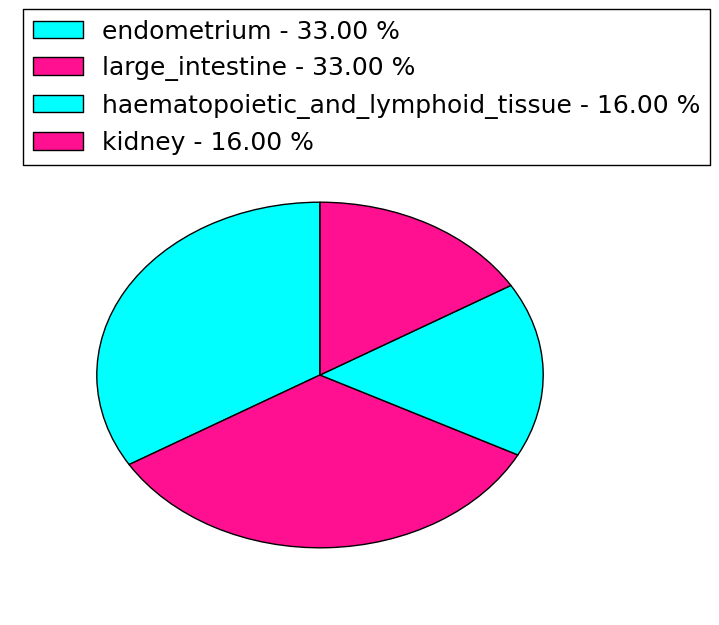
| * We represented just top 10 SNVs. When you move the cursor on each content, you can see more deailed mutation information on the Tooltip. Those are primary_site, primary_histology, mutation(aa), pubmedID. |
| Genomic Position | Mutation(aa) | Unique sampleID count |
| chr11:75509332 | p.F247F,DGAT2 | 2 |
| chr11:75509401 | p.G77D,DGAT2 | 1 |
| chr11:75501262 | p.E248K,DGAT2 | 1 |
| chr11:75508220 | p.W83R,DGAT2 | 1 |
| chr11:75509447 | p.S251S,DGAT2 | 1 |
| chr11:75501281 | p.P98S,DGAT2 | 1 |
| chr11:75508249 | p.R254L,DGAT2 | 1 |
| chr11:75509461 | p.K103N,DGAT2 | 1 |
| chr11:75501706 | p.I270I,DGAT2 | 1 |
| chr11:75508276 | p.H120R,DGAT2 | 1 |
| * Copy number data were extracted from TCGA using R package TCGA-Assembler. The URLs of all public data files on TCGA DCC data server were gathered on Jan-05-2015. Function ProcessCNAData in TCGA-Assembler package was used to obtain gene-level copy number value which is calculated as the average copy number of the genomic region of a gene. |
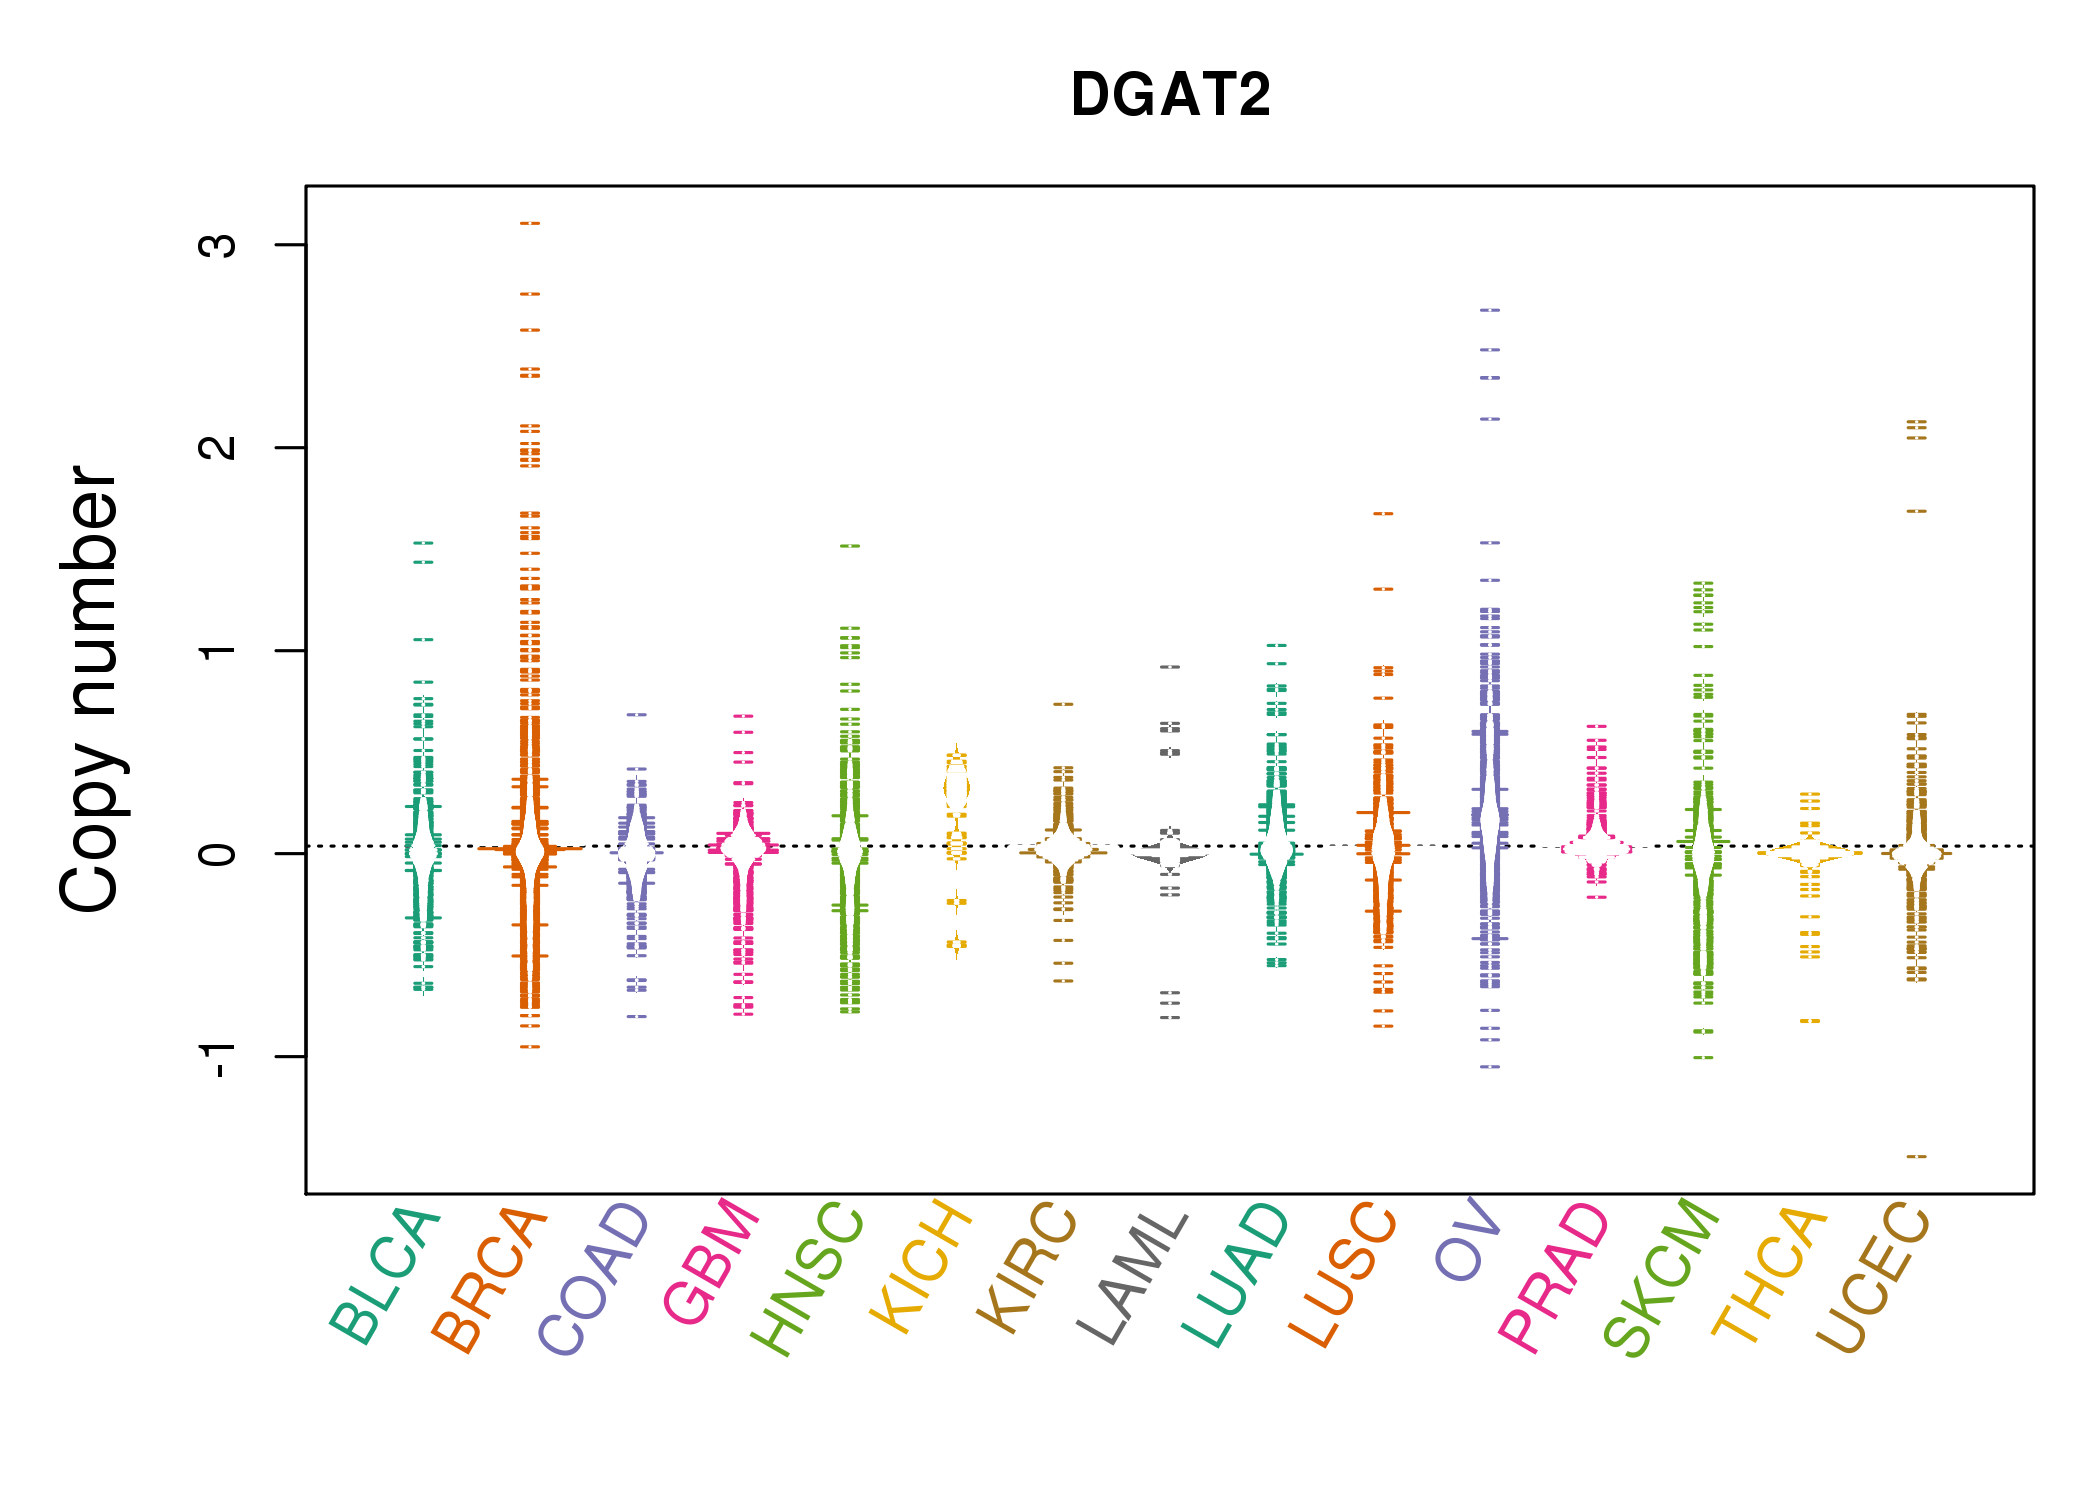 |
| cf) Tissue ID[Tissue type]: BLCA[Bladder Urothelial Carcinoma], BRCA[Breast invasive carcinoma], CESC[Cervical squamous cell carcinoma and endocervical adenocarcinoma], COAD[Colon adenocarcinoma], GBM[Glioblastoma multiforme], Glioma Low Grade, HNSC[Head and Neck squamous cell carcinoma], KICH[Kidney Chromophobe], KIRC[Kidney renal clear cell carcinoma], KIRP[Kidney renal papillary cell carcinoma], LAML[Acute Myeloid Leukemia], LUAD[Lung adenocarcinoma], LUSC[Lung squamous cell carcinoma], OV[Ovarian serous cystadenocarcinoma ], PAAD[Pancreatic adenocarcinoma], PRAD[Prostate adenocarcinoma], SKCM[Skin Cutaneous Melanoma], STAD[Stomach adenocarcinoma], THCA[Thyroid carcinoma], UCEC[Uterine Corpus Endometrial Carcinoma] |
| Top |
| Gene Expression for DGAT2 |
| * CCLE gene expression data were extracted from CCLE_Expression_Entrez_2012-10-18.res: Gene-centric RMA-normalized mRNA expression data. |
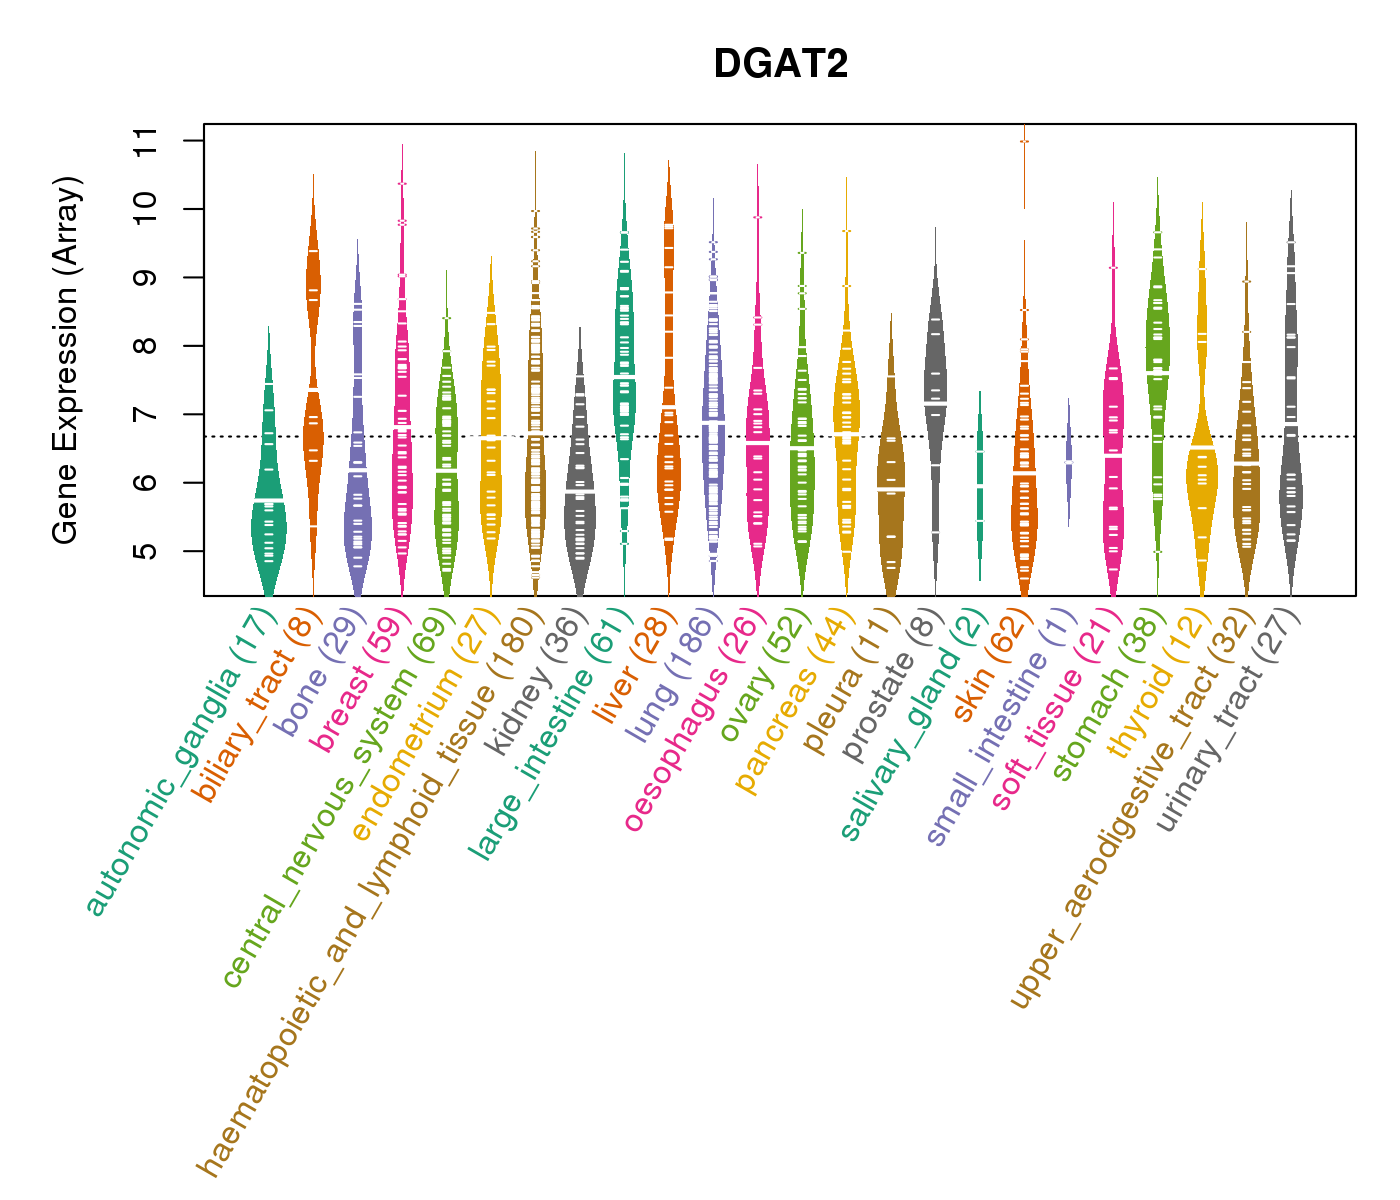 |
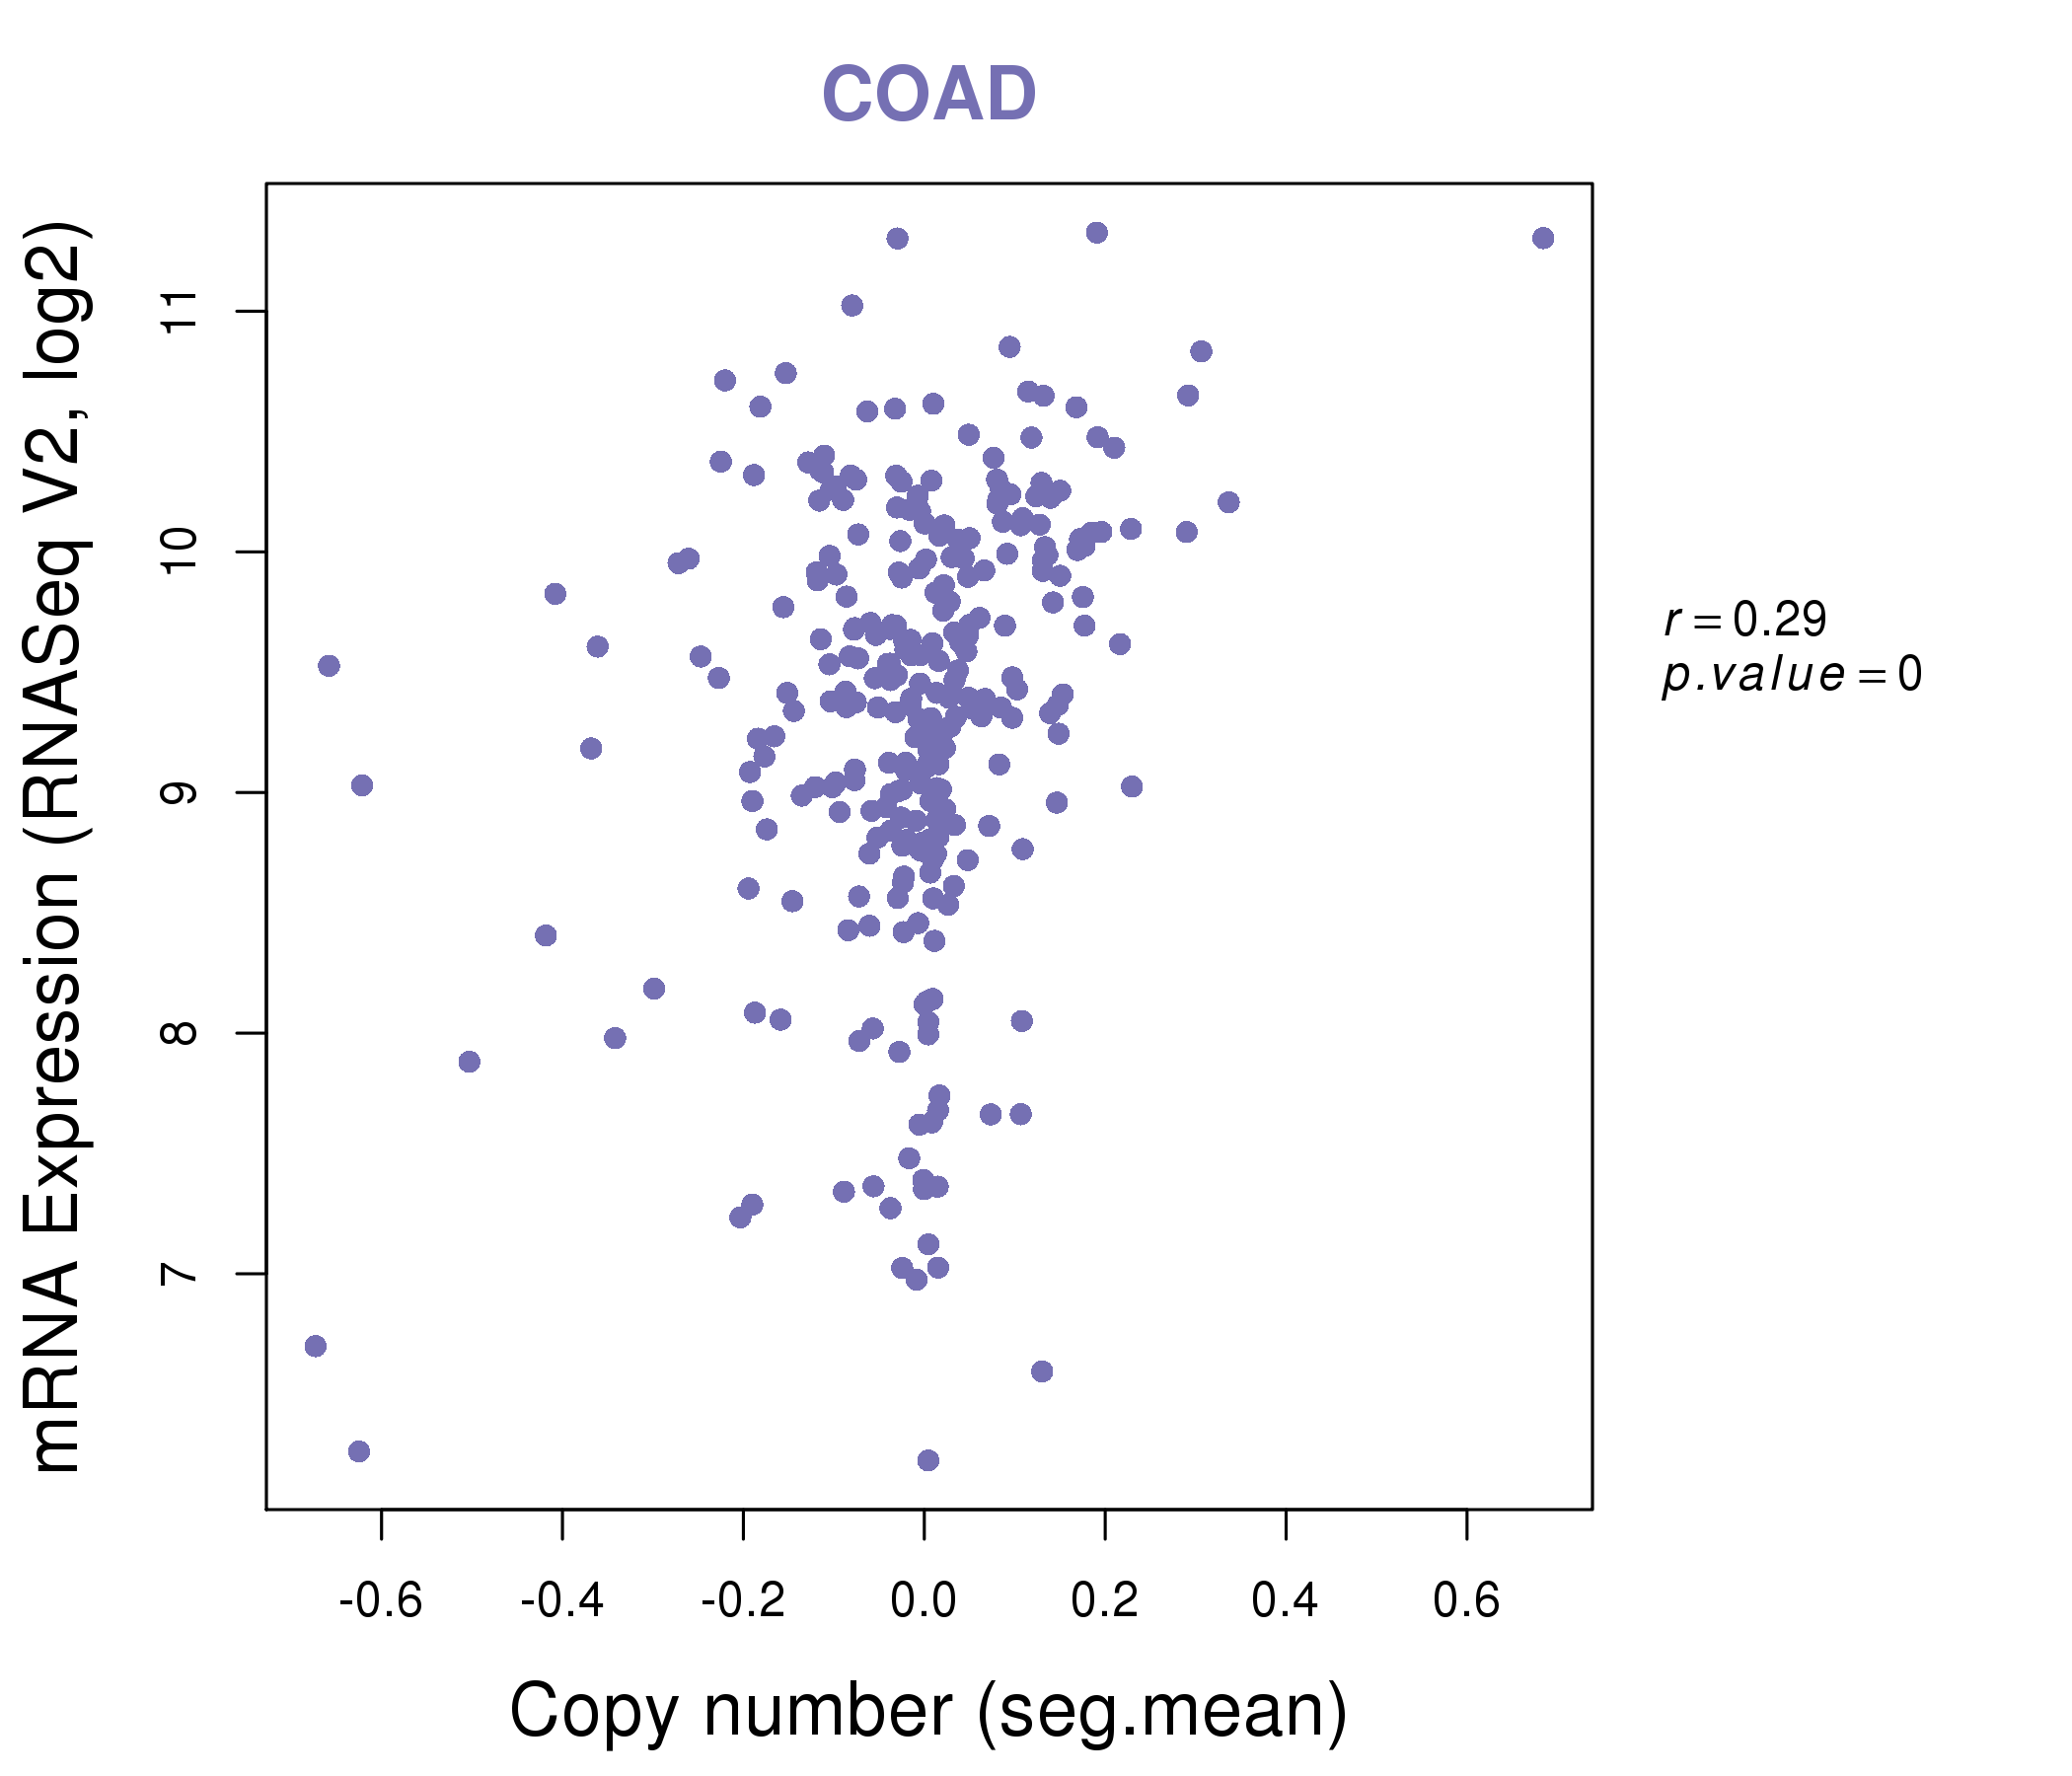
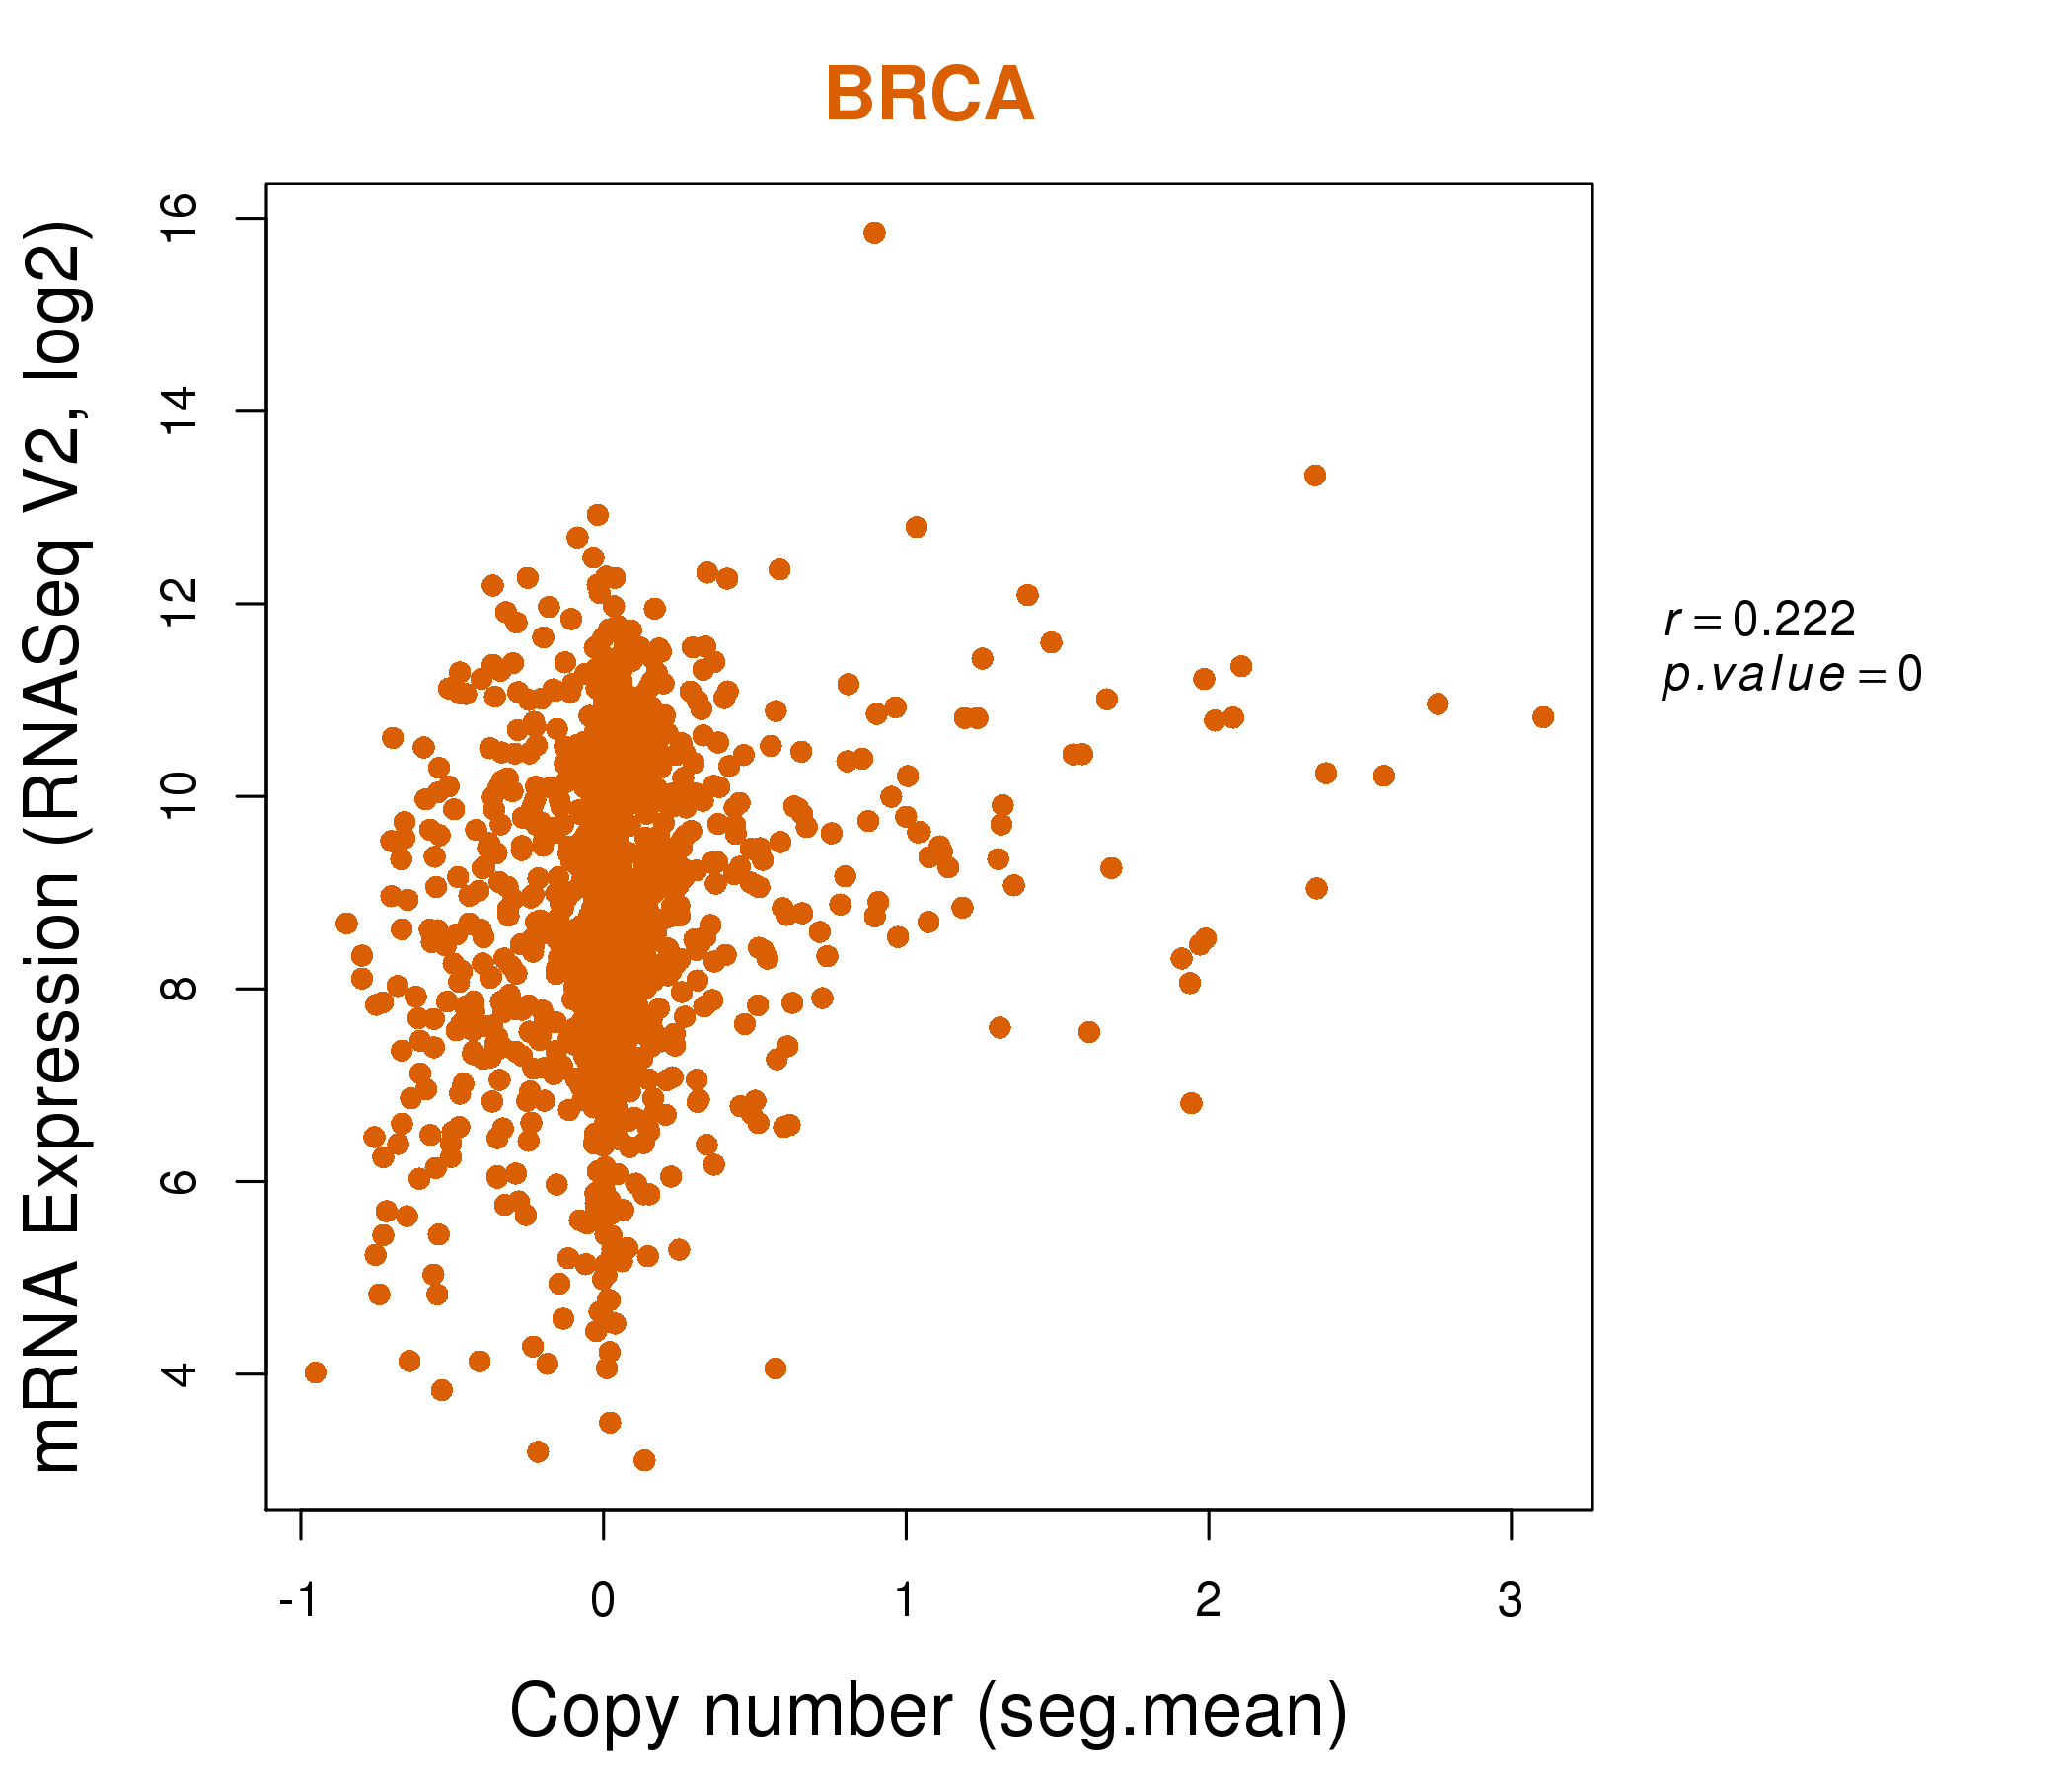
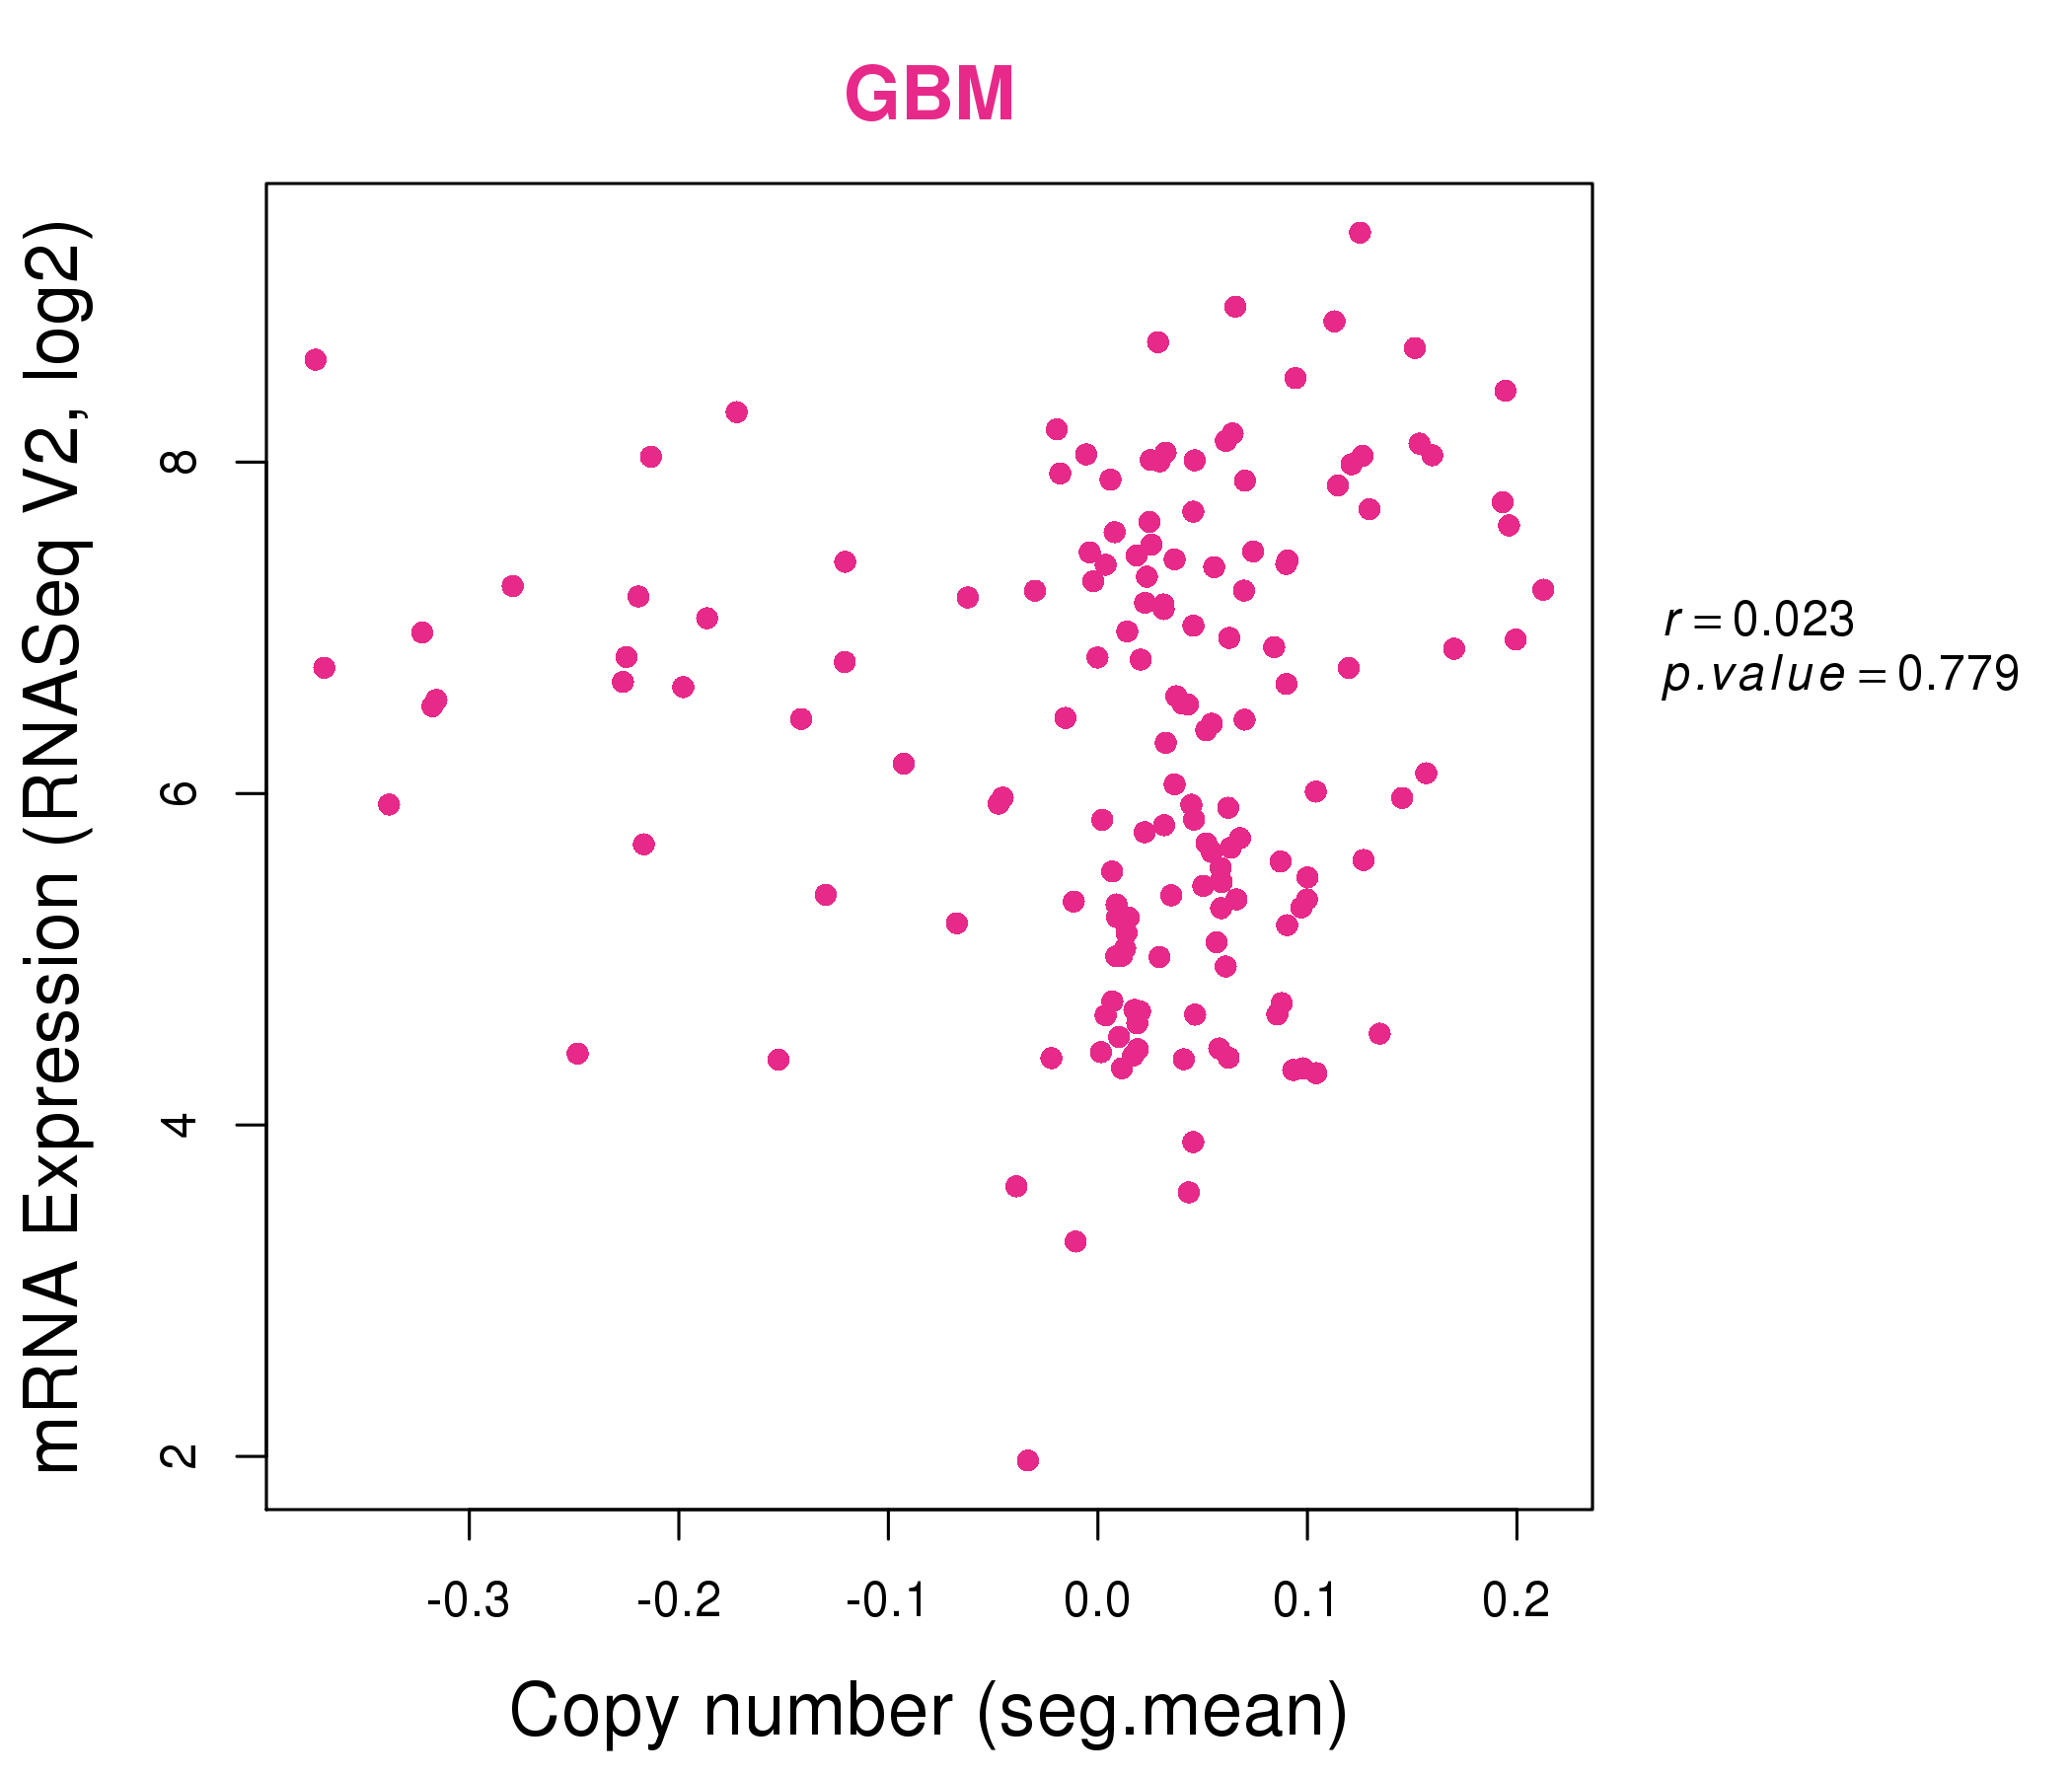
| * Normalized gene expression data of RNASeqV2 was extracted from TCGA using R package TCGA-Assembler. The URLs of all public data files on TCGA DCC data server were gathered at Jan-05-2015. Only eight cancer types have enough normal control samples for differential expression analysis. (t test, adjusted p<0.05 (using Benjamini-Hochberg FDR)) |
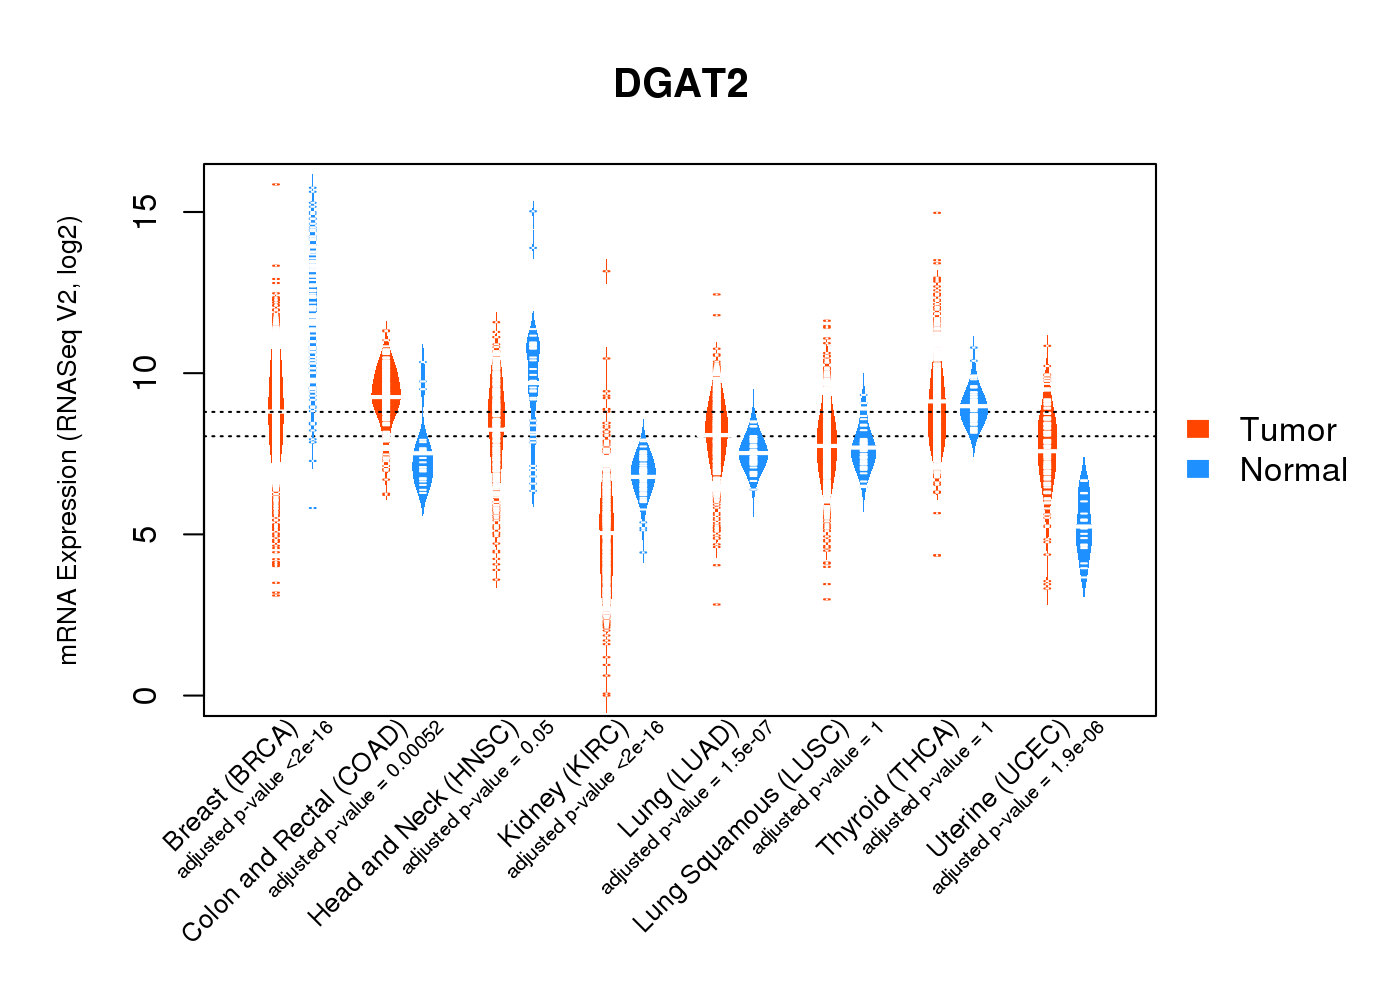 |
| Top |
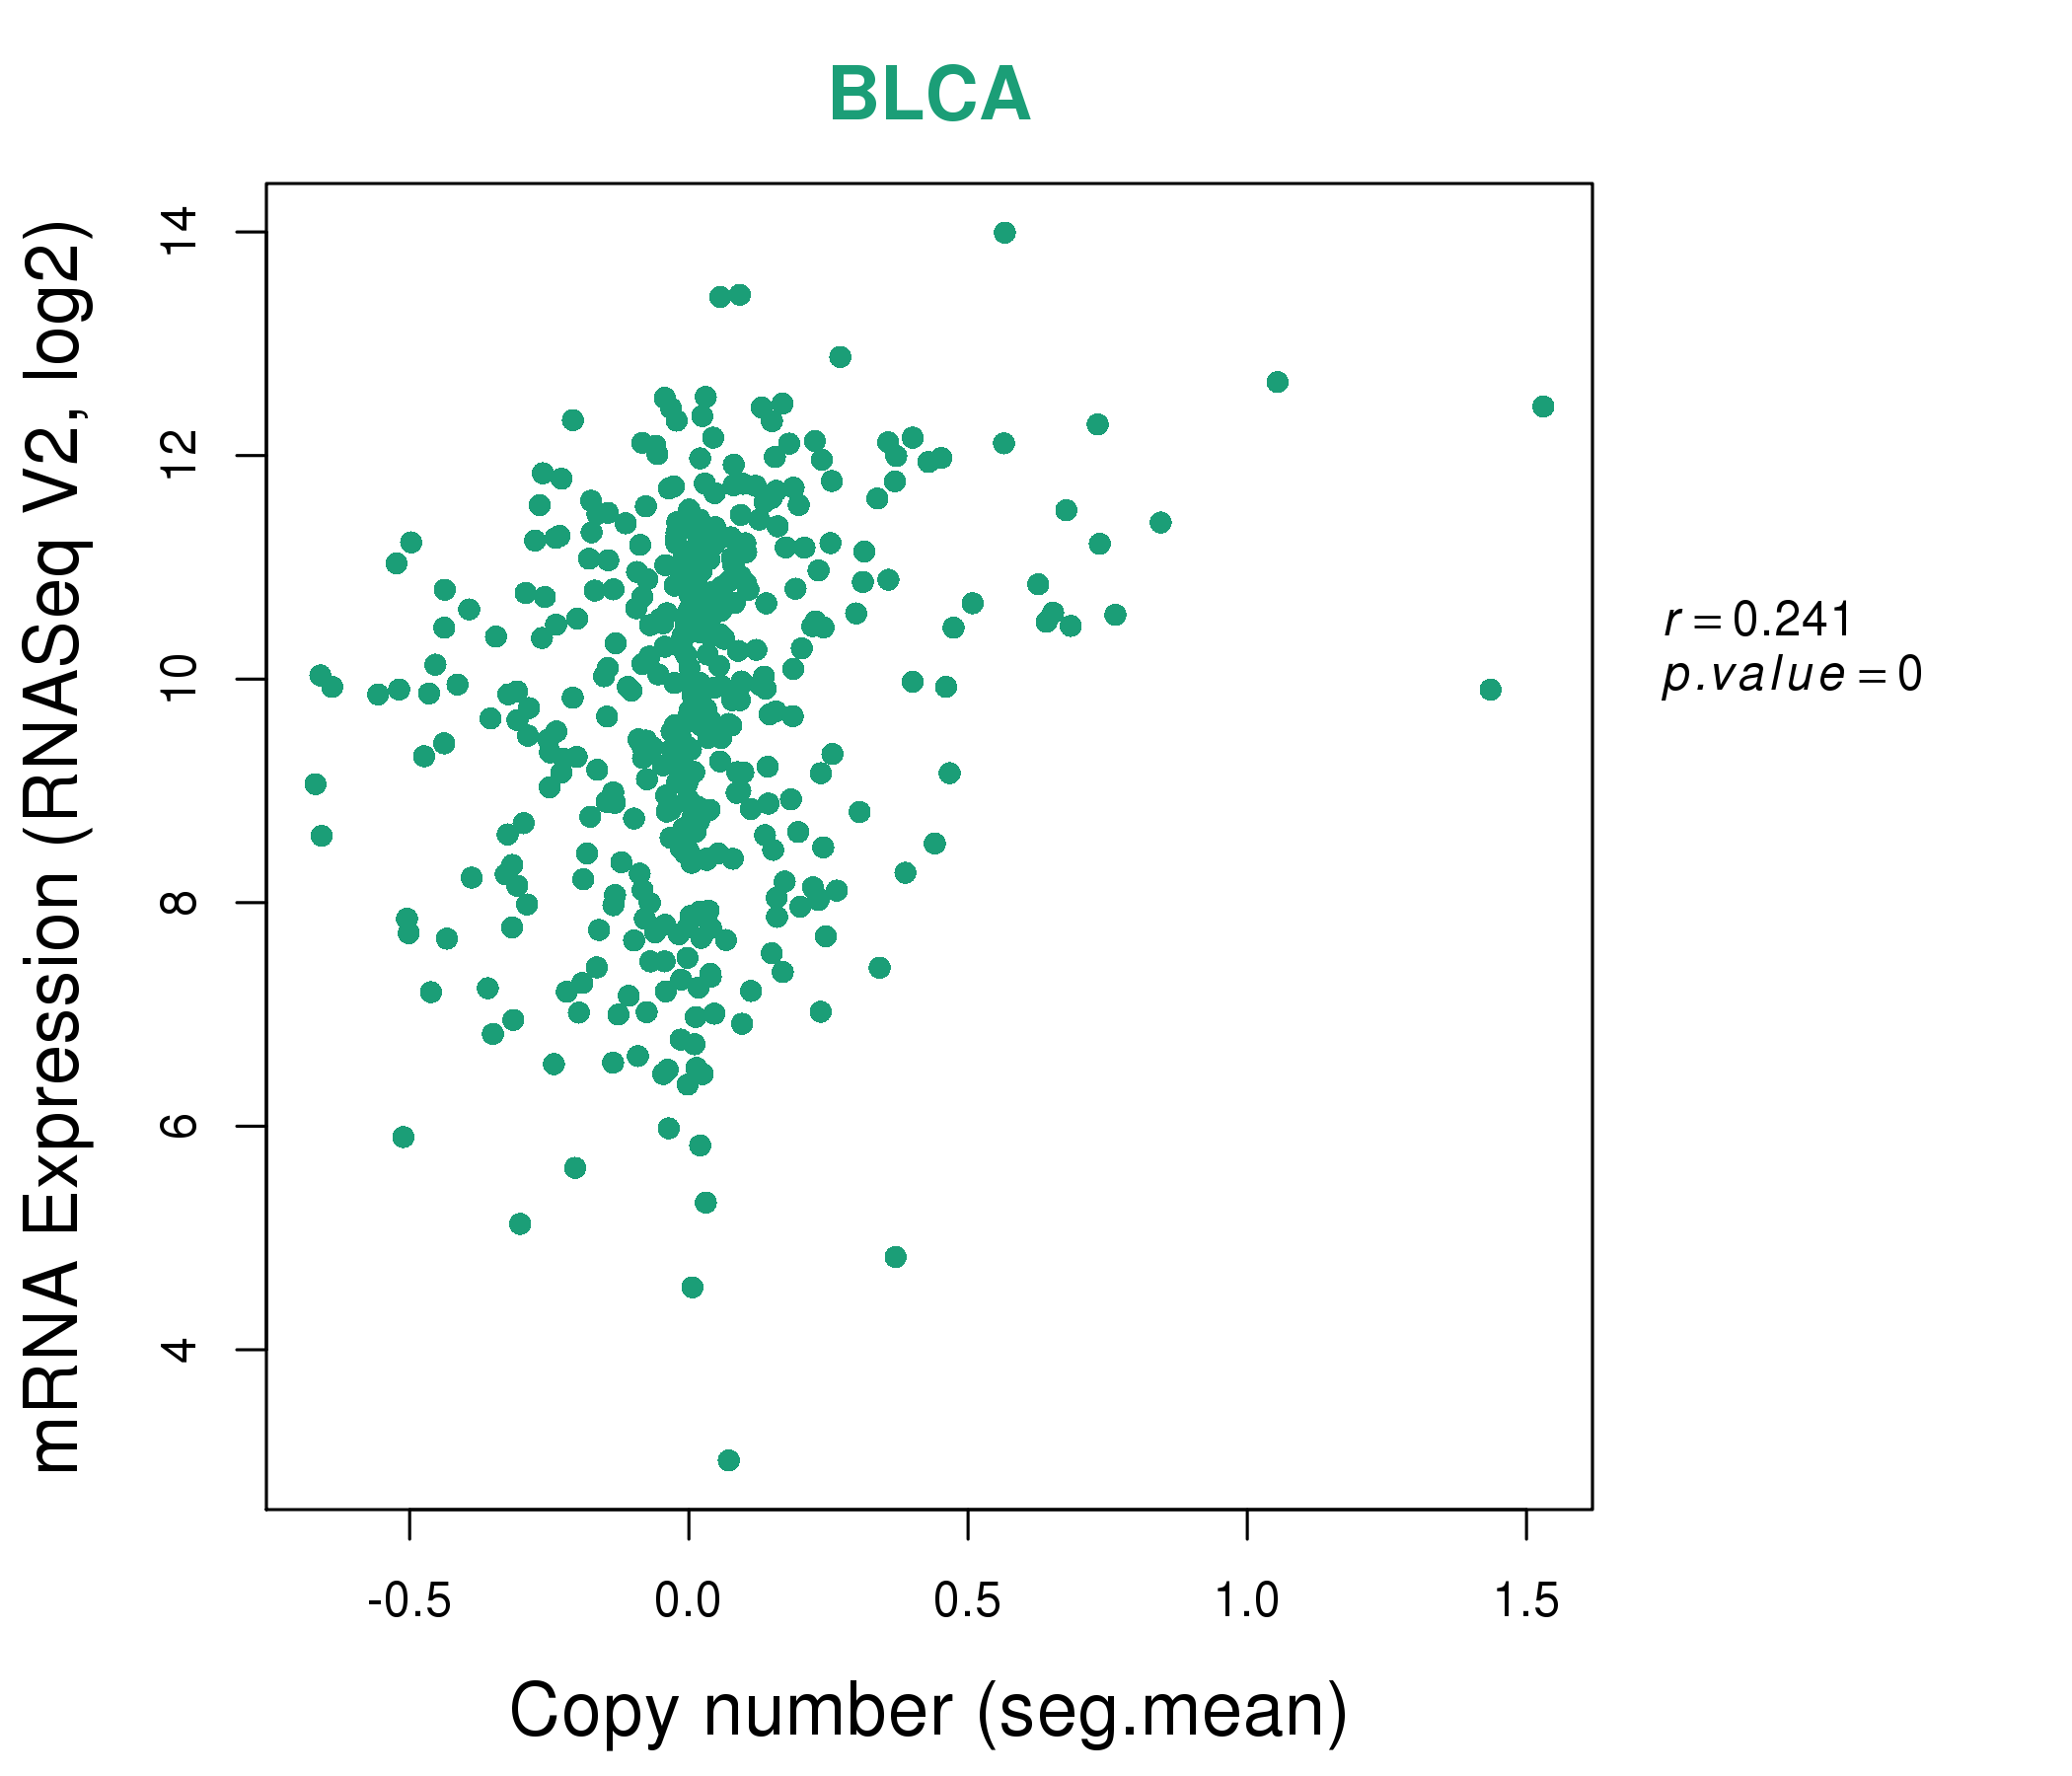
| * This plots show the correlation between CNV and gene expression. |
: Open all plots for all cancer types
 |
|
 |
|
| Top |
| Gene-Gene Network Information |
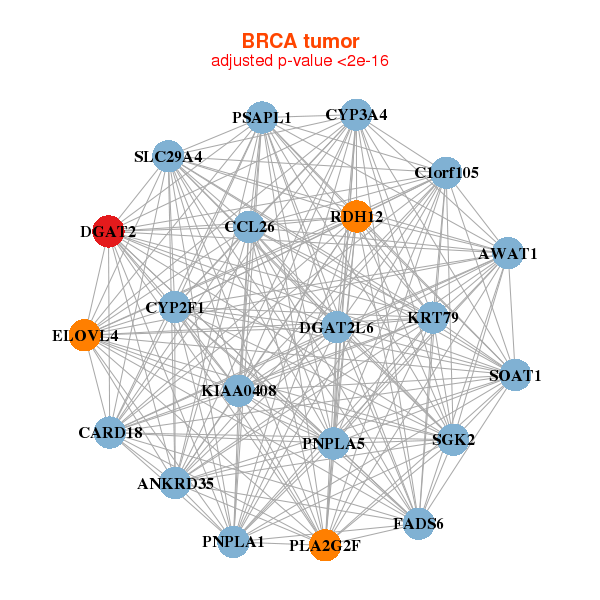
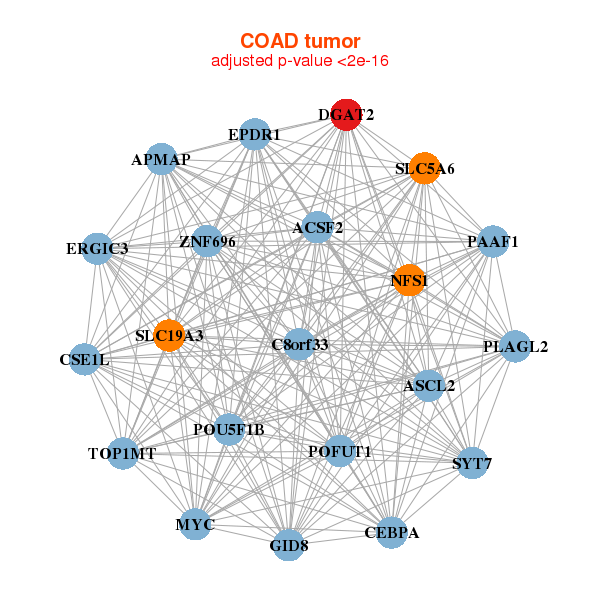
| * Co-Expression network figures were drawn using R package igraph. Only the top 20 genes with the highest correlations were shown. Red circle: input gene, orange circle: cell metabolism gene, sky circle: other gene |
: Open all plots for all cancer types
 |
|
| ANKRD35,AWAT1,C1orf105,CARD18,CCL26,CYP2F1,CYP3A4, DGAT2,DGAT2L6,ELOVL4,FADS6,KIAA0408,KRT79,PLA2G2F, PNPLA1,PNPLA5,PSAPL1,RDH12,SGK2,SLC29A4,SOAT1 | ACSL1,ADIPOR2,DGAT1,DGAT2,DHRS11,FMOD,GDPD5, GPAM,GPD1,HCAR2,HEPACAM,HEPN1,HSPA12A,KLB, LAIR1,MGLL,MRAP,PDXK,SGK2,SLC29A4,THRSP |
 |
|
| ACSF2,ASCL2,GID8,APMAP,C8orf33,CEBPA,CSE1L, DGAT2,EPDR1,ERGIC3,MYC,NFS1,PAAF1,PLAGL2, POFUT1,POU5F1B,SLC19A3,SLC5A6,SYT7,TOP1MT,ZNF696 | ADIPOQ,CIDEA,DEFB132,DGAT2,FABP4,FCN2,G0S2, GPAM,KCNIP2,KRT79,LGALS12,LIPE,LOC283392,LPL, MRAP,PFKFB1,PLIN1,SAA1,SLC7A10,THRSP,TUSC5 |
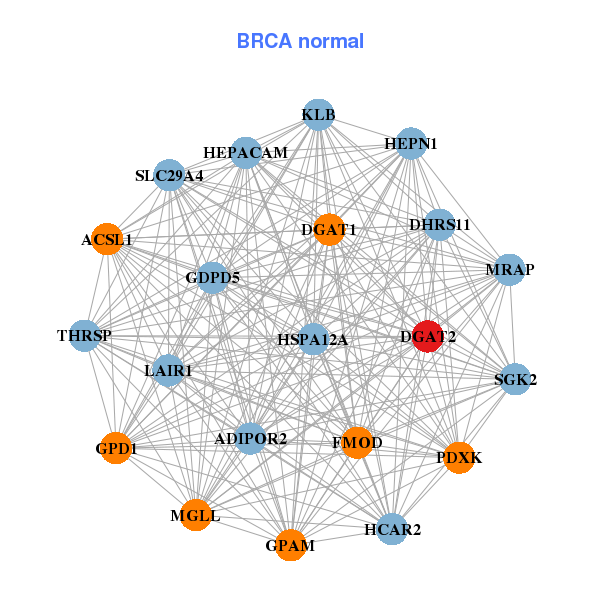
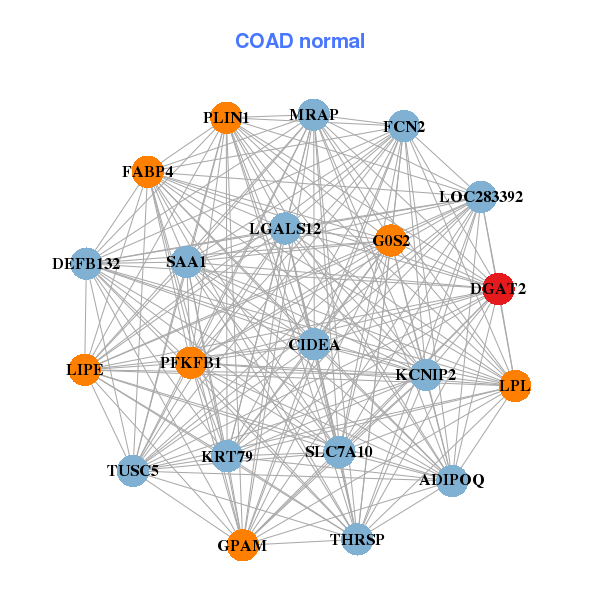
| * Co-Expression network figures were drawn using R package igraph. Only the top 20 genes with the highest correlations were shown. Red circle: input gene, orange circle: cell metabolism gene, sky circle: other gene |
: Open all plots for all cancer types
| Top |
: Open all interacting genes' information including KEGG pathway for all interacting genes from DAVID
| Top |
| Pharmacological Information for DGAT2 |
| There's no related Drug. |
| Top |
| Cross referenced IDs for DGAT2 |
| * We obtained these cross-references from Uniprot database. It covers 150 different DBs, 18 categories. http://www.uniprot.org/help/cross_references_section |
: Open all cross reference information
|
Copyright © 2016-Present - The Univsersity of Texas Health Science Center at Houston @ |