|
||||||||||||||||||||
| |
| Phenotypic Information (metabolism pathway, cancer, disease, phenome) |
| |
| |
| Gene-Gene Network Information: Co-Expression Network, Interacting Genes & KEGG |
| |
|


| Gene Summary for TUBA1C |
| Top |
| Phenotypic Information for TUBA1C(metabolism pathway, cancer, disease, phenome) |
| Cancer | CGAP: TUBA1C |
| Familial Cancer Database: TUBA1C | |
| * This gene is included in those cancer gene databases. |
|
|
|
|
|
| . | ||||||||||||||
Oncogene 1 | Significant driver gene in | |||||||||||||||||||
| cf) number; DB name 1 Oncogene; http://nar.oxfordjournals.org/content/35/suppl_1/D721.long, 2 Tumor Suppressor gene; https://bioinfo.uth.edu/TSGene/, 3 Cancer Gene Census; http://www.nature.com/nrc/journal/v4/n3/abs/nrc1299.html, 4 CancerGenes; http://nar.oxfordjournals.org/content/35/suppl_1/D721.long, 5 Network of Cancer Gene; http://ncg.kcl.ac.uk/index.php, 1Therapeutic Vulnerabilities in Cancer; http://cbio.mskcc.org/cancergenomics/statius/ |
| REACTOME_METABOLISM_OF_PROTEINS | |
| OMIM | |
| Orphanet | |
| Disease | KEGG Disease: TUBA1C |
| MedGen: TUBA1C (Human Medical Genetics with Condition) | |
| ClinVar: TUBA1C | |
| Phenotype | MGI: TUBA1C (International Mouse Phenotyping Consortium) |
| PhenomicDB: TUBA1C | |
| Mutations for TUBA1C |
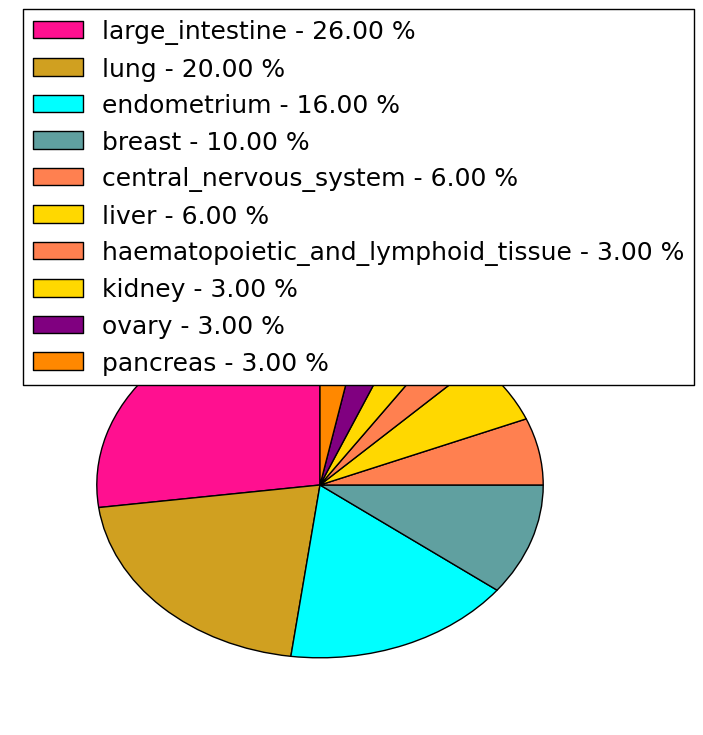
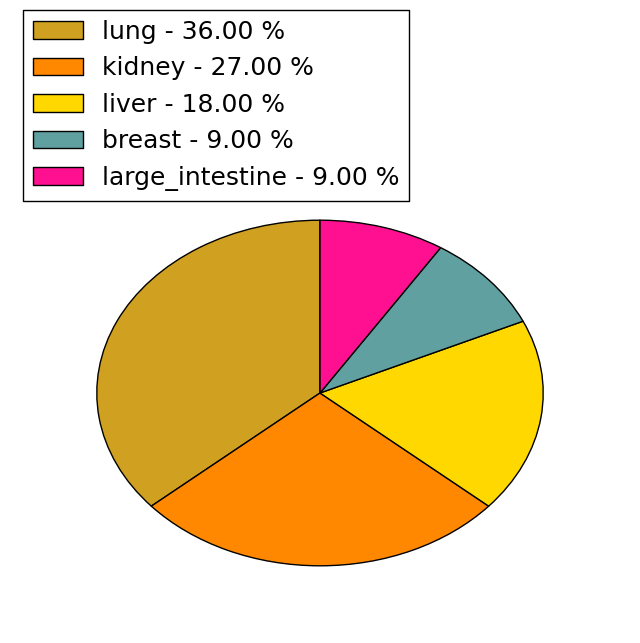
| * Under tables are showing count per each tissue to give us broad intuition about tissue specific mutation patterns.You can go to the detailed page for each mutation database's web site. |
| There's no structural variation information in COSMIC data for this gene. |
| * From mRNA Sanger sequences, Chitars2.0 arranged chimeric transcripts. This table shows TUBA1C related fusion information. |
| ID | Head Gene | Tail Gene | Accession | Gene_a | qStart_a | qEnd_a | Chromosome_a | tStart_a | tEnd_a | Gene_a | qStart_a | qEnd_a | Chromosome_a | tStart_a | tEnd_a |
| BM785206 | TUBA1C | 4 | 389 | 12 | 49658867 | 49663672 | RPS23 | 383 | 455 | 5 | 81571883 | 81571955 | |
| CD368754 | NCF2 | 18 | 335 | 1 | 183524697 | 183525014 | TUBA1C | 330 | 634 | 12 | 49666095 | 49666398 | |
| CD367941 | TUBA1C | 16 | 581 | 12 | 49666552 | 49667117 | UBB | 577 | 698 | 17 | 16285676 | 16285798 | |
| BE907310 | TUBA1C | 1 | 539 | 12 | 49666560 | 49667098 | VPS39 | 539 | 742 | 15 | 42451247 | 42451456 | |
| Top |
| There's no copy number variation information in COSMIC data for this gene. |
| Top |
|
 |
| Top |
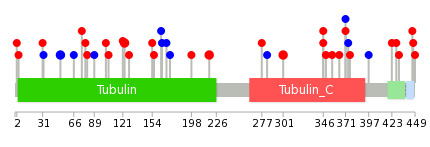
| Stat. for Non-Synonymous SNVs (# total SNVs=30) | (# total SNVs=11) |
 |  |
(# total SNVs=0) | (# total SNVs=0) |
| Top |
| * When you move the cursor on each content, you can see more deailed mutation information on the Tooltip. Those are primary_site,primary_histology,mutation(aa),pubmedID. |
| GRCh37 position | Mutation(aa) | Unique sampleID count |
| chr12:49666312-49666312 | p.D218N | 2 |
| chr12:49663751-49663751 | p.R123C | 2 |
| chr12:49663397-49663397 | p.T51T | 2 |
| chr12:49666563-49666563 | p.Q301H | 2 |
| chr12:49666152-49666152 | p.K164K | 1 |
| chr12:49666705-49666705 | p.T349A | 1 |
| chr12:49666942-49666942 | p.L428F | 1 |
| chr12:49663626-49663626 | p.G81D | 1 |
| chr12:49666155-49666155 | p.S165S | 1 |
| chr12:49666727-49666727 | p.N356S | 1 |
| Top |
|
 |
| Point Mutation/ Tissue ID | 1 | 2 | 3 | 4 | 5 | 6 | 7 | 8 | 9 | 10 | 11 | 12 | 13 | 14 | 15 | 16 | 17 | 18 | 19 | 20 |
| # sample | 1 | 2 | 1 | 5 | 2 | 3 | 3 | 2 | 3 | 5 | ||||||||||
| # mutation | 1 | 2 | 1 | 5 | 2 | 3 | 3 | 2 | 3 | 5 | ||||||||||
| nonsynonymous SNV | 1 | 2 | 1 | 4 | 2 | 1 | 1 | 3 | 5 | |||||||||||
| synonymous SNV | 1 | 2 | 1 | 2 | 1 |
| cf) Tissue ID; Tissue type (1; BLCA[Bladder Urothelial Carcinoma], 2; BRCA[Breast invasive carcinoma], 3; CESC[Cervical squamous cell carcinoma and endocervical adenocarcinoma], 4; COAD[Colon adenocarcinoma], 5; GBM[Glioblastoma multiforme], 6; Glioma Low Grade, 7; HNSC[Head and Neck squamous cell carcinoma], 8; KICH[Kidney Chromophobe], 9; KIRC[Kidney renal clear cell carcinoma], 10; KIRP[Kidney renal papillary cell carcinoma], 11; LAML[Acute Myeloid Leukemia], 12; LUAD[Lung adenocarcinoma], 13; LUSC[Lung squamous cell carcinoma], 14; OV[Ovarian serous cystadenocarcinoma ], 15; PAAD[Pancreatic adenocarcinoma], 16; PRAD[Prostate adenocarcinoma], 17; SKCM[Skin Cutaneous Melanoma], 18:STAD[Stomach adenocarcinoma], 19:THCA[Thyroid carcinoma], 20:UCEC[Uterine Corpus Endometrial Carcinoma]) |
| Top |
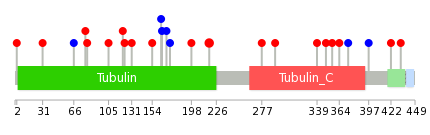
| * We represented just top 10 SNVs. When you move the cursor on each content, you can see more deailed mutation information on the Tooltip. Those are primary_site, primary_histology, mutation(aa), pubmedID. |
| Genomic Position | Mutation(aa) | Unique sampleID count |
| chr12:49666312 | p.D218N | 2 |
| chr12:49666675 | p.S165S | 1 |
| chr12:49666051 | p.S170S | 1 |
| chr12:49666705 | p.A174A | 1 |
| chr12:49666122 | p.S198P | 1 |
| chr12:49666727 | p.R2P | 1 |
| chr12:49666152 | p.S277C | 1 |
| chr12:49666750 | p.Q31L | 1 |
| chr12:49663249 | p.T292A | 1 |
| chr12:49666155 | p.V66V | 1 |
| * Copy number data were extracted from TCGA using R package TCGA-Assembler. The URLs of all public data files on TCGA DCC data server were gathered on Jan-05-2015. Function ProcessCNAData in TCGA-Assembler package was used to obtain gene-level copy number value which is calculated as the average copy number of the genomic region of a gene. |
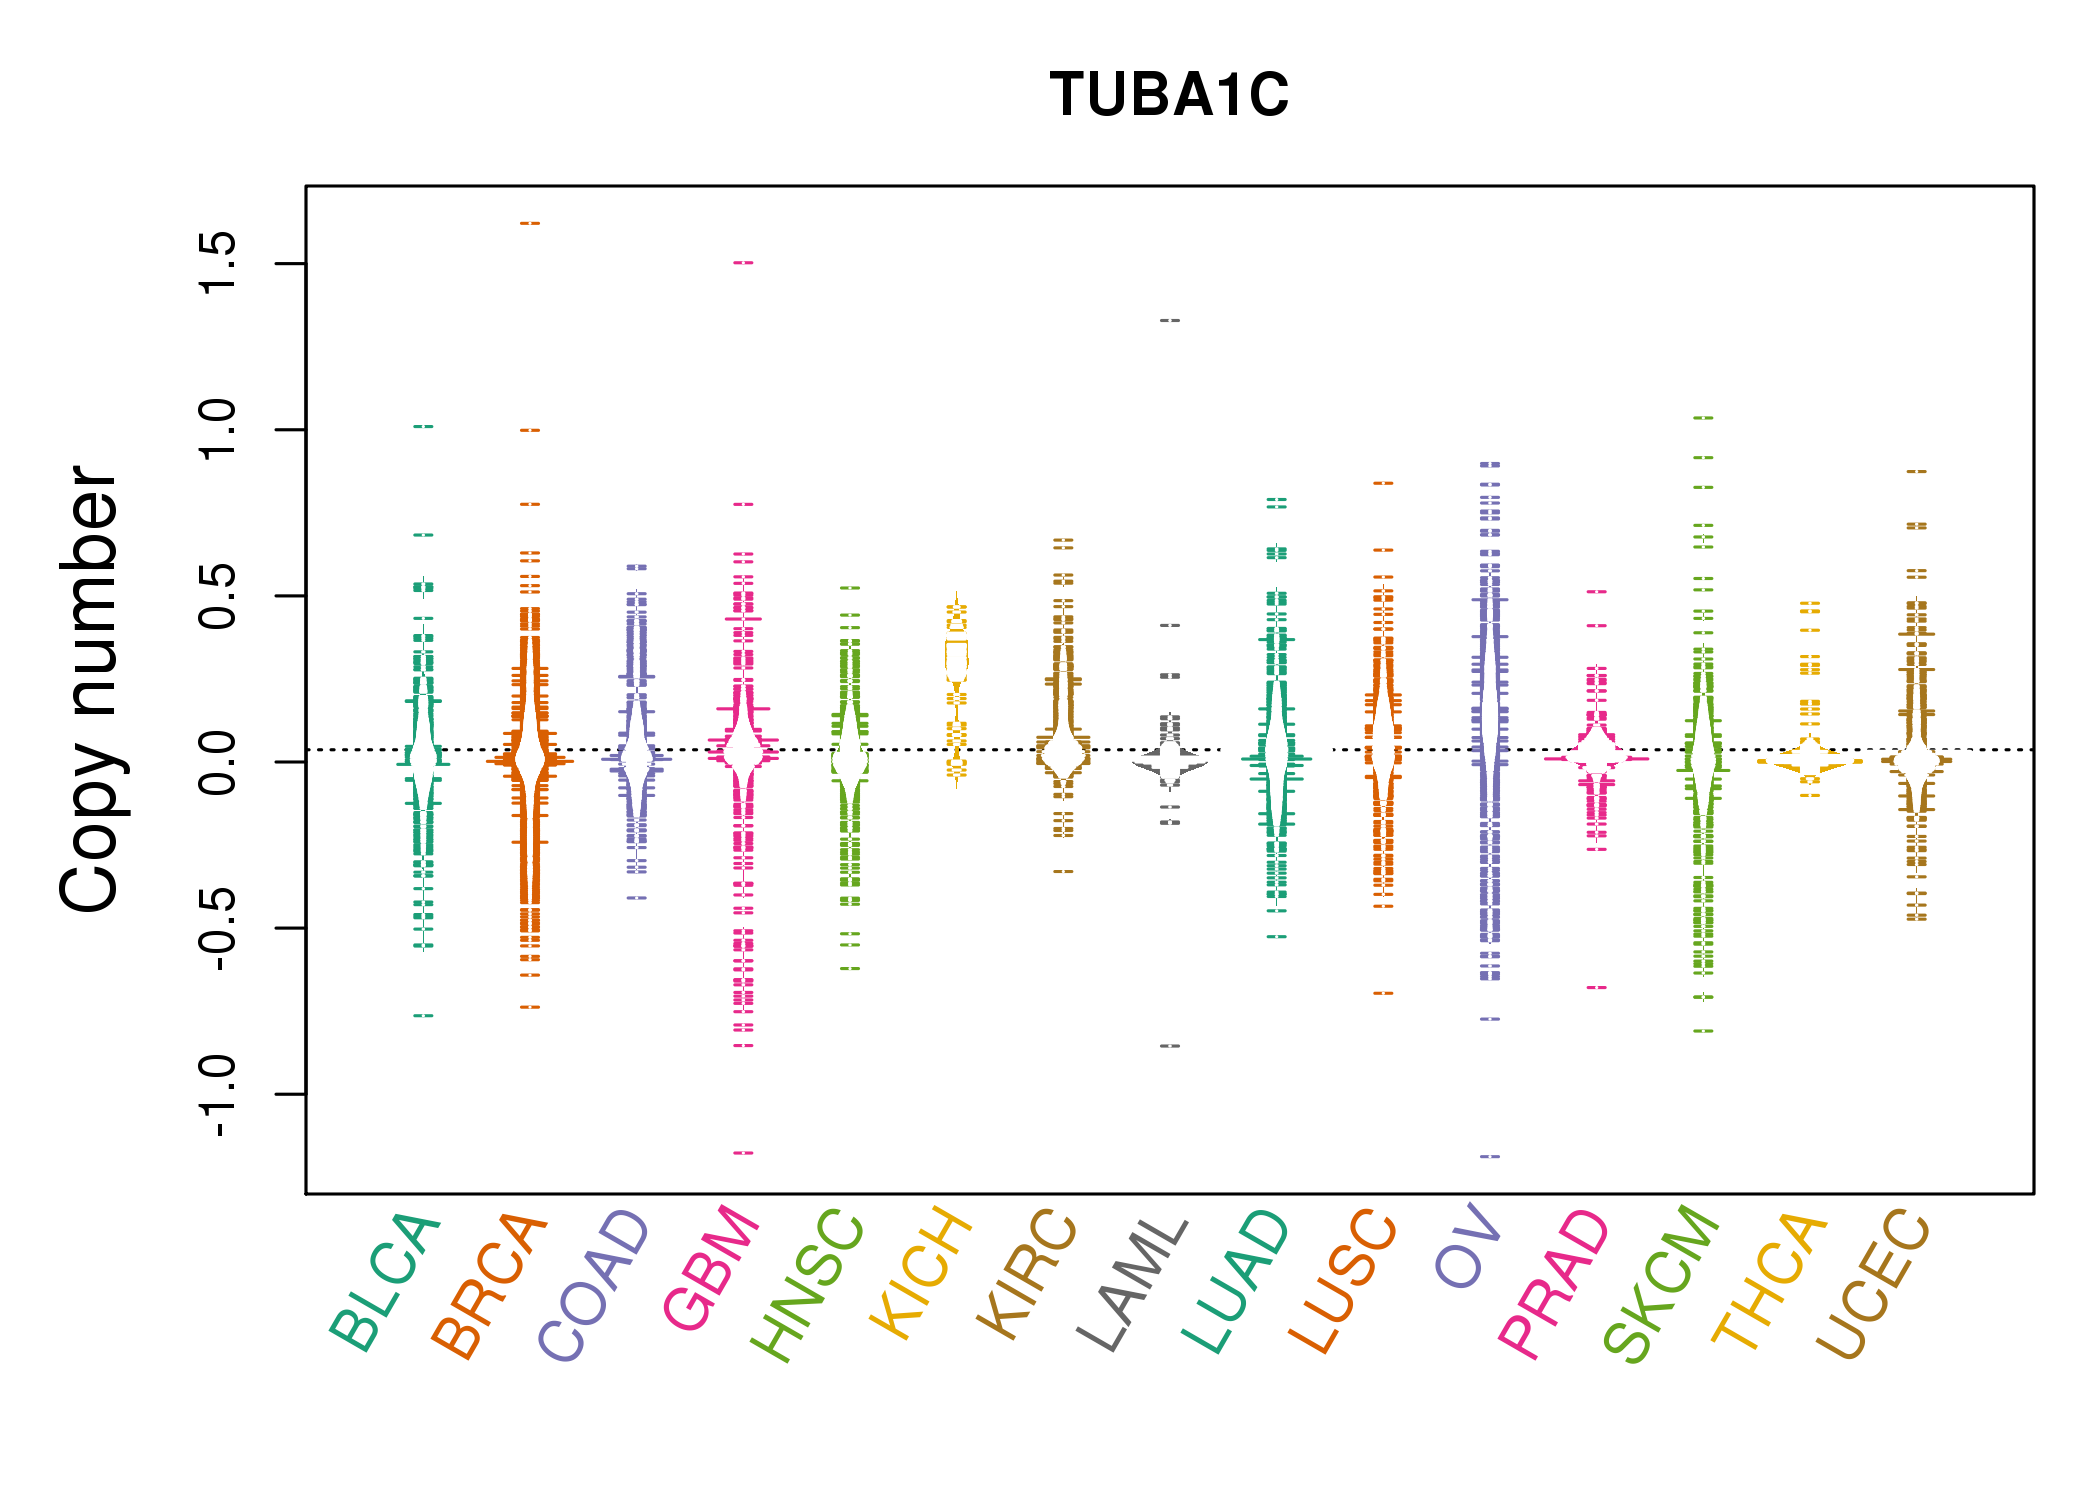 |
| cf) Tissue ID[Tissue type]: BLCA[Bladder Urothelial Carcinoma], BRCA[Breast invasive carcinoma], CESC[Cervical squamous cell carcinoma and endocervical adenocarcinoma], COAD[Colon adenocarcinoma], GBM[Glioblastoma multiforme], Glioma Low Grade, HNSC[Head and Neck squamous cell carcinoma], KICH[Kidney Chromophobe], KIRC[Kidney renal clear cell carcinoma], KIRP[Kidney renal papillary cell carcinoma], LAML[Acute Myeloid Leukemia], LUAD[Lung adenocarcinoma], LUSC[Lung squamous cell carcinoma], OV[Ovarian serous cystadenocarcinoma ], PAAD[Pancreatic adenocarcinoma], PRAD[Prostate adenocarcinoma], SKCM[Skin Cutaneous Melanoma], STAD[Stomach adenocarcinoma], THCA[Thyroid carcinoma], UCEC[Uterine Corpus Endometrial Carcinoma] |
| Top |
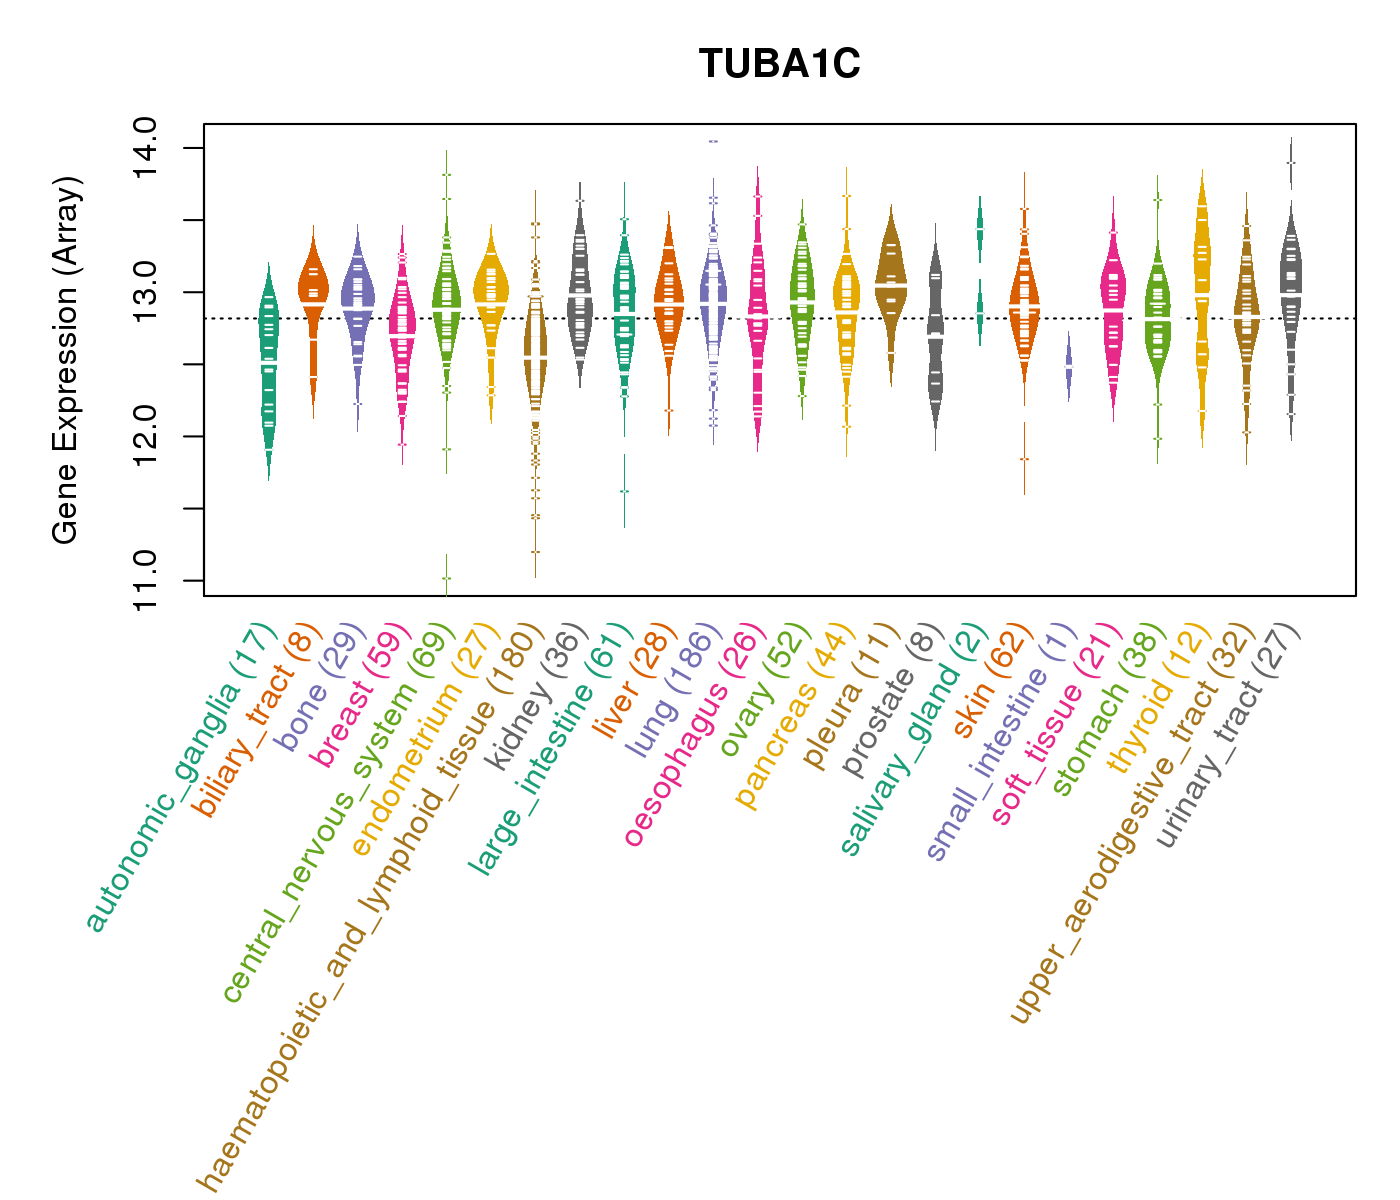
| Gene Expression for TUBA1C |
| * CCLE gene expression data were extracted from CCLE_Expression_Entrez_2012-10-18.res: Gene-centric RMA-normalized mRNA expression data. |
 |
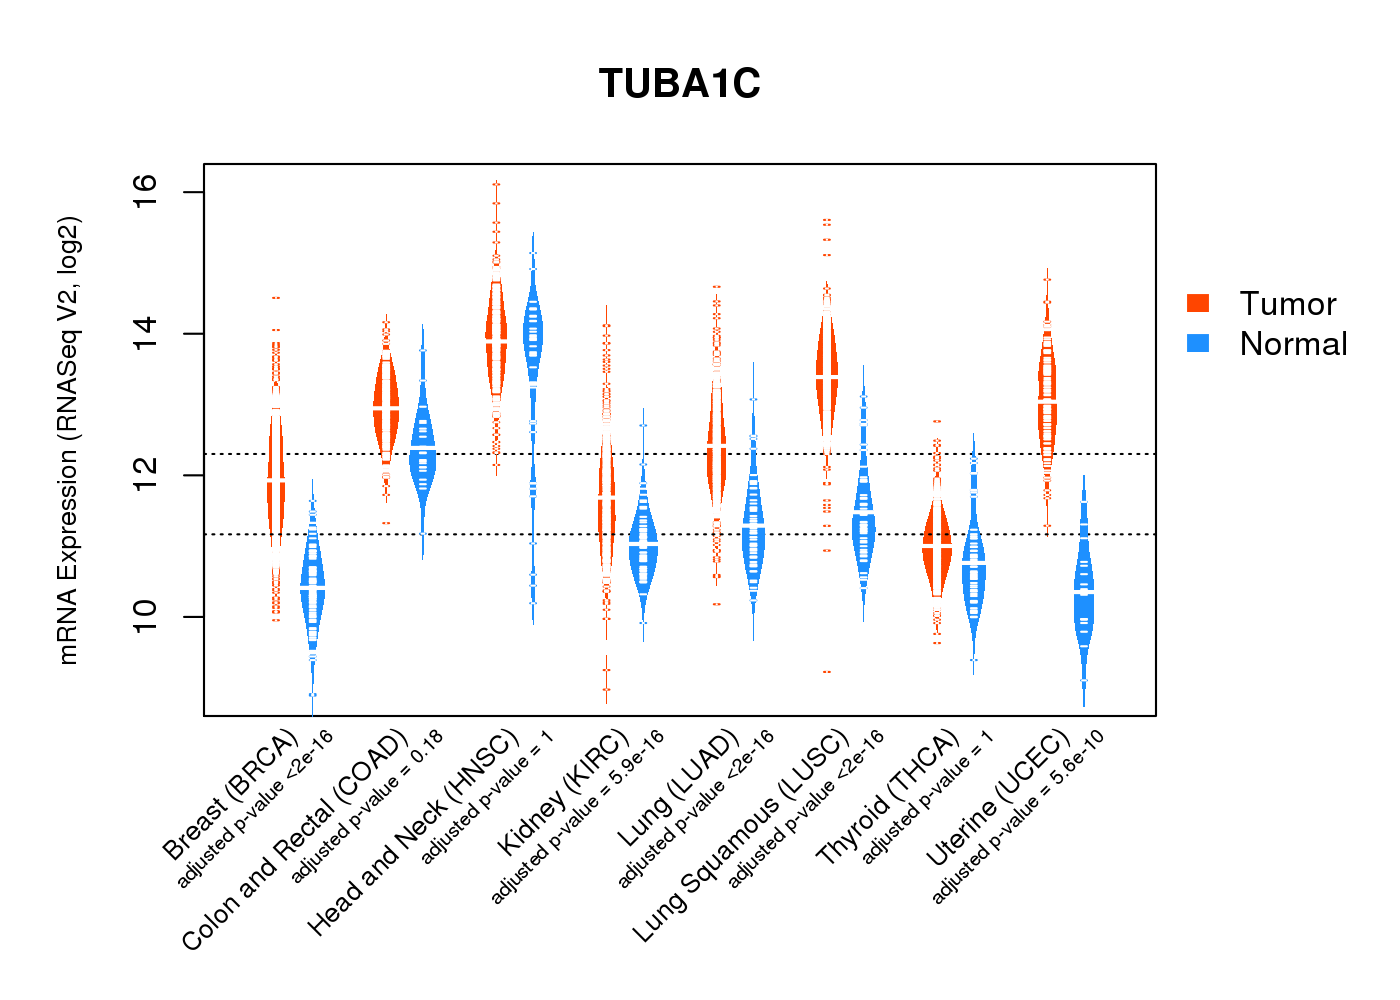
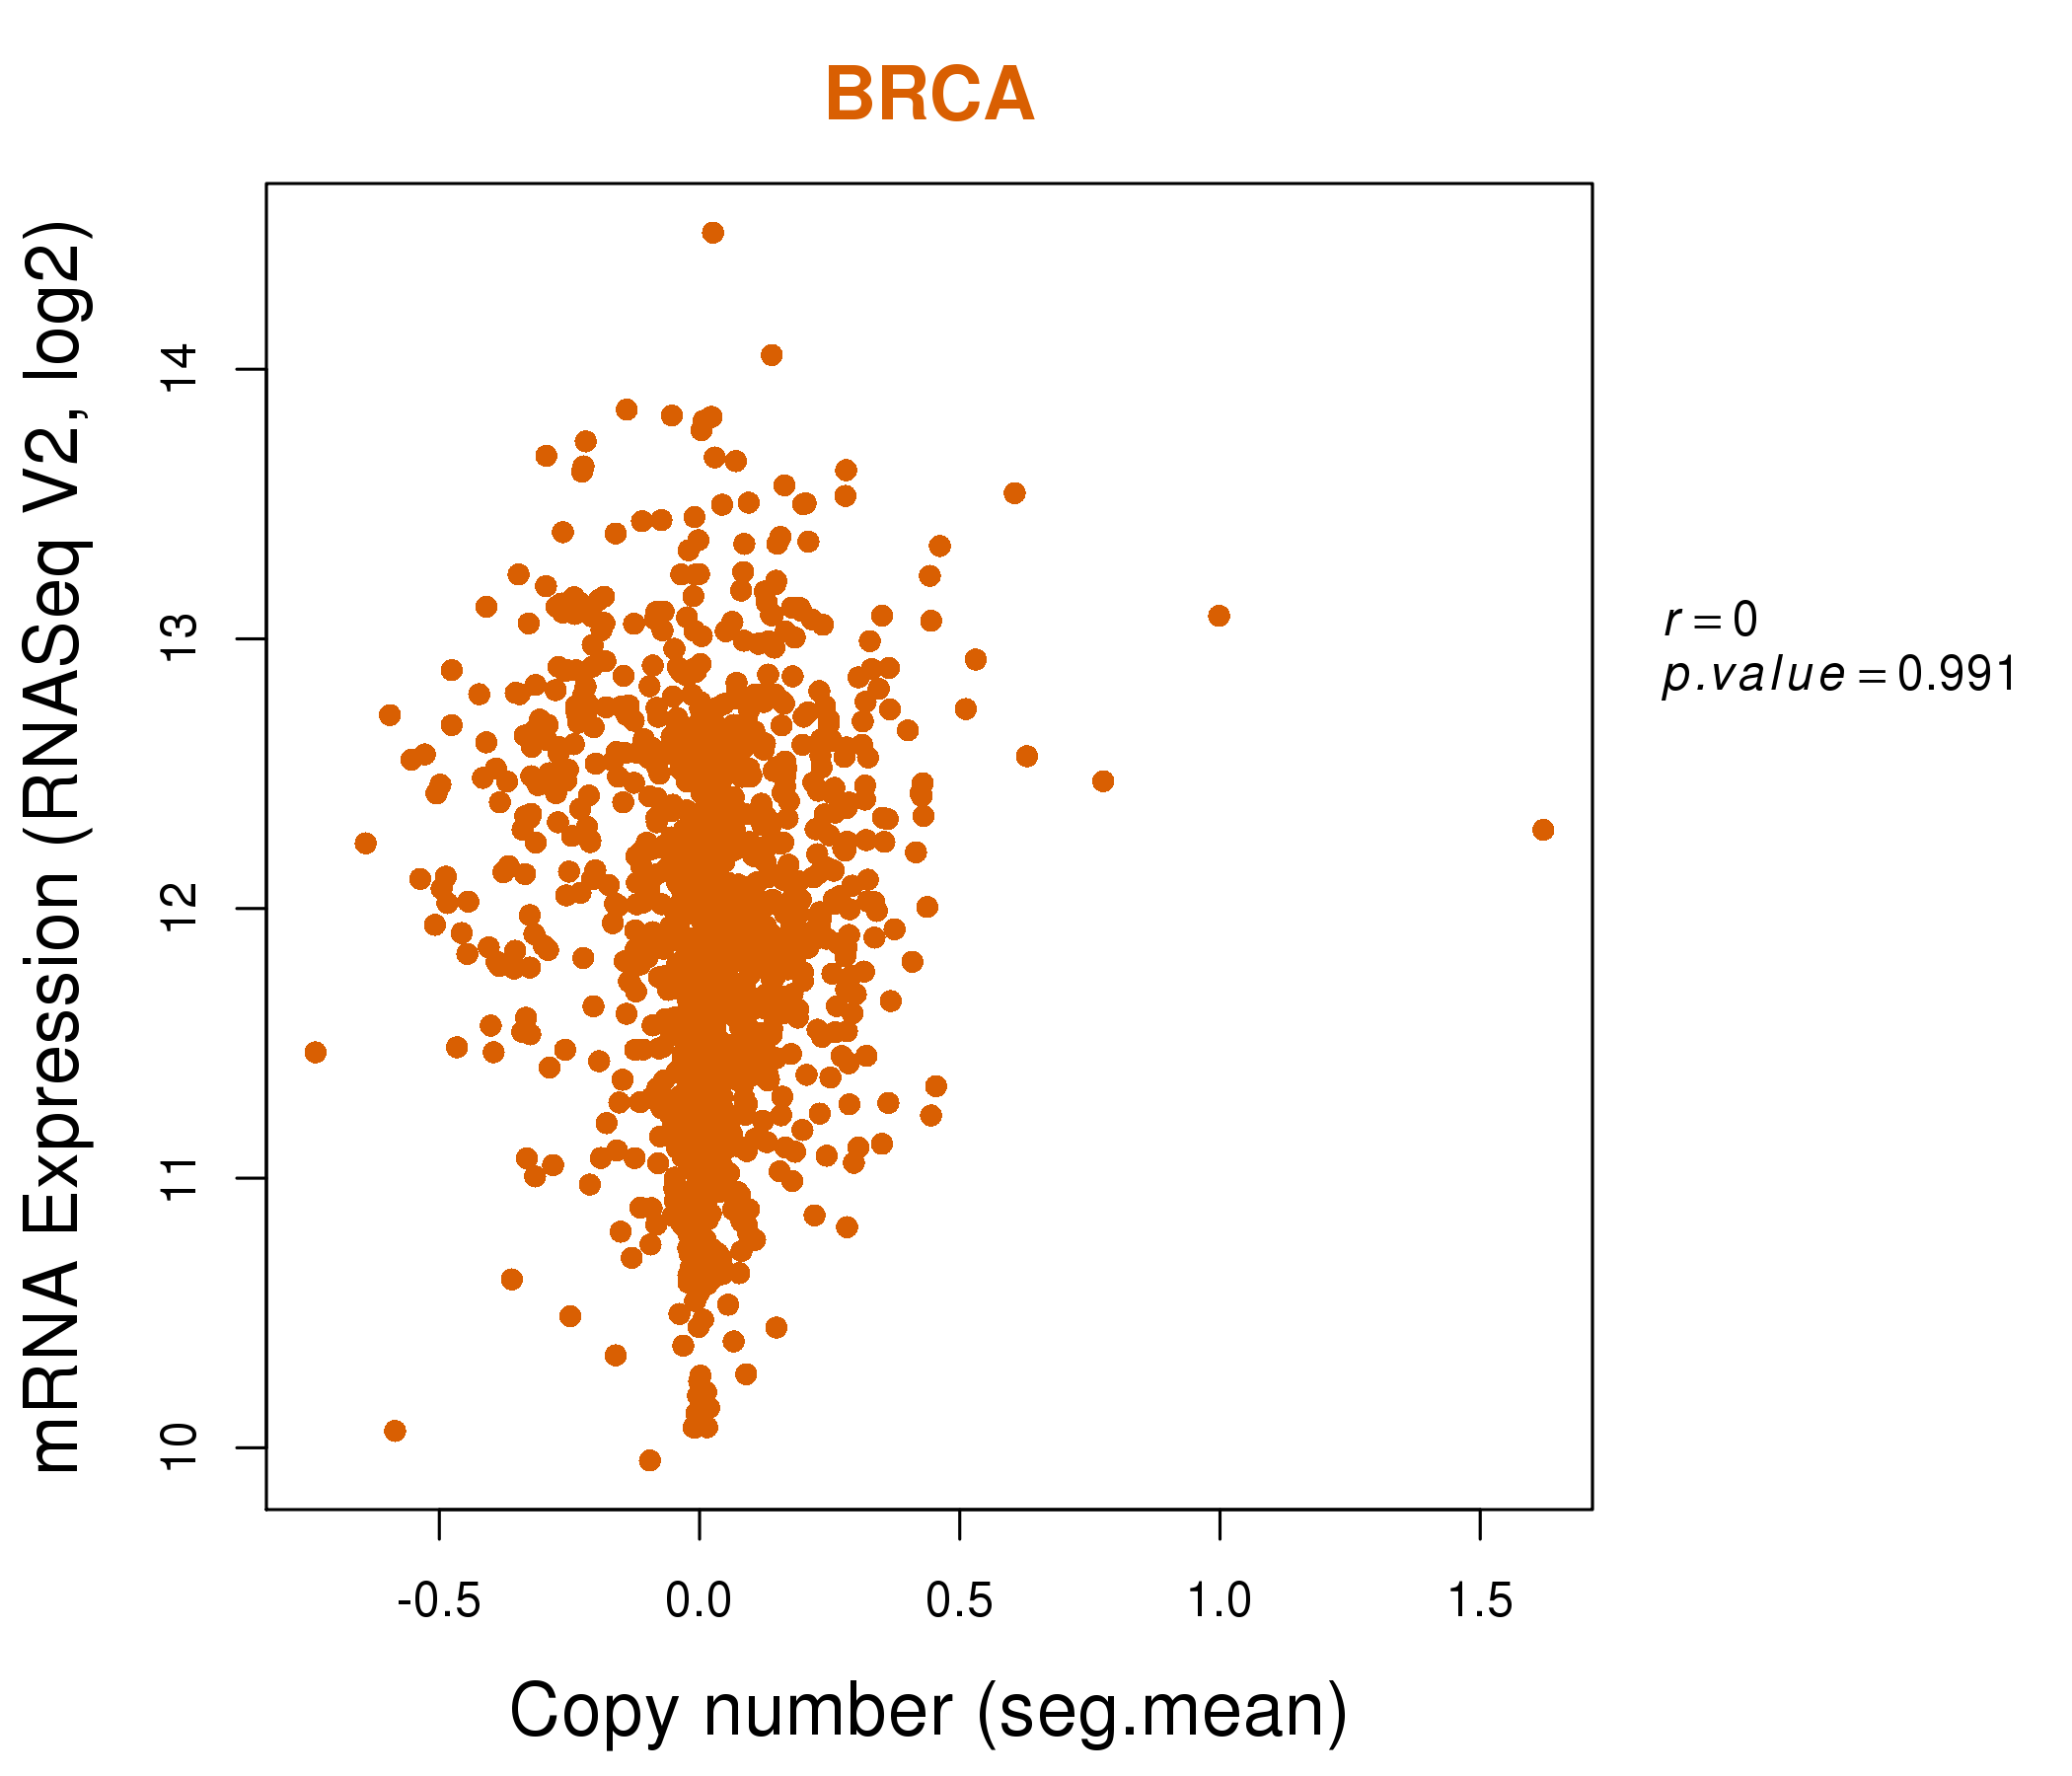
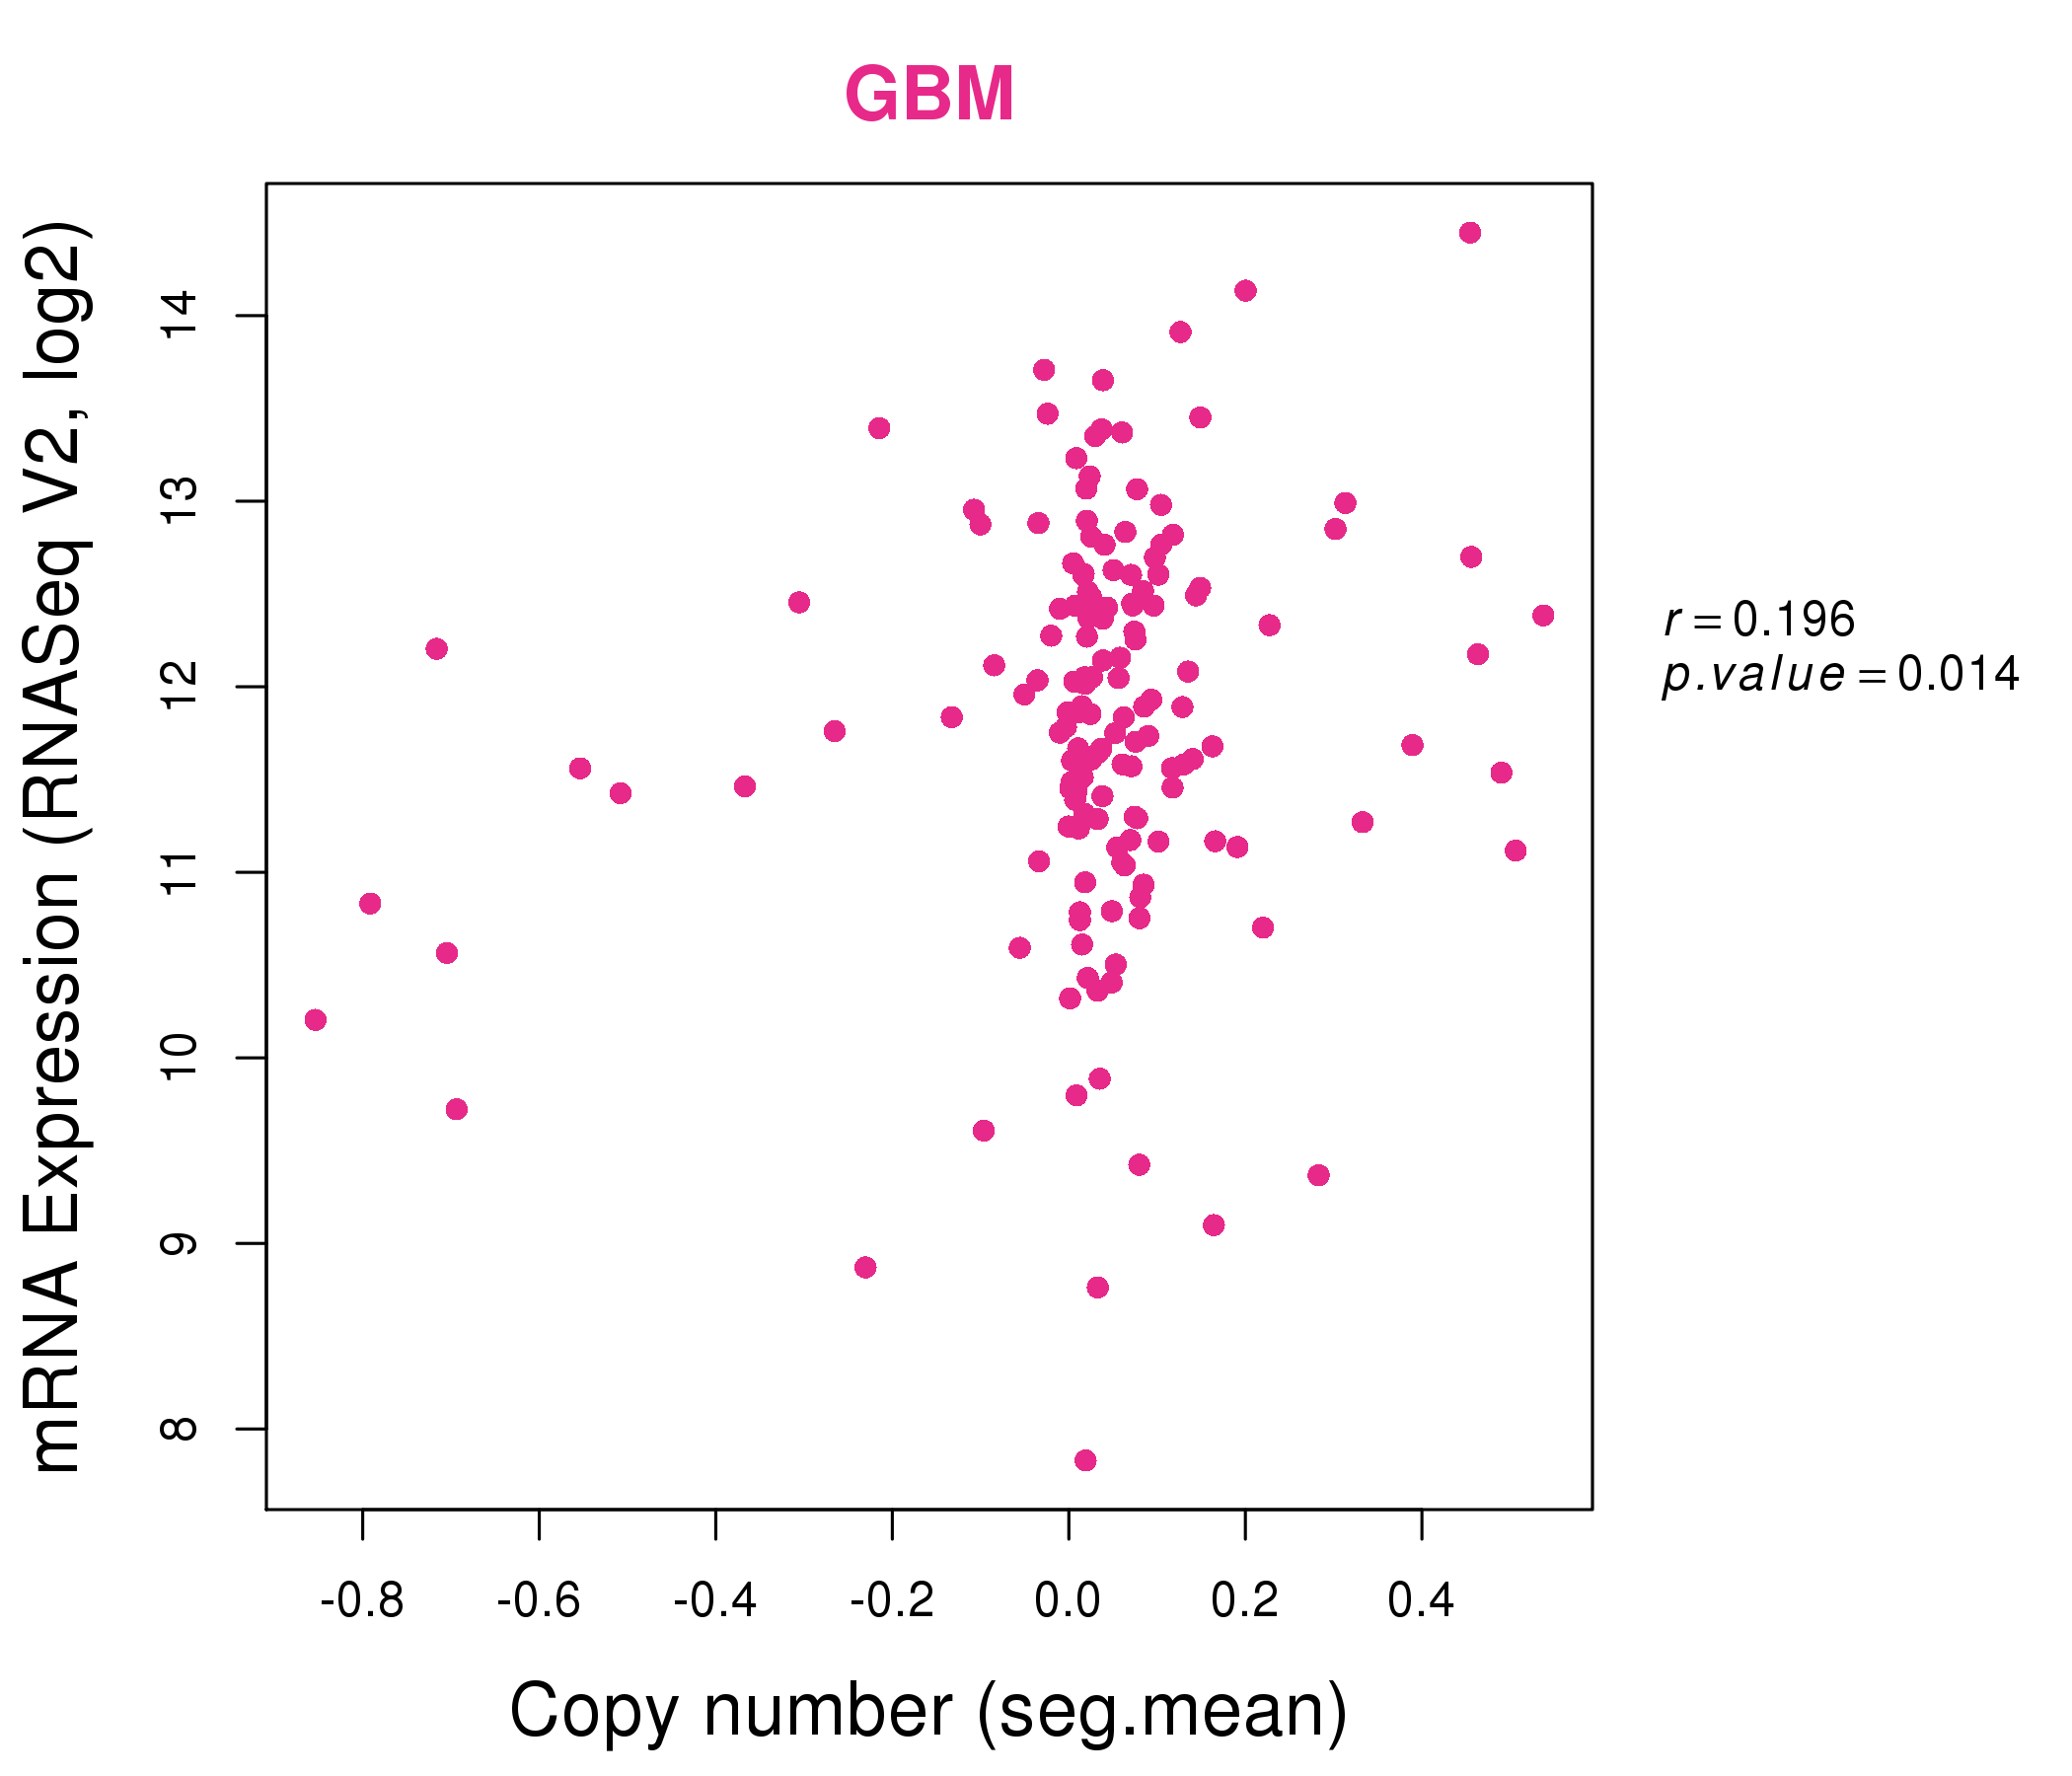
| * Normalized gene expression data of RNASeqV2 was extracted from TCGA using R package TCGA-Assembler. The URLs of all public data files on TCGA DCC data server were gathered at Jan-05-2015. Only eight cancer types have enough normal control samples for differential expression analysis. (t test, adjusted p<0.05 (using Benjamini-Hochberg FDR)) |
 |
| Top |
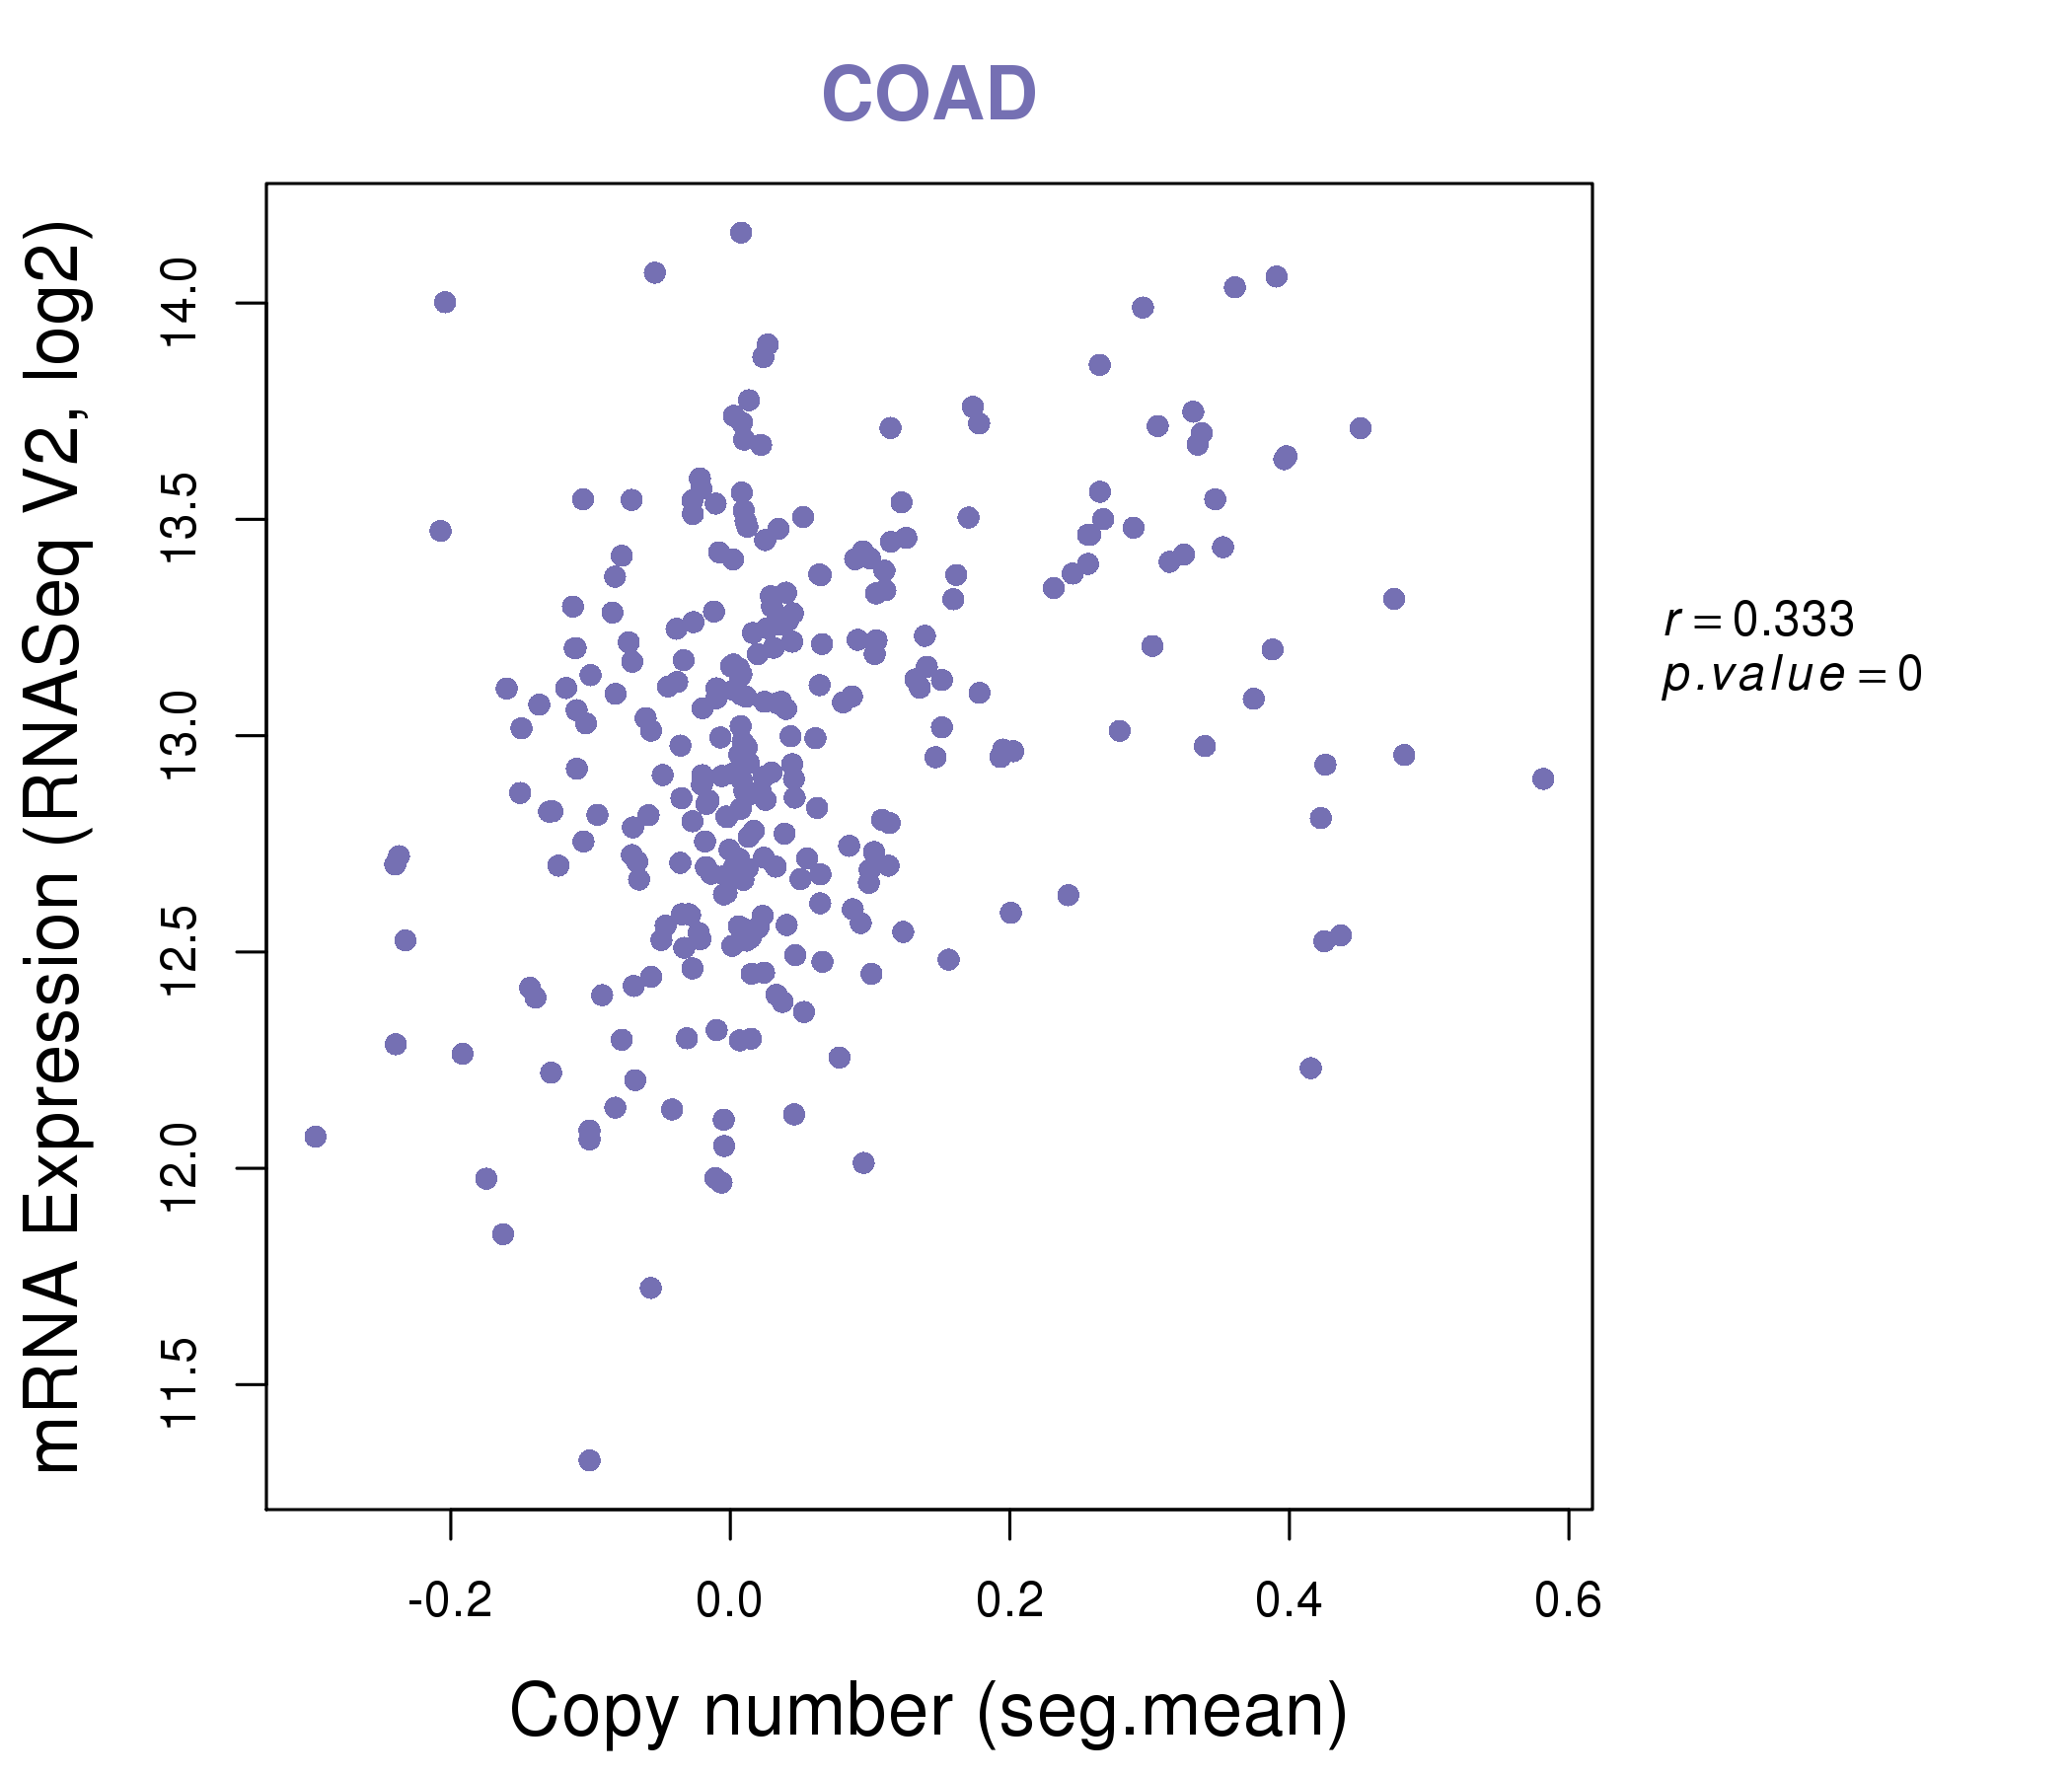
| * This plots show the correlation between CNV and gene expression. |
: Open all plots for all cancer types
 |
|
 |
|
| Top |
| Gene-Gene Network Information |
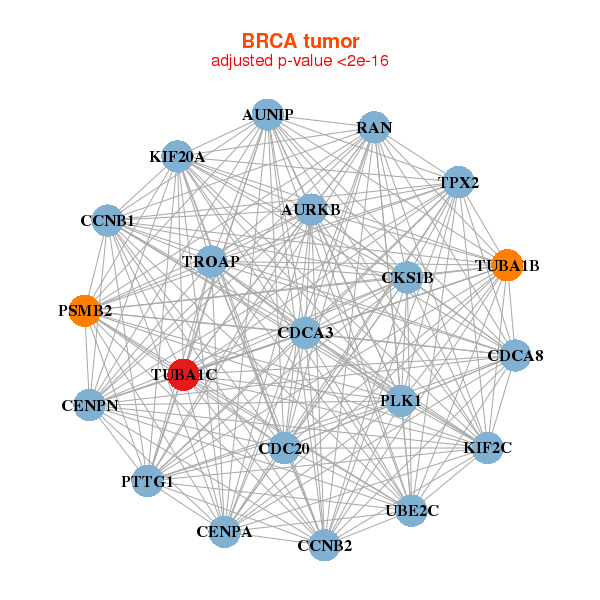
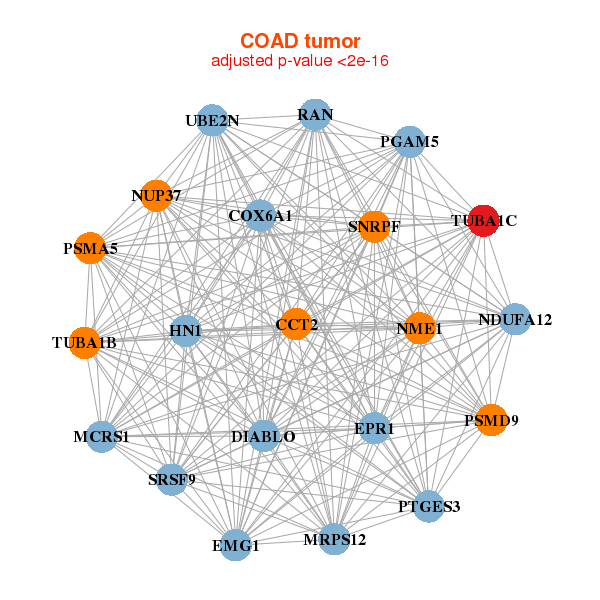
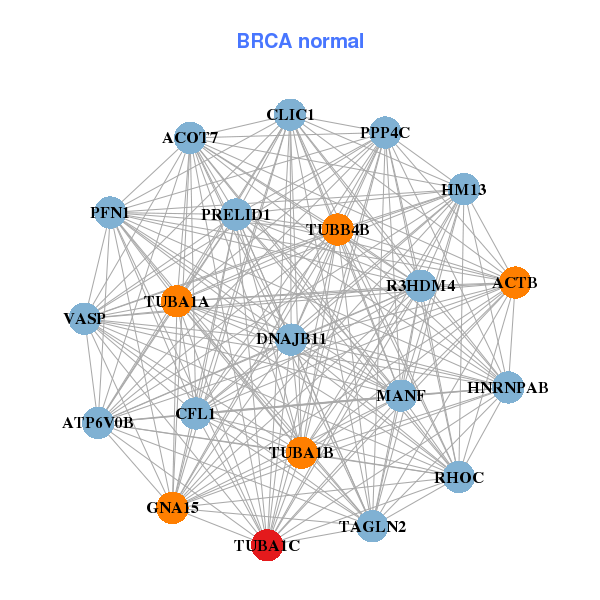
| * Co-Expression network figures were drawn using R package igraph. Only the top 20 genes with the highest correlations were shown. Red circle: input gene, orange circle: cell metabolism gene, sky circle: other gene |
: Open all plots for all cancer types
 |
| ||||
| AURKB,AUNIP,CCNB1,CCNB2,CDC20,CDCA3,CDCA8, CENPA,CENPN,CKS1B,KIF20A,KIF2C,PLK1,PSMB2, PTTG1,RAN,TPX2,TROAP,TUBA1B,TUBA1C,UBE2C | ACOT7,ACTB,ATP6V0B,R3HDM4,CFL1,CLIC1,DNAJB11, GNA15,HM13,HNRNPAB,MANF,PFN1,PPP4C,PRELID1, RHOC,TAGLN2,TUBA1A,TUBA1B,TUBA1C,TUBB4B,VASP | ||||
 |
| ||||
| CCT2,COX6A1,DIABLO,EMG1,EPR1,HN1,MCRS1, MRPS12,NDUFA12,NME1,NUP37,PGAM5,PSMA5,PSMD9, PTGES3,RAN,SRSF9,SNRPF,TUBA1B,TUBA1C,UBE2N | AAGAB,AMD1,ANXA2,ANXA2P2,ARPC4,ATG4A,BZW1, C12orf49,C20orf24,CSTF2,F2RL1,NMNAT1,ORMDL2,RABIF, SERPINB1,SLMO2,TAGLN2,TPMT,TUBA1C,TUBB4B,UPP1 |
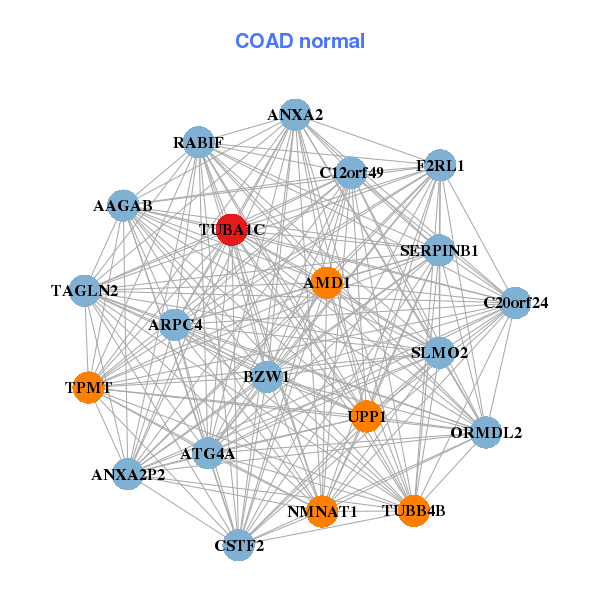
| * Co-Expression network figures were drawn using R package igraph. Only the top 20 genes with the highest correlations were shown. Red circle: input gene, orange circle: cell metabolism gene, sky circle: other gene |
: Open all plots for all cancer types
| Top |
: Open all interacting genes' information including KEGG pathway for all interacting genes from DAVID
| Top |
| Pharmacological Information for TUBA1C |
| DB Category | DB Name | DB's ID and Url link |
| * Gene Centered Interaction Network. |
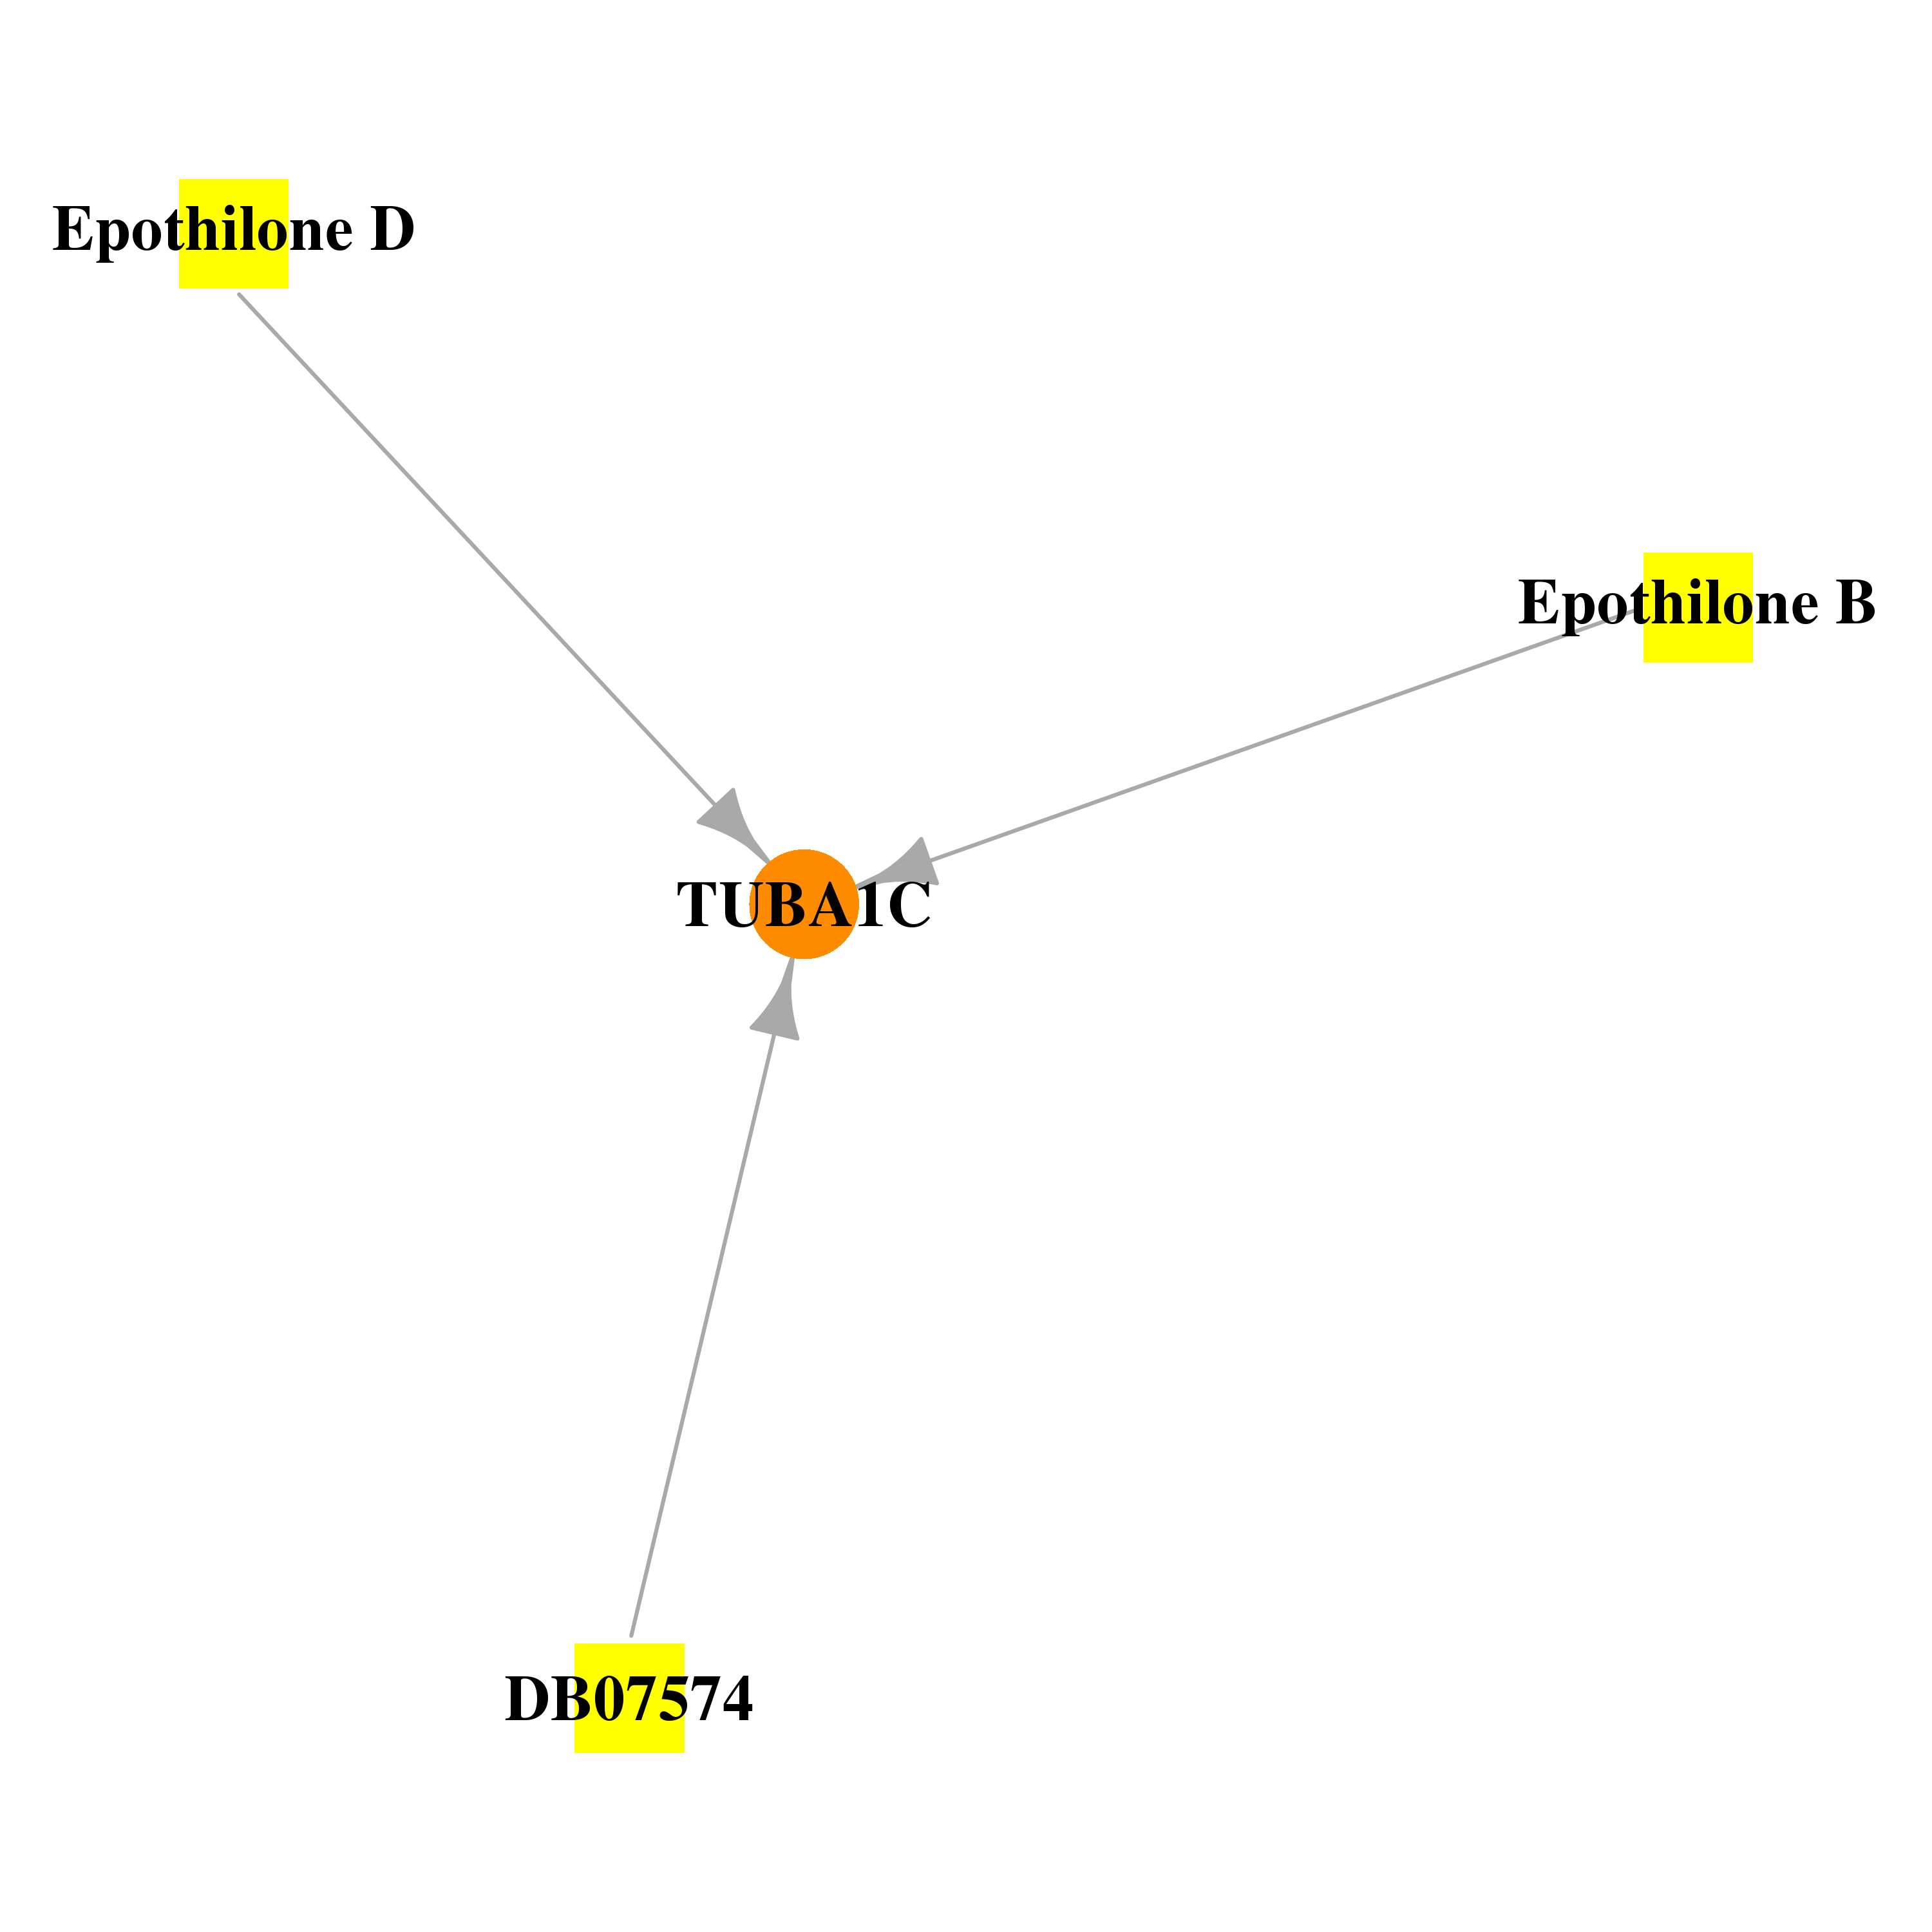 |
| * Drug Centered Interaction Network. |
| DrugBank ID | Target Name | Drug Groups | Generic Name | Drug Centered Network | Drug Structure |
| DB01873 | tubulin, alpha 1c | experimental; investigational | Epothilone D |  | 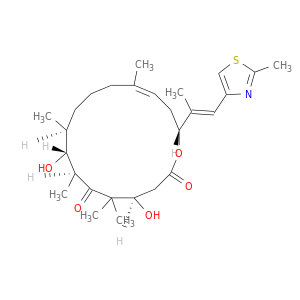 |
| DB03010 | tubulin, alpha 1c | experimental; investigational | Epothilone B | 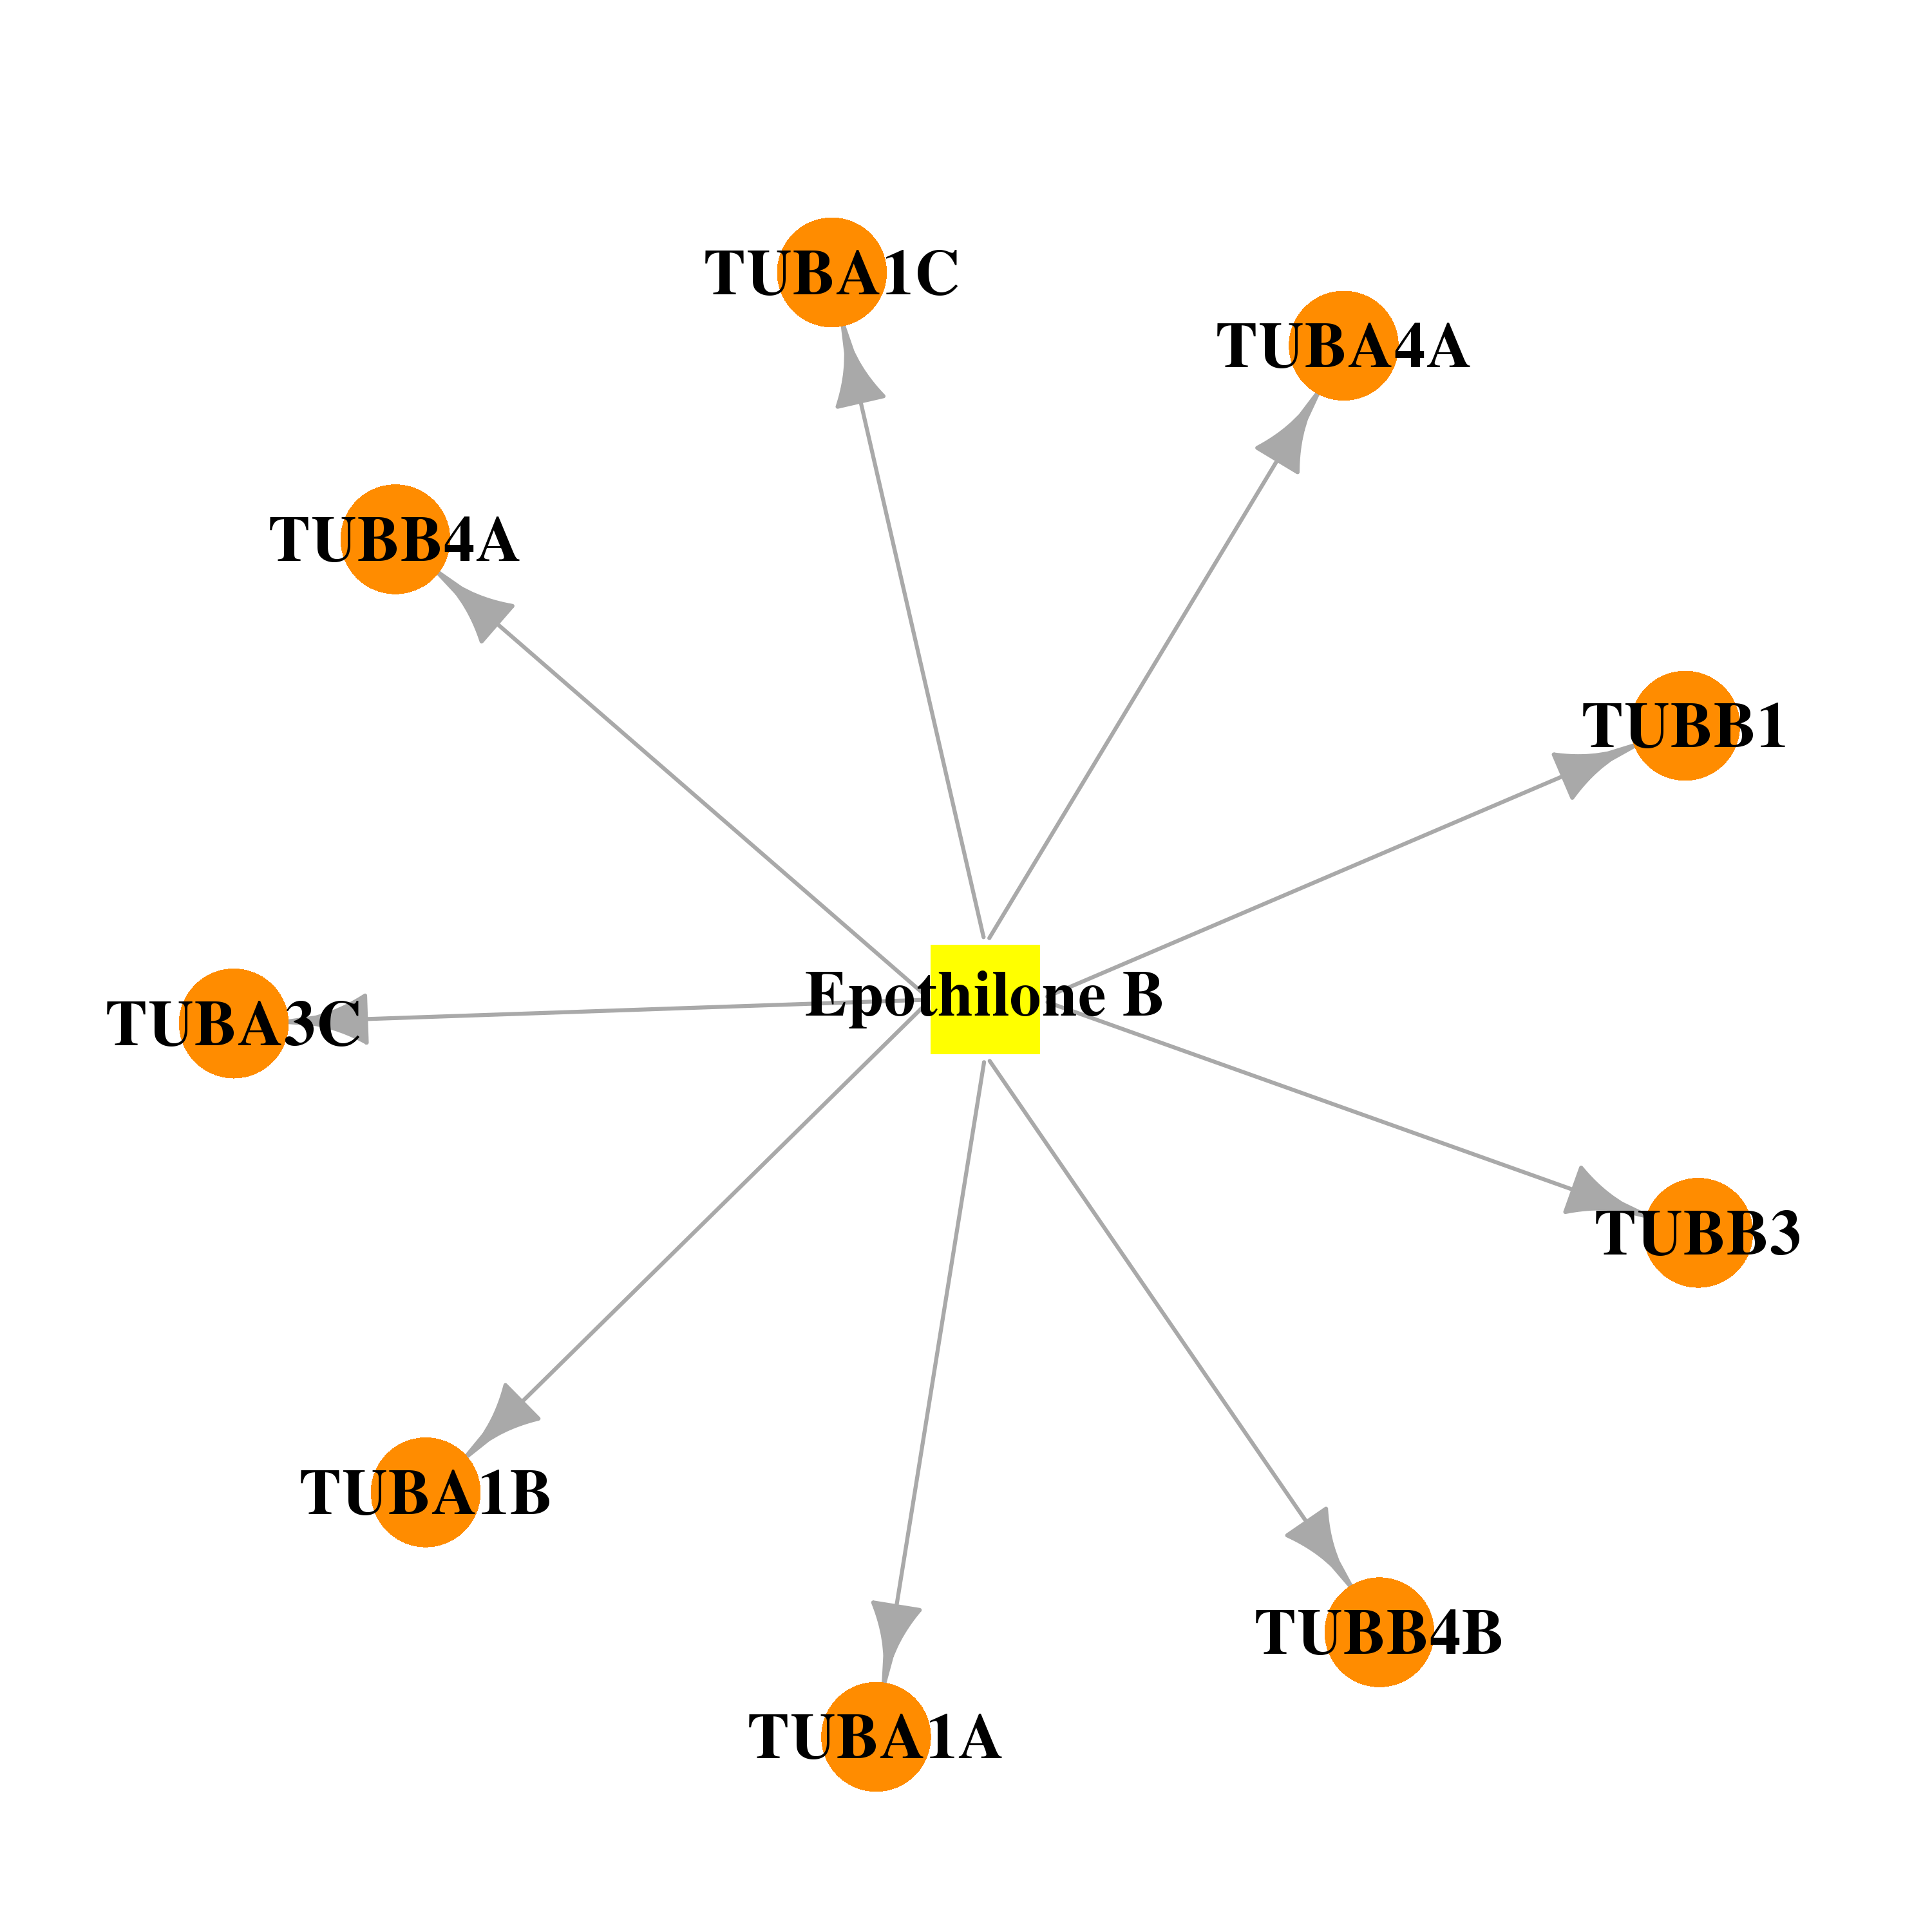 | 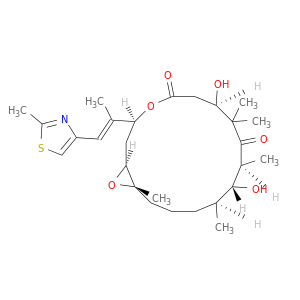 |
| DB07574 | tubulin, alpha 1c | experimental | 2-MERCAPTO-N-[1,2,3,10-TETRAMETHOXY-9-OXO-5,6,7,9-TETRAHYDRO-BENZO[A]HEPTALEN-7-YL]ACETAMIDE | 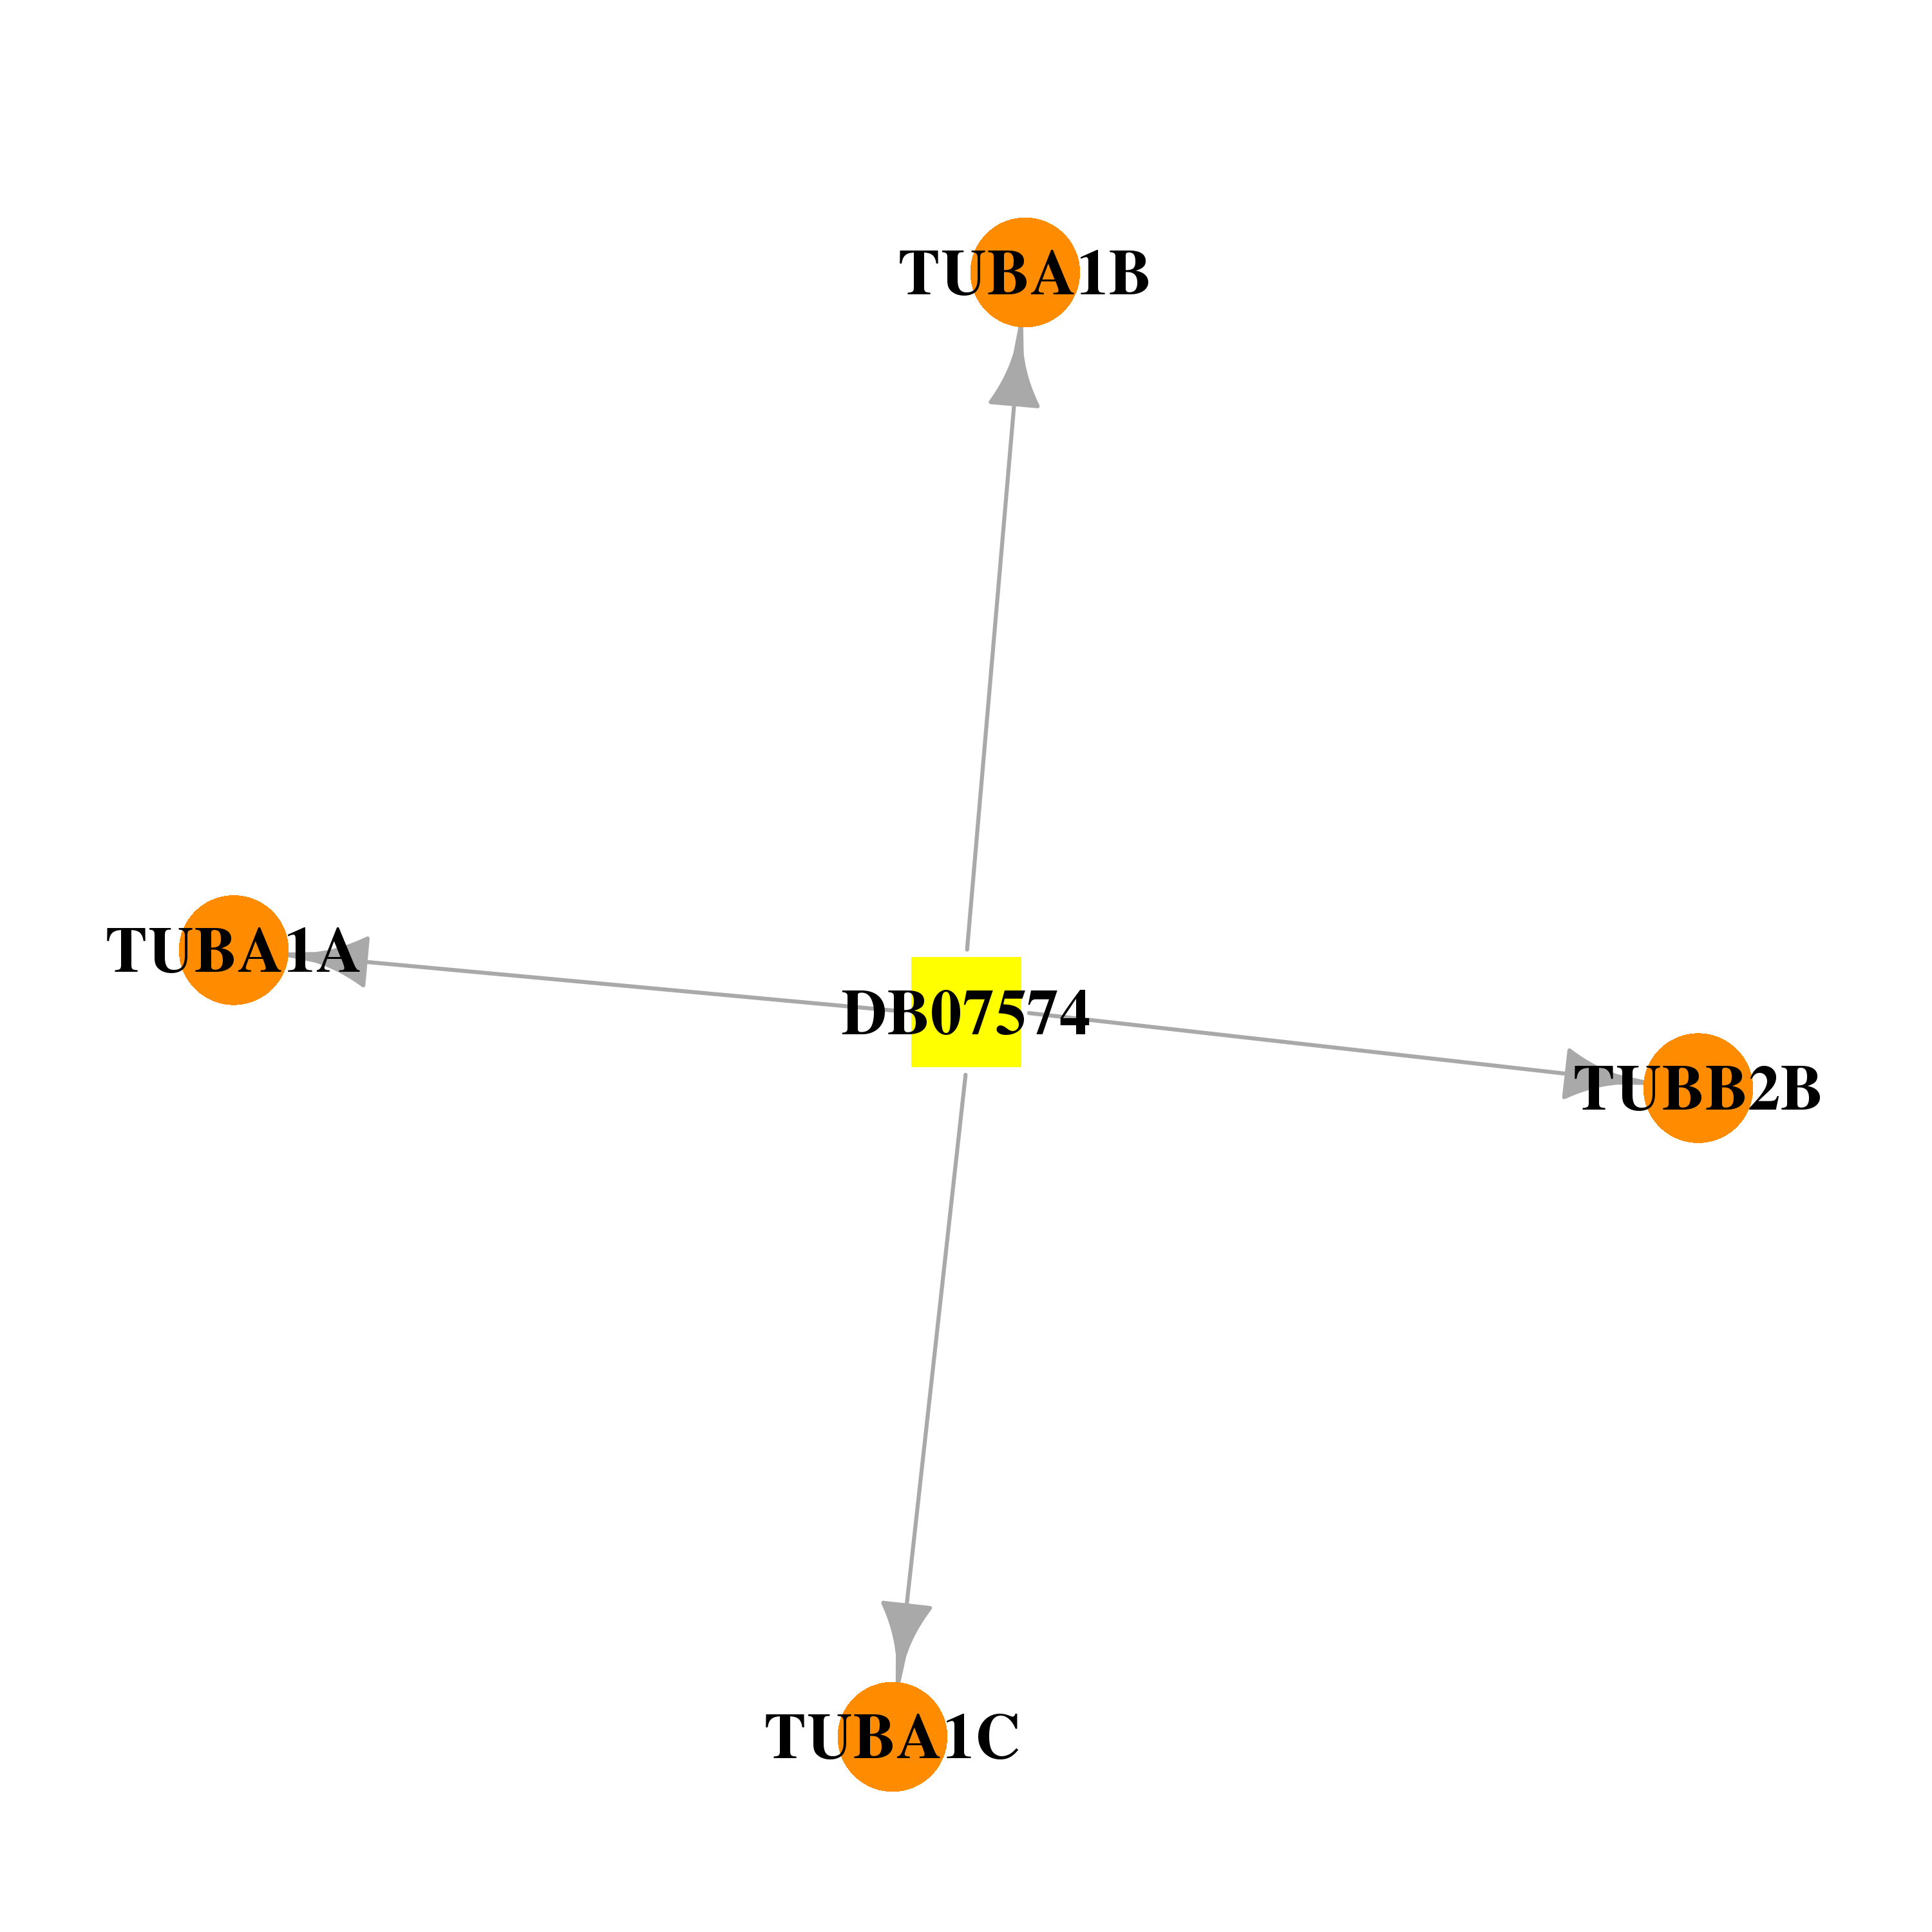 | 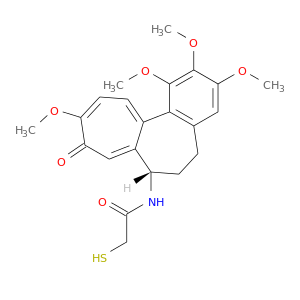 |
| Top |
| Cross referenced IDs for TUBA1C |
| * We obtained these cross-references from Uniprot database. It covers 150 different DBs, 18 categories. http://www.uniprot.org/help/cross_references_section |
: Open all cross reference information
|
Copyright © 2016-Present - The Univsersity of Texas Health Science Center at Houston @ |