|
||||||||||||||||||||||||||||||||||||||||||||||||||||||||||||||||||||||||||||||||||||||||||||||||||||||||||||||||||||||||||||||||||||||||||||||||||||||||||||||||||||||||||||||||||||||||||||||||||||||||||||||||||||||||||||||||||||||||||||||||||||||||||||||||||||||||||||||||||||||||||||||||||||||||||||||||||||||||||
| |
| Phenotypic Information (metabolism pathway, cancer, disease, phenome) |
| |
| |
| Gene-Gene Network Information: Co-Expression Network, Interacting Genes & KEGG |
| |
|


| Gene Summary for PLCD4 |
| Basic gene info. | Gene symbol | PLCD4 |
| Gene name | phospholipase C, delta 4 | |
| Synonyms | - | |
| Cytomap | UCSC genome browser: 2q35 | |
| Genomic location | chr2 :219472487-219501909 | |
| Type of gene | protein-coding | |
| RefGenes | NM_032726.3, | |
| Ensembl id | ENSG00000115556 | |
| Description | 1-phosphatidylinositol 4,5-bisphosphate phosphodiesterase delta-41-phosphatidylinositol-4,5-bisphosphate phosphodiesterase delta-4PLC delta4phosphoinositide phospholipase C-delta-4 | |
| Modification date | 20141207 | |
| dbXrefs | MIM : 605939 | |
| HGNC : HGNC | ||
| Ensembl : ENSG00000115556 | ||
| HPRD : 07296 | ||
| Vega : OTTHUMG00000154743 | ||
| Protein | UniProt: go to UniProt's Cross Reference DB Table | |
| Expression | CleanEX: HS_PLCD4 | |
| BioGPS: 84812 | ||
| Gene Expression Atlas: ENSG00000115556 | ||
| The Human Protein Atlas: ENSG00000115556 | ||
| Pathway | NCI Pathway Interaction Database: PLCD4 | |
| KEGG: PLCD4 | ||
| REACTOME: PLCD4 | ||
| ConsensusPathDB | ||
| Pathway Commons: PLCD4 | ||
| Metabolism | MetaCyc: PLCD4 | |
| HUMANCyc: PLCD4 | ||
| Regulation | Ensembl's Regulation: ENSG00000115556 | |
| miRBase: chr2 :219,472,487-219,501,909 | ||
| TargetScan: NM_032726 | ||
| cisRED: ENSG00000115556 | ||
| Context | iHOP: PLCD4 | |
| cancer metabolism search in PubMed: PLCD4 | ||
| UCL Cancer Institute: PLCD4 | ||
| Assigned class in ccmGDB | C | |
| Top |
| Phenotypic Information for PLCD4(metabolism pathway, cancer, disease, phenome) |
| Cancer | CGAP: PLCD4 |
| Familial Cancer Database: PLCD4 | |
| * This gene is included in those cancer gene databases. |
|
|
|
|
|
| . | ||||||||||||||||||||||||||||||||||||||||||||||||||||||||||||||||||||||||||||||||||||||||||||||||||||||||||||||||||||||||||||||||||||||||||||||||||||||||||||||||||||||||||||||||||||||||||||||||||||||||||||||||||||||||||||||||||||||||||||||||||||||||||||||||||||||||||||||||||||||||||||||||||||||||||||||||||||
Oncogene 1 | Significant driver gene in | |||||||||||||||||||||||||||||||||||||||||||||||||||||||||||||||||||||||||||||||||||||||||||||||||||||||||||||||||||||||||||||||||||||||||||||||||||||||||||||||||||||||||||||||||||||||||||||||||||||||||||||||||||||||||||||||||||||||||||||||||||||||||||||||||||||||||||||||||||||||||||||||||||||||||||||||||||||||||
| cf) number; DB name 1 Oncogene; http://nar.oxfordjournals.org/content/35/suppl_1/D721.long, 2 Tumor Suppressor gene; https://bioinfo.uth.edu/TSGene/, 3 Cancer Gene Census; http://www.nature.com/nrc/journal/v4/n3/abs/nrc1299.html, 4 CancerGenes; http://nar.oxfordjournals.org/content/35/suppl_1/D721.long, 5 Network of Cancer Gene; http://ncg.kcl.ac.uk/index.php, 1Therapeutic Vulnerabilities in Cancer; http://cbio.mskcc.org/cancergenomics/statius/ |
| KEGG_INOSITOL_PHOSPHATE_METABOLISM | |
| OMIM | |
| Orphanet | |
| Disease | KEGG Disease: PLCD4 |
| MedGen: PLCD4 (Human Medical Genetics with Condition) | |
| ClinVar: PLCD4 | |
| Phenotype | MGI: PLCD4 (International Mouse Phenotyping Consortium) |
| PhenomicDB: PLCD4 | |
| Mutations for PLCD4 |
| * Under tables are showing count per each tissue to give us broad intuition about tissue specific mutation patterns.You can go to the detailed page for each mutation database's web site. |
| - Statistics for Tissue and Mutation type | Top |
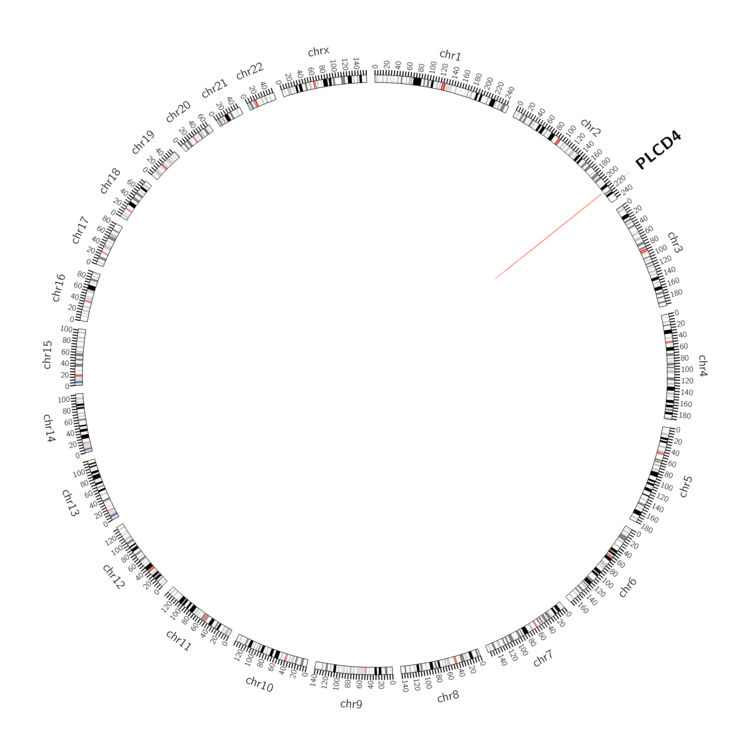 |
| - For Inter-chromosomal Variations |
| There's no inter-chromosomal structural variation. |
| - For Intra-chromosomal Variations |
| * Intra-chromosomal variantions includes 'intrachromosomal amplicon to amplicon', 'intrachromosomal amplicon to non-amplified dna', 'intrachromosomal deletion', 'intrachromosomal fold-back inversion', 'intrachromosomal inversion', 'intrachromosomal tandem duplication', 'Intrachromosomal unknown type', 'intrachromosomal with inverted orientation', 'intrachromosomal with non-inverted orientation'. |
 |
| Sample | Symbol_a | Chr_a | Start_a | End_a | Symbol_b | Chr_b | Start_b | End_b |
| ovary | PLCD4 | chr2 | 219492269 | 219492289 | chr2 | 218124122 | 218124142 |
| cf) Tissue number; Tissue name (1;Breast, 2;Central_nervous_system, 3;Haematopoietic_and_lymphoid_tissue, 4;Large_intestine, 5;Liver, 6;Lung, 7;Ovary, 8;Pancreas, 9;Prostate, 10;Skin, 11;Soft_tissue, 12;Upper_aerodigestive_tract) |
| * From mRNA Sanger sequences, Chitars2.0 arranged chimeric transcripts. This table shows PLCD4 related fusion information. |
| ID | Head Gene | Tail Gene | Accession | Gene_a | qStart_a | qEnd_a | Chromosome_a | tStart_a | tEnd_a | Gene_a | qStart_a | qEnd_a | Chromosome_a | tStart_a | tEnd_a |
| BQ183357 | ARF1 | 19 | 512 | 1 | 228286417 | 228286910 | PLCD4 | 510 | 690 | 2 | 219500615 | 219501106 | |
| BX102201 | PLCD4 | 1 | 410 | 2 | 219488760 | 219489169 | MARC2 | 407 | 512 | 1 | 220932026 | 220932131 | |
| CV404934 | XXYLT1 | 10 | 148 | 3 | 194878771 | 194878912 | PLCD4 | 145 | 217 | 2 | 219498978 | 219499050 | |
| Top |
| Mutation type/ Tissue ID | brca | cns | cerv | endome | haematopo | kidn | Lintest | liver | lung | ns | ovary | pancre | prost | skin | stoma | thyro | urina | |||
| Total # sample | 1 | 1 | ||||||||||||||||||
| GAIN (# sample) | 1 | 1 | ||||||||||||||||||
| LOSS (# sample) |
| cf) Tissue ID; Tissue type (1; Breast, 2; Central_nervous_system, 3; Cervix, 4; Endometrium, 5; Haematopoietic_and_lymphoid_tissue, 6; Kidney, 7; Large_intestine, 8; Liver, 9; Lung, 10; NS, 11; Ovary, 12; Pancreas, 13; Prostate, 14; Skin, 15; Stomach, 16; Thyroid, 17; Urinary_tract) |
| Top |
|
 |
| Top |
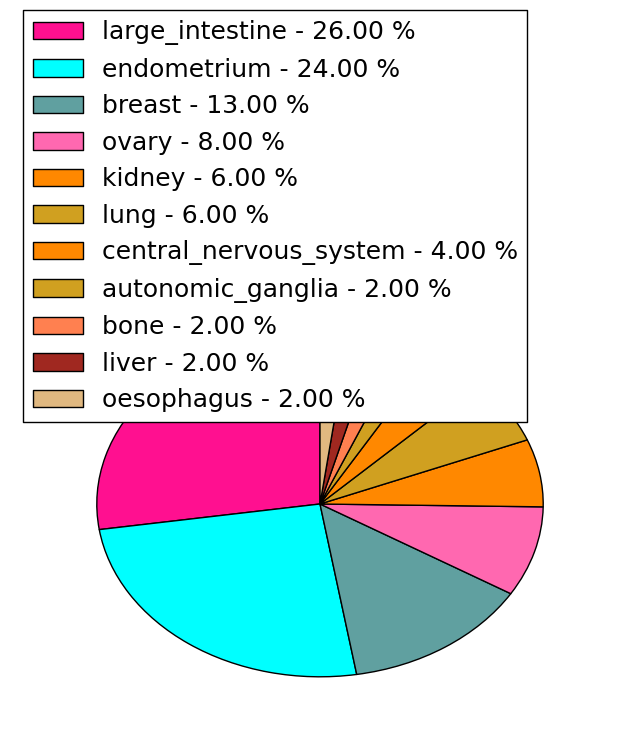
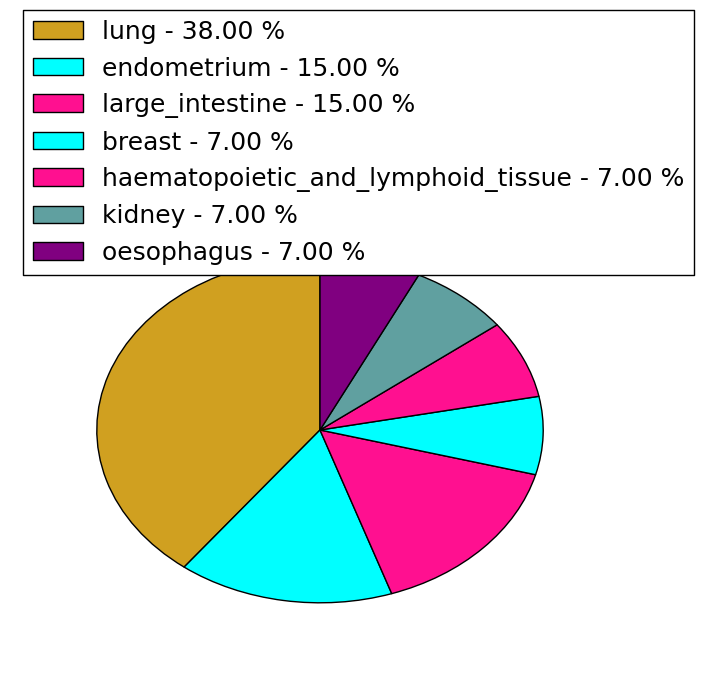
| Stat. for Non-Synonymous SNVs (# total SNVs=45) | (# total SNVs=13) |
 |  |
(# total SNVs=0) | (# total SNVs=0) |
| Top |
| * When you move the cursor on each content, you can see more deailed mutation information on the Tooltip. Those are primary_site,primary_histology,mutation(aa),pubmedID. |
| GRCh37 position | Mutation(aa) | Unique sampleID count |
| chr2:219487409-219487409 | p.E194* | 3 |
| chr2:219499340-219499340 | p.T628N | 2 |
| chr2:219480467-219480467 | p.A2V | 2 |
| chr2:219486299-219486299 | p.E173* | 2 |
| chr2:219487417-219487417 | p.V196V | 1 |
| chr2:219498439-219498439 | p.S521P | 1 |
| chr2:219492885-219492885 | p.C302* | 1 |
| chr2:219495468-219495468 | p.E405E | 1 |
| chr2:219501078-219501078 | p.I715I | 1 |
| chr2:219483416-219483416 | p.R99H | 1 |
| Top |
|
 |
| Point Mutation/ Tissue ID | 1 | 2 | 3 | 4 | 5 | 6 | 7 | 8 | 9 | 10 | 11 | 12 | 13 | 14 | 15 | 16 | 17 | 18 | 19 | 20 |
| # sample | 3 | 2 | 4 | 2 | 3 | 6 | 3 | 3 | 1 | 5 | 2 | 1 | 8 | |||||||
| # mutation | 3 | 2 | 4 | 2 | 3 | 6 | 3 | 3 | 1 | 7 | 2 | 1 | 10 | |||||||
| nonsynonymous SNV | 2 | 1 | 3 | 2 | 2 | 4 | 3 | 1 | 3 | 1 | 1 | 8 | ||||||||
| synonymous SNV | 1 | 1 | 1 | 1 | 2 | 3 | 4 | 1 | 2 |
| cf) Tissue ID; Tissue type (1; BLCA[Bladder Urothelial Carcinoma], 2; BRCA[Breast invasive carcinoma], 3; CESC[Cervical squamous cell carcinoma and endocervical adenocarcinoma], 4; COAD[Colon adenocarcinoma], 5; GBM[Glioblastoma multiforme], 6; Glioma Low Grade, 7; HNSC[Head and Neck squamous cell carcinoma], 8; KICH[Kidney Chromophobe], 9; KIRC[Kidney renal clear cell carcinoma], 10; KIRP[Kidney renal papillary cell carcinoma], 11; LAML[Acute Myeloid Leukemia], 12; LUAD[Lung adenocarcinoma], 13; LUSC[Lung squamous cell carcinoma], 14; OV[Ovarian serous cystadenocarcinoma ], 15; PAAD[Pancreatic adenocarcinoma], 16; PRAD[Prostate adenocarcinoma], 17; SKCM[Skin Cutaneous Melanoma], 18:STAD[Stomach adenocarcinoma], 19:THCA[Thyroid carcinoma], 20:UCEC[Uterine Corpus Endometrial Carcinoma]) |
| Top |
| * We represented just top 10 SNVs. When you move the cursor on each content, you can see more deailed mutation information on the Tooltip. Those are primary_site, primary_histology, mutation(aa), pubmedID. |
| Genomic Position | Mutation(aa) | Unique sampleID count |
| chr2:219498867 | p.R549H | 2 |
| chr2:219494318 | p.S521S | 1 |
| chr2:219498451 | p.C724S | 1 |
| chr2:219500990 | p.K236Q | 1 |
| chr2:219487409 | p.E525K | 1 |
| chr2:219494358 | p.Q754Q | 1 |
| chr2:219498480 | p.F281F | 1 |
| chr2:219501002 | p.E534D | 1 |
| chr2:219487417 | p.T307T | 1 |
| chr2:219495468 | p.A535S | 1 |
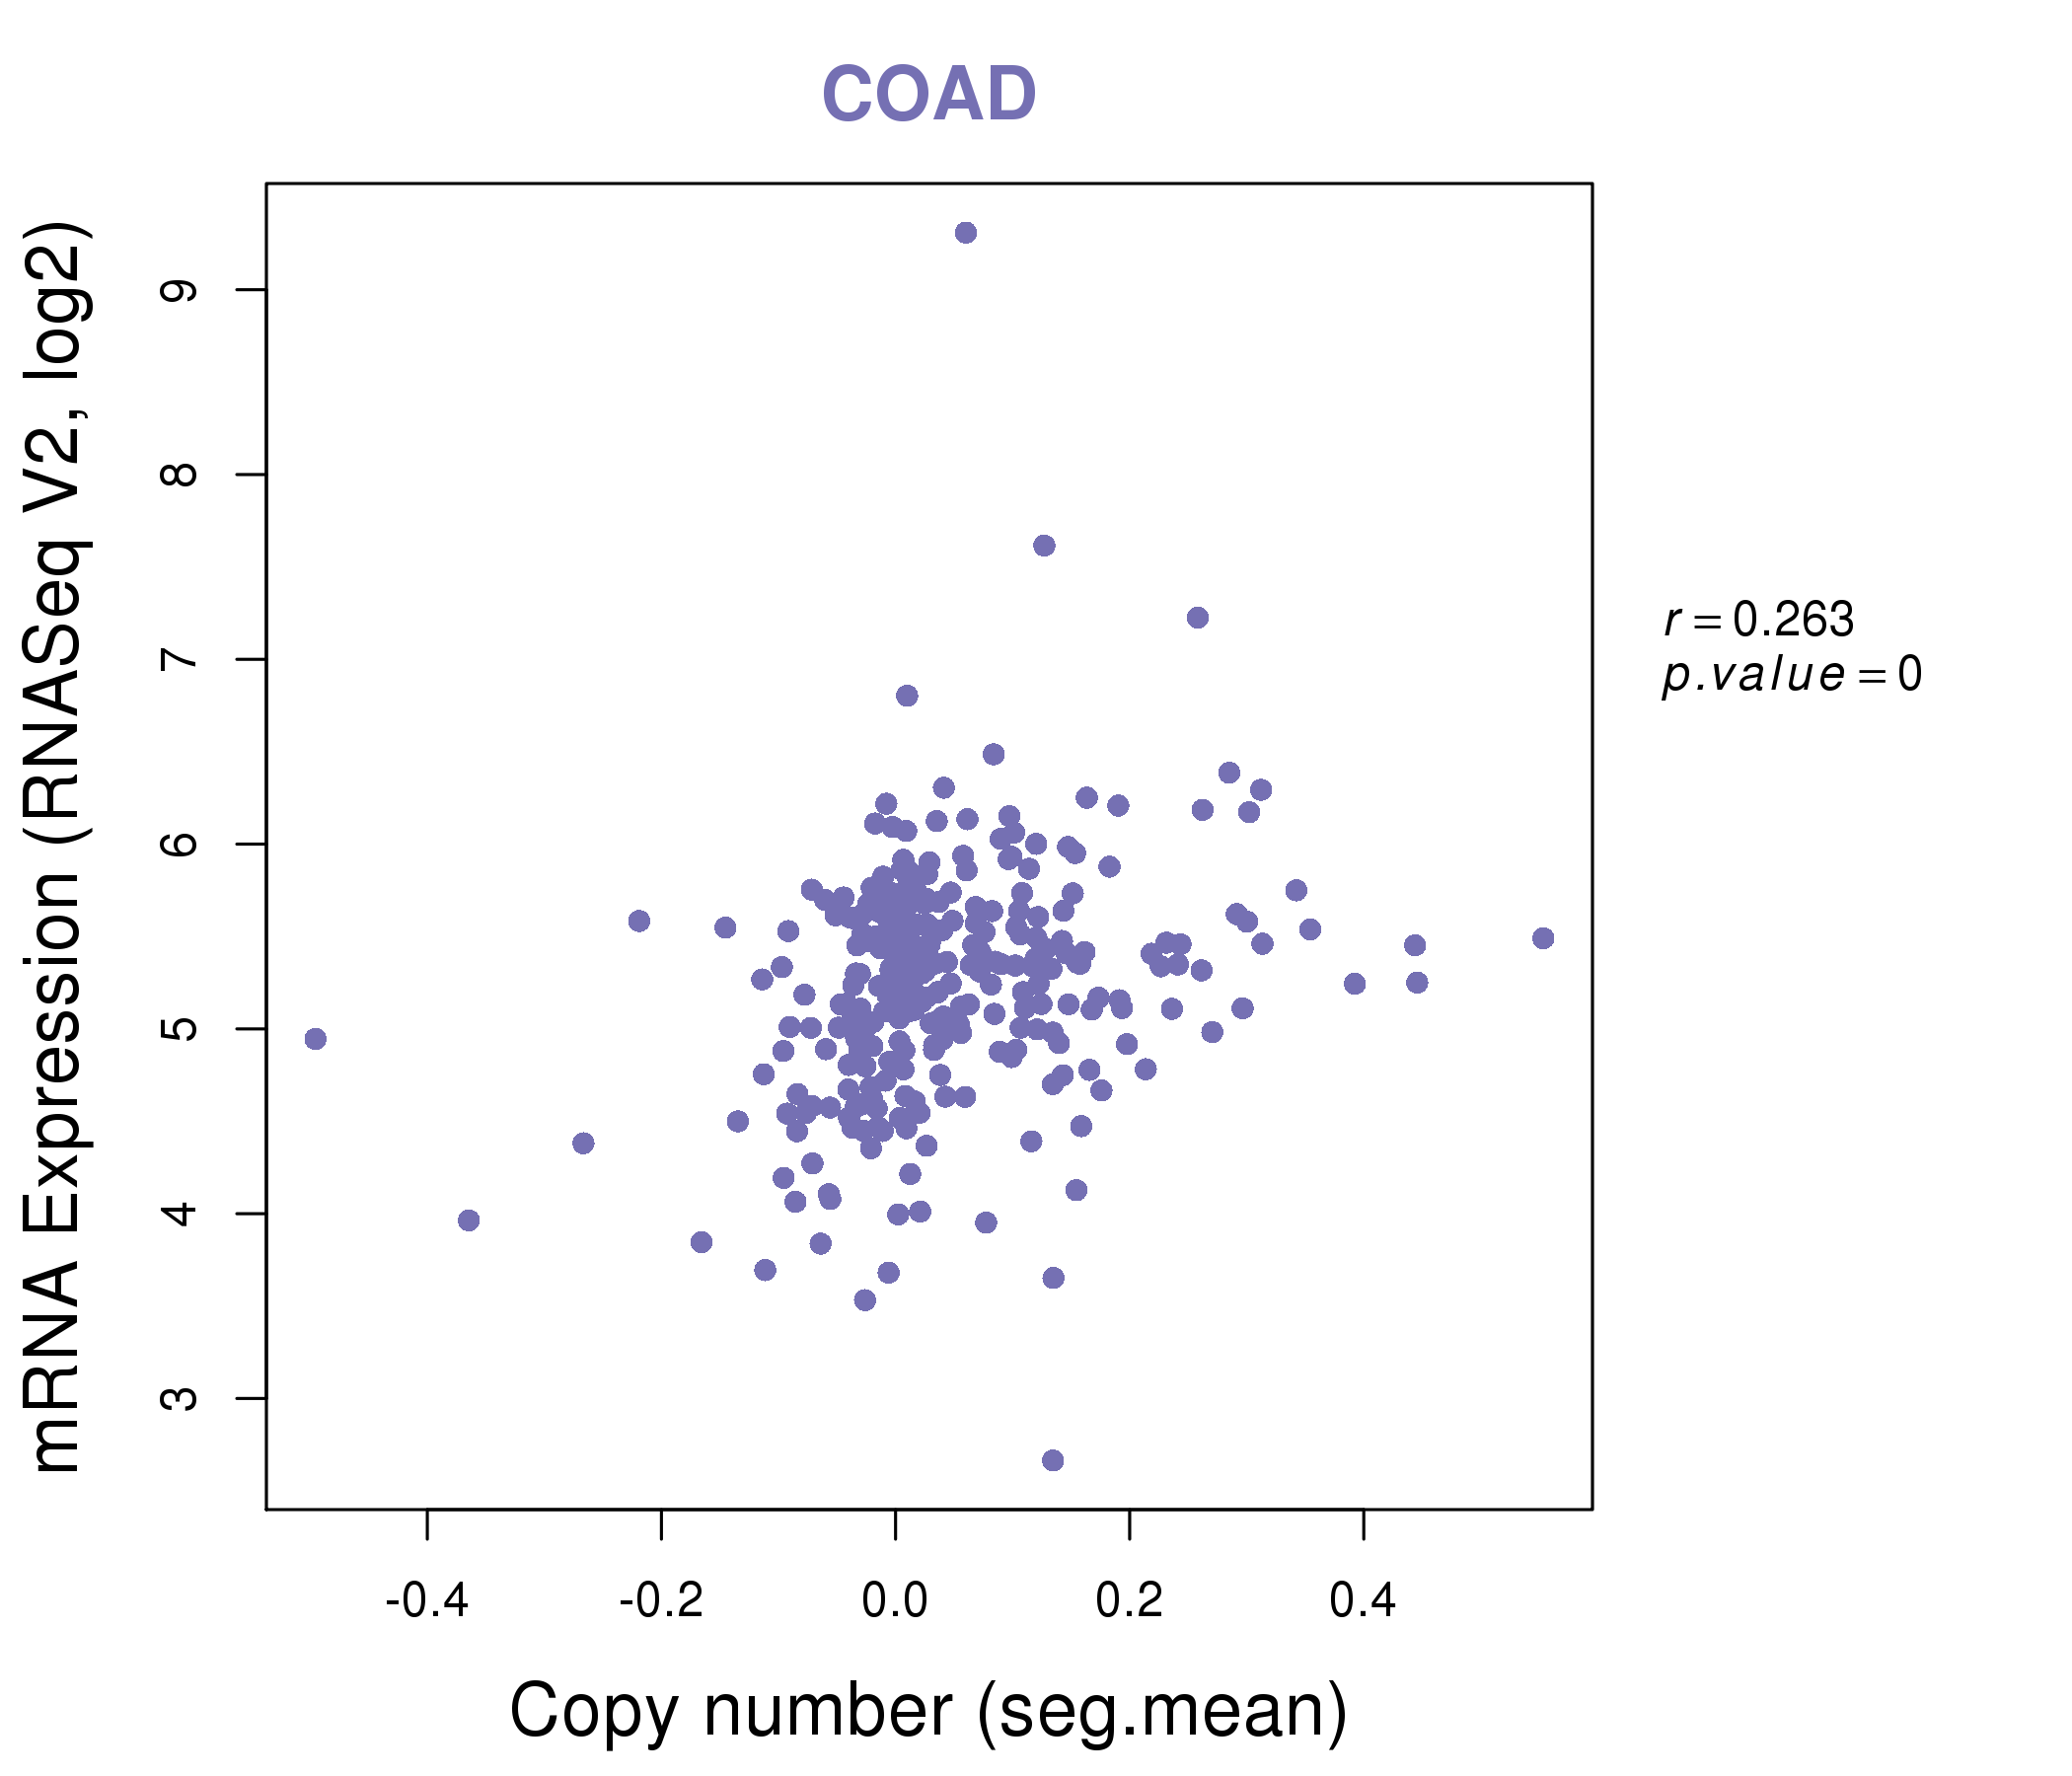
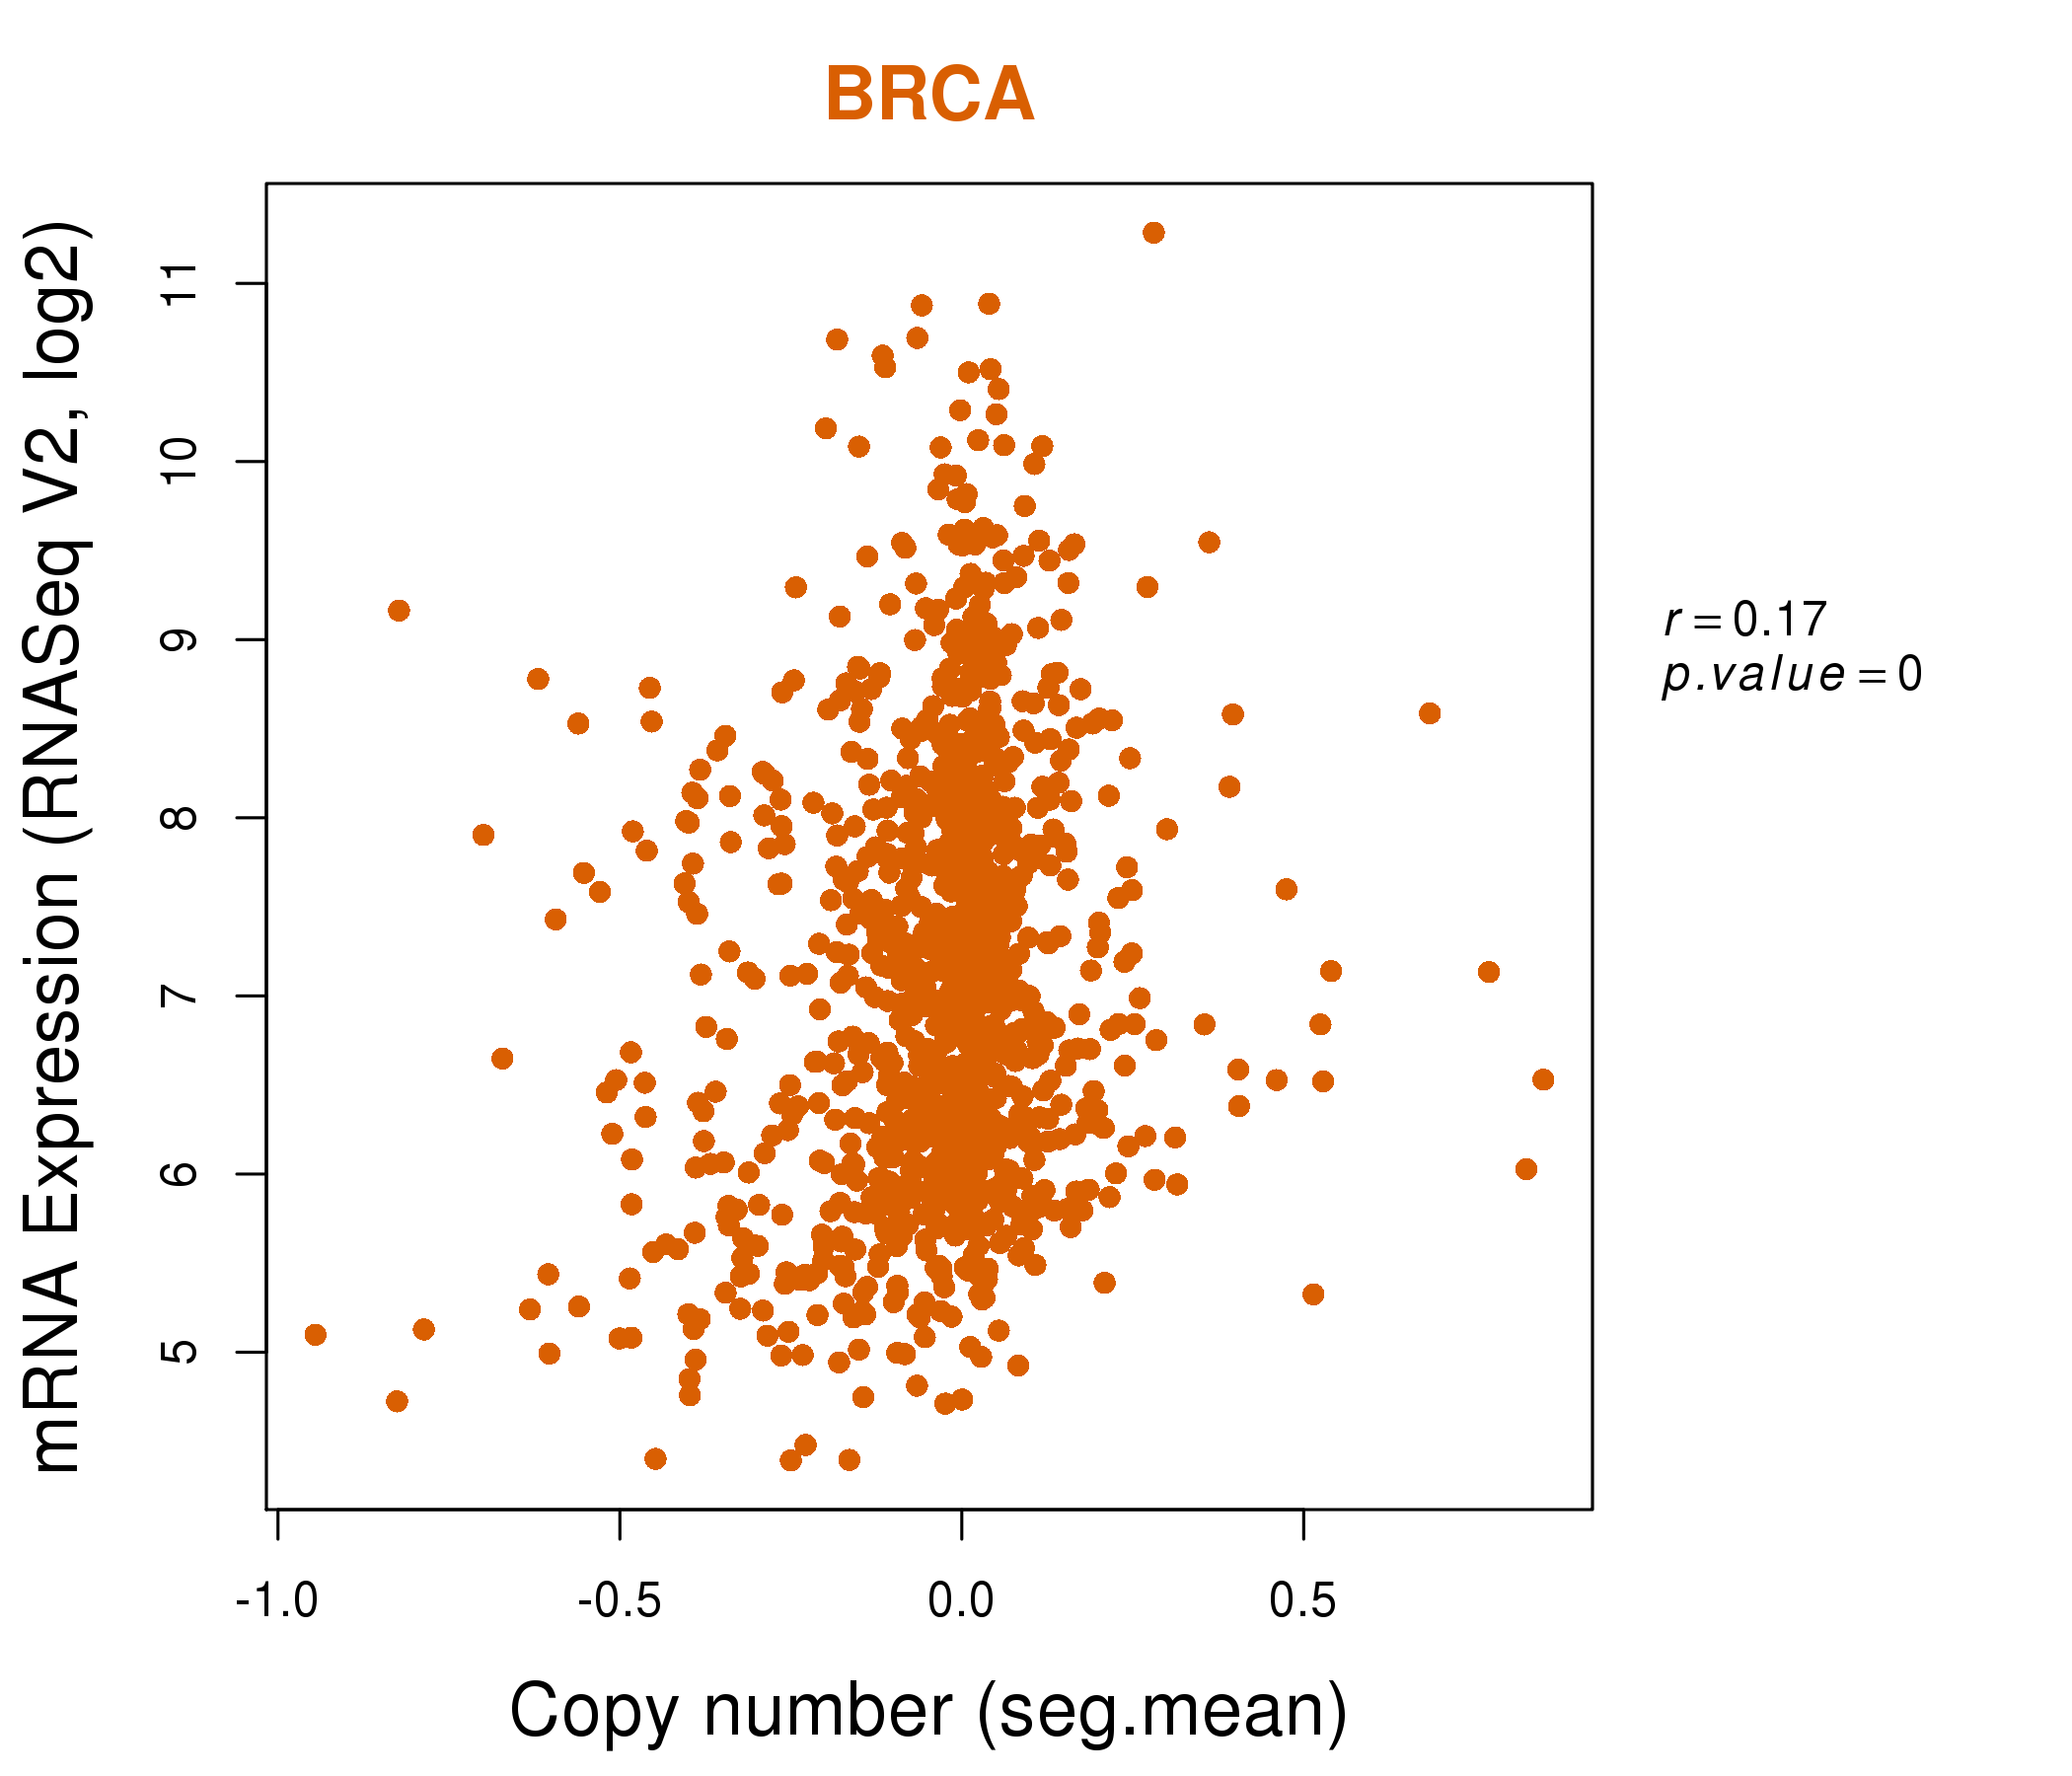
| * Copy number data were extracted from TCGA using R package TCGA-Assembler. The URLs of all public data files on TCGA DCC data server were gathered on Jan-05-2015. Function ProcessCNAData in TCGA-Assembler package was used to obtain gene-level copy number value which is calculated as the average copy number of the genomic region of a gene. |
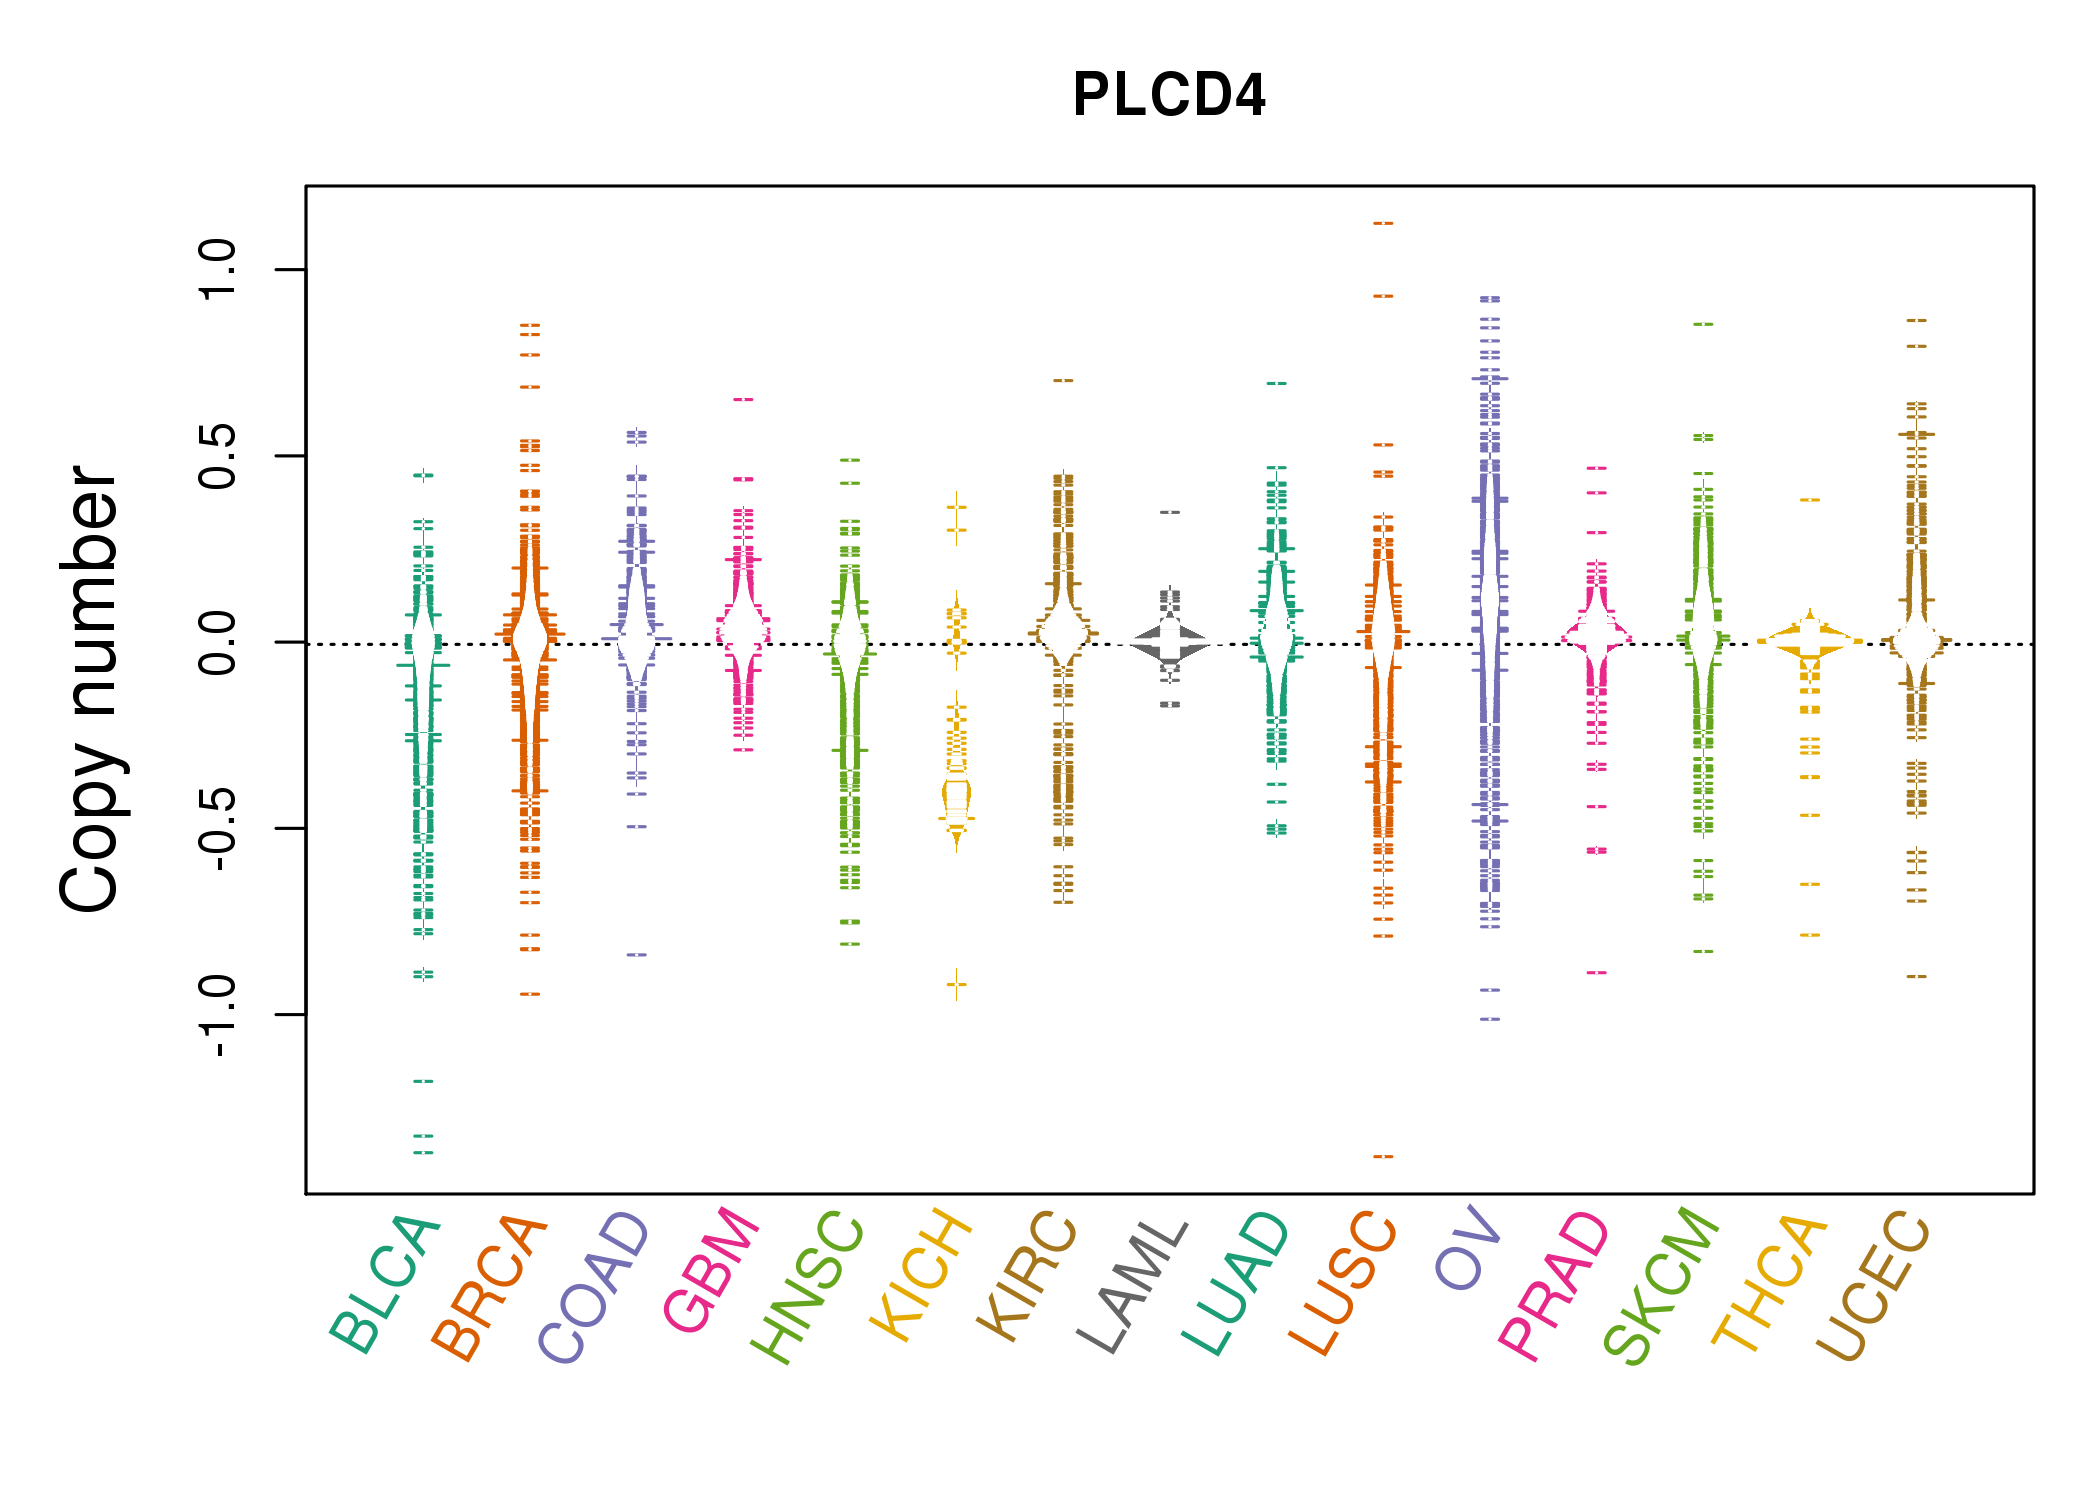 |
| cf) Tissue ID[Tissue type]: BLCA[Bladder Urothelial Carcinoma], BRCA[Breast invasive carcinoma], CESC[Cervical squamous cell carcinoma and endocervical adenocarcinoma], COAD[Colon adenocarcinoma], GBM[Glioblastoma multiforme], Glioma Low Grade, HNSC[Head and Neck squamous cell carcinoma], KICH[Kidney Chromophobe], KIRC[Kidney renal clear cell carcinoma], KIRP[Kidney renal papillary cell carcinoma], LAML[Acute Myeloid Leukemia], LUAD[Lung adenocarcinoma], LUSC[Lung squamous cell carcinoma], OV[Ovarian serous cystadenocarcinoma ], PAAD[Pancreatic adenocarcinoma], PRAD[Prostate adenocarcinoma], SKCM[Skin Cutaneous Melanoma], STAD[Stomach adenocarcinoma], THCA[Thyroid carcinoma], UCEC[Uterine Corpus Endometrial Carcinoma] |
| Top |
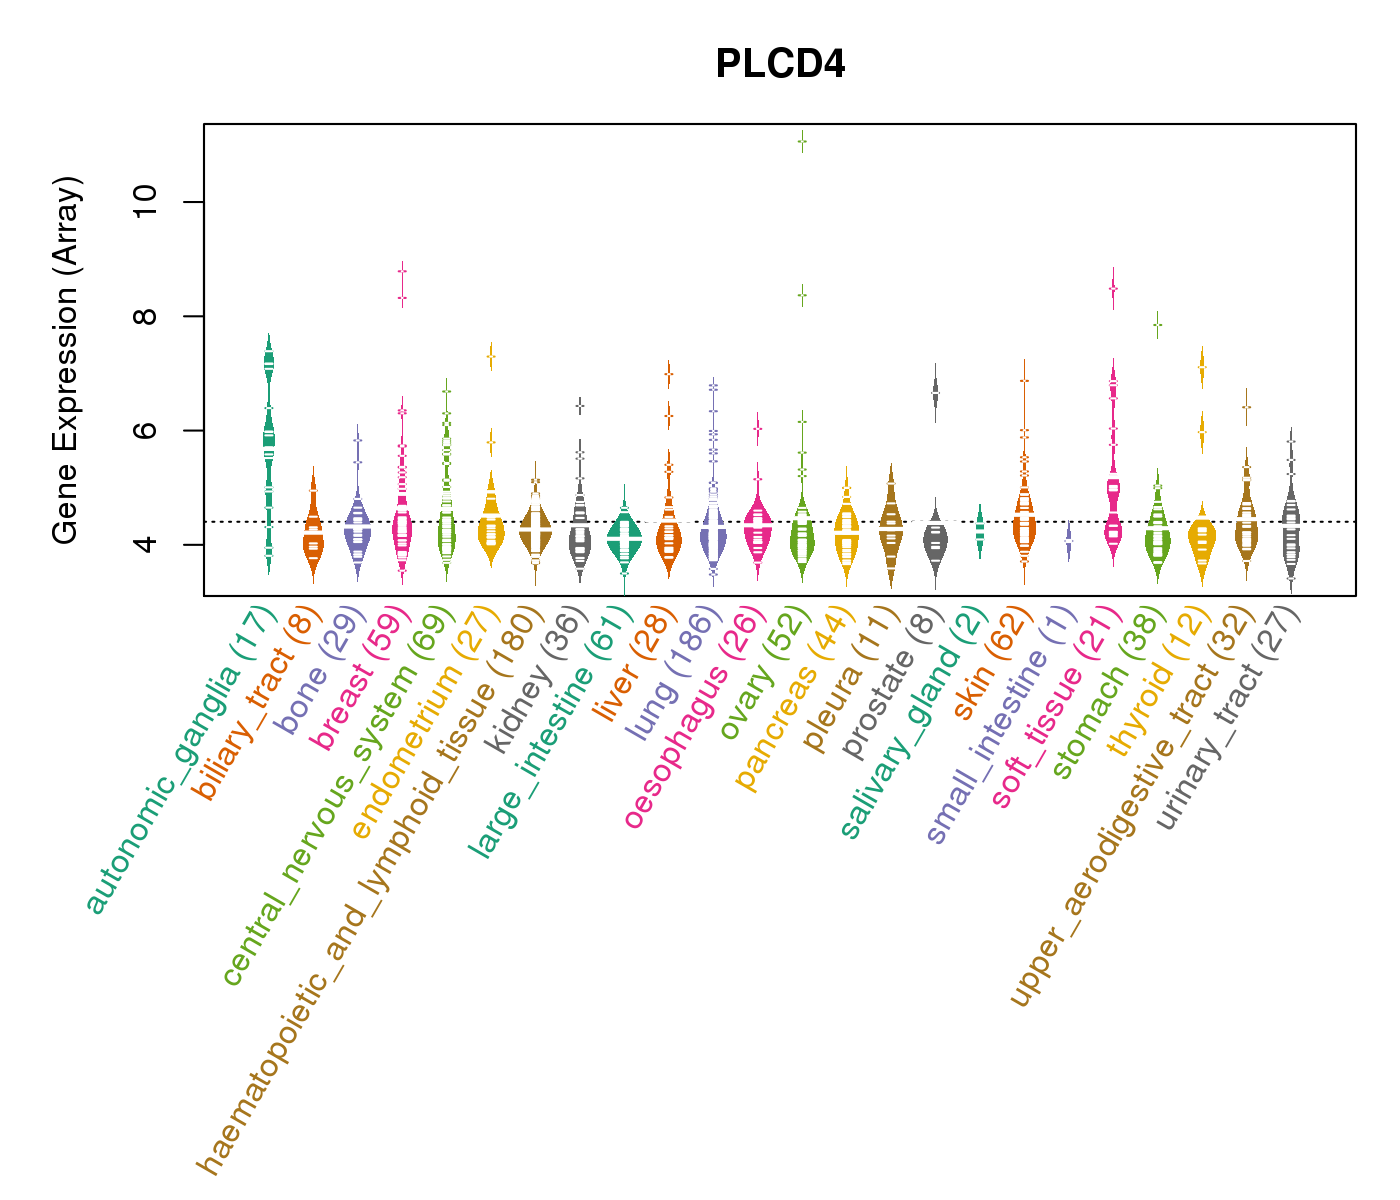
| Gene Expression for PLCD4 |
| * CCLE gene expression data were extracted from CCLE_Expression_Entrez_2012-10-18.res: Gene-centric RMA-normalized mRNA expression data. |
 |
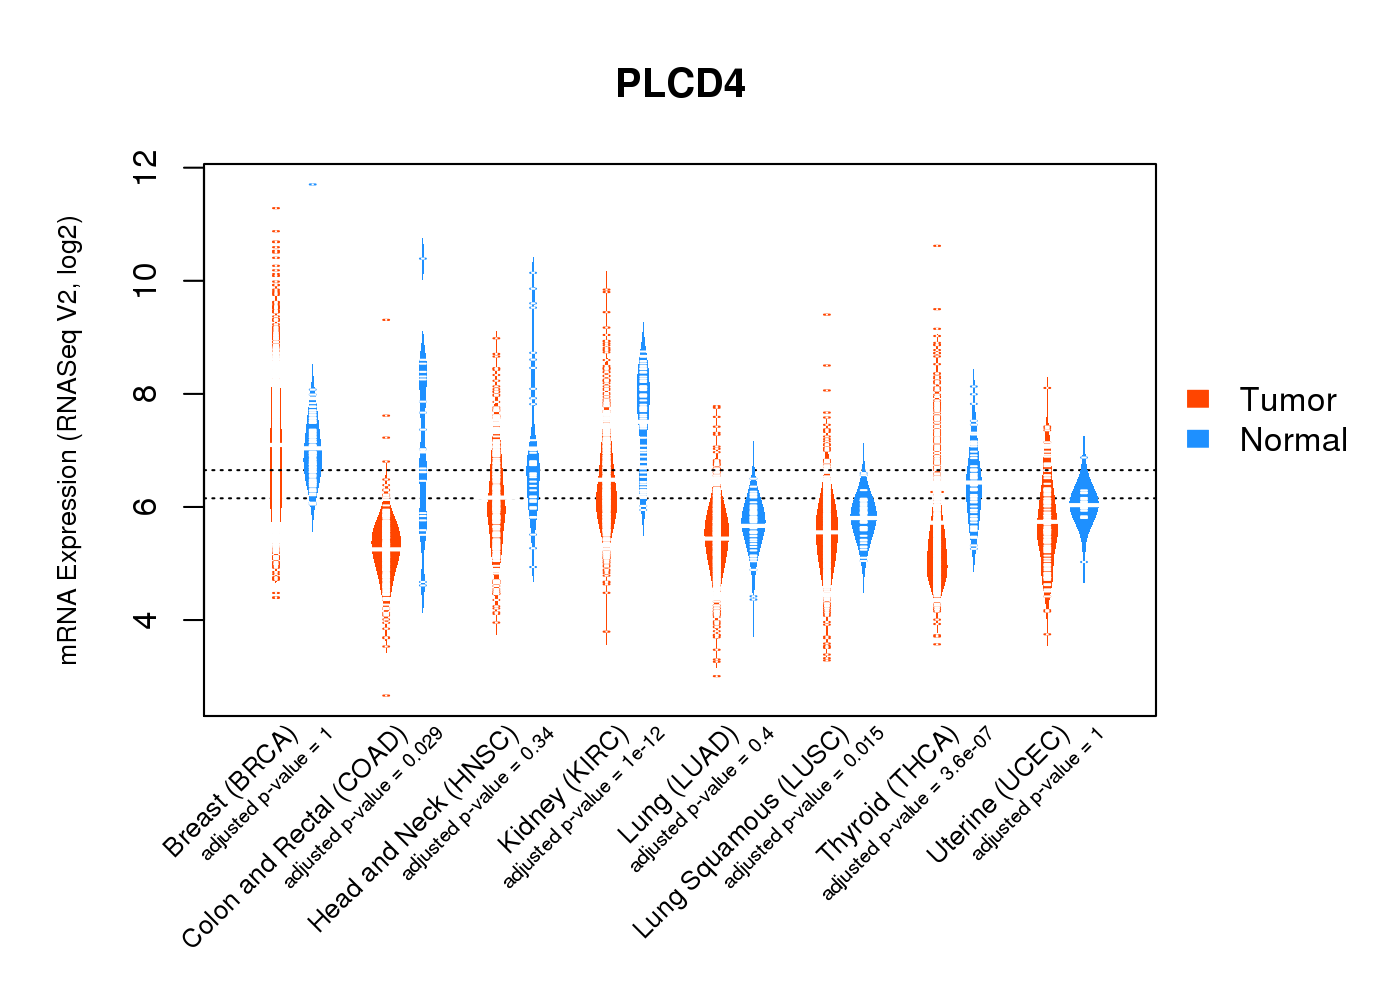
| * Normalized gene expression data of RNASeqV2 was extracted from TCGA using R package TCGA-Assembler. The URLs of all public data files on TCGA DCC data server were gathered at Jan-05-2015. Only eight cancer types have enough normal control samples for differential expression analysis. (t test, adjusted p<0.05 (using Benjamini-Hochberg FDR)) |
 |
| Top |
| * This plots show the correlation between CNV and gene expression. |
: Open all plots for all cancer types
 |
|
 |
|

| Top |
| Gene-Gene Network Information |
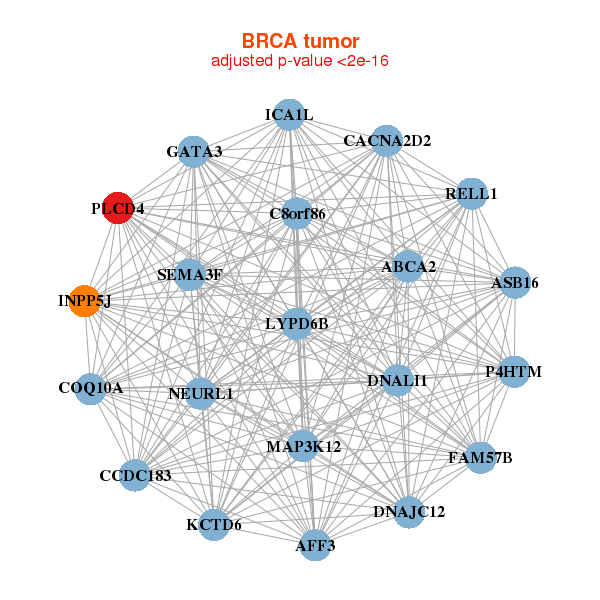
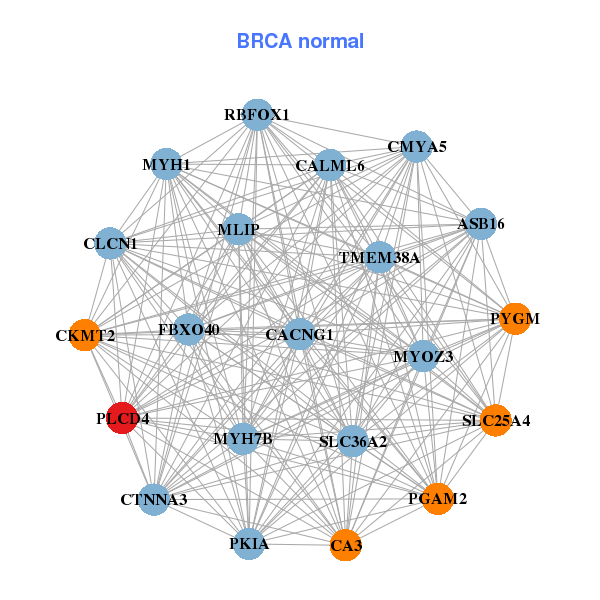
| * Co-Expression network figures were drawn using R package igraph. Only the top 20 genes with the highest correlations were shown. Red circle: input gene, orange circle: cell metabolism gene, sky circle: other gene |
: Open all plots for all cancer types
 |
|
| ABCA2,AFF3,ASB16,C8orf86,CACNA2D2,COQ10A,DNAJC12, DNALI1,FAM57B,GATA3,ICA1L,INPP5J,KCTD6,CCDC183, LYPD6B,MAP3K12,NEURL1,P4HTM,PLCD4,RELL1,SEMA3F | RBFOX1,ASB16,MLIP,CA3,CACNG1,CALML6,CKMT2, CLCN1,CMYA5,CTNNA3,FBXO40,MYH1,MYH7B,MYOZ3, PGAM2,PKIA,PLCD4,PYGM,SLC25A4,SLC36A2,TMEM38A |
 |
|
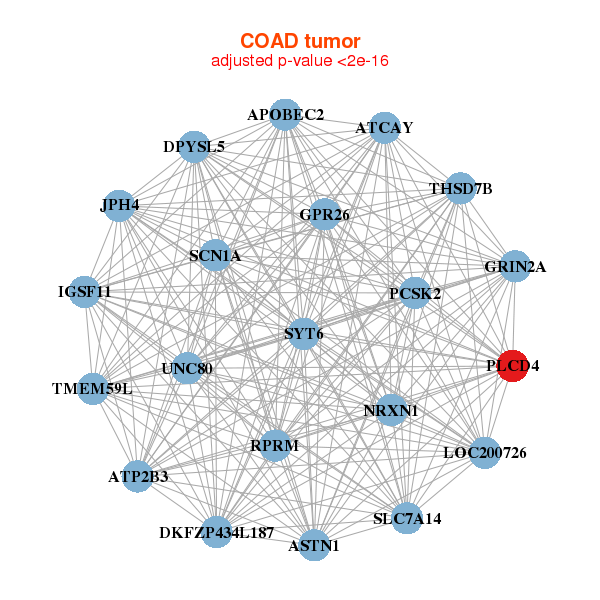
| APOBEC2,ASTN1,ATCAY,ATP2B3,DKFZP434L187,DPYSL5,GPR26, GRIN2A,IGSF11,JPH4,LOC200726,NRXN1,PCSK2,PLCD4, RPRM,SCN1A,SLC7A14,SYT6,THSD7B,TMEM59L,UNC80 | ASIC1,ATP1A2,ATP2B4,BVES,CA14,CACNA1H,DACT3, KCNH2,KY,LDB3,MPP2,NPTXR,NRXN2,PLCD4, PTGS1,PYGM,SLC8A2,SMTN,SPEG,TACR2,TGFB1I1 |
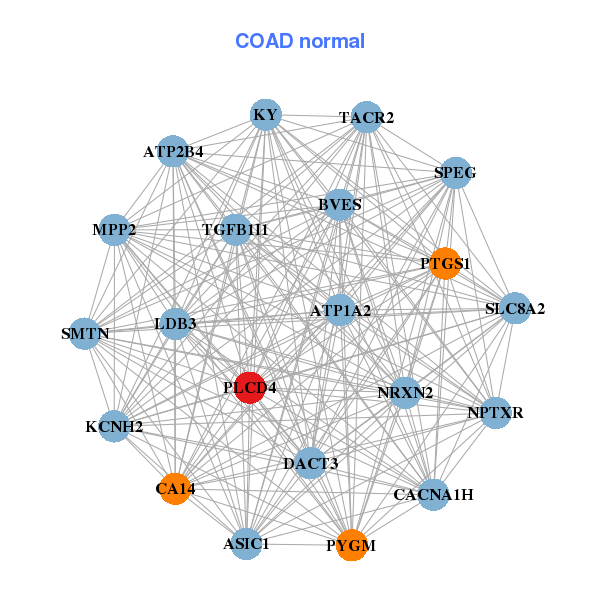
| * Co-Expression network figures were drawn using R package igraph. Only the top 20 genes with the highest correlations were shown. Red circle: input gene, orange circle: cell metabolism gene, sky circle: other gene |
: Open all plots for all cancer types
| Top |
: Open all interacting genes' information including KEGG pathway for all interacting genes from DAVID
| Top |
| Pharmacological Information for PLCD4 |
| There's no related Drug. |
| Top |
| Cross referenced IDs for PLCD4 |
| * We obtained these cross-references from Uniprot database. It covers 150 different DBs, 18 categories. http://www.uniprot.org/help/cross_references_section |
: Open all cross reference information
|
Copyright © 2016-Present - The Univsersity of Texas Health Science Center at Houston @ |