|
|||||||||||||||||||||||||||||||||||||||||||||||||||||||||||||||||||||||||||||||||||||||||||||||||||||||||||||||||||||||||||||||||||||||||||||||||||||||||||||||||||||||||||||||||||||||||||||||||||||||||||||||||||||||||||||||||||||||||||||||||||||||||||||||||||||||||||||||||||||||||||||||||||||||||||||||||||||||||||||||||||||||||||||||||||
| |
| Phenotypic Information (metabolism pathway, cancer, disease, phenome) |
| |
| |
| Gene-Gene Network Information: Co-Expression Network, Interacting Genes & KEGG |
| |
|


| Gene Summary for PIK3R3 |
| Basic gene info. | Gene symbol | PIK3R3 |
| Gene name | phosphoinositide-3-kinase, regulatory subunit 3 (gamma) | |
| Synonyms | p55|p55-GAMMA | |
| Cytomap | UCSC genome browser: 1p34.1 | |
| Genomic location | chr1 :46505811-46598708 | |
| Type of gene | protein-coding | |
| RefGenes | NM_001114172.1, NM_003629.3, | |
| Ensembl id | ENSG00000117461 | |
| Description | 100% homology to SWISS-PROT Q92569PI3-kinase regulatory subunit gammaPI3-kinase subunit p55-gammaPI3K regulatory subunit gammap55PIKphosphatidylinositol 3-kinase 55 kDa regulatory subunit gammaphosphatidylinositol 3-kinase regulatory subunit gammap | |
| Modification date | 20141207 | |
| dbXrefs | MIM : 606076 | |
| HGNC : HGNC | ||
| Ensembl : ENSG00000117461 | ||
| HPRD : 05831 | ||
| Vega : OTTHUMG00000008096 | ||
| Protein | UniProt: Q92569 go to UniProt's Cross Reference DB Table | |
| Expression | CleanEX: HS_PIK3R3 | |
| BioGPS: 8503 | ||
| Gene Expression Atlas: ENSG00000117461 | ||
| The Human Protein Atlas: ENSG00000117461 | ||
| Pathway | NCI Pathway Interaction Database: PIK3R3 | |
| KEGG: PIK3R3 | ||
| REACTOME: PIK3R3 | ||
| ConsensusPathDB | ||
| Pathway Commons: PIK3R3 | ||
| Metabolism | MetaCyc: PIK3R3 | |
| HUMANCyc: PIK3R3 | ||
| Regulation | Ensembl's Regulation: ENSG00000117461 | |
| miRBase: chr1 :46,505,811-46,598,708 | ||
| TargetScan: NM_001114172 | ||
| cisRED: ENSG00000117461 | ||
| Context | iHOP: PIK3R3 | |
| cancer metabolism search in PubMed: PIK3R3 | ||
| UCL Cancer Institute: PIK3R3 | ||
| Assigned class in ccmGDB | B - This gene belongs to cancer gene. | |
| Top |
| Phenotypic Information for PIK3R3(metabolism pathway, cancer, disease, phenome) |
| Cancer | CGAP: PIK3R3 |
| Familial Cancer Database: PIK3R3 | |
| * This gene is included in those cancer gene databases. |
|
|
|
|
|
| . | |||||||||||||||||||||||||||||||||||||||||||||||||||||||||||||||||||||||||||||||||||||||||||||||||||||||||||||||||||||||||||||||||||||||||||||||||||||||||||||||||||||||||||||||||||||||||||||||||||||||||||||||||||||||||||||||||||||||||||||||||||||||||||||||||||||||||||||||||||||||||||||||||||||||||||||||||||||||||||||||||||||||||||||
Oncogene 1 | Significant driver gene in | ||||||||||||||||||||||||||||||||||||||||||||||||||||||||||||||||||||||||||||||||||||||||||||||||||||||||||||||||||||||||||||||||||||||||||||||||||||||||||||||||||||||||||||||||||||||||||||||||||||||||||||||||||||||||||||||||||||||||||||||||||||||||||||||||||||||||||||||||||||||||||||||||||||||||||||||||||||||||||||||||||||||||||||||||||
| cf) number; DB name 1 Oncogene; http://nar.oxfordjournals.org/content/35/suppl_1/D721.long, 2 Tumor Suppressor gene; https://bioinfo.uth.edu/TSGene/, 3 Cancer Gene Census; http://www.nature.com/nrc/journal/v4/n3/abs/nrc1299.html, 4 CancerGenes; http://nar.oxfordjournals.org/content/35/suppl_1/D721.long, 5 Network of Cancer Gene; http://ncg.kcl.ac.uk/index.php, 1Therapeutic Vulnerabilities in Cancer; http://cbio.mskcc.org/cancergenomics/statius/ |
| KEGG_FC_GAMMA_R_MEDIATED_PHAGOCYTOSIS REACTOME_PHOSPHOLIPID_METABOLISM REACTOME_PI_METABOLISM REACTOME_METABOLISM_OF_LIPIDS_AND_LIPOPROTEINS | |
| OMIM | 606076; gene. |
| Orphanet | |
| Disease | KEGG Disease: PIK3R3 |
| MedGen: PIK3R3 (Human Medical Genetics with Condition) | |
| ClinVar: PIK3R3 | |
| Phenotype | MGI: PIK3R3 (International Mouse Phenotyping Consortium) |
| PhenomicDB: PIK3R3 | |
| Mutations for PIK3R3 |
| * Under tables are showing count per each tissue to give us broad intuition about tissue specific mutation patterns.You can go to the detailed page for each mutation database's web site. |
| - Statistics for Tissue and Mutation type | Top |
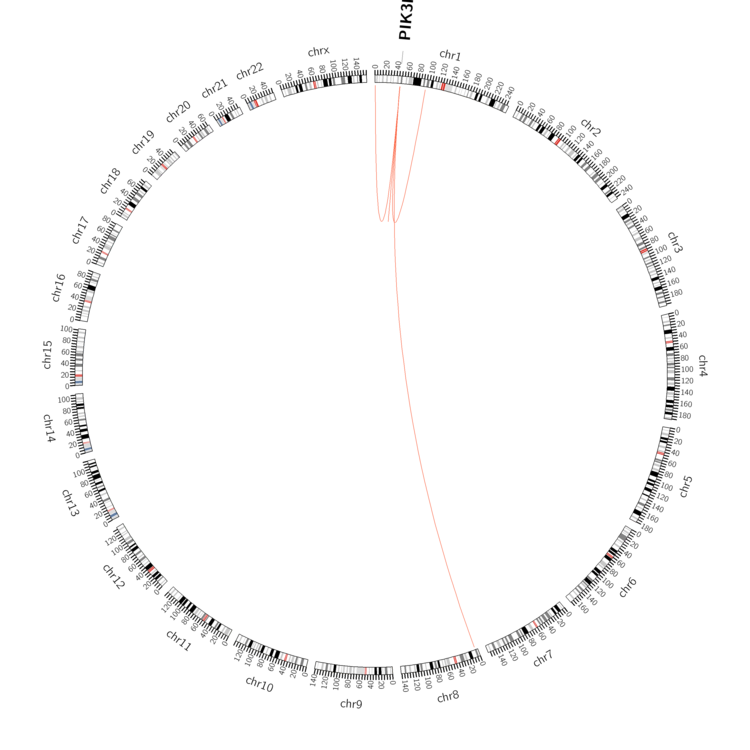 |
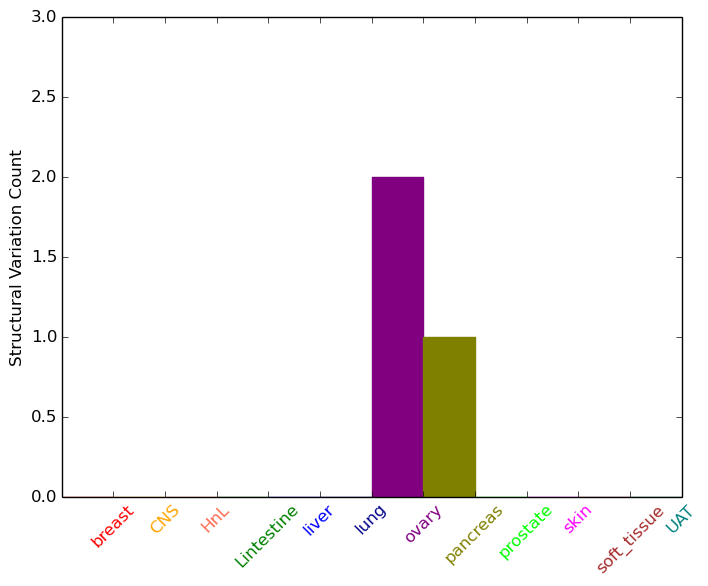
| - For Inter-chromosomal Variations |
| There's no inter-chromosomal structural variation. |
| - For Intra-chromosomal Variations |
| * Intra-chromosomal variantions includes 'intrachromosomal amplicon to amplicon', 'intrachromosomal amplicon to non-amplified dna', 'intrachromosomal deletion', 'intrachromosomal fold-back inversion', 'intrachromosomal inversion', 'intrachromosomal tandem duplication', 'Intrachromosomal unknown type', 'intrachromosomal with inverted orientation', 'intrachromosomal with non-inverted orientation'. |
 |
| Sample | Symbol_a | Chr_a | Start_a | End_a | Symbol_b | Chr_b | Start_b | End_b |
| ovary | PIK3R3 | chr1 | 46506999 | 46507019 | chr1 | 921843 | 921863 | |
| ovary | PIK3R3 | chr1 | 46577155 | 46577175 | chr1 | 94301551 | 94301571 | |
| pancreas | PIK3R3 | chr1 | 46569328 | 46569348 | PIK3R3 | chr1 | 46576457 | 46576477 |
| cf) Tissue number; Tissue name (1;Breast, 2;Central_nervous_system, 3;Haematopoietic_and_lymphoid_tissue, 4;Large_intestine, 5;Liver, 6;Lung, 7;Ovary, 8;Pancreas, 9;Prostate, 10;Skin, 11;Soft_tissue, 12;Upper_aerodigestive_tract) |
| * From mRNA Sanger sequences, Chitars2.0 arranged chimeric transcripts. This table shows PIK3R3 related fusion information. |
| ID | Head Gene | Tail Gene | Accession | Gene_a | qStart_a | qEnd_a | Chromosome_a | tStart_a | tEnd_a | Gene_a | qStart_a | qEnd_a | Chromosome_a | tStart_a | tEnd_a |
| BE515277 | UQCRH | 34 | 502 | 1 | 46769360 | 46775989 | PIK3R3 | 502 | 708 | 1 | 46519492 | 46519698 | |
| Top |
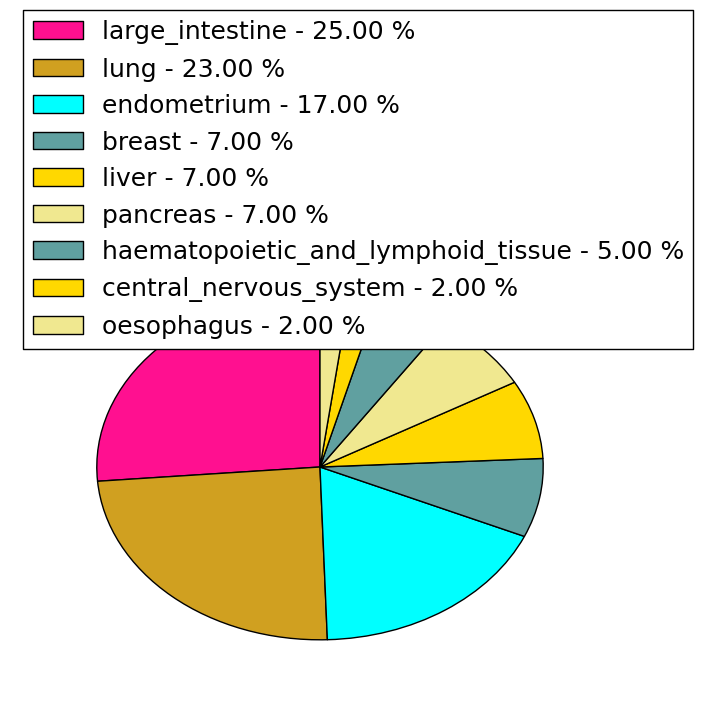
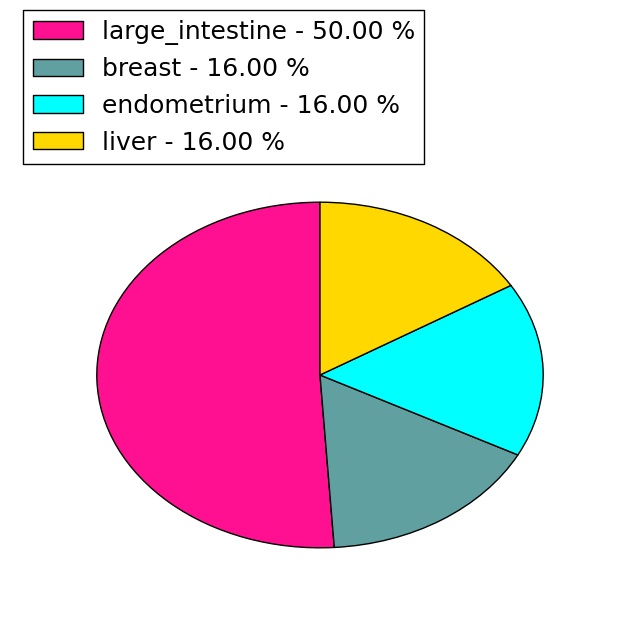
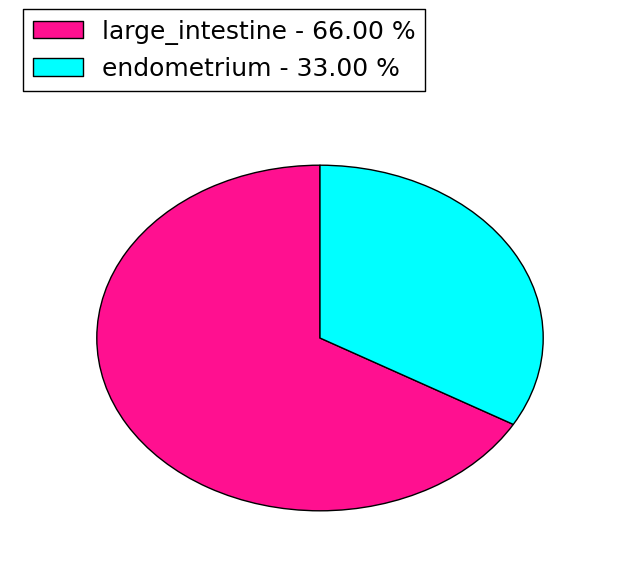
| Mutation type/ Tissue ID | brca | cns | cerv | endome | haematopo | kidn | Lintest | liver | lung | ns | ovary | pancre | prost | skin | stoma | thyro | urina | |||
| Total # sample | 1 | |||||||||||||||||||
| GAIN (# sample) | 1 | |||||||||||||||||||
| LOSS (# sample) |
| cf) Tissue ID; Tissue type (1; Breast, 2; Central_nervous_system, 3; Cervix, 4; Endometrium, 5; Haematopoietic_and_lymphoid_tissue, 6; Kidney, 7; Large_intestine, 8; Liver, 9; Lung, 10; NS, 11; Ovary, 12; Pancreas, 13; Prostate, 14; Skin, 15; Stomach, 16; Thyroid, 17; Urinary_tract) |
| Top |
|
 |
| Top |
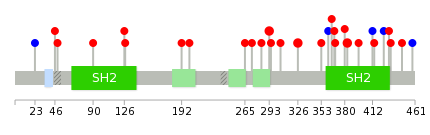
| Stat. for Non-Synonymous SNVs (# total SNVs=39) | (# total SNVs=6) |
 |  |
(# total SNVs=3) | (# total SNVs=0) |
 |
| Top |
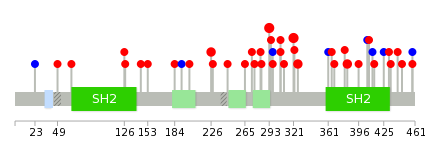
| * When you move the cursor on each content, you can see more deailed mutation information on the Tooltip. Those are primary_site,primary_histology,mutation(aa),pubmedID. |
| GRCh37 position | Mutation(aa) | Unique sampleID count |
| chr1:46521530-46521530 | p.K293T | 3 |
| chr1:46512277-46512277 | p.V321A | 3 |
| chr1:46527688-46527688 | p.F226Y | 2 |
| chr1:46512262-46512262 | p.L326R | 2 |
| chr1:46511630-46511630 | p.R383C | 2 |
| chr1:46521517-46521517 | p.S297S | 2 |
| chr1:46527650-46527650 | p.E239* | 2 |
| chr1:46509434-46509434 | p.Q433K | 1 |
| chr1:46527683-46527683 | p.E228K | 1 |
| chr1:46511683-46511683 | p.R365L | 1 |
| Top |
|
 |
| Point Mutation/ Tissue ID | 1 | 2 | 3 | 4 | 5 | 6 | 7 | 8 | 9 | 10 | 11 | 12 | 13 | 14 | 15 | 16 | 17 | 18 | 19 | 20 |
| # sample | 3 | 7 | 1 | 3 | 4 | 1 | 2 | 4 | 5 | |||||||||||
| # mutation | 2 | 9 | 1 | 3 | 4 | 1 | 2 | 5 | 5 | |||||||||||
| nonsynonymous SNV | 2 | 6 | 1 | 3 | 4 | 1 | 2 | 4 | 4 | |||||||||||
| synonymous SNV | 3 | 1 | 1 |
| cf) Tissue ID; Tissue type (1; BLCA[Bladder Urothelial Carcinoma], 2; BRCA[Breast invasive carcinoma], 3; CESC[Cervical squamous cell carcinoma and endocervical adenocarcinoma], 4; COAD[Colon adenocarcinoma], 5; GBM[Glioblastoma multiforme], 6; Glioma Low Grade, 7; HNSC[Head and Neck squamous cell carcinoma], 8; KICH[Kidney Chromophobe], 9; KIRC[Kidney renal clear cell carcinoma], 10; KIRP[Kidney renal papillary cell carcinoma], 11; LAML[Acute Myeloid Leukemia], 12; LUAD[Lung adenocarcinoma], 13; LUSC[Lung squamous cell carcinoma], 14; OV[Ovarian serous cystadenocarcinoma ], 15; PAAD[Pancreatic adenocarcinoma], 16; PRAD[Prostate adenocarcinoma], 17; SKCM[Skin Cutaneous Melanoma], 18:STAD[Stomach adenocarcinoma], 19:THCA[Thyroid carcinoma], 20:UCEC[Uterine Corpus Endometrial Carcinoma]) |
| Top |
| * We represented just top 10 SNVs. When you move the cursor on each content, you can see more deailed mutation information on the Tooltip. Those are primary_site, primary_histology, mutation(aa), pubmedID. |
| Genomic Position | Mutation(aa) | Unique sampleID count |
| chr1:46512262 | p.R383C,PIK3R3 | 2 |
| chr1:46521530 | p.L326R,PIK3R3 | 2 |
| chr1:46511630 | p.K293T,PIK3R3 | 2 |
| chr1:46509456 | p.G414D,PIK3R3 | 1 |
| chr1:46543232 | p.S265L,PIK3R3 | 1 |
| chr1:46509490 | p.G412G,PIK3R3 | 1 |
| chr1:46521491 | p.E201K,PIK3R3 | 1 |
| chr1:46546384 | p.V396A,PIK3R3 | 1 |
| chr1:46509495 | p.S192R,PIK3R3 | 1 |
| chr1:46521524 | p.P127L,PIK3R3 | 1 |
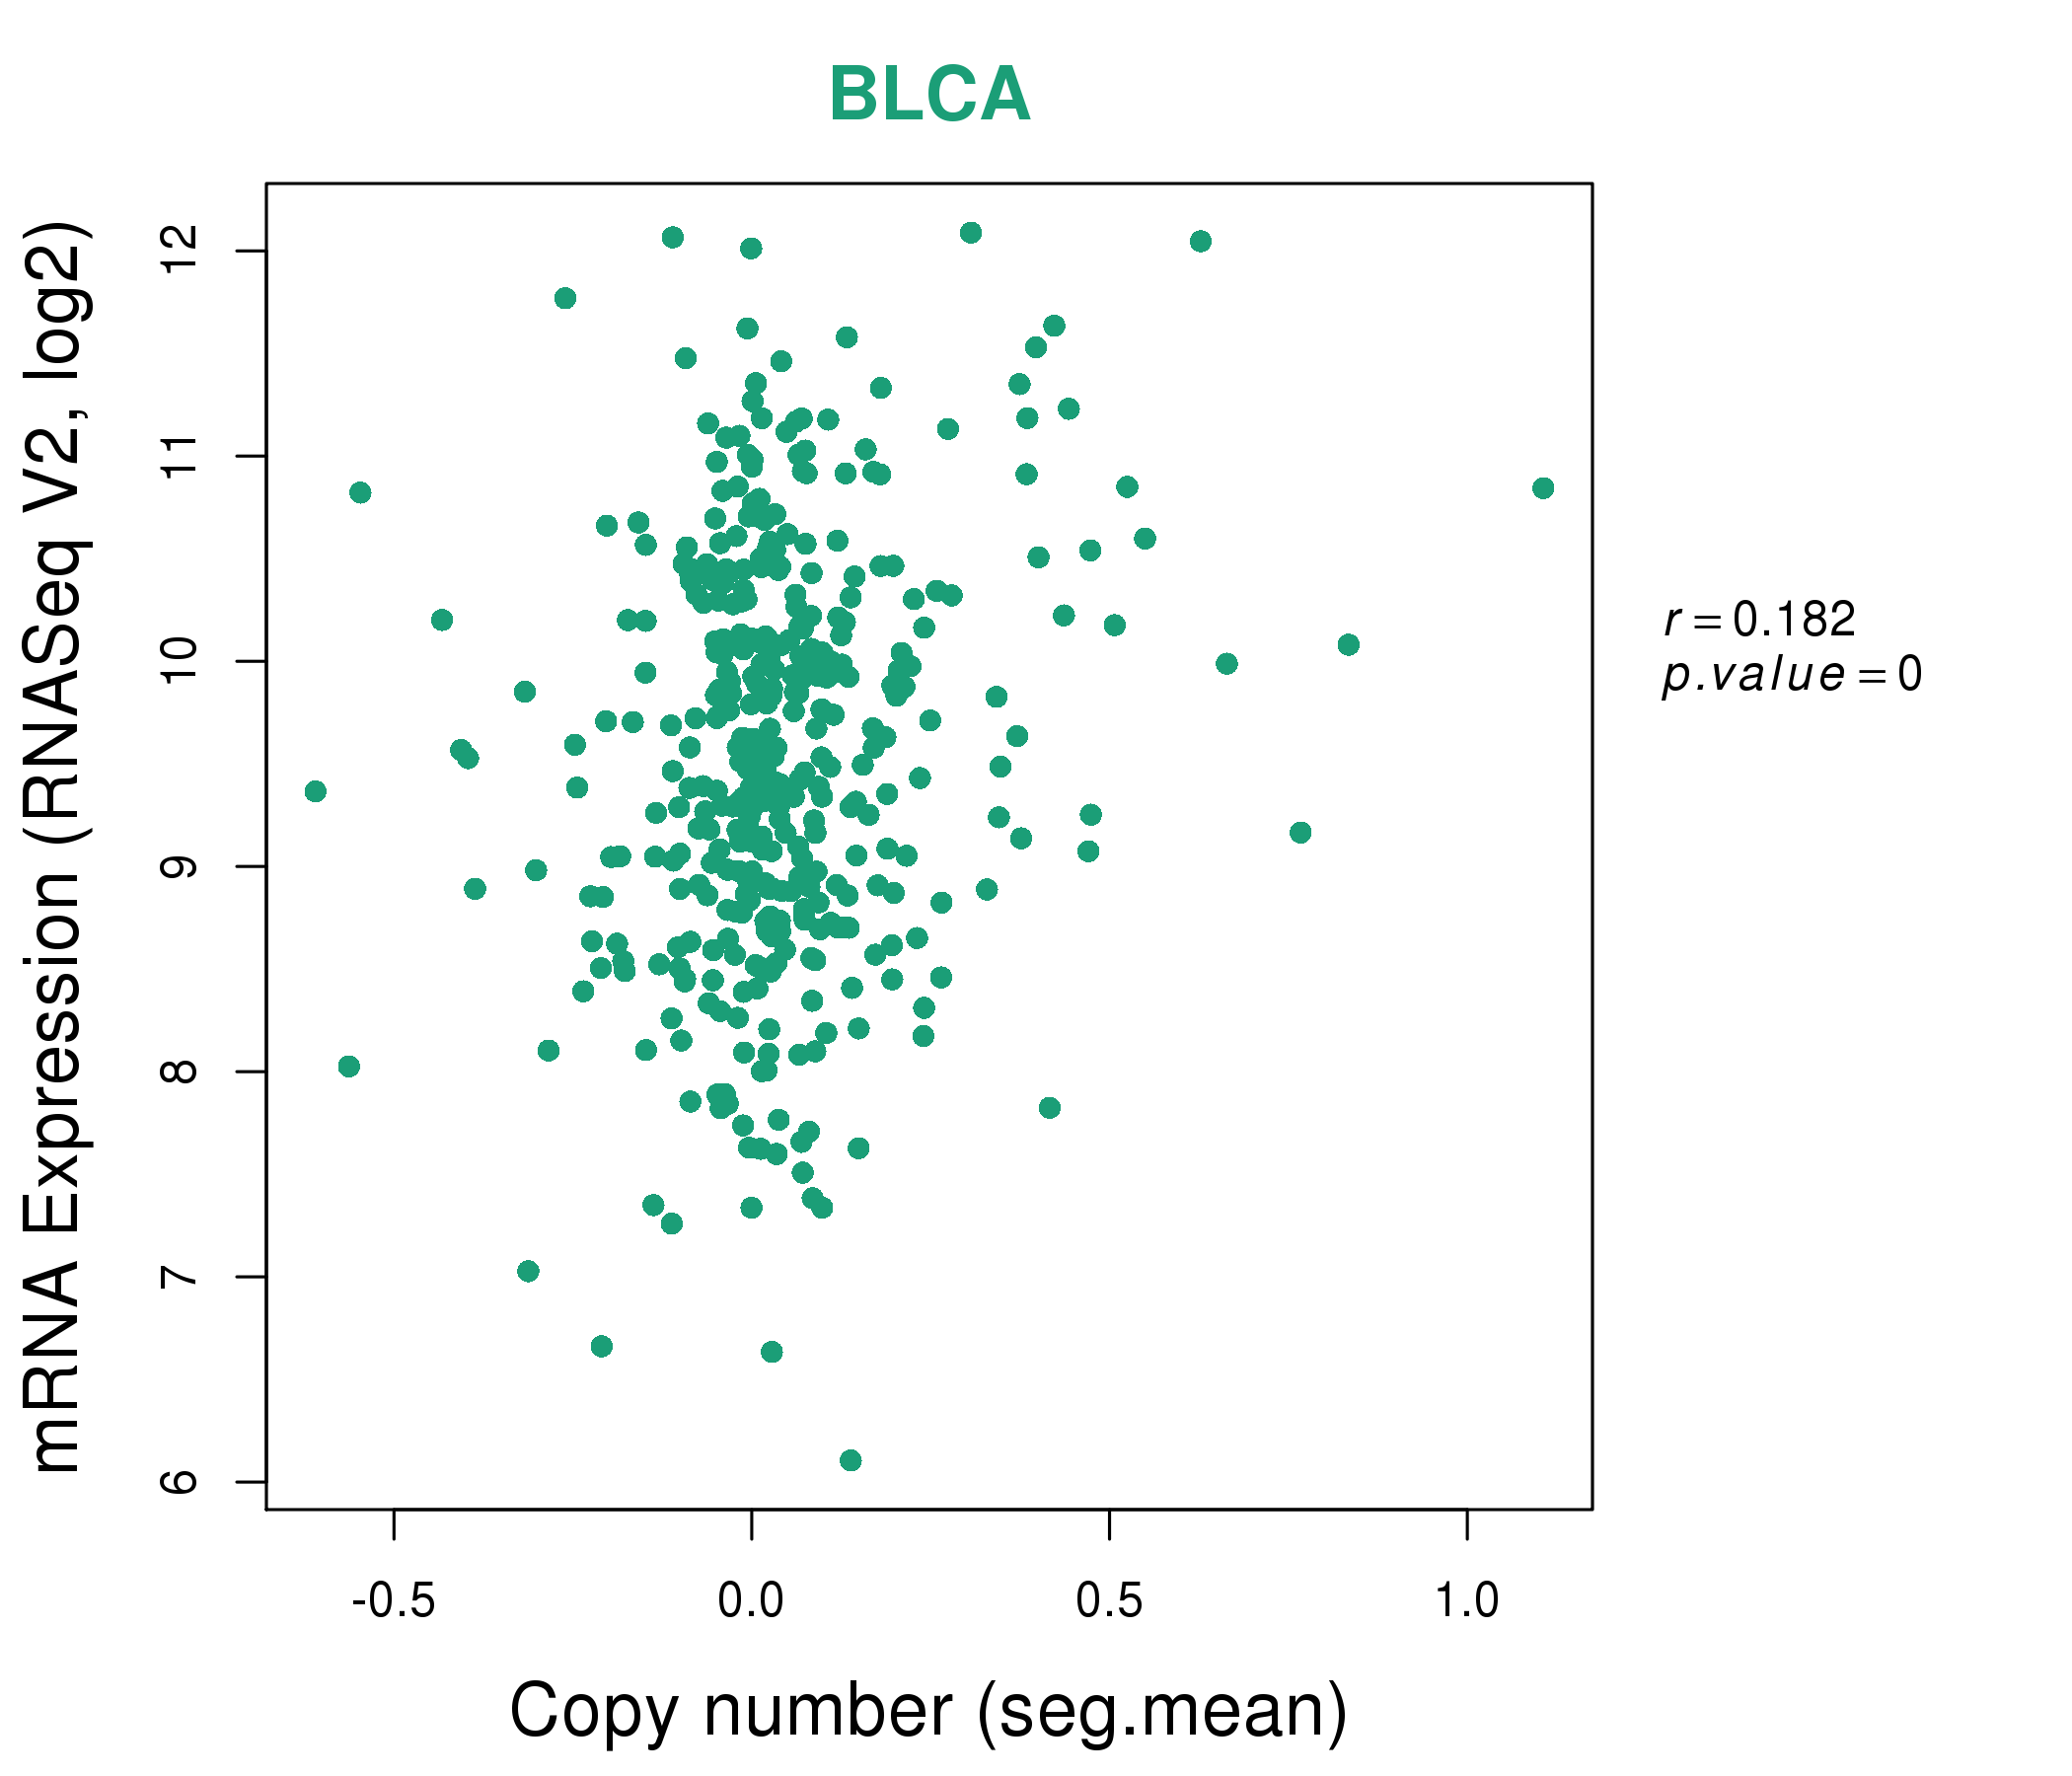
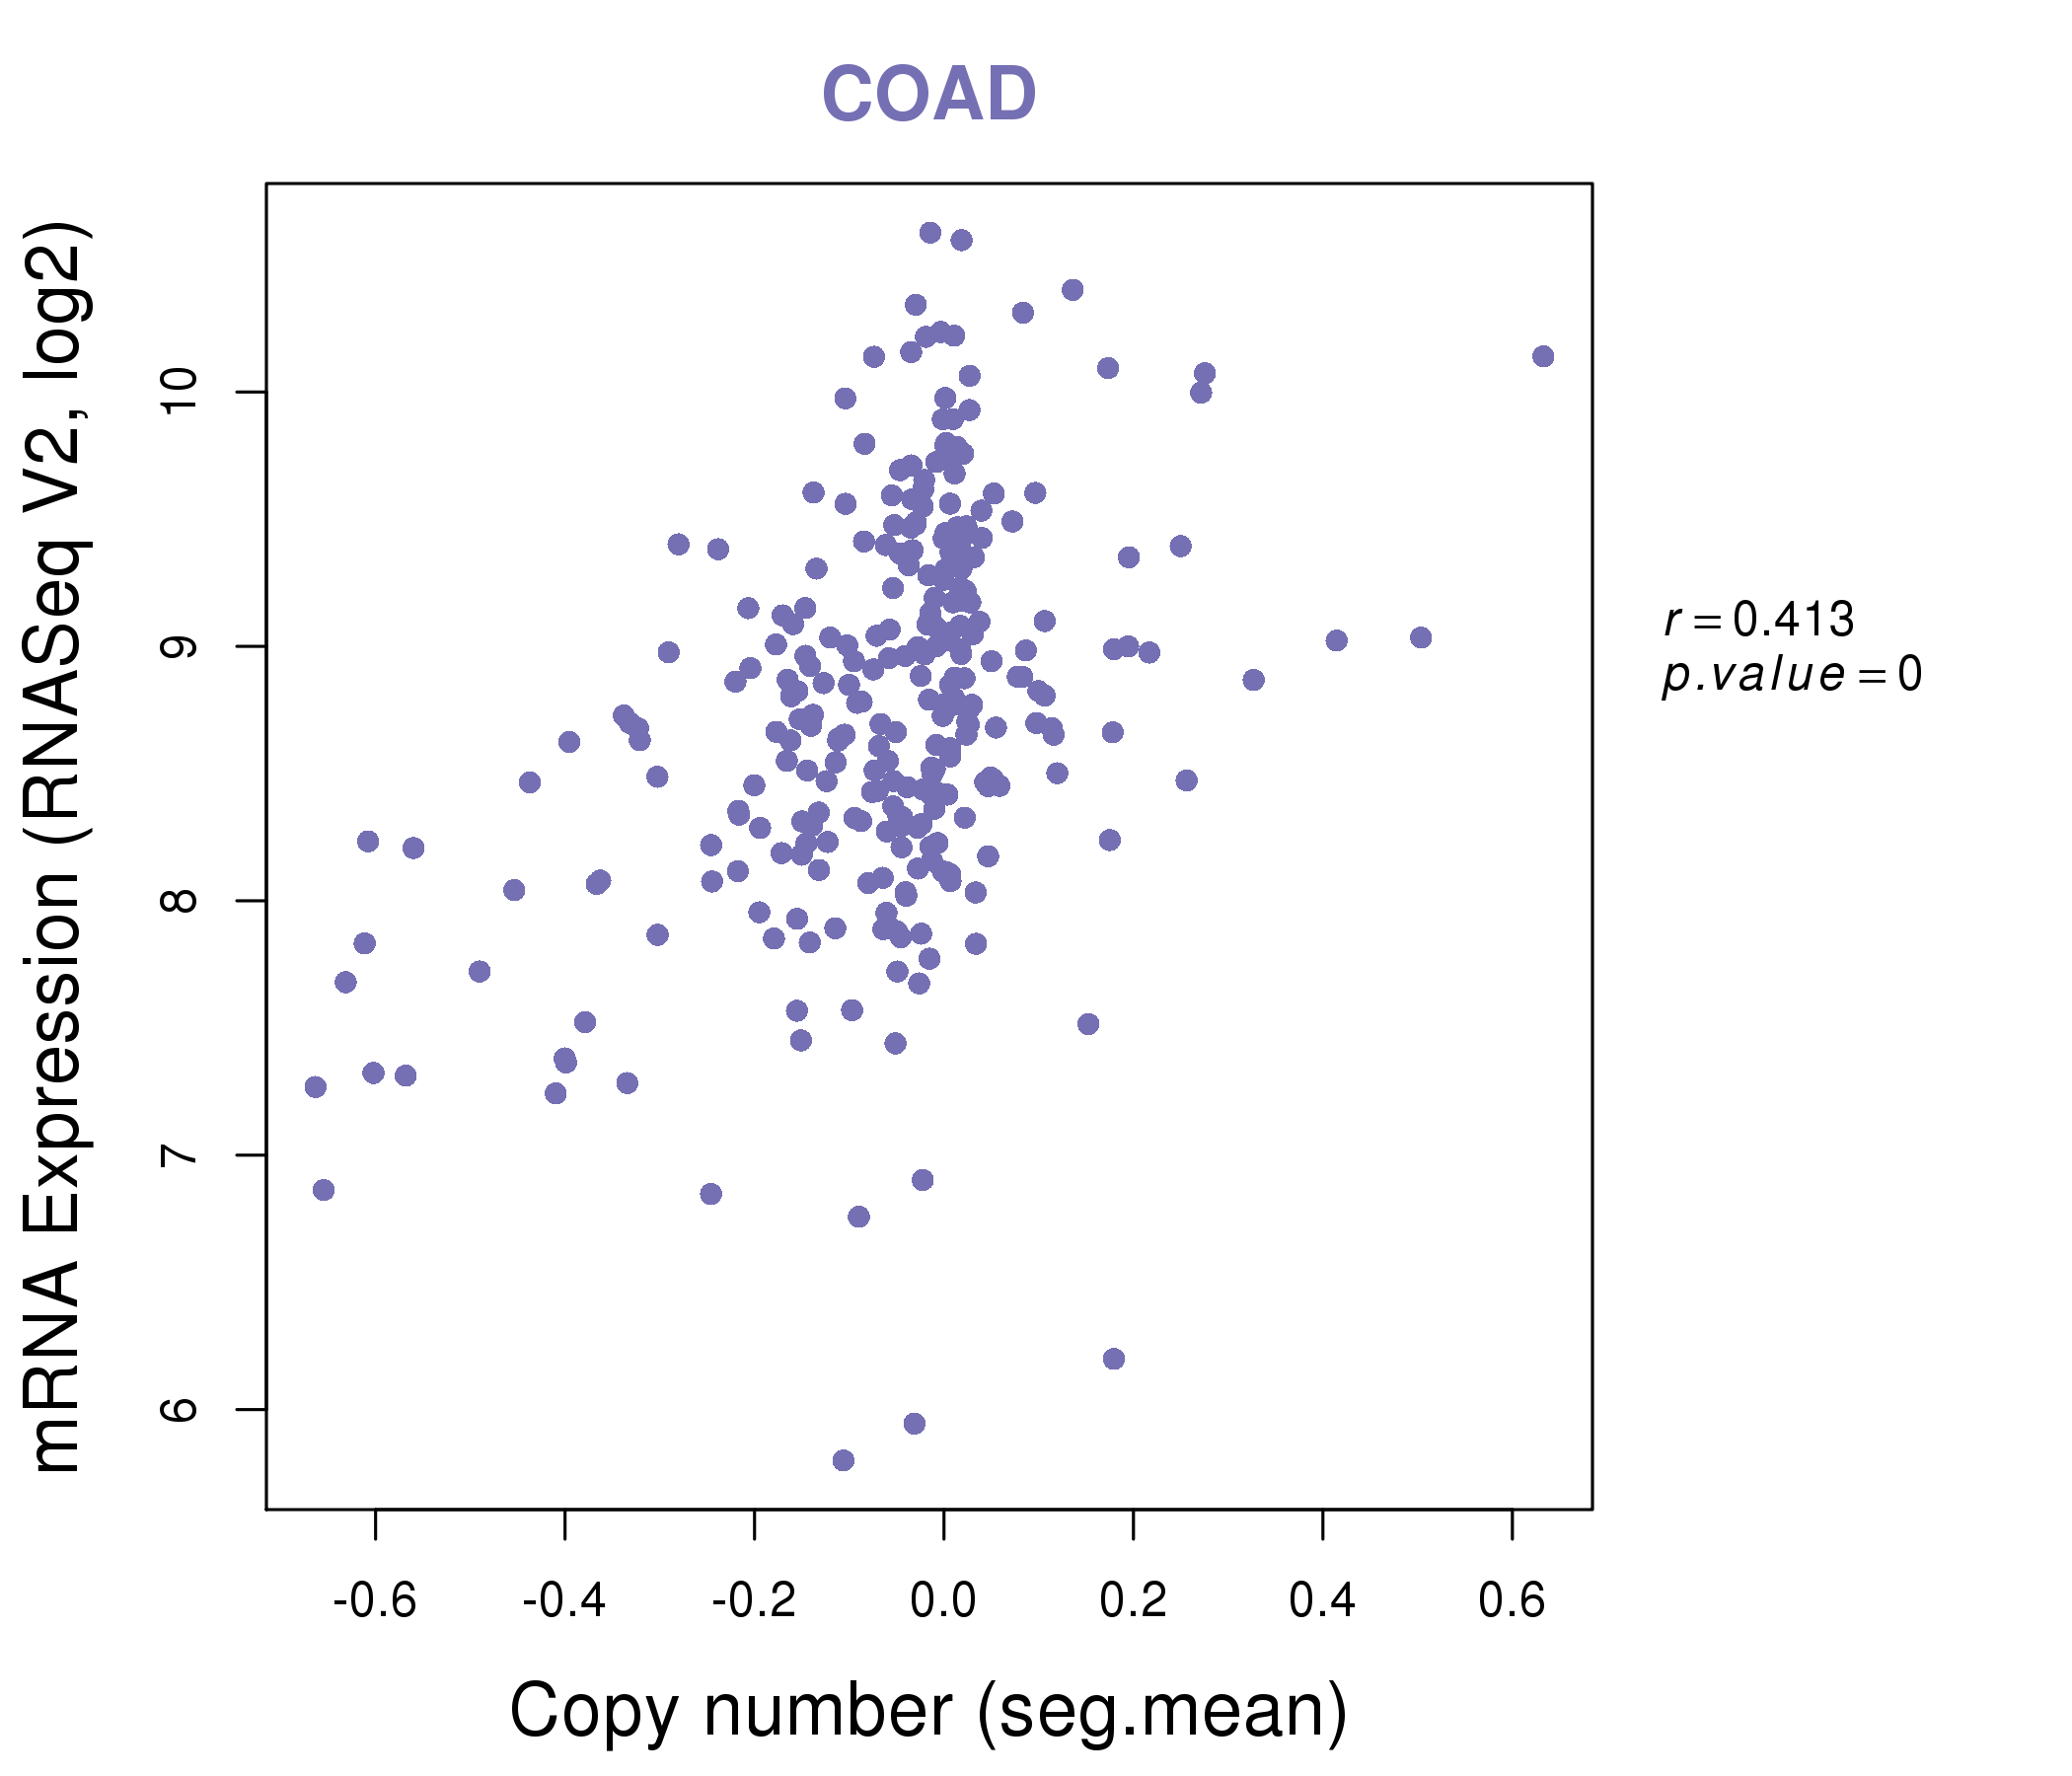
| * Copy number data were extracted from TCGA using R package TCGA-Assembler. The URLs of all public data files on TCGA DCC data server were gathered on Jan-05-2015. Function ProcessCNAData in TCGA-Assembler package was used to obtain gene-level copy number value which is calculated as the average copy number of the genomic region of a gene. |
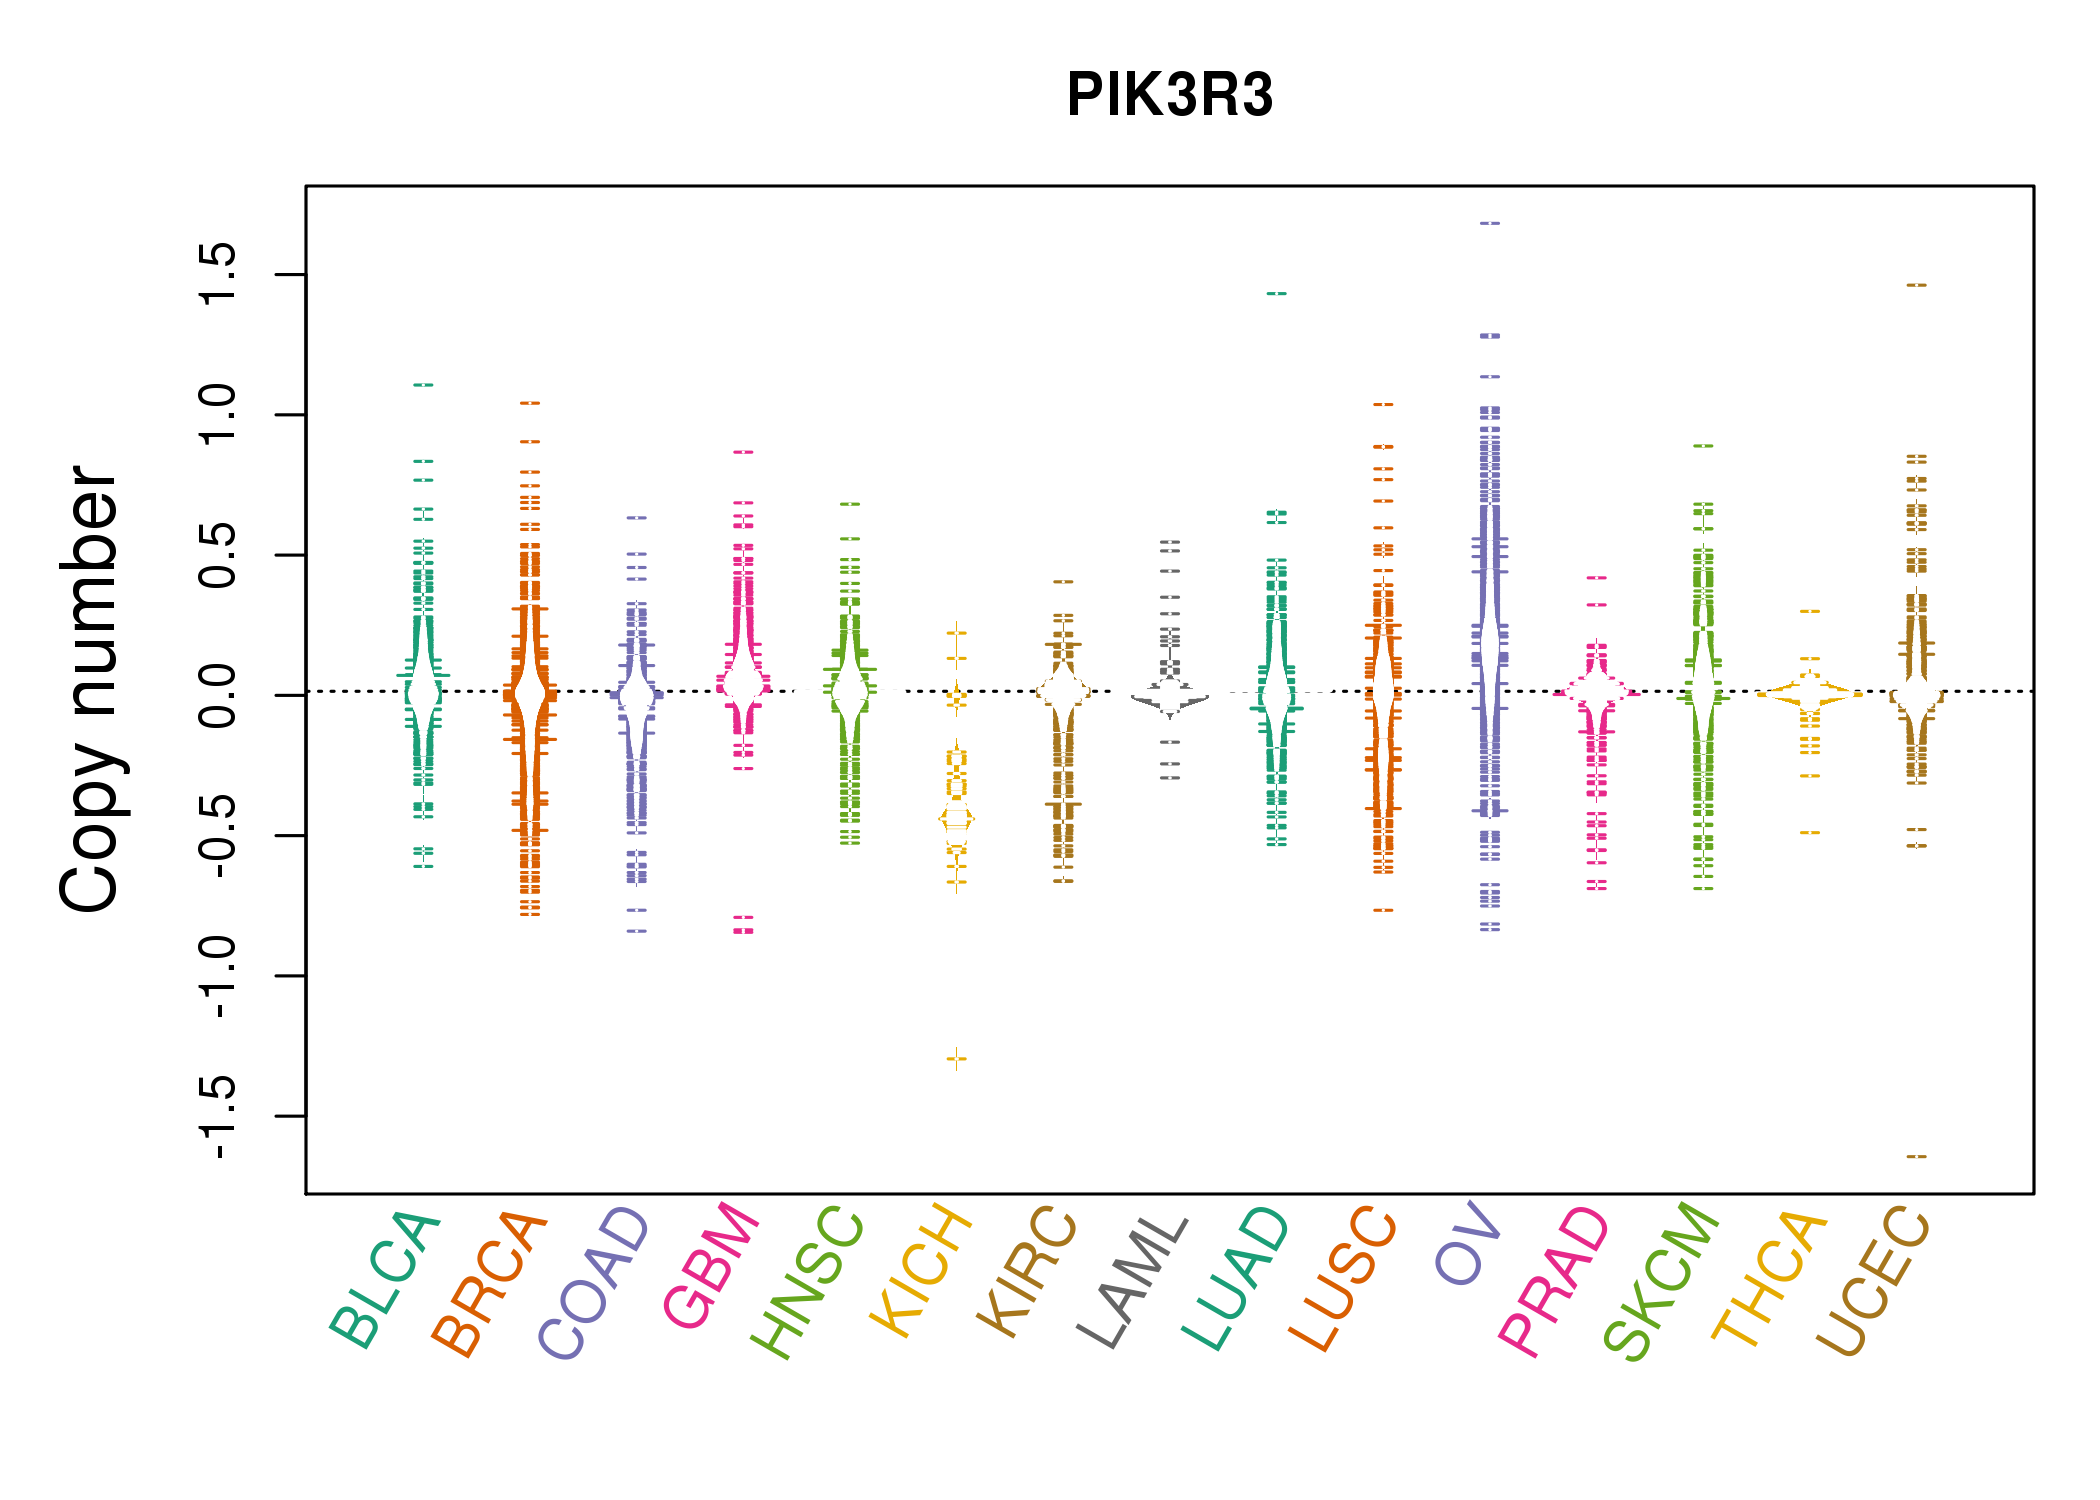 |
| cf) Tissue ID[Tissue type]: BLCA[Bladder Urothelial Carcinoma], BRCA[Breast invasive carcinoma], CESC[Cervical squamous cell carcinoma and endocervical adenocarcinoma], COAD[Colon adenocarcinoma], GBM[Glioblastoma multiforme], Glioma Low Grade, HNSC[Head and Neck squamous cell carcinoma], KICH[Kidney Chromophobe], KIRC[Kidney renal clear cell carcinoma], KIRP[Kidney renal papillary cell carcinoma], LAML[Acute Myeloid Leukemia], LUAD[Lung adenocarcinoma], LUSC[Lung squamous cell carcinoma], OV[Ovarian serous cystadenocarcinoma ], PAAD[Pancreatic adenocarcinoma], PRAD[Prostate adenocarcinoma], SKCM[Skin Cutaneous Melanoma], STAD[Stomach adenocarcinoma], THCA[Thyroid carcinoma], UCEC[Uterine Corpus Endometrial Carcinoma] |
| Top |
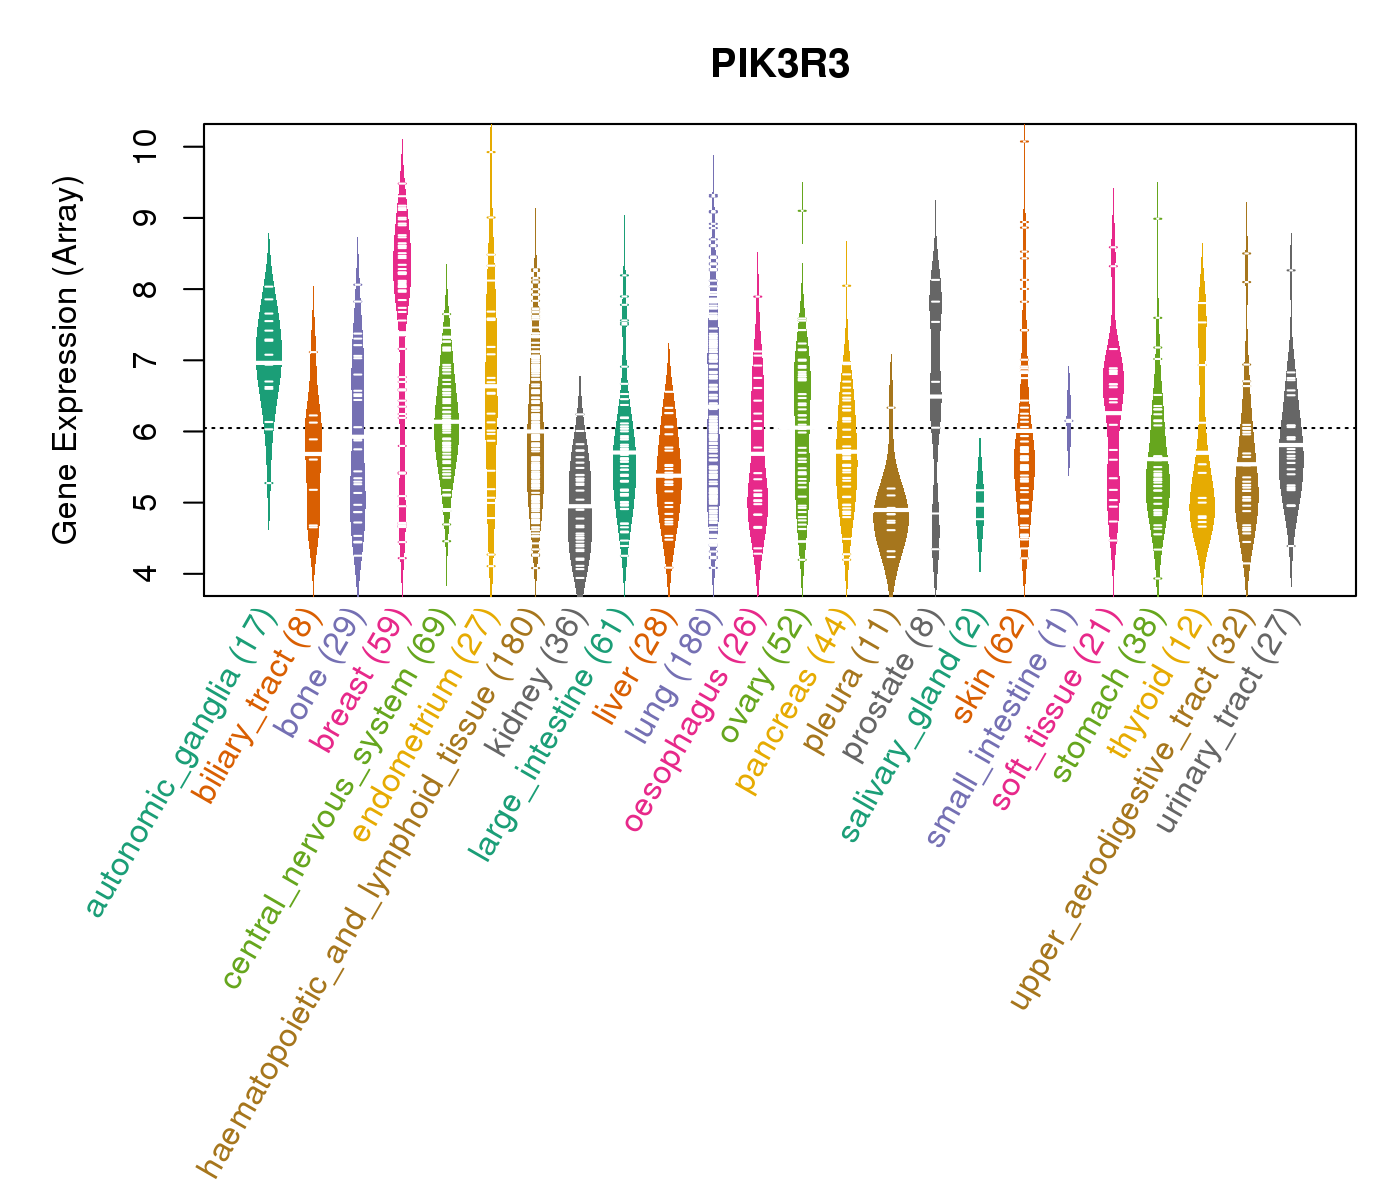
| Gene Expression for PIK3R3 |
| * CCLE gene expression data were extracted from CCLE_Expression_Entrez_2012-10-18.res: Gene-centric RMA-normalized mRNA expression data. |
 |
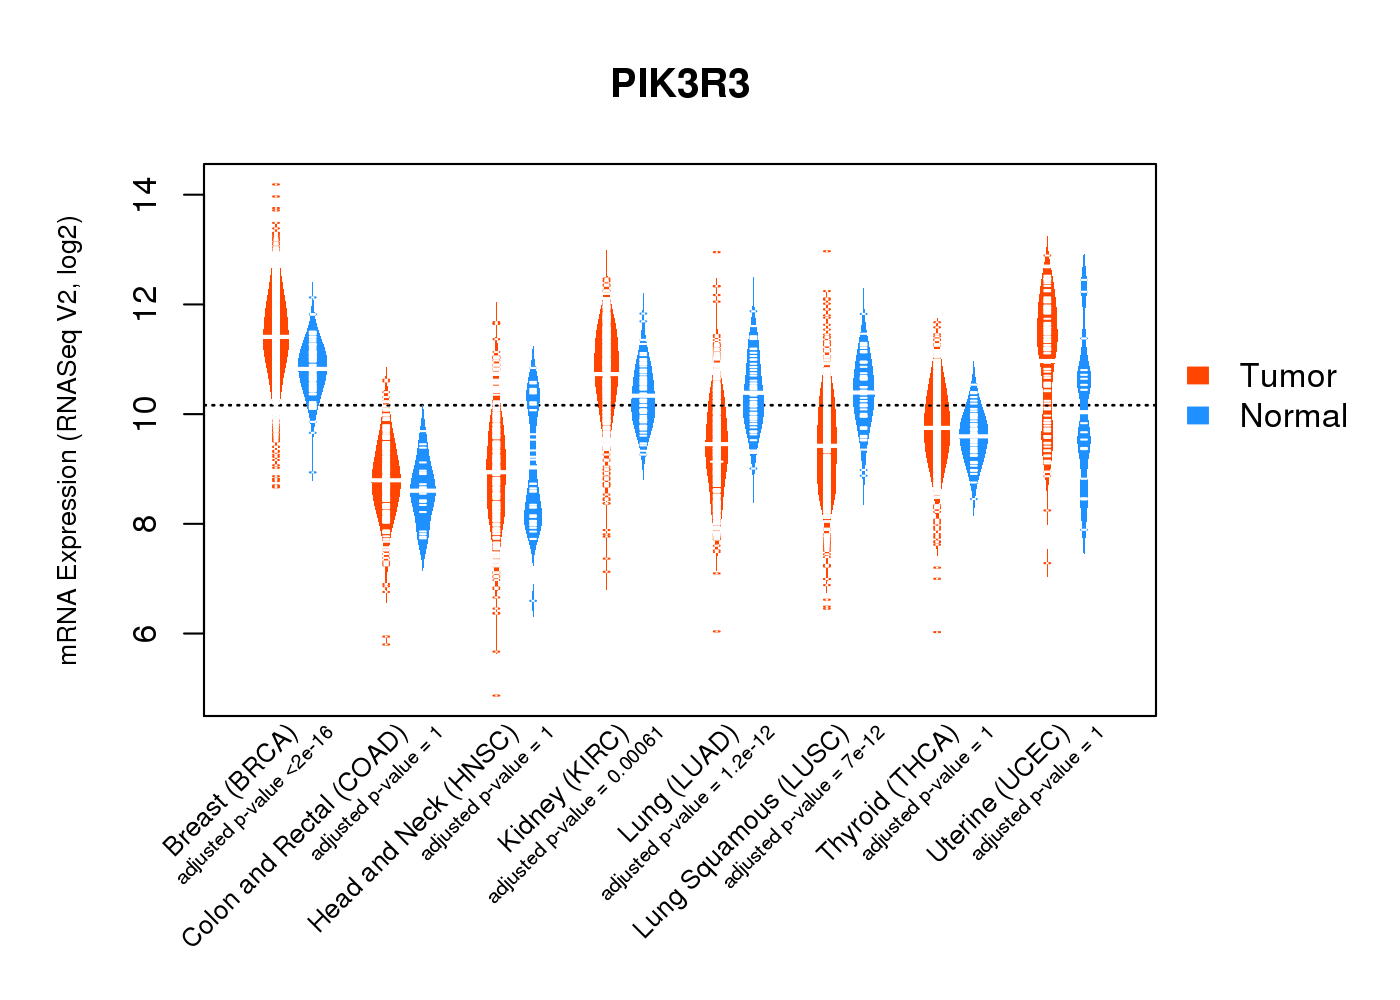
| * Normalized gene expression data of RNASeqV2 was extracted from TCGA using R package TCGA-Assembler. The URLs of all public data files on TCGA DCC data server were gathered at Jan-05-2015. Only eight cancer types have enough normal control samples for differential expression analysis. (t test, adjusted p<0.05 (using Benjamini-Hochberg FDR)) |
 |
| Top |
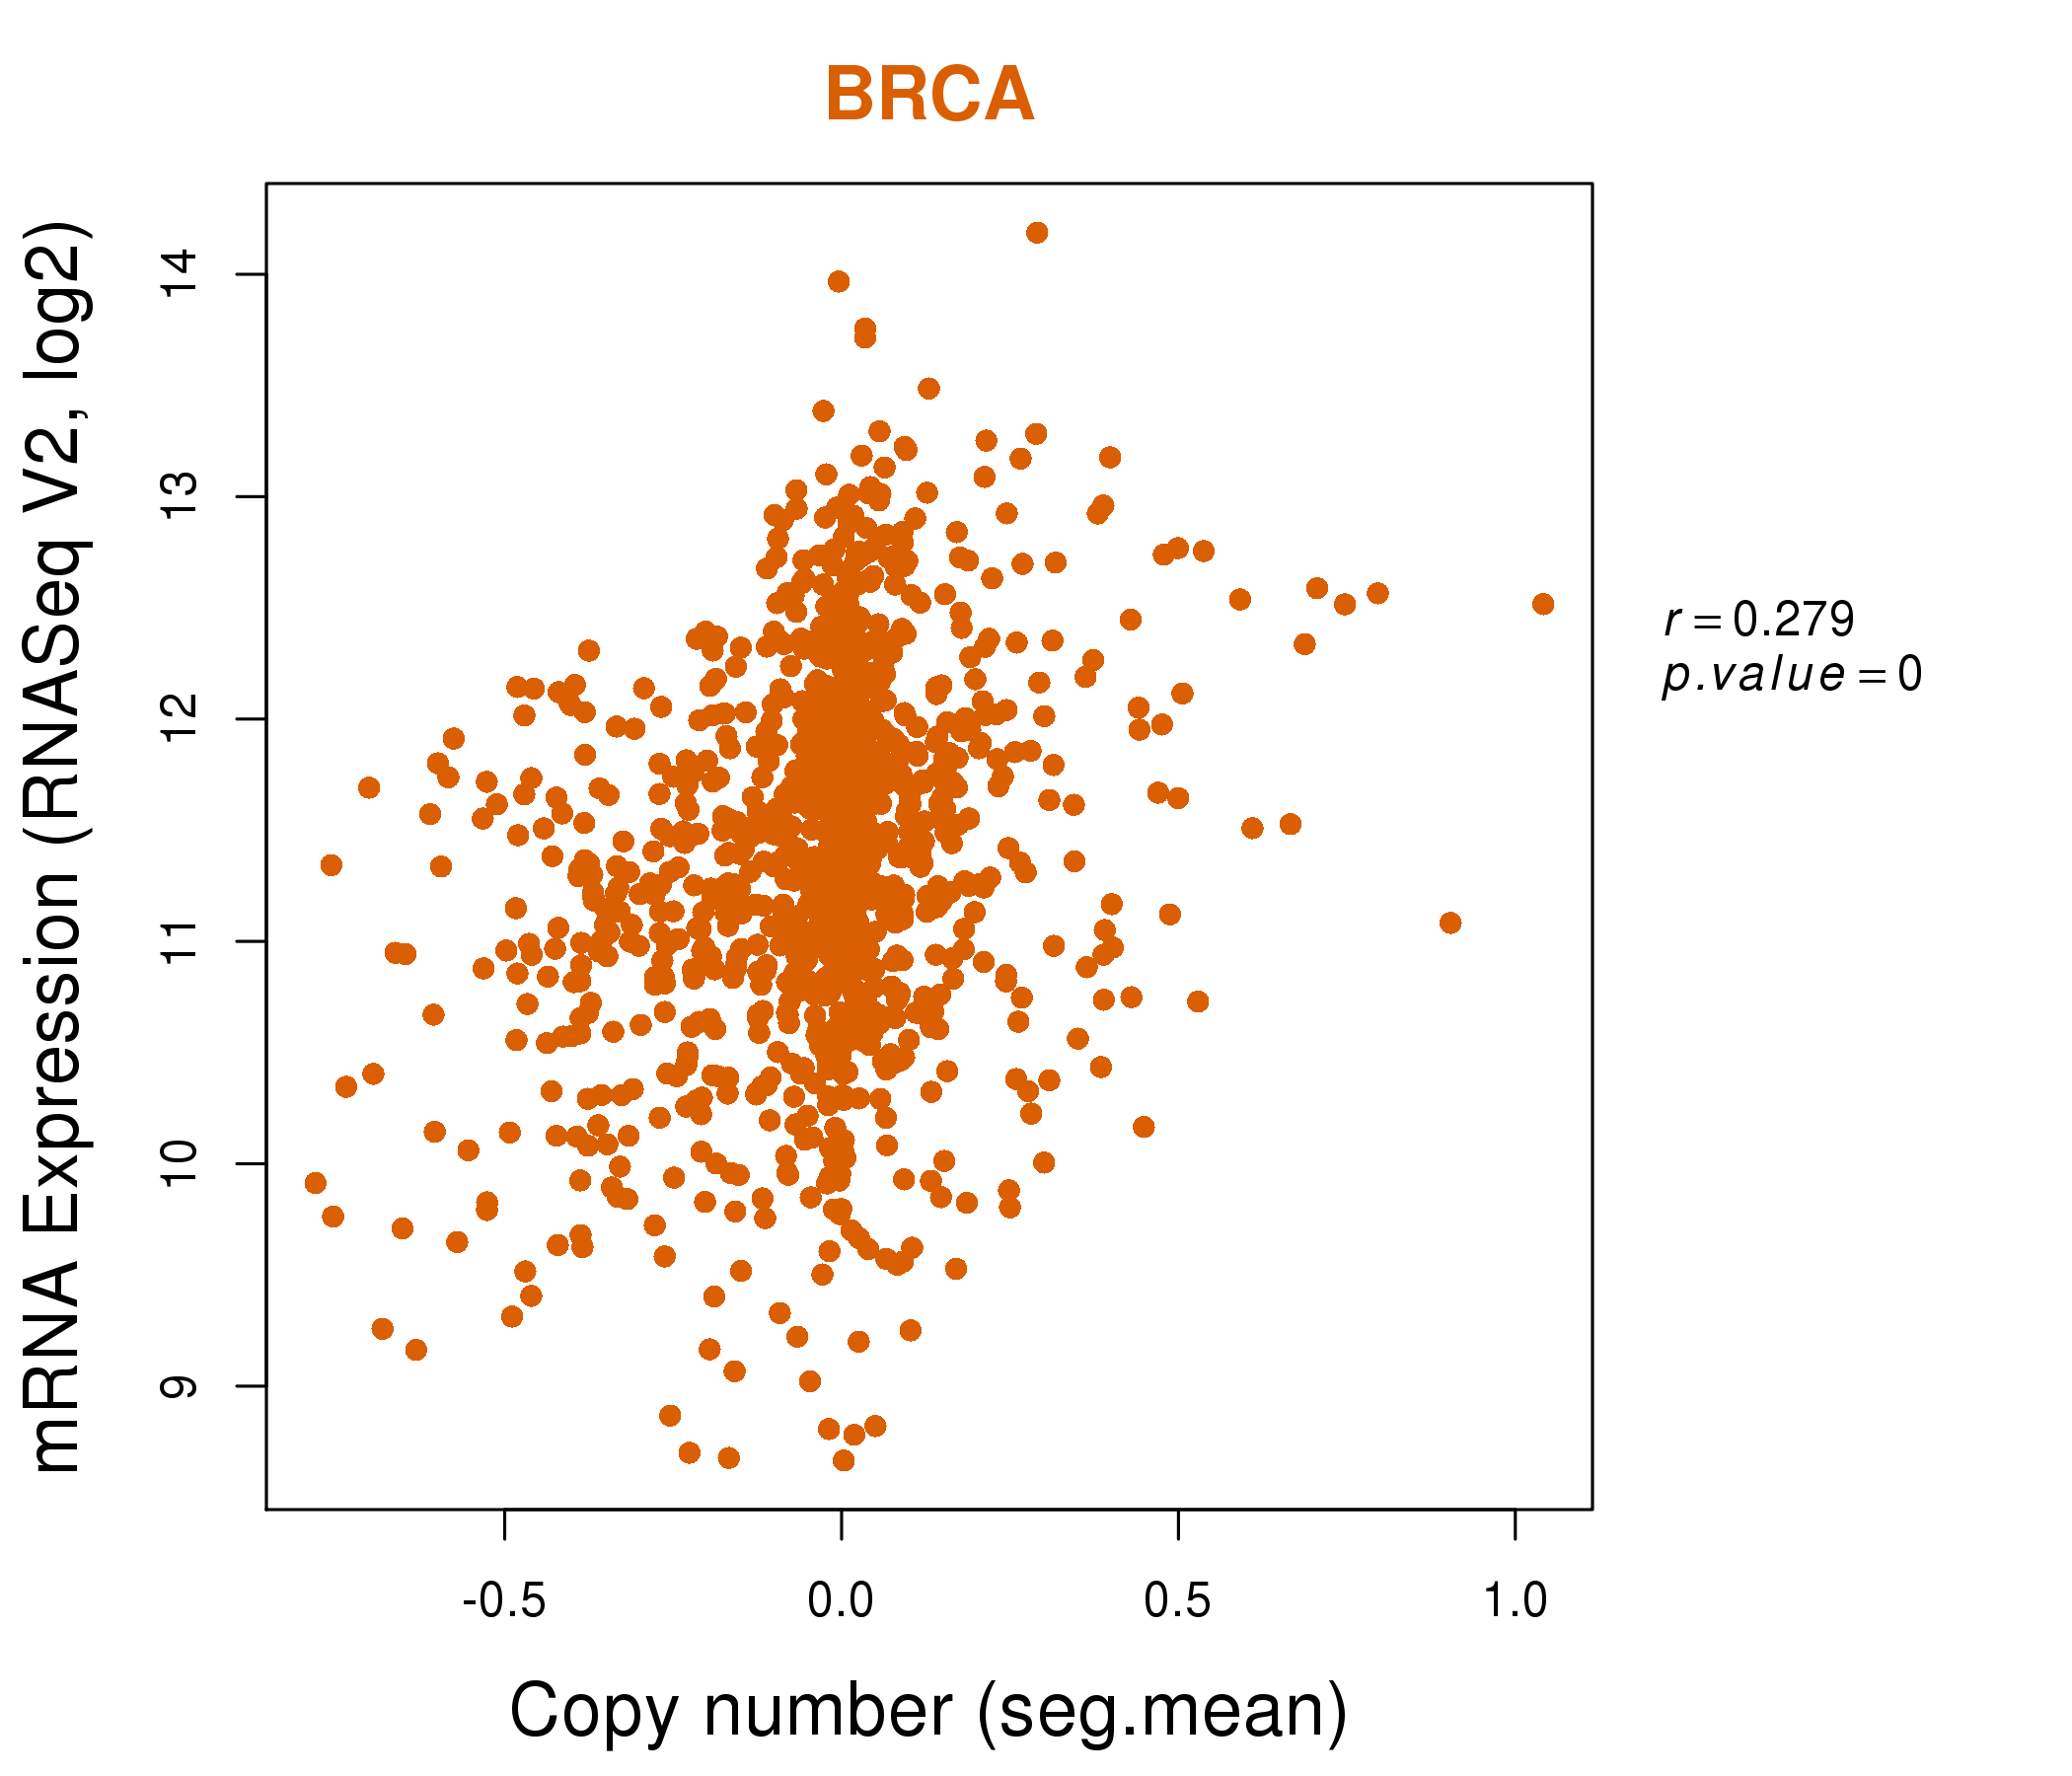
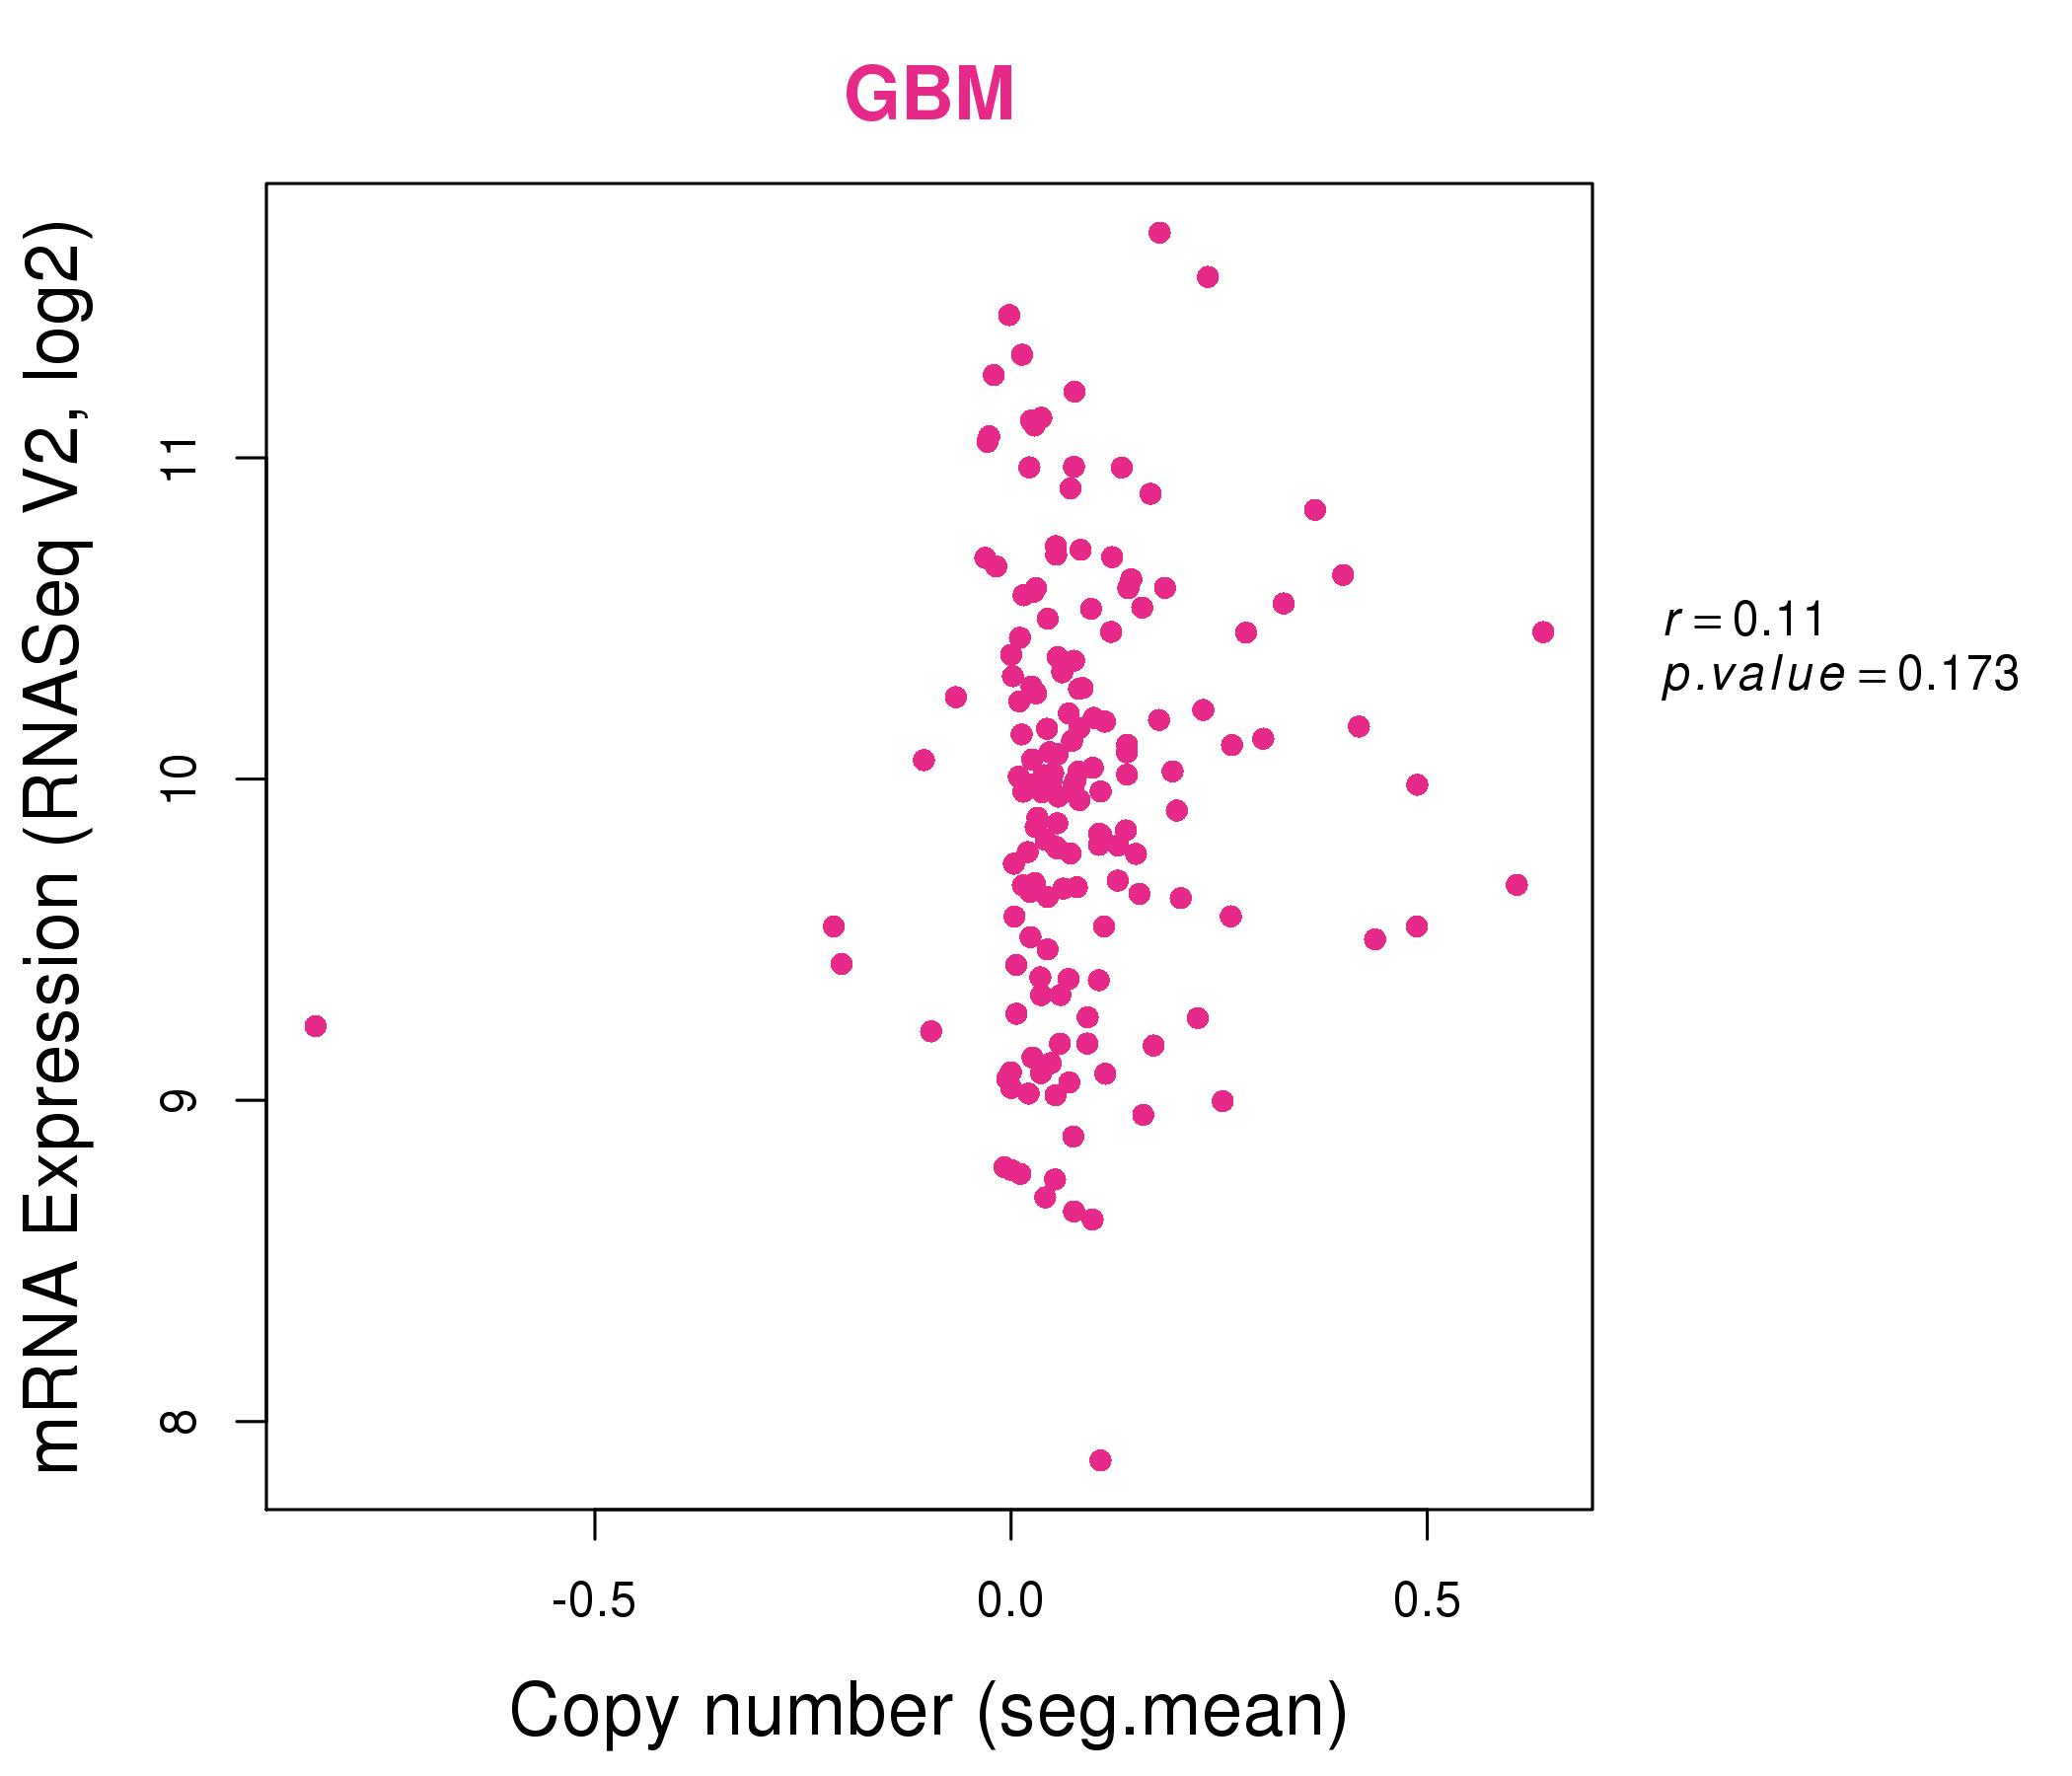
| * This plots show the correlation between CNV and gene expression. |
: Open all plots for all cancer types
 |
|
 |
|
| Top |
| Gene-Gene Network Information |
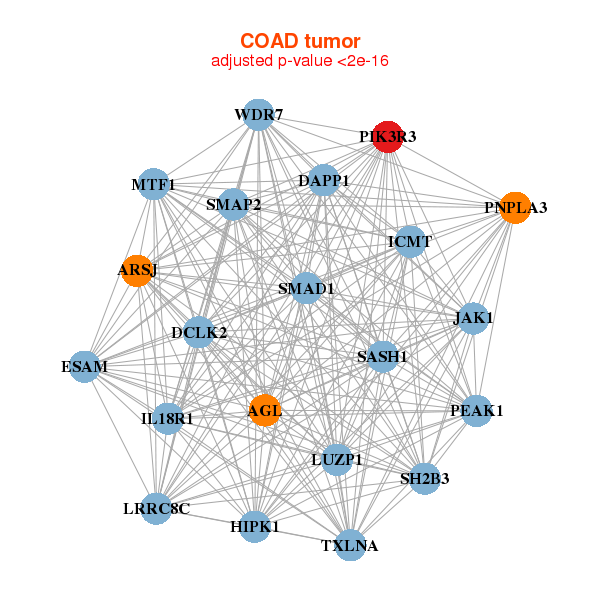
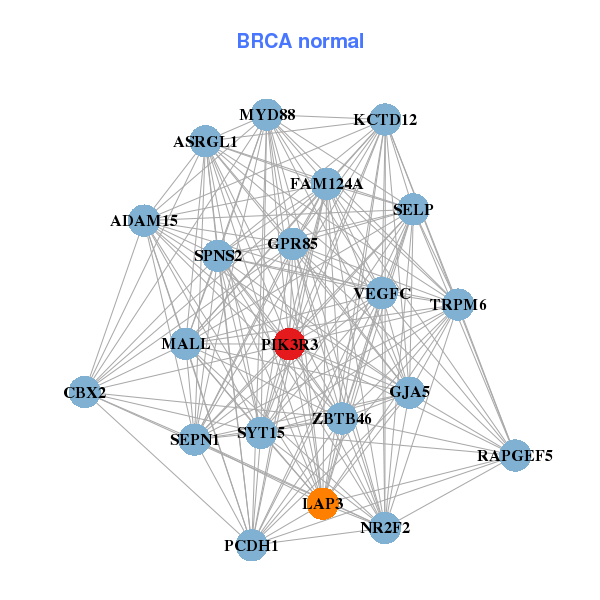
| * Co-Expression network figures were drawn using R package igraph. Only the top 20 genes with the highest correlations were shown. Red circle: input gene, orange circle: cell metabolism gene, sky circle: other gene |
: Open all plots for all cancer types
 |
| ||||
| AKIRIN1,AQR,CACUL1,CAP1,RHOV___CHP1,DTWD2,GPBP1L1, IPP,KDM4A,KIAA1522,MTF1,NFIA,NRD1,NSUN4, PIK3R3,RLF,RNF11,SRBD1,TC2N,YIPF1,ZMPSTE24 | ADAM15,ASRGL1,CBX2,FAM124A,GJA5,GPR85,KCTD12, LAP3,MALL,MYD88,NR2F2,PCDH1,PIK3R3,RAPGEF5, SELP,SEPN1,SPNS2,SYT15,TRPM6,VEGFC,ZBTB46 | ||||
 |
| ||||
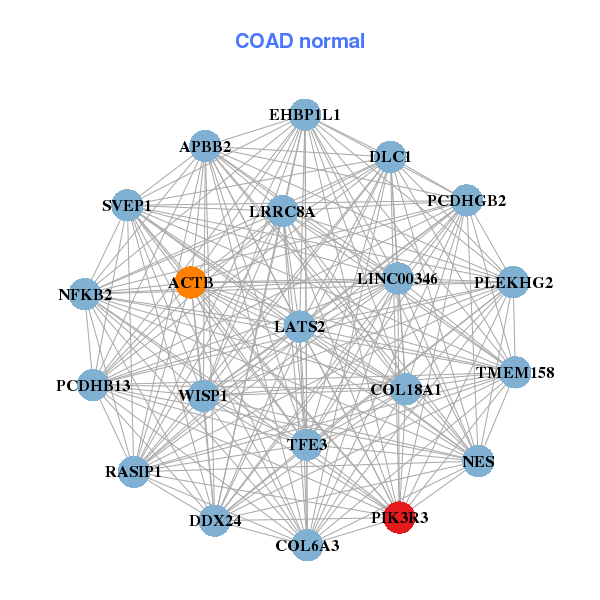
| AGL,ARSJ,DAPP1,DCLK2,ESAM,HIPK1,ICMT, IL18R1,JAK1,LRRC8C,LUZP1,MTF1,PIK3R3,PNPLA3, SASH1,PEAK1,SH2B3,SMAD1,SMAP2,TXLNA,WDR7 | ACTB,APBB2,LINC00346,COL18A1,COL6A3,DDX24,DLC1, EHBP1L1,LATS2,LRRC8A,NES,NFKB2,PCDHB13,PCDHGB2, PIK3R3,PLEKHG2,RASIP1,SVEP1,TFE3,TMEM158,WISP1 |
| * Co-Expression network figures were drawn using R package igraph. Only the top 20 genes with the highest correlations were shown. Red circle: input gene, orange circle: cell metabolism gene, sky circle: other gene |
: Open all plots for all cancer types
| Top |
: Open all interacting genes' information including KEGG pathway for all interacting genes from DAVID
| Top |
| Pharmacological Information for PIK3R3 |
| DB Category | DB Name | DB's ID and Url link |
| Organism-specific databases | PharmGKB | PA33314; -. |
| Organism-specific databases | CTD | 8503; -. |
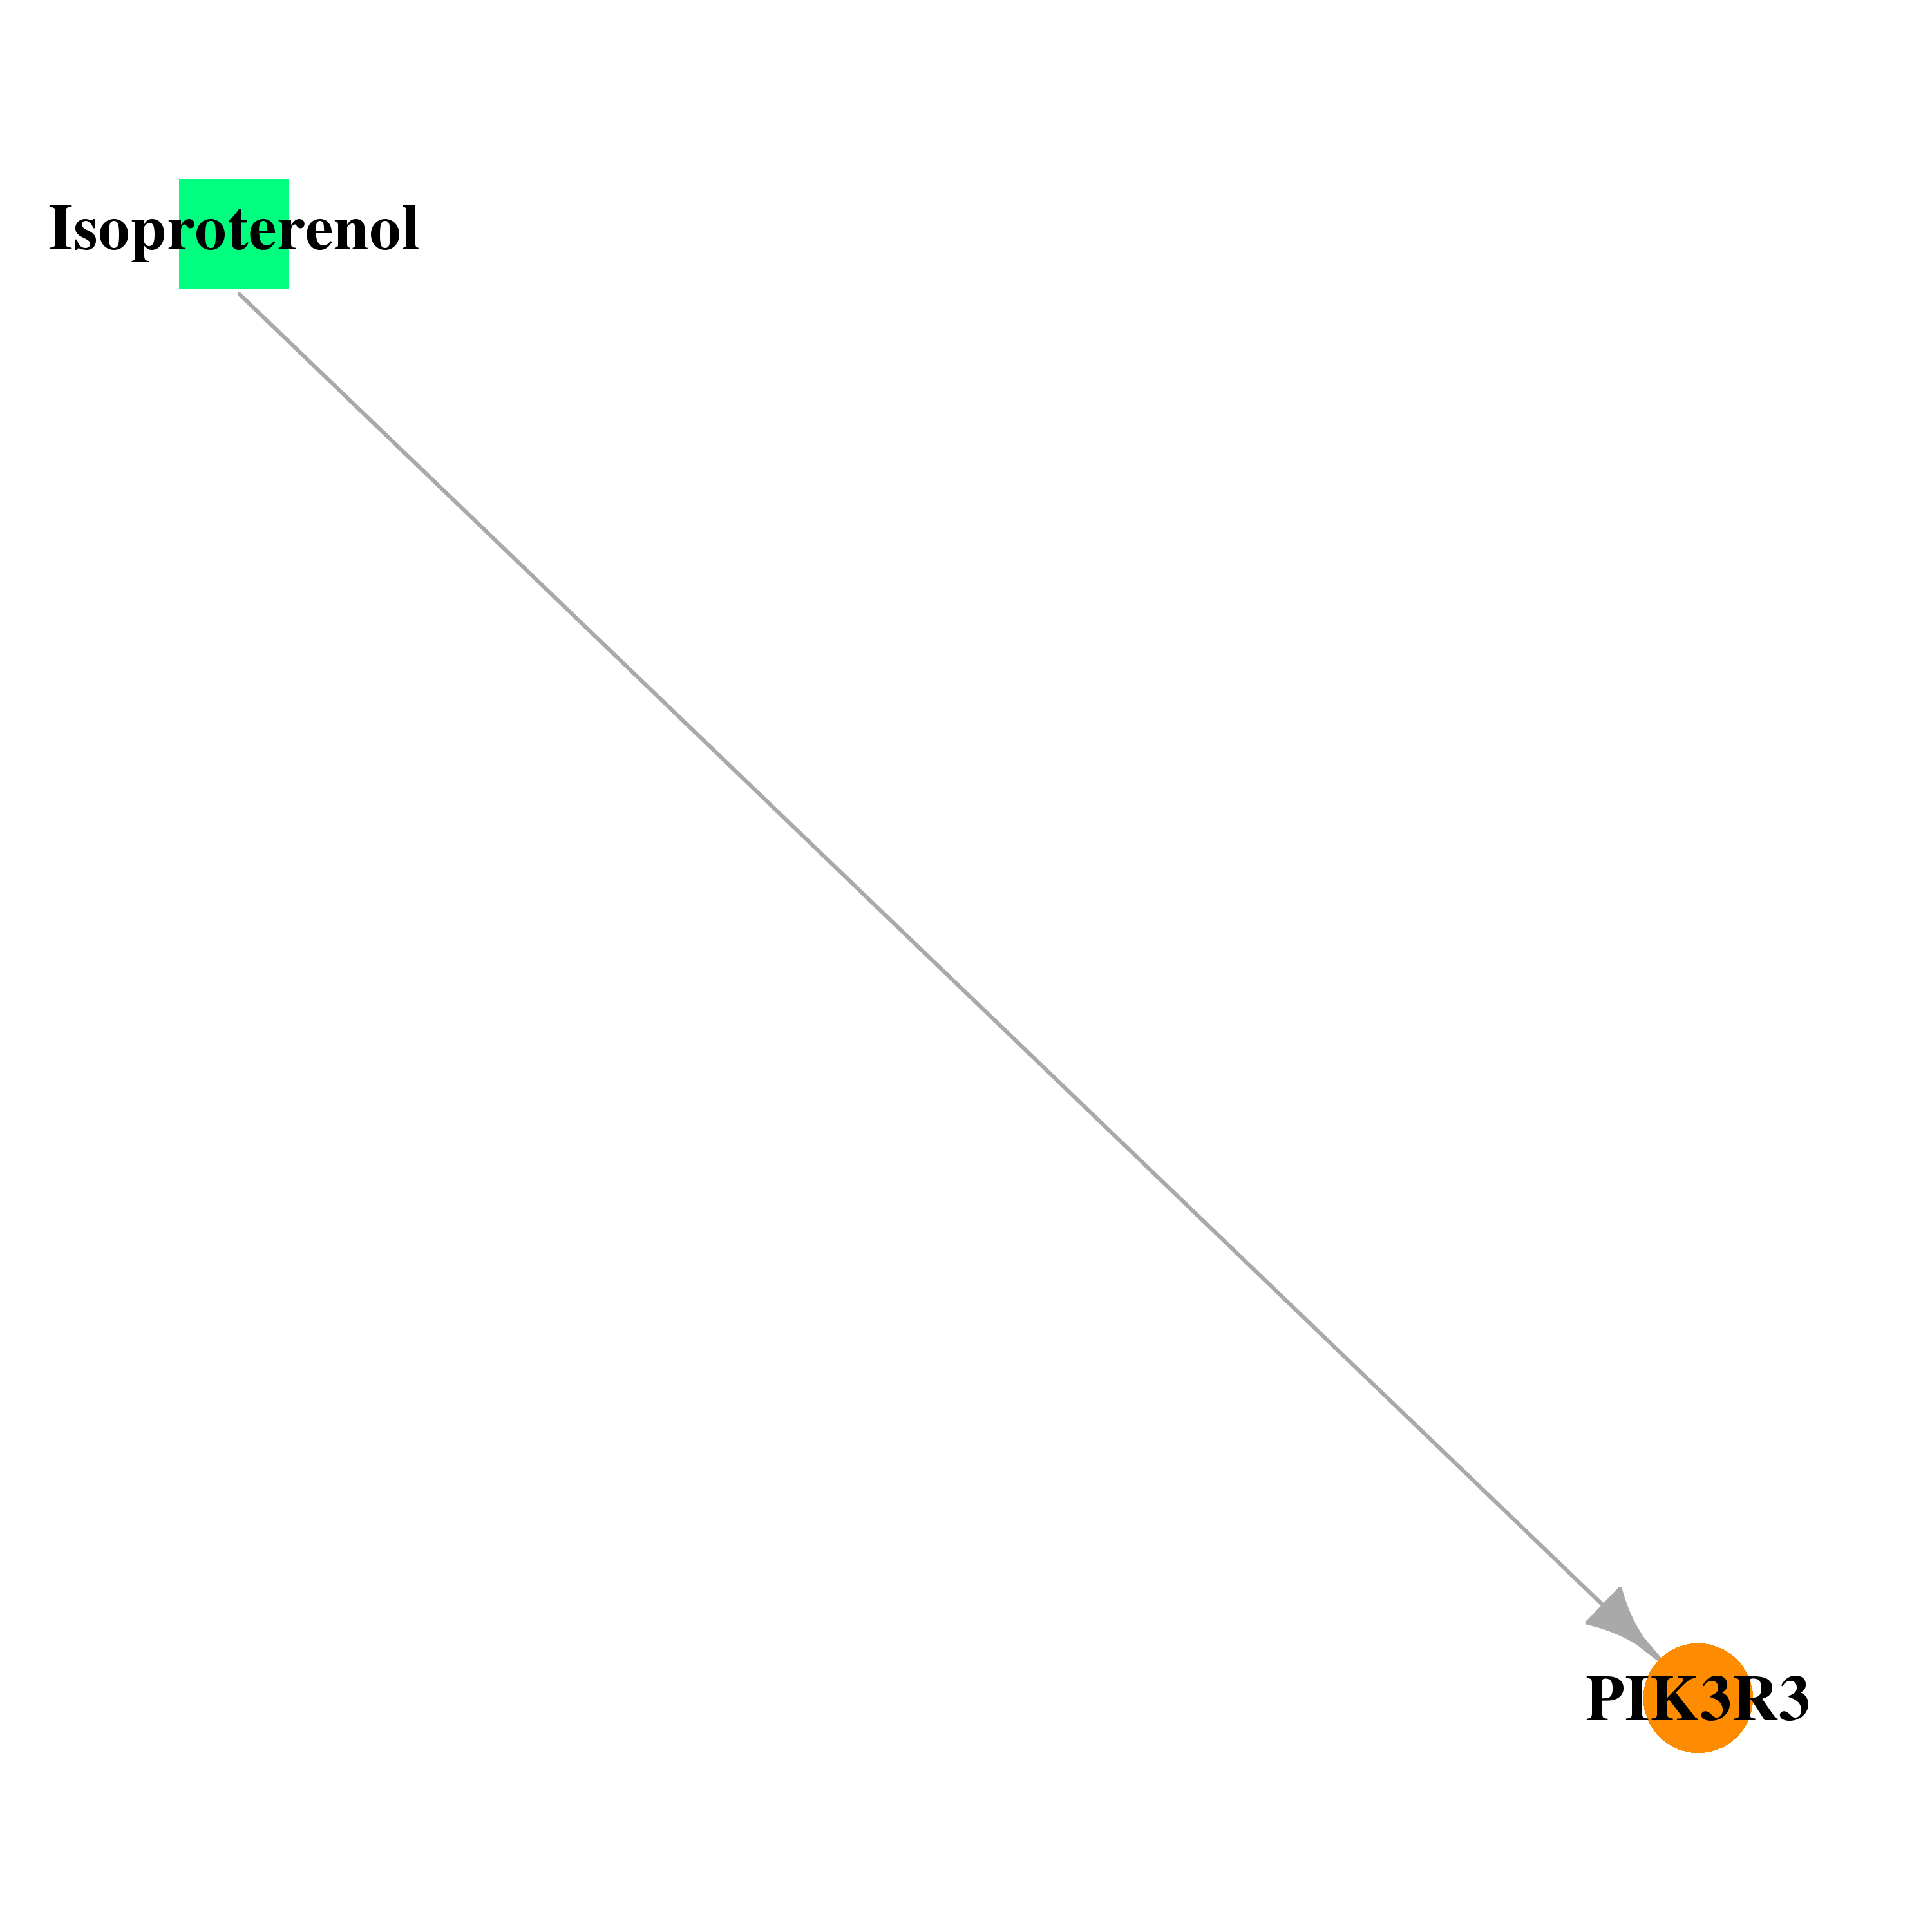
| * Gene Centered Interaction Network. |
 |
| * Drug Centered Interaction Network. |
| DrugBank ID | Target Name | Drug Groups | Generic Name | Drug Centered Network | Drug Structure |
| DB01064 | phosphoinositide-3-kinase, regulatory subunit 3 (gamma) | approved | Isoproterenol | 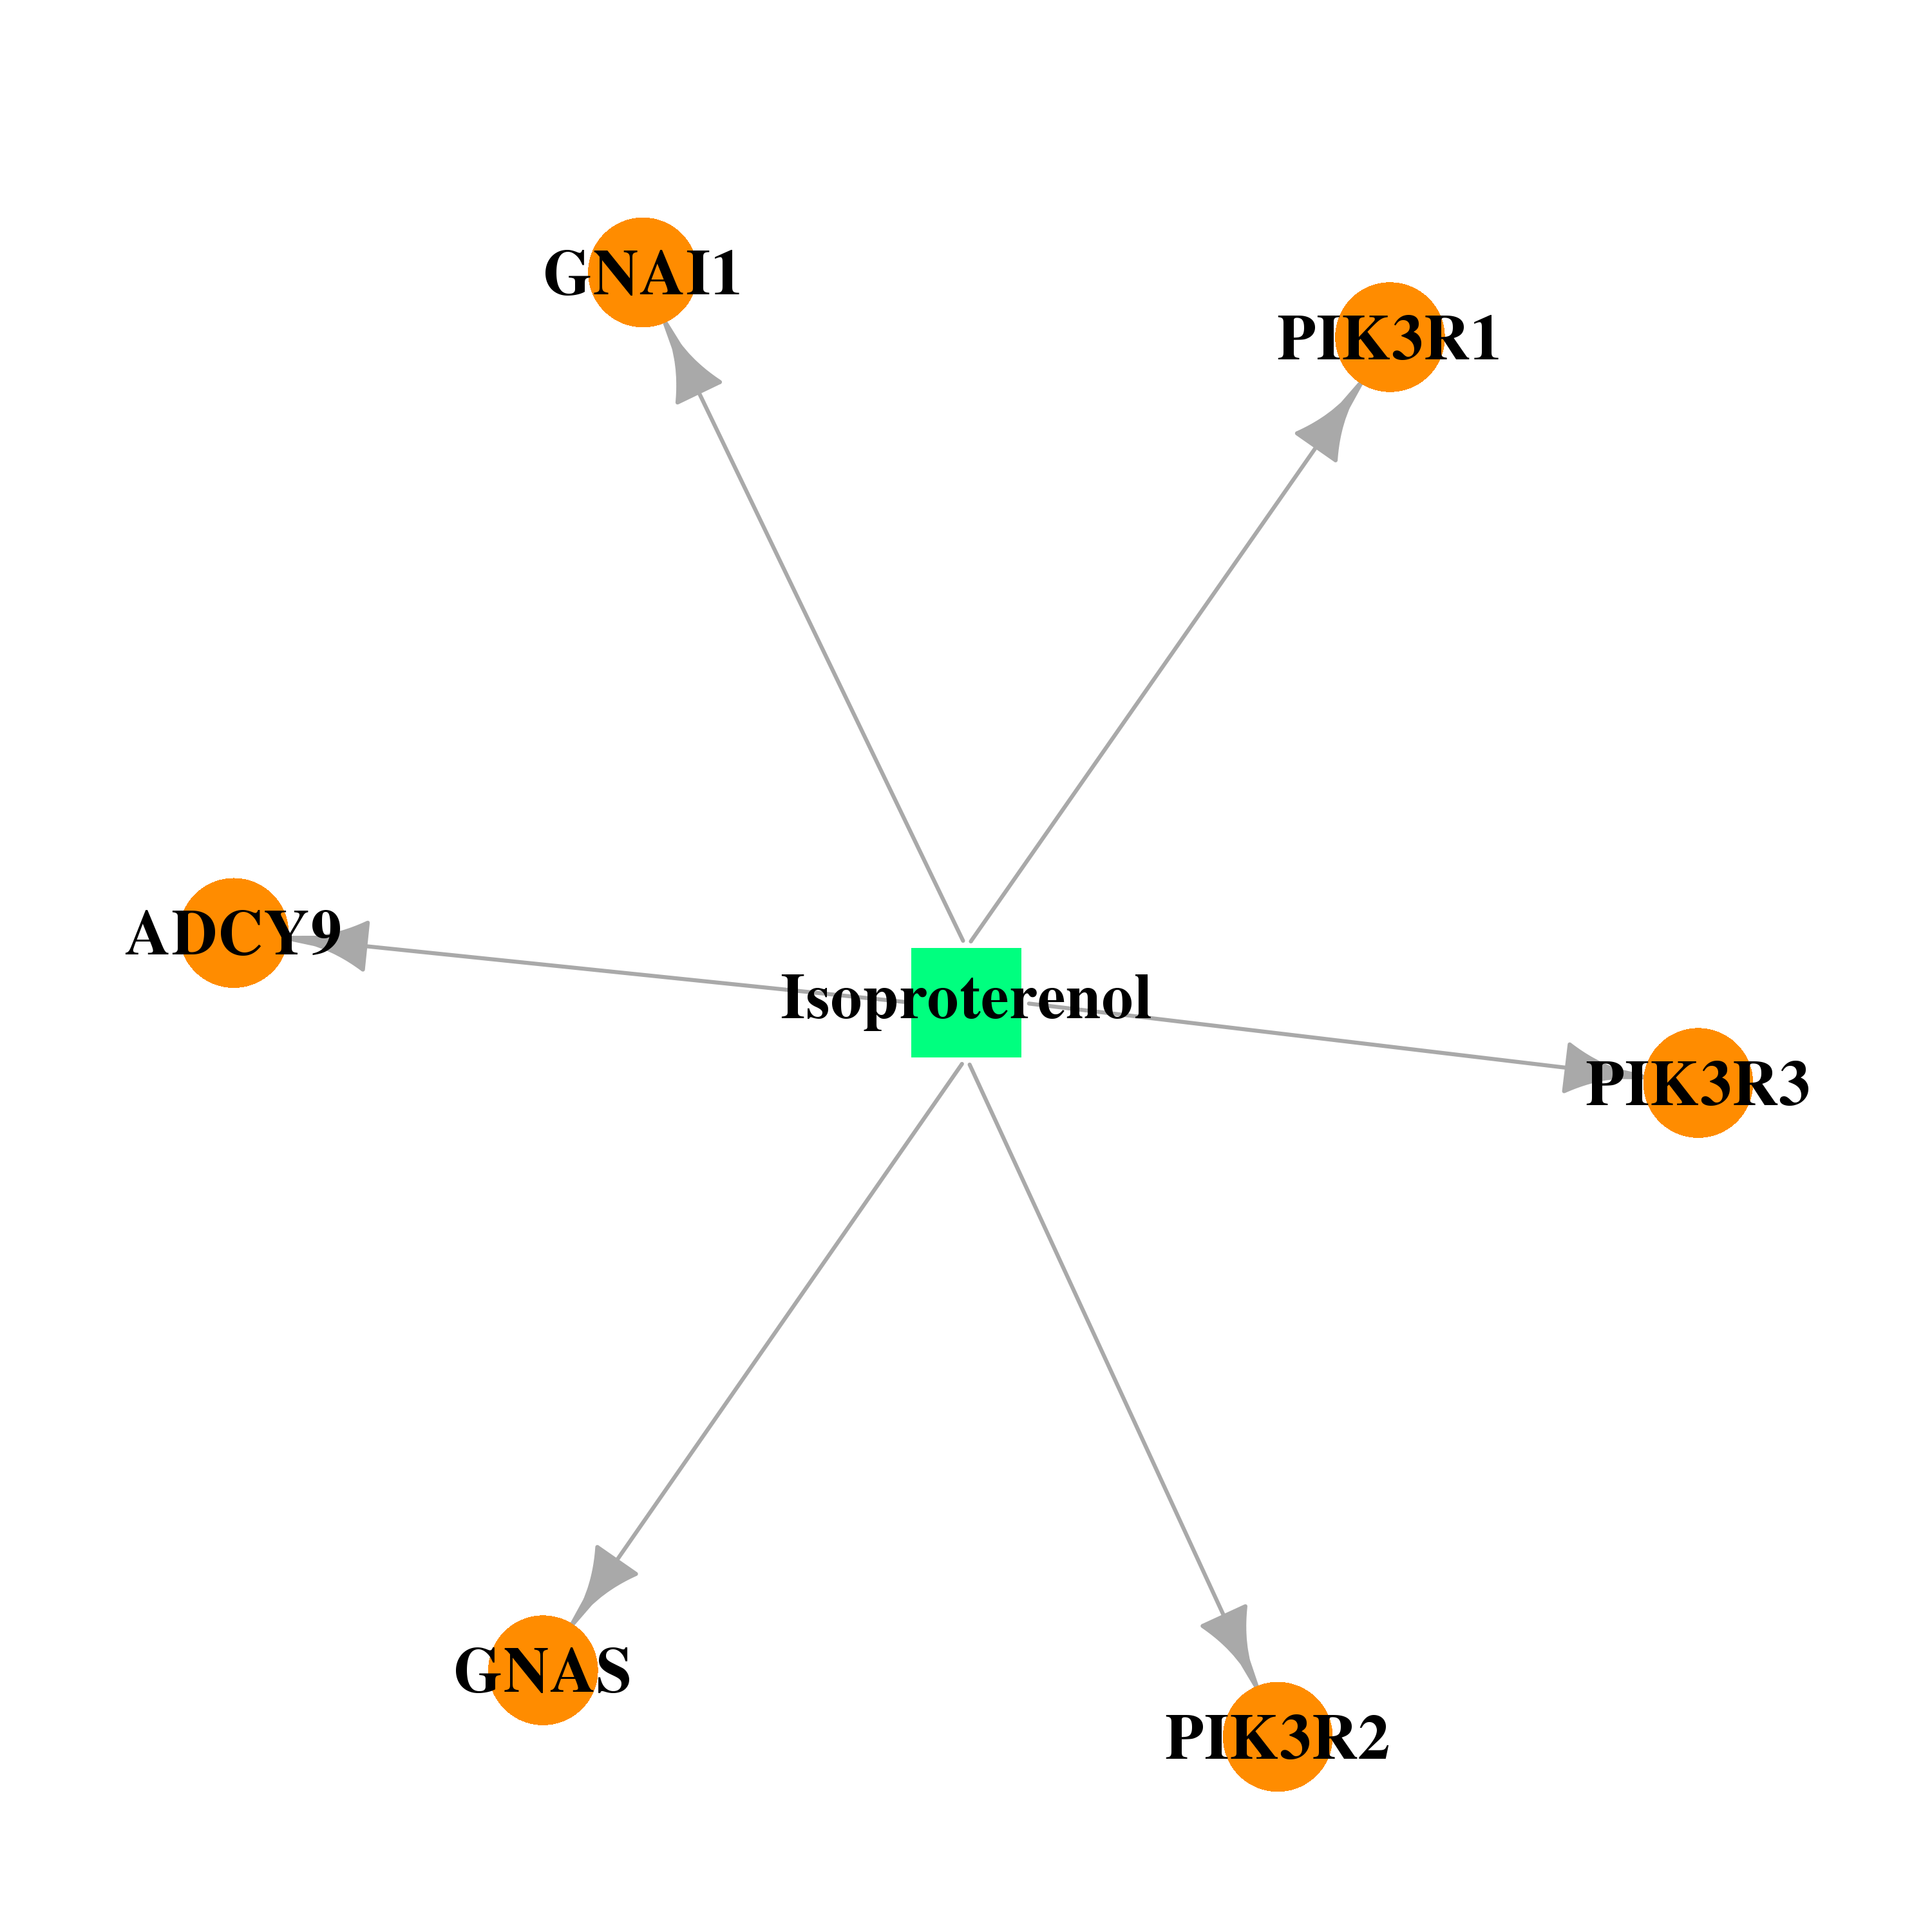 | 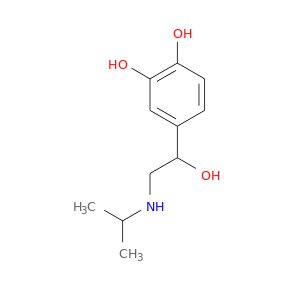 |
| Top |
| Cross referenced IDs for PIK3R3 |
| * We obtained these cross-references from Uniprot database. It covers 150 different DBs, 18 categories. http://www.uniprot.org/help/cross_references_section |
: Open all cross reference information
|
Copyright © 2016-Present - The Univsersity of Texas Health Science Center at Houston @ |