|
||||||||||||||||||||
| |
| Phenotypic Information (metabolism pathway, cancer, disease, phenome) |
| |
| |
| Gene-Gene Network Information: Co-Expression Network, Interacting Genes & KEGG |
| |
|


| Gene Summary for NDST2 |
| Basic gene info. | Gene symbol | NDST2 |
| Gene name | N-deacetylase/N-sulfotransferase (heparan glucosaminyl) 2 | |
| Synonyms | HSST2|NST2 | |
| Cytomap | UCSC genome browser: 10q22 | |
| Genomic location | chr10 :75561668-75571589 | |
| Type of gene | protein-coding | |
| RefGenes | NM_003635.3, | |
| Ensembl id | ENSG00000166507 | |
| Description | N-HSST 2N-heparan sulfate sulfotransferase 2NDST-2bifunctional heparan sulfate N-deacetylase/N-sulfotransferase 2glucosaminyl N-deacetylase/N-sulfotransferase 2 | |
| Modification date | 20141207 | |
| dbXrefs | MIM : 603268 | |
| HGNC : HGNC | ||
| Ensembl : ENSG00000166507 | ||
| HPRD : 04465 | ||
| Vega : OTTHUMG00000018489 | ||
| Protein | UniProt: go to UniProt's Cross Reference DB Table | |
| Expression | CleanEX: HS_NDST2 | |
| BioGPS: 8509 | ||
| Gene Expression Atlas: ENSG00000166507 | ||
| The Human Protein Atlas: ENSG00000166507 | ||
| Pathway | NCI Pathway Interaction Database: NDST2 | |
| KEGG: NDST2 | ||
| REACTOME: NDST2 | ||
| ConsensusPathDB | ||
| Pathway Commons: NDST2 | ||
| Metabolism | MetaCyc: NDST2 | |
| HUMANCyc: NDST2 | ||
| Regulation | Ensembl's Regulation: ENSG00000166507 | |
| miRBase: chr10 :75,561,668-75,571,589 | ||
| TargetScan: NM_003635 | ||
| cisRED: ENSG00000166507 | ||
| Context | iHOP: NDST2 | |
| cancer metabolism search in PubMed: NDST2 | ||
| UCL Cancer Institute: NDST2 | ||
| Assigned class in ccmGDB | C | |
| Top |
| Phenotypic Information for NDST2(metabolism pathway, cancer, disease, phenome) |
| Cancer | CGAP: NDST2 |
| Familial Cancer Database: NDST2 | |
| * This gene is included in those cancer gene databases. |
|
|
|
|
|
|
| ||||||||||||||
Oncogene 1 | Significant driver gene in | |||||||||||||||||||
| cf) number; DB name 1 Oncogene; http://nar.oxfordjournals.org/content/35/suppl_1/D721.long, 2 Tumor Suppressor gene; https://bioinfo.uth.edu/TSGene/, 3 Cancer Gene Census; http://www.nature.com/nrc/journal/v4/n3/abs/nrc1299.html, 4 CancerGenes; http://nar.oxfordjournals.org/content/35/suppl_1/D721.long, 5 Network of Cancer Gene; http://ncg.kcl.ac.uk/index.php, 1Therapeutic Vulnerabilities in Cancer; http://cbio.mskcc.org/cancergenomics/statius/ |
| REACTOME_METABOLISM_OF_CARBOHYDRATES | |
| OMIM | |
| Orphanet | |
| Disease | KEGG Disease: NDST2 |
| MedGen: NDST2 (Human Medical Genetics with Condition) | |
| ClinVar: NDST2 | |
| Phenotype | MGI: NDST2 (International Mouse Phenotyping Consortium) |
| PhenomicDB: NDST2 | |
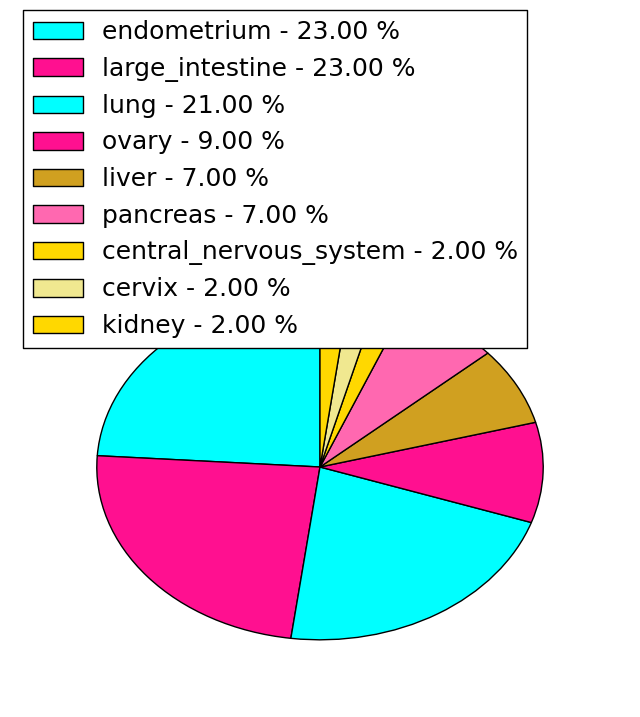
| Mutations for NDST2 |
| * Under tables are showing count per each tissue to give us broad intuition about tissue specific mutation patterns.You can go to the detailed page for each mutation database's web site. |
| - Statistics for Tissue and Mutation type | Top |
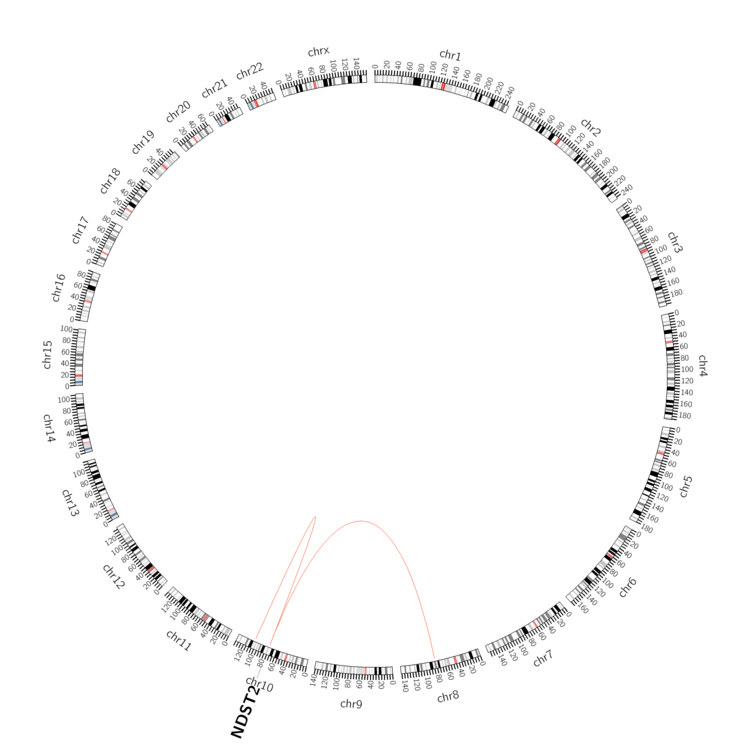 |
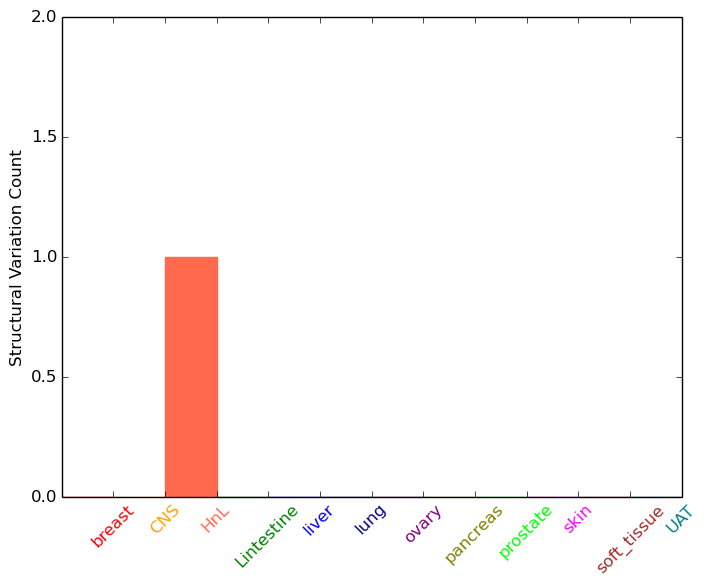
| - For Inter-chromosomal Variations |
| * Inter-chromosomal variantions includes 'interchromosomal amplicon to amplicon', 'interchromosomal amplicon to non-amplified dna', 'interchromosomal insertion', 'Interchromosomal unknown type'. |
 |
| - For Intra-chromosomal Variations |
| * Intra-chromosomal variantions includes 'intrachromosomal amplicon to amplicon', 'intrachromosomal amplicon to non-amplified dna', 'intrachromosomal deletion', 'intrachromosomal fold-back inversion', 'intrachromosomal inversion', 'intrachromosomal tandem duplication', 'Intrachromosomal unknown type', 'intrachromosomal with inverted orientation', 'intrachromosomal with non-inverted orientation'. |
 |
| Sample | Symbol_a | Chr_a | Start_a | End_a | Symbol_b | Chr_b | Start_b | End_b |
| haematopoietic_and_lymphoid_tissue | NDST2 | chr10 | 75565742 | 75565742 | chr8 | 82145656 | 82145656 | |
| haematopoietic_and_lymphoid_tissue | NDST2 | chr10 | 75565762 | 75565762 | chr10 | 104145320 | 104145320 |
| cf) Tissue number; Tissue name (1;Breast, 2;Central_nervous_system, 3;Haematopoietic_and_lymphoid_tissue, 4;Large_intestine, 5;Liver, 6;Lung, 7;Ovary, 8;Pancreas, 9;Prostate, 10;Skin, 11;Soft_tissue, 12;Upper_aerodigestive_tract) |
| * From mRNA Sanger sequences, Chitars2.0 arranged chimeric transcripts. This table shows NDST2 related fusion information. |
| ID | Head Gene | Tail Gene | Accession | Gene_a | qStart_a | qEnd_a | Chromosome_a | tStart_a | tEnd_a | Gene_a | qStart_a | qEnd_a | Chromosome_a | tStart_a | tEnd_a |
| T05579 | NDST2 | 1 | 91 | 10 | 75561883 | 75561973 | STAT3 | 92 | 344 | 17 | 40489788 | 40491411 | |
| Top |
| There's no copy number variation information in COSMIC data for this gene. |
| Top |
|
 |
| Top |
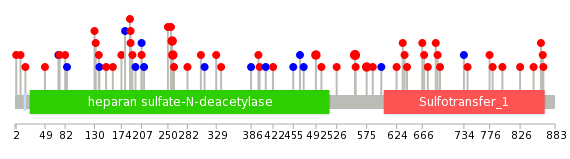
| Stat. for Non-Synonymous SNVs (# total SNVs=42) | (# total SNVs=10) |
 |  |
(# total SNVs=1) | (# total SNVs=1) |
 |  |
| Top |
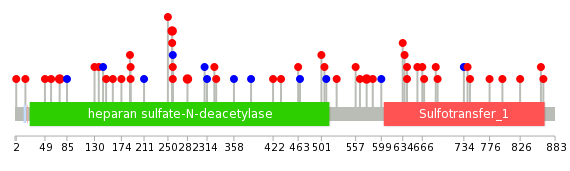
| * When you move the cursor on each content, you can see more deailed mutation information on the Tooltip. Those are primary_site,primary_histology,mutation(aa),pubmedID. |
| GRCh37 position | Mutation(aa) | Unique sampleID count |
| chr10:75565424-75565424 | p.R556H | 3 |
| chr10:75567375-75567375 | p.R258C | 2 |
| chr10:75565368-75565368 | p.Q575E | 2 |
| chr10:75567378-75567378 | p.L257I | 2 |
| chr10:75565745-75565745 | p.I492M | 2 |
| chr10:75567237-75567237 | p.R304C | 1 |
| chr10:75568143-75568143 | p.L2I | 1 |
| chr10:75563390-75563390 | p.R695Q | 1 |
| chr10:75564577-75564577 | p.T599T | 1 |
| chr10:75567572-75567572 | p.H192P | 1 |
| Top |
|
 |
| Point Mutation/ Tissue ID | 1 | 2 | 3 | 4 | 5 | 6 | 7 | 8 | 9 | 10 | 11 | 12 | 13 | 14 | 15 | 16 | 17 | 18 | 19 | 20 |
| # sample | 2 | 2 | 9 | 3 | 2 | 10 | 3 | 4 | 1 | 4 | 7 | 1 | 9 | |||||||
| # mutation | 2 | 2 | 7 | 3 | 2 | 11 | 3 | 4 | 1 | 4 | 7 | 1 | 11 | |||||||
| nonsynonymous SNV | 1 | 1 | 6 | 2 | 2 | 9 | 2 | 4 | 1 | 2 | 5 | 1 | 10 | |||||||
| synonymous SNV | 1 | 1 | 1 | 1 | 2 | 1 | 2 | 2 | 1 |
| cf) Tissue ID; Tissue type (1; BLCA[Bladder Urothelial Carcinoma], 2; BRCA[Breast invasive carcinoma], 3; CESC[Cervical squamous cell carcinoma and endocervical adenocarcinoma], 4; COAD[Colon adenocarcinoma], 5; GBM[Glioblastoma multiforme], 6; Glioma Low Grade, 7; HNSC[Head and Neck squamous cell carcinoma], 8; KICH[Kidney Chromophobe], 9; KIRC[Kidney renal clear cell carcinoma], 10; KIRP[Kidney renal papillary cell carcinoma], 11; LAML[Acute Myeloid Leukemia], 12; LUAD[Lung adenocarcinoma], 13; LUSC[Lung squamous cell carcinoma], 14; OV[Ovarian serous cystadenocarcinoma ], 15; PAAD[Pancreatic adenocarcinoma], 16; PRAD[Prostate adenocarcinoma], 17; SKCM[Skin Cutaneous Melanoma], 18:STAD[Stomach adenocarcinoma], 19:THCA[Thyroid carcinoma], 20:UCEC[Uterine Corpus Endometrial Carcinoma]) |
| Top |
| * We represented just top 10 SNVs. When you move the cursor on each content, you can see more deailed mutation information on the Tooltip. Those are primary_site, primary_histology, mutation(aa), pubmedID. |
| Genomic Position | Mutation(aa) | Unique sampleID count |
| chr10:75567378 | p.L257I | 3 |
| chr10:75567302 | p.Q575E | 2 |
| chr10:75565368 | p.H282R | 2 |
| chr10:75567929 | p.R73Q | 2 |
| chr10:75567582 | p.E641D | 1 |
| chr10:75563500 | p.T422M | 1 |
| chr10:75565696 | p.P188S | 1 |
| chr10:75568002 | p.E641G | 1 |
| chr10:75567205 | p.F386F | 1 |
| chr10:75562482 | p.A174S | 1 |
| * Copy number data were extracted from TCGA using R package TCGA-Assembler. The URLs of all public data files on TCGA DCC data server were gathered on Jan-05-2015. Function ProcessCNAData in TCGA-Assembler package was used to obtain gene-level copy number value which is calculated as the average copy number of the genomic region of a gene. |
 |
| cf) Tissue ID[Tissue type]: BLCA[Bladder Urothelial Carcinoma], BRCA[Breast invasive carcinoma], CESC[Cervical squamous cell carcinoma and endocervical adenocarcinoma], COAD[Colon adenocarcinoma], GBM[Glioblastoma multiforme], Glioma Low Grade, HNSC[Head and Neck squamous cell carcinoma], KICH[Kidney Chromophobe], KIRC[Kidney renal clear cell carcinoma], KIRP[Kidney renal papillary cell carcinoma], LAML[Acute Myeloid Leukemia], LUAD[Lung adenocarcinoma], LUSC[Lung squamous cell carcinoma], OV[Ovarian serous cystadenocarcinoma ], PAAD[Pancreatic adenocarcinoma], PRAD[Prostate adenocarcinoma], SKCM[Skin Cutaneous Melanoma], STAD[Stomach adenocarcinoma], THCA[Thyroid carcinoma], UCEC[Uterine Corpus Endometrial Carcinoma] |
| Top |
| Gene Expression for NDST2 |
| * CCLE gene expression data were extracted from CCLE_Expression_Entrez_2012-10-18.res: Gene-centric RMA-normalized mRNA expression data. |
 |
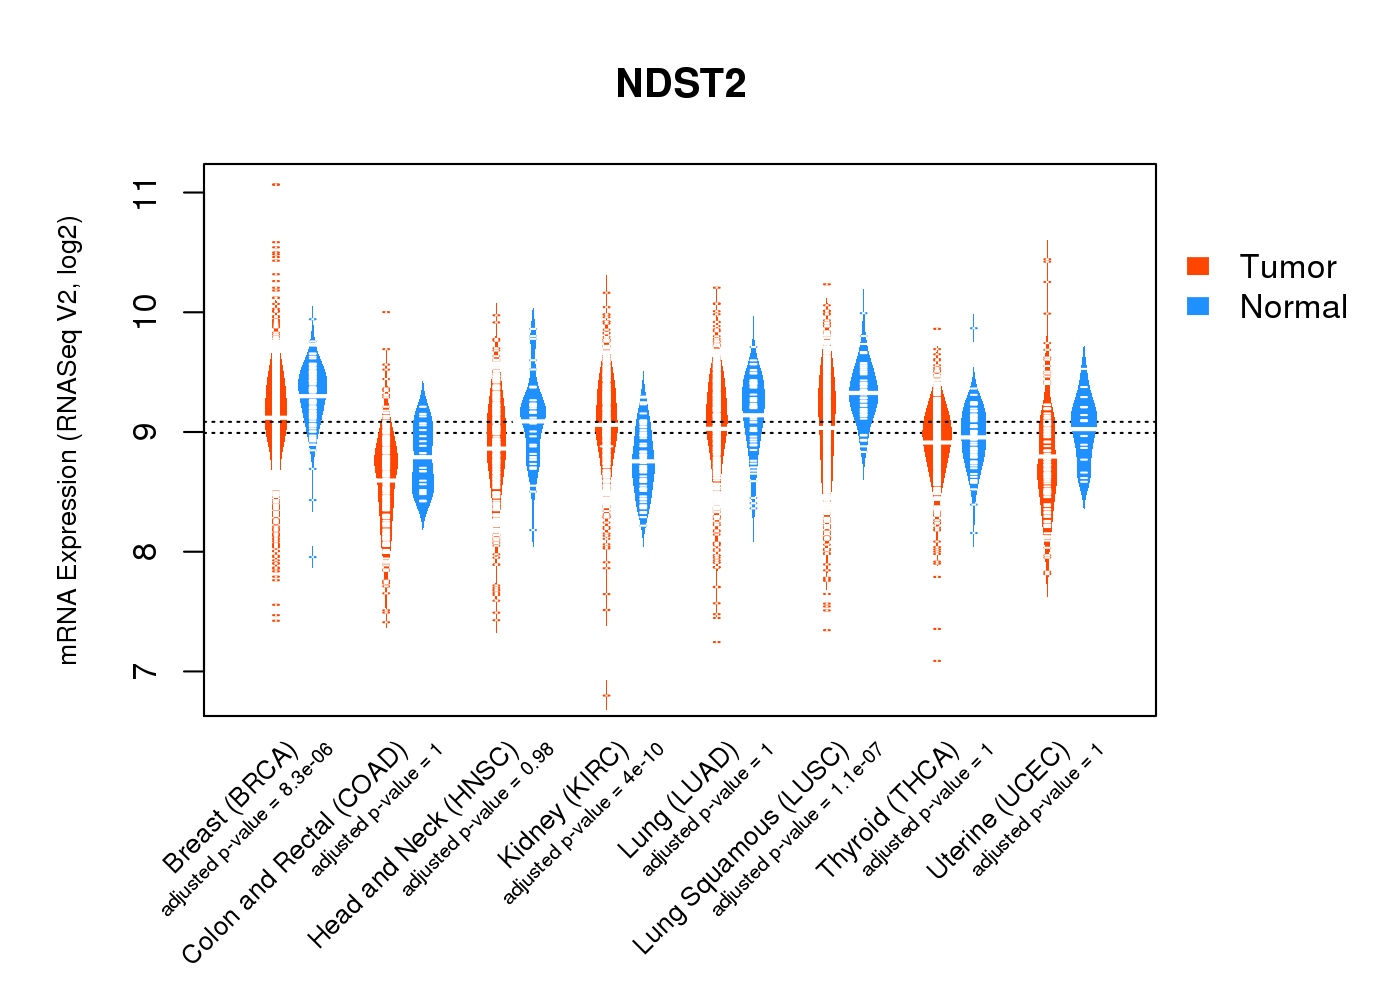
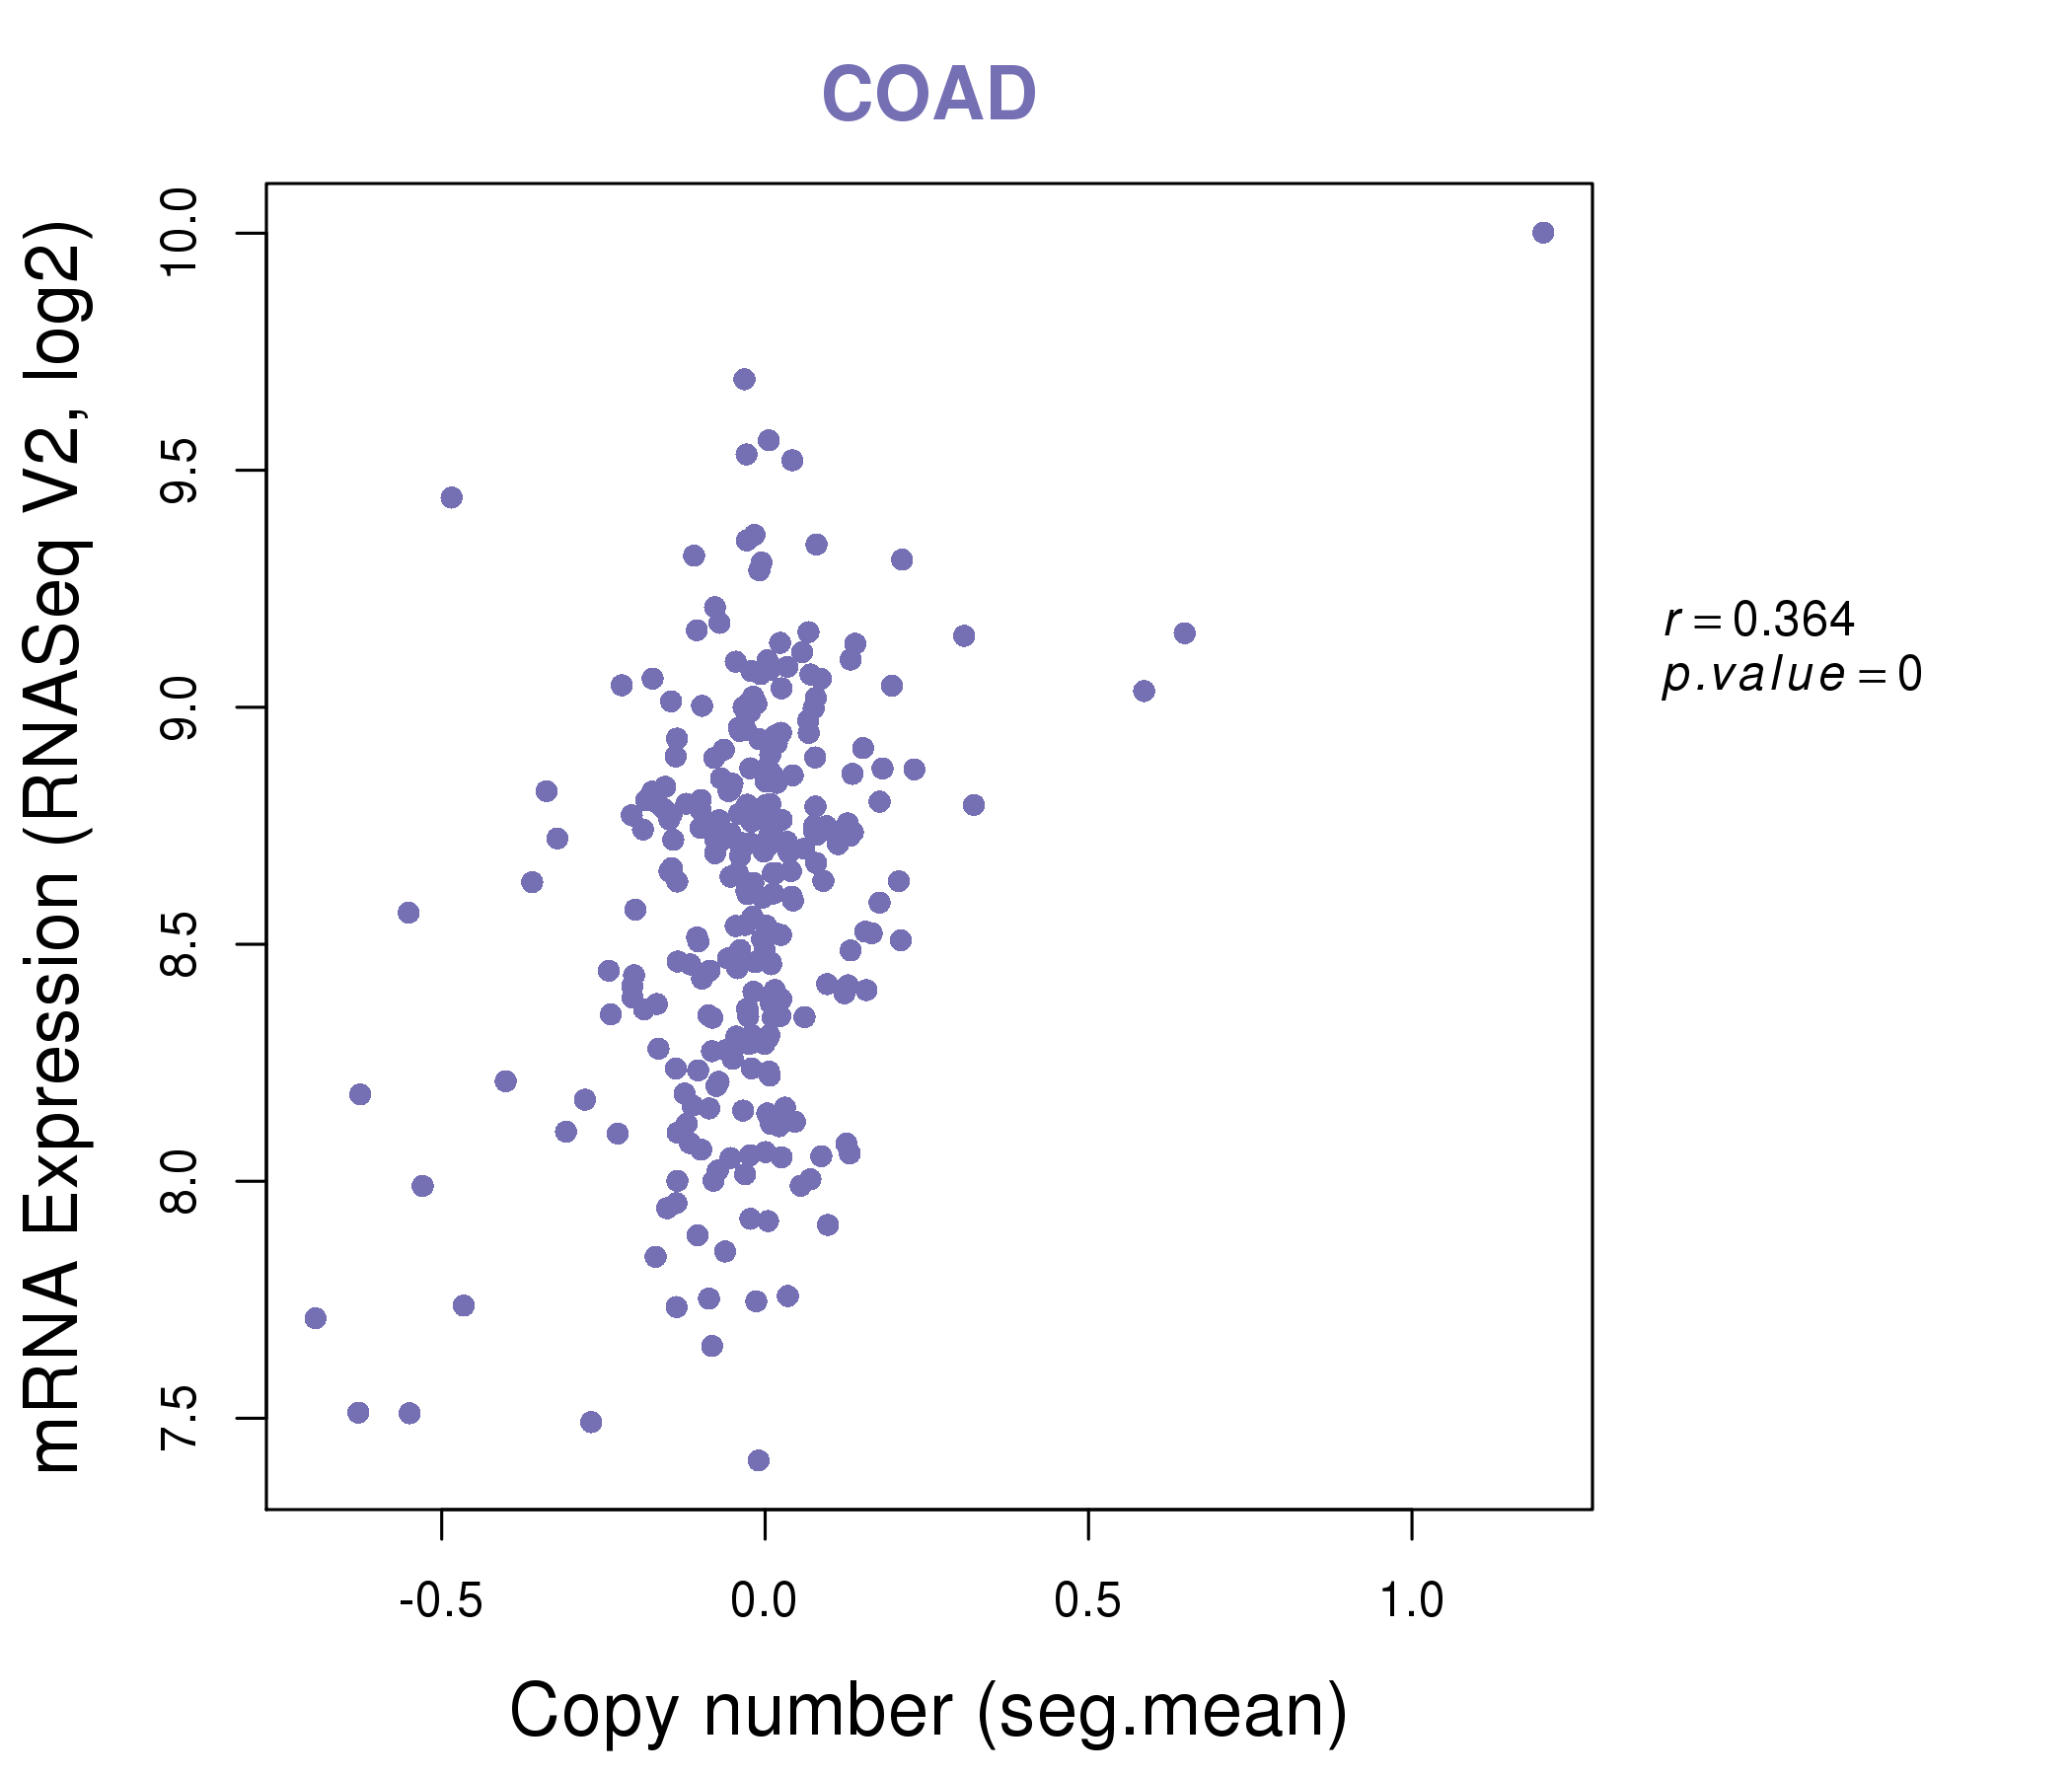
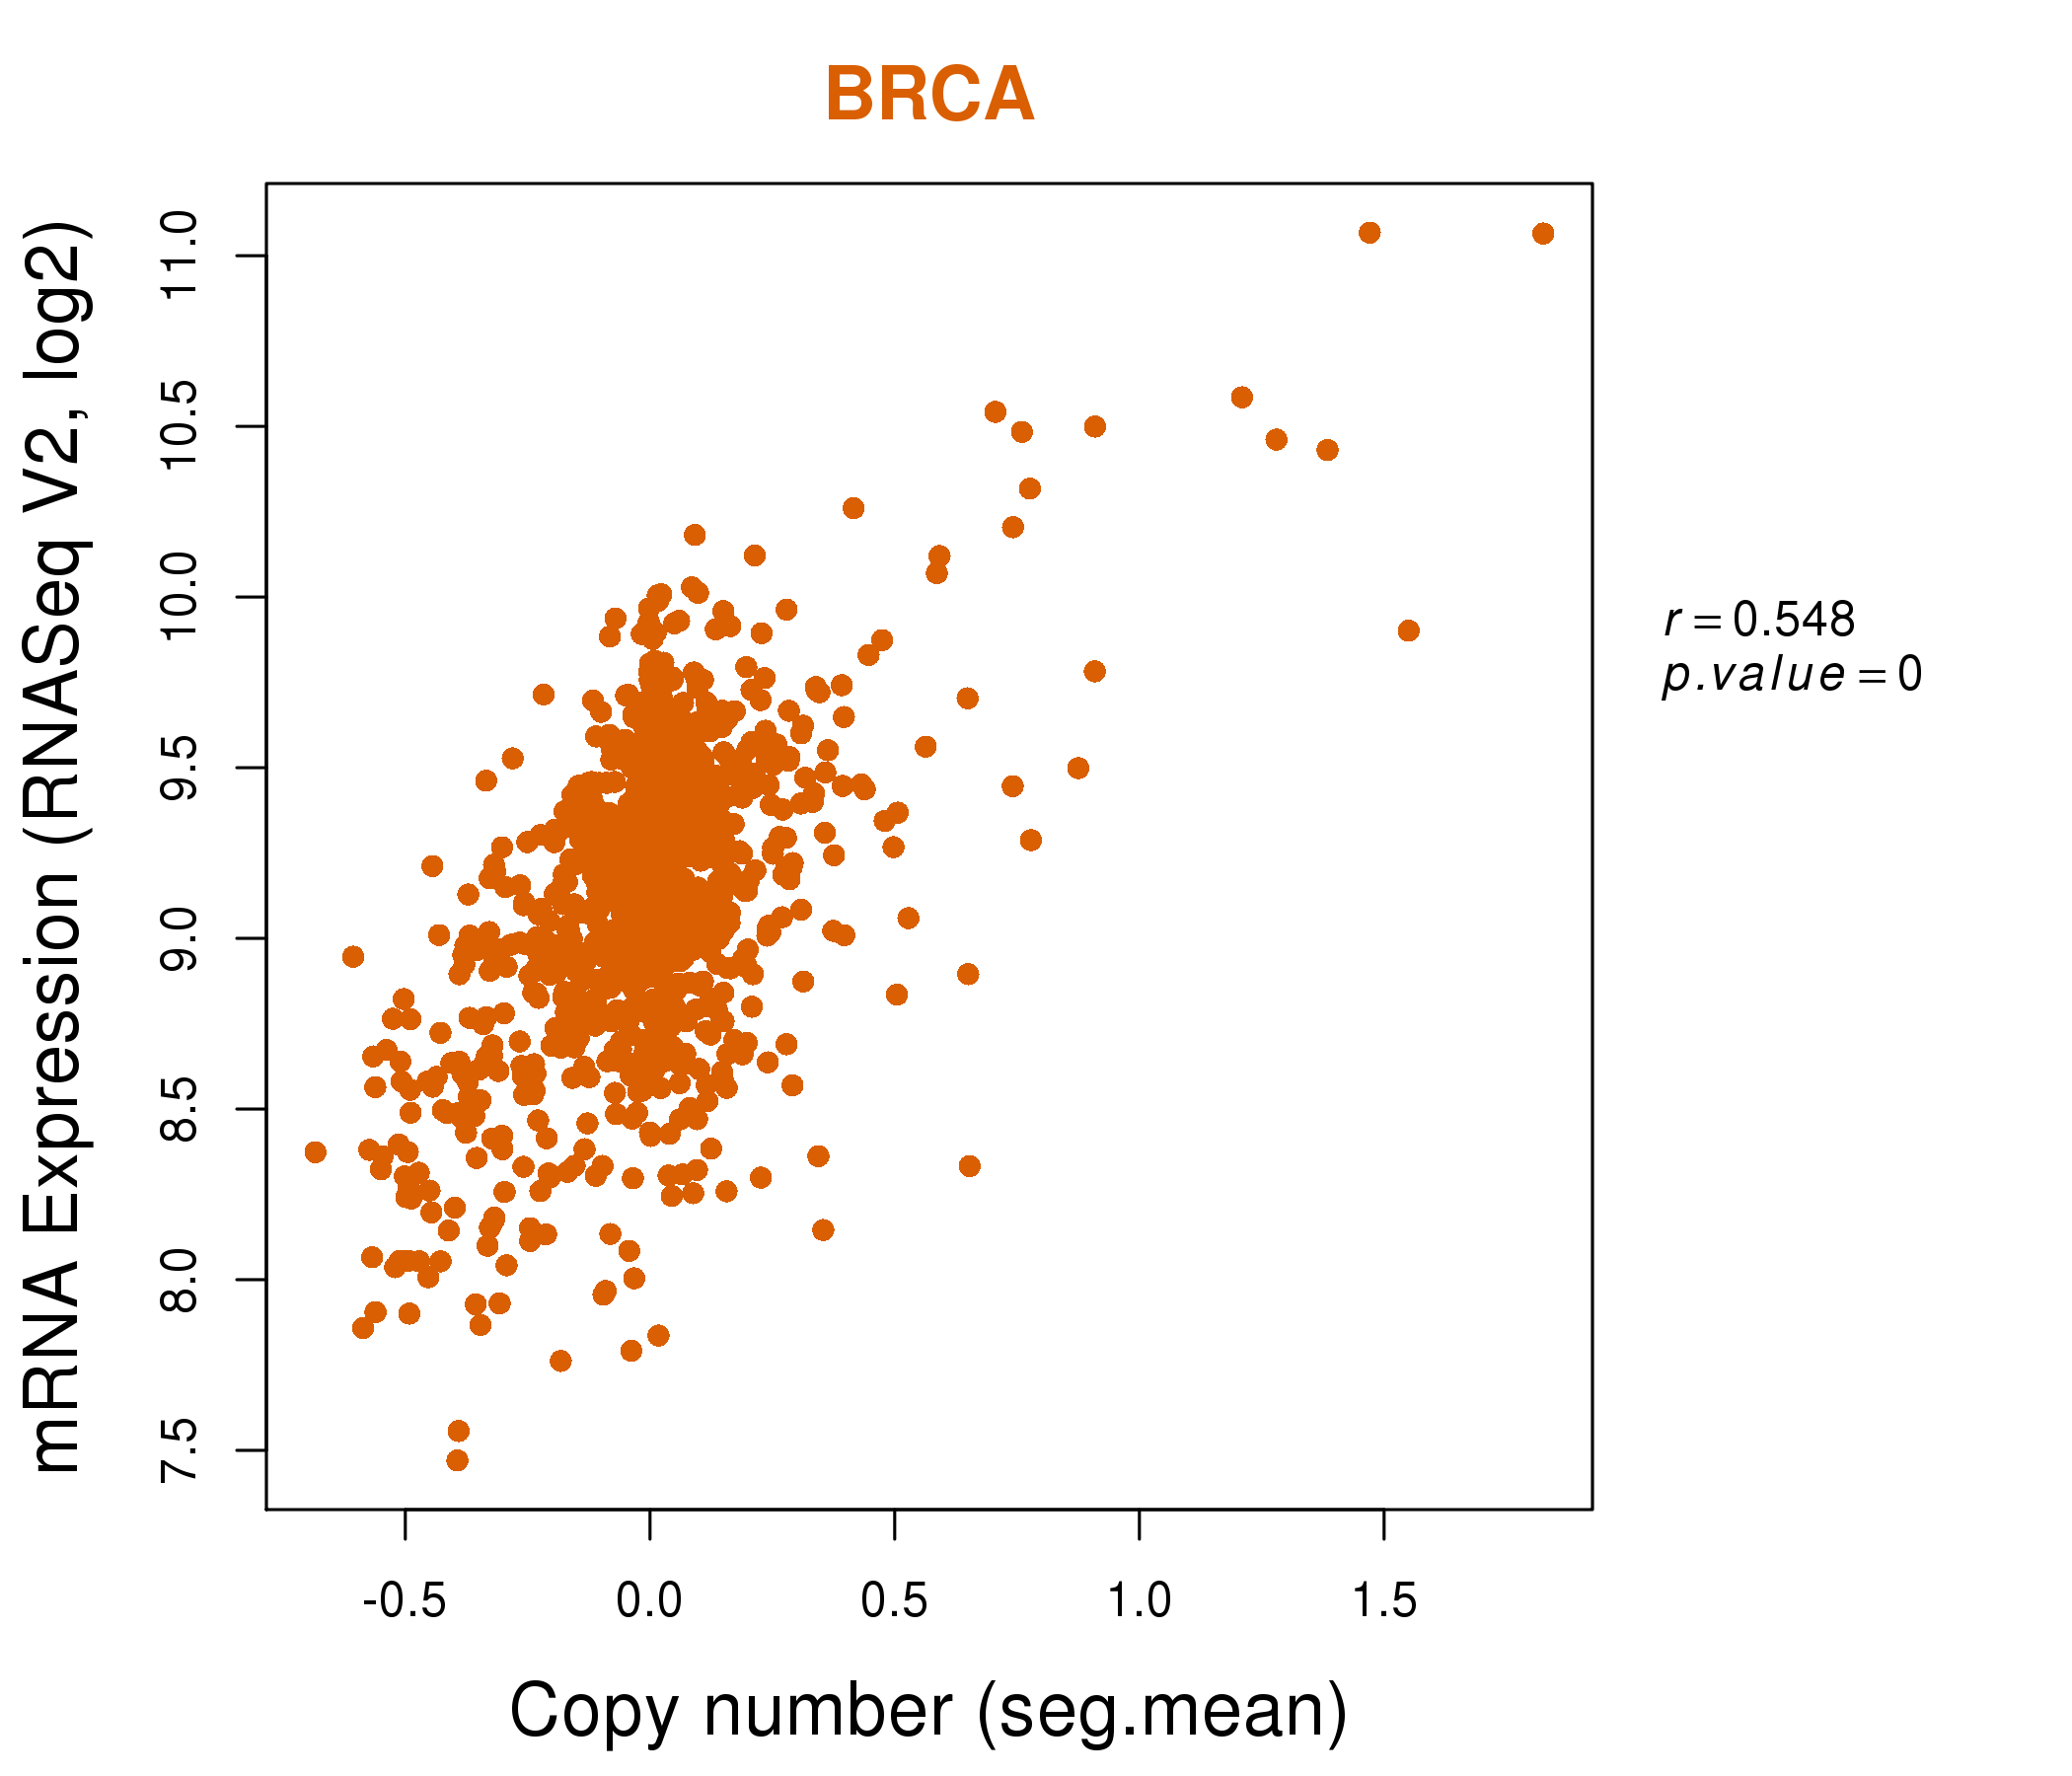
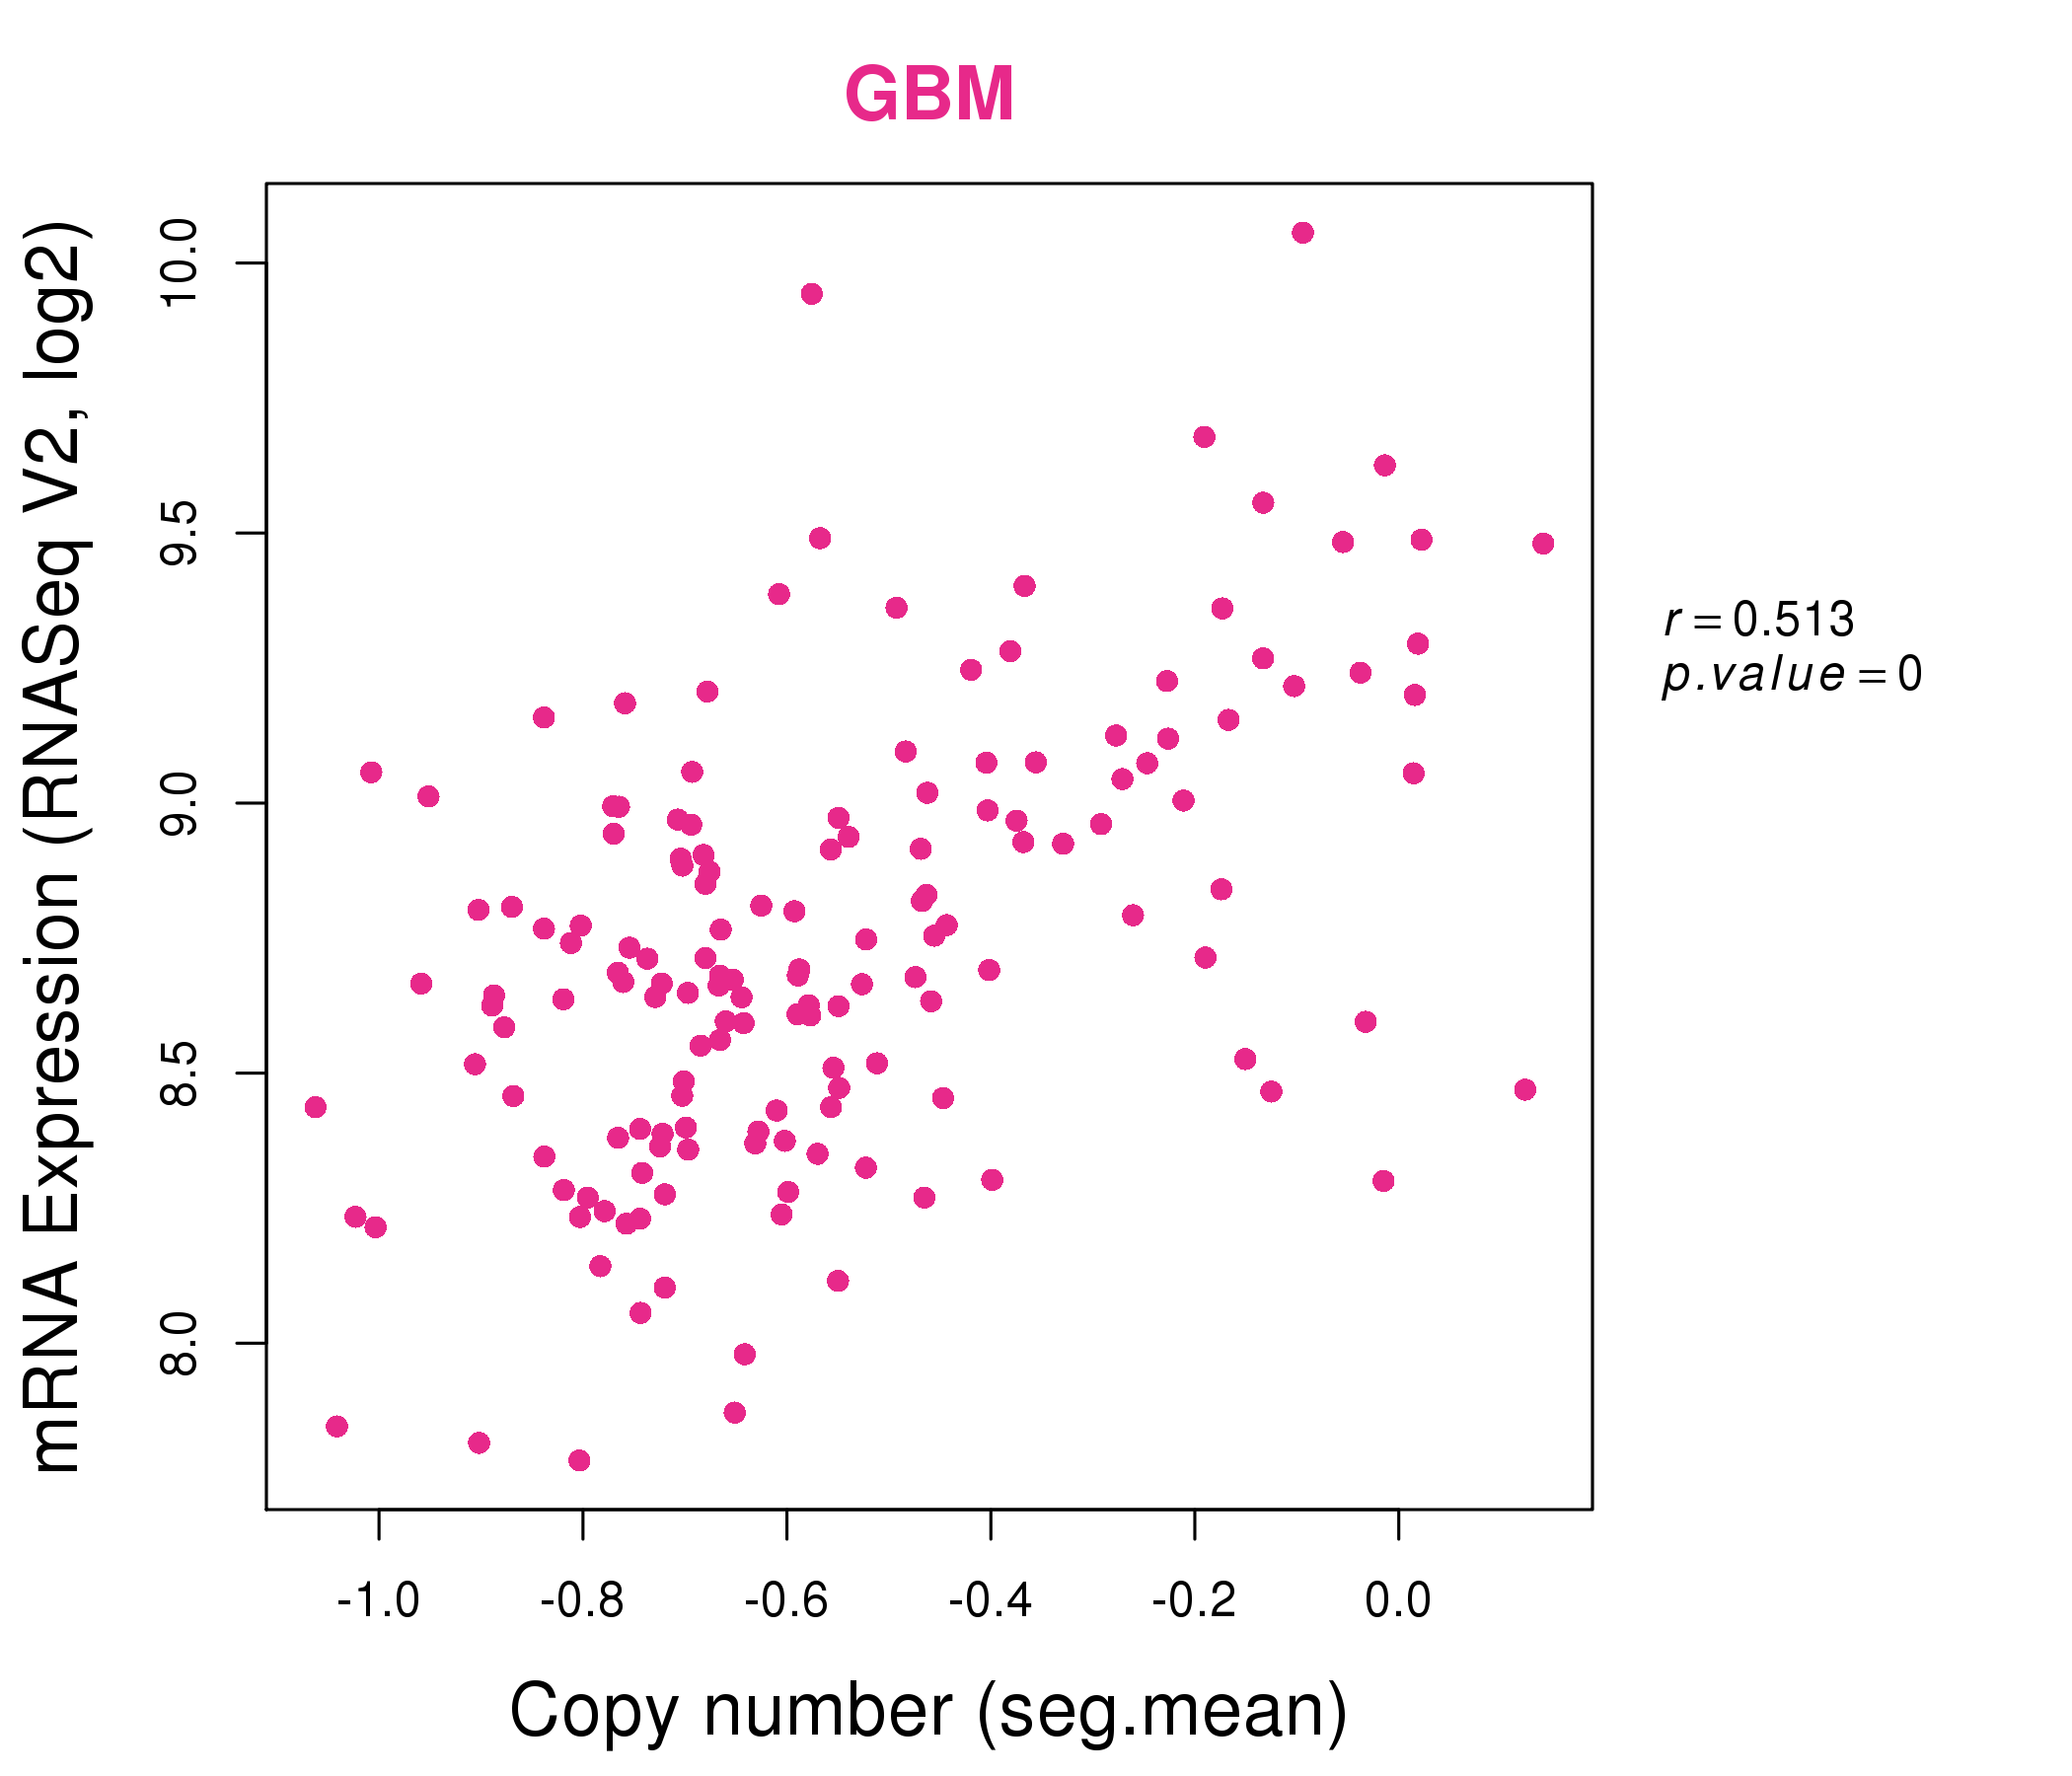
| * Normalized gene expression data of RNASeqV2 was extracted from TCGA using R package TCGA-Assembler. The URLs of all public data files on TCGA DCC data server were gathered at Jan-05-2015. Only eight cancer types have enough normal control samples for differential expression analysis. (t test, adjusted p<0.05 (using Benjamini-Hochberg FDR)) |
 |
| Top |
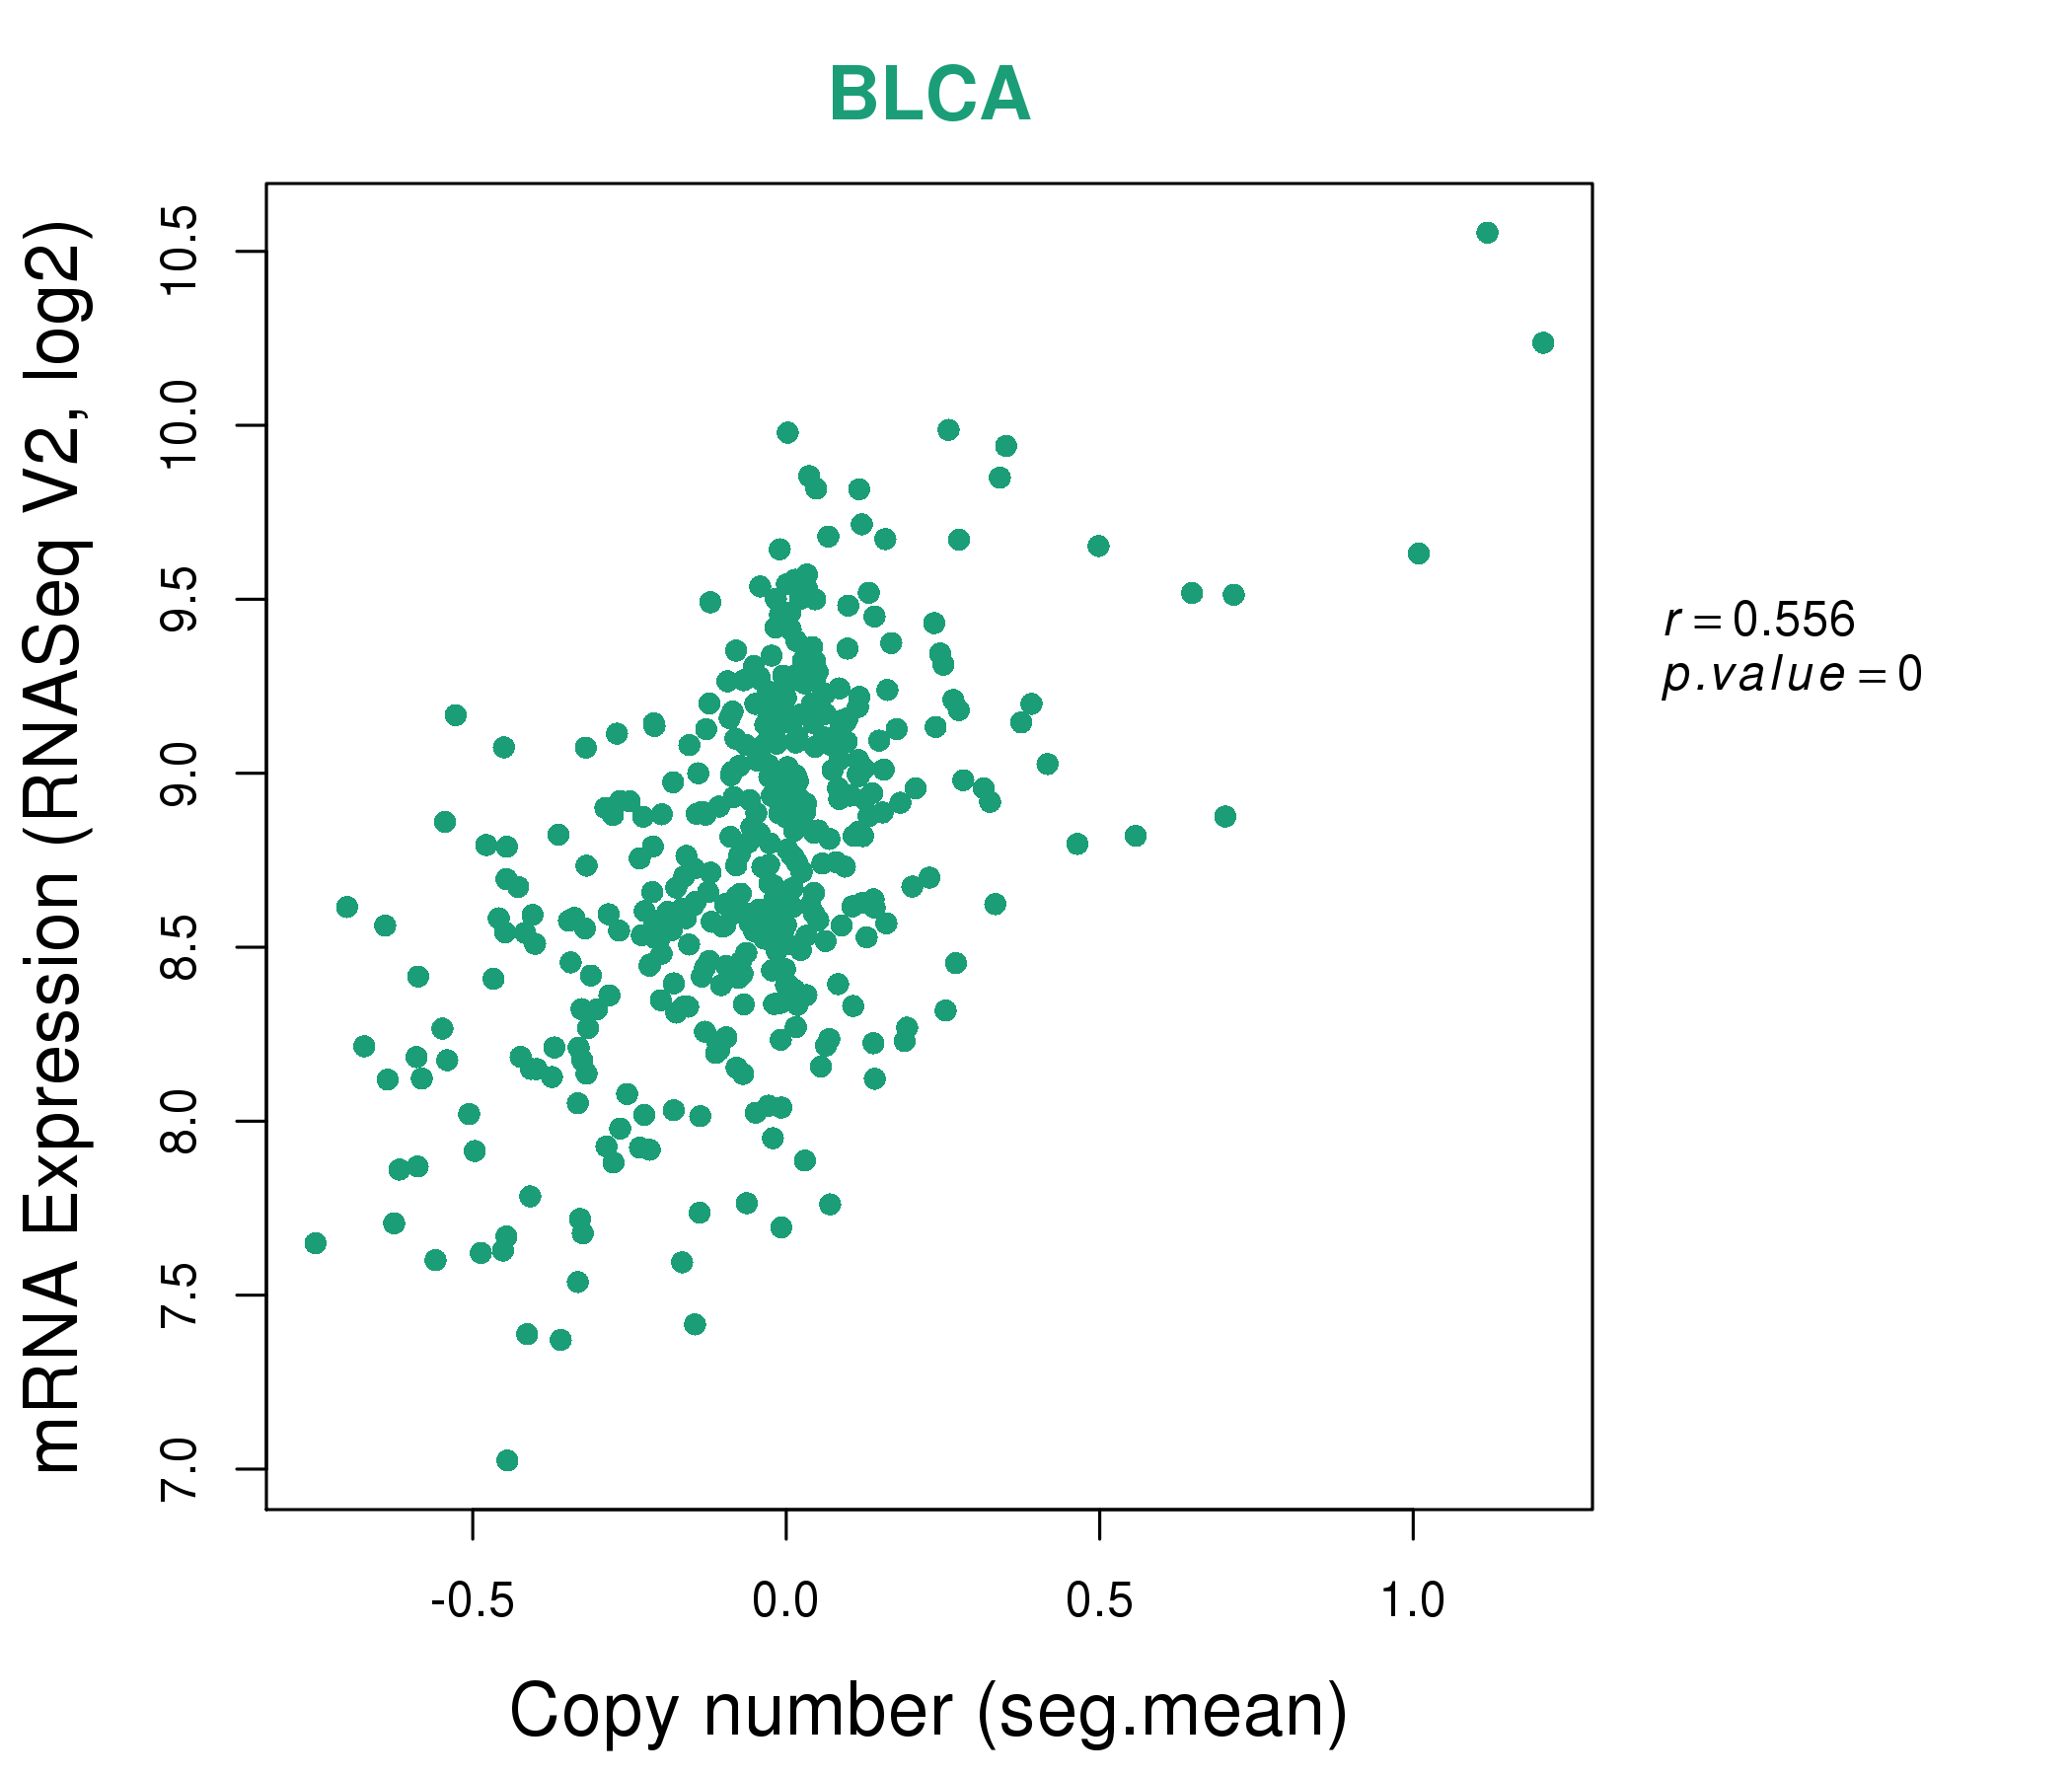
| * This plots show the correlation between CNV and gene expression. |
: Open all plots for all cancer types
 |
|
 |
|
| Top |
| Gene-Gene Network Information |
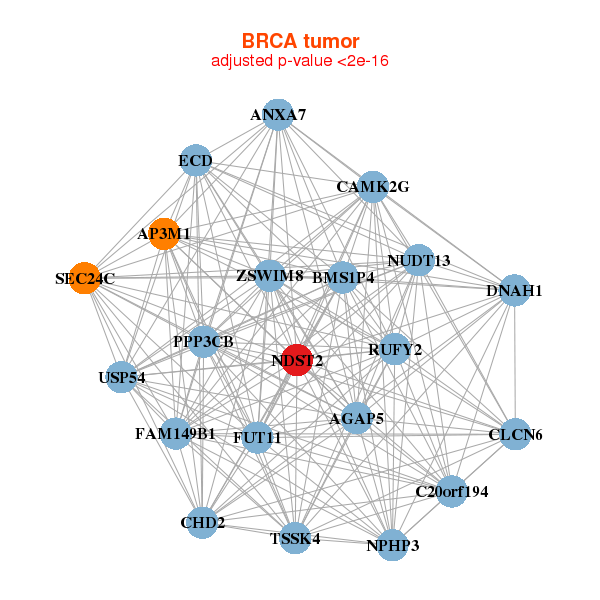
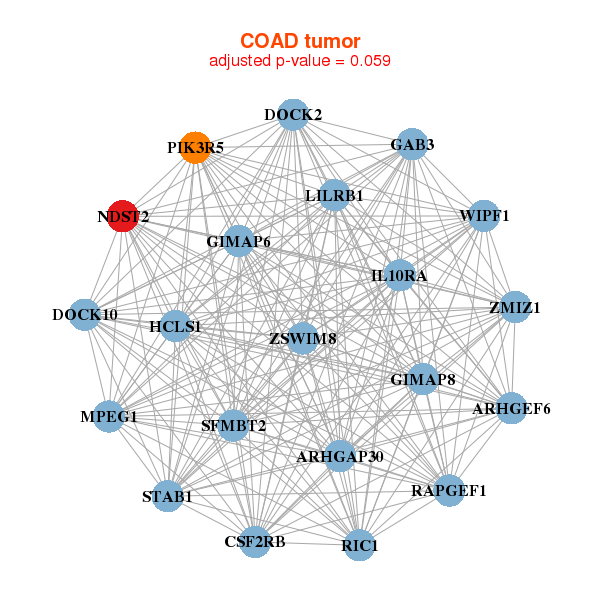
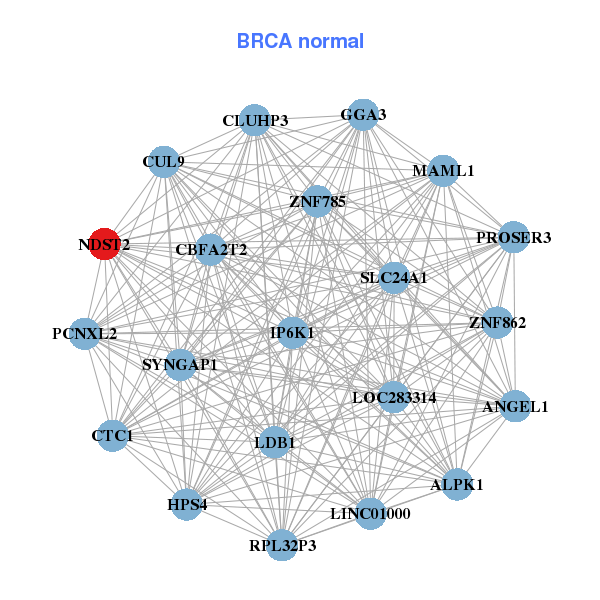
| * Co-Expression network figures were drawn using R package igraph. Only the top 20 genes with the highest correlations were shown. Red circle: input gene, orange circle: cell metabolism gene, sky circle: other gene |
: Open all plots for all cancer types
 |
|
| AGAP5,ANXA7,AP3M1,BMS1P4,C20orf194,CAMK2G,CHD2, CLCN6,DNAH1,ECD,FAM149B1,FUT11,ZSWIM8,NDST2, NPHP3,NUDT13,PPP3CB,RUFY2,SEC24C,TSSK4,USP54 | ALPK1,ANGEL1,CTC1,PROSER3,CBFA2T2,CUL9,LINC01000, GGA3,HPS4,IP6K1,CLUHP3,LDB1,LOC283314,MAML1, NDST2,PCNXL2,RPL32P3,SLC24A1,SYNGAP1,ZNF785,ZNF862 |
 |
|
| ARHGAP30,ARHGEF6,CSF2RB,DOCK10,DOCK2,GAB3,GIMAP6, GIMAP8,HCLS1,IL10RA,ZSWIM8,RIC1,LILRB1,MPEG1, NDST2,PIK3R5,RAPGEF1,SFMBT2,STAB1,WIPF1,ZMIZ1 | ADCY7,ADORA2A,ANKZF1,CBFA2T3,CBX4,CD4,CYTH4, FHOD1,GAB3,HPS4,IL10RA,NAIP,NDST2,PIK3R6, PLCB2,PLXNC1,RIMBP3,SETDB1,SIGLEC6,TBC1D2B,TUT1 |
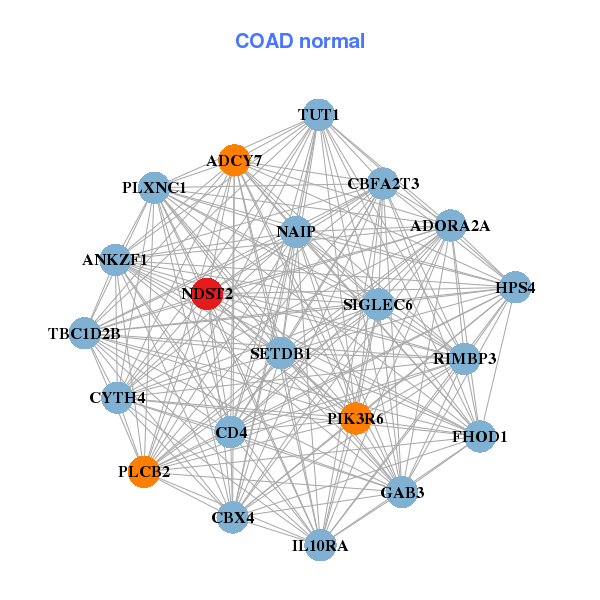
| * Co-Expression network figures were drawn using R package igraph. Only the top 20 genes with the highest correlations were shown. Red circle: input gene, orange circle: cell metabolism gene, sky circle: other gene |
: Open all plots for all cancer types
| Top |
: Open all interacting genes' information including KEGG pathway for all interacting genes from DAVID
| Top |
| Pharmacological Information for NDST2 |
| There's no related Drug. |
| Top |
| Cross referenced IDs for NDST2 |
| * We obtained these cross-references from Uniprot database. It covers 150 different DBs, 18 categories. http://www.uniprot.org/help/cross_references_section |
: Open all cross reference information
|
Copyright © 2016-Present - The Univsersity of Texas Health Science Center at Houston @ |