|
||||||||||||||||||||||||||||||||||||||||||||||||||||||||||||||||||||||||||||||||||||||||||||||||||||||||||||||||||||||||||||||||||||||||||||||||||||||||||||||||||||||||||||||||||||||||||||||||||||||||||||||||||||||||||||||||||||||||||||||||||||||||||||||||||||||||||||||||||||||||||||||||||||||||||||||||||||||||||
| |
| Phenotypic Information (metabolism pathway, cancer, disease, phenome) |
| |
| |
| Gene-Gene Network Information: Co-Expression Network, Interacting Genes & KEGG |
| |
|


| Gene Summary for DGKE |
| Basic gene info. | Gene symbol | DGKE |
| Gene name | diacylglycerol kinase, epsilon 64kDa | |
| Synonyms | DAGK5|DAGK6|DGK|NPHS7 | |
| Cytomap | UCSC genome browser: 17q22 | |
| Genomic location | chr17 :54911459-54946036 | |
| Type of gene | protein-coding | |
| RefGenes | NM_003647.2, | |
| Ensembl id | ENSG00000153933 | |
| Description | DAG kinase epsilonDGK-epsilondiacylglycerol kinase epsilondiglyceride kinase epsilon | |
| Modification date | 20141219 | |
| dbXrefs | MIM : 601440 | |
| HGNC : HGNC | ||
| Ensembl : ENSG00000153933 | ||
| HPRD : 03259 | ||
| Vega : OTTHUMG00000178121 | ||
| Protein | UniProt: P52429 go to UniProt's Cross Reference DB Table | |
| Expression | CleanEX: HS_DGKE | |
| BioGPS: 8526 | ||
| Gene Expression Atlas: ENSG00000153933 | ||
| The Human Protein Atlas: ENSG00000153933 | ||
| Pathway | NCI Pathway Interaction Database: DGKE | |
| KEGG: DGKE | ||
| REACTOME: DGKE | ||
| ConsensusPathDB | ||
| Pathway Commons: DGKE | ||
| Metabolism | MetaCyc: DGKE | |
| HUMANCyc: DGKE | ||
| Regulation | Ensembl's Regulation: ENSG00000153933 | |
| miRBase: chr17 :54,911,459-54,946,036 | ||
| TargetScan: NM_003647 | ||
| cisRED: ENSG00000153933 | ||
| Context | iHOP: DGKE | |
| cancer metabolism search in PubMed: DGKE | ||
| UCL Cancer Institute: DGKE | ||
| Assigned class in ccmGDB | A - This gene has a literature evidence and it belongs to cancer gene. | |
| References showing role of DGKE in cancer cell metabolism | 1. Marquez J, Kohli M, Arteta B, Chang S, Li WB, et al. (2013) Identification of hepatic microvascular adhesion-related genes of human colon cancer cells using random homozygous gene perturbation. Int J Cancer 133: 2113-2122. doi: 10.1002/ijc.28232. go to article | |
| Top |
| Phenotypic Information for DGKE(metabolism pathway, cancer, disease, phenome) |
| Cancer | CGAP: DGKE |
| Familial Cancer Database: DGKE | |
| * This gene is included in those cancer gene databases. |
|
|
|
|
|
| . | ||||||||||||||||||||||||||||||||||||||||||||||||||||||||||||||||||||||||||||||||||||||||||||||||||||||||||||||||||||||||||||||||||||||||||||||||||||||||||||||||||||||||||||||||||||||||||||||||||||||||||||||||||||||||||||||||||||||||||||||||||||||||||||||||||||||||||||||||||||||||||||||||||||||||||||||||||||
Oncogene 1 | Significant driver gene in | |||||||||||||||||||||||||||||||||||||||||||||||||||||||||||||||||||||||||||||||||||||||||||||||||||||||||||||||||||||||||||||||||||||||||||||||||||||||||||||||||||||||||||||||||||||||||||||||||||||||||||||||||||||||||||||||||||||||||||||||||||||||||||||||||||||||||||||||||||||||||||||||||||||||||||||||||||||||||
| cf) number; DB name 1 Oncogene; http://nar.oxfordjournals.org/content/35/suppl_1/D721.long, 2 Tumor Suppressor gene; https://bioinfo.uth.edu/TSGene/, 3 Cancer Gene Census; http://www.nature.com/nrc/journal/v4/n3/abs/nrc1299.html, 4 CancerGenes; http://nar.oxfordjournals.org/content/35/suppl_1/D721.long, 5 Network of Cancer Gene; http://ncg.kcl.ac.uk/index.php, 1Therapeutic Vulnerabilities in Cancer; http://cbio.mskcc.org/cancergenomics/statius/ |
| KEGG_GLYCEROLIPID_METABOLISM KEGG_GLYCEROPHOSPHOLIPID_METABOLISM | |
| OMIM | 601440; gene. 615008; phenotype. |
| Orphanet | 329903; Immunoglobulin-mediated membranoproliferative glomerulonephritis. 357008; Atypical hemolytic-uremic syndrome with DGKE deficiency. |
| Disease | KEGG Disease: DGKE |
| MedGen: DGKE (Human Medical Genetics with Condition) | |
| ClinVar: DGKE | |
| Phenotype | MGI: DGKE (International Mouse Phenotyping Consortium) |
| PhenomicDB: DGKE | |
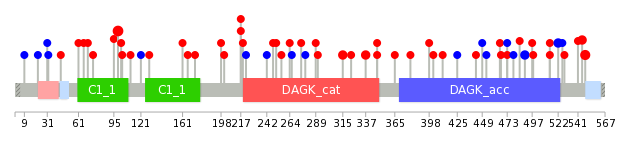
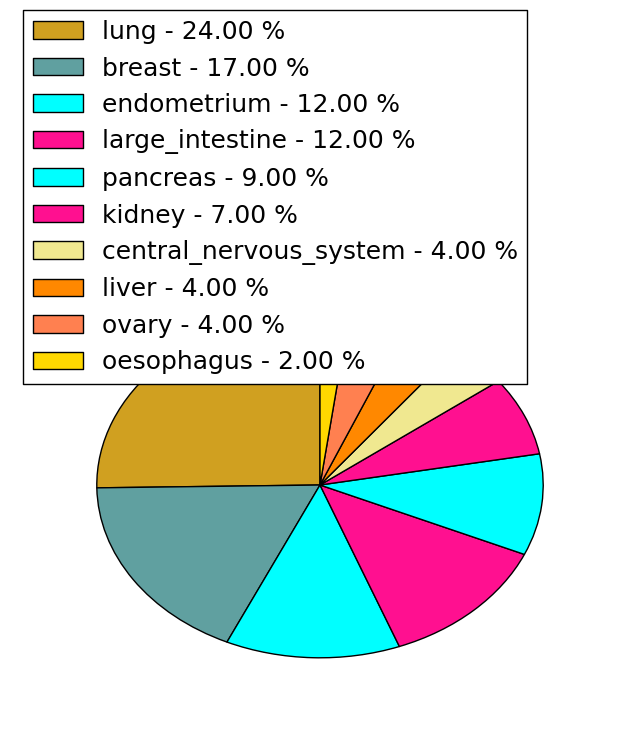
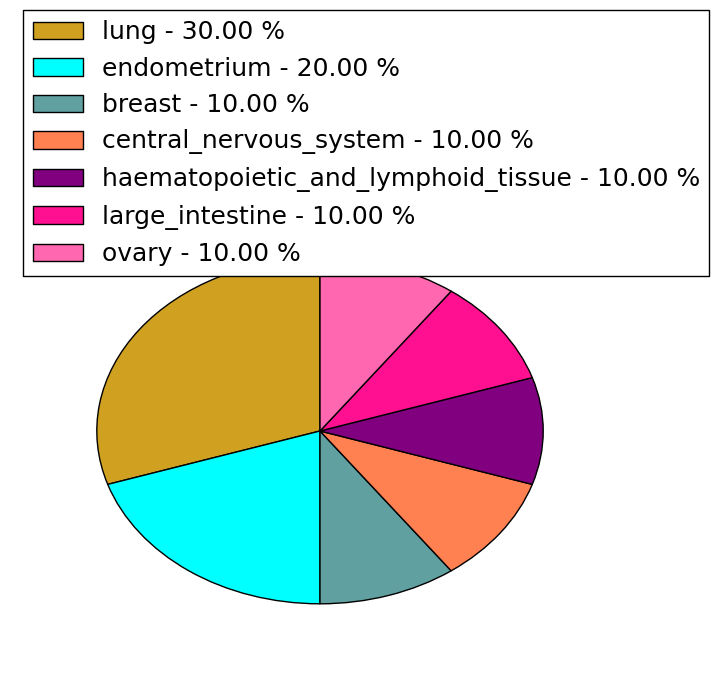
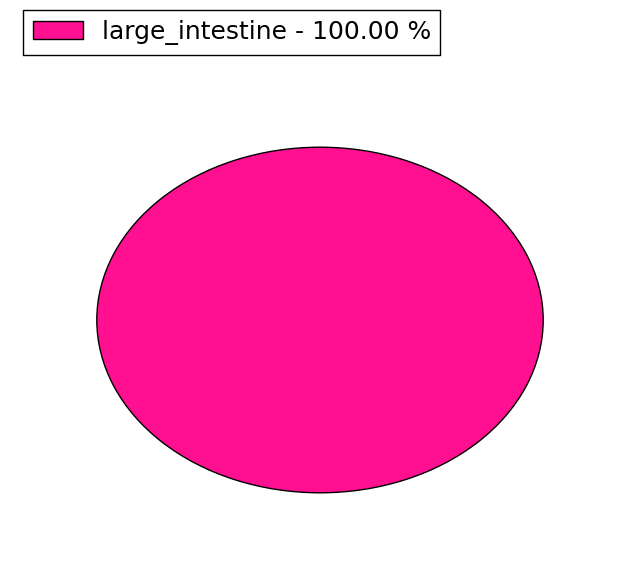
| Mutations for DGKE |
| * Under tables are showing count per each tissue to give us broad intuition about tissue specific mutation patterns.You can go to the detailed page for each mutation database's web site. |
| There's no structural variation information in COSMIC data for this gene. |
| * From mRNA Sanger sequences, Chitars2.0 arranged chimeric transcripts. This table shows DGKE related fusion information. |
| ID | Head Gene | Tail Gene | Accession | Gene_a | qStart_a | qEnd_a | Chromosome_a | tStart_a | tEnd_a | Gene_a | qStart_a | qEnd_a | Chromosome_a | tStart_a | tEnd_a |
| Top |
| Mutation type/ Tissue ID | brca | cns | cerv | endome | haematopo | kidn | Lintest | liver | lung | ns | ovary | pancre | prost | skin | stoma | thyro | urina | |||
| Total # sample | 4 | |||||||||||||||||||
| GAIN (# sample) | 4 | |||||||||||||||||||
| LOSS (# sample) |
| cf) Tissue ID; Tissue type (1; Breast, 2; Central_nervous_system, 3; Cervix, 4; Endometrium, 5; Haematopoietic_and_lymphoid_tissue, 6; Kidney, 7; Large_intestine, 8; Liver, 9; Lung, 10; NS, 11; Ovary, 12; Pancreas, 13; Prostate, 14; Skin, 15; Stomach, 16; Thyroid, 17; Urinary_tract) |
| Top |
|
 |
| Top |
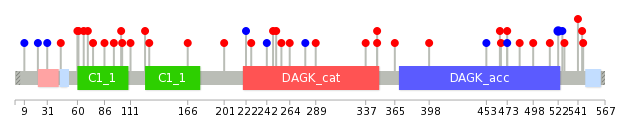
| Stat. for Non-Synonymous SNVs (# total SNVs=41) | (# total SNVs=10) |
 |  |
(# total SNVs=3) | (# total SNVs=1) |
 |  |
| Top |
| * When you move the cursor on each content, you can see more deailed mutation information on the Tooltip. Those are primary_site,primary_histology,mutation(aa),pubmedID. |
| GRCh37 position | Mutation(aa) | Unique sampleID count |
| chr17:54940090-54940090 | p.E548K | 3 |
| chr17:54912452-54912452 | p.L99R | 3 |
| chr17:54939586-54939586 | p.R500* | 3 |
| chr17:54921519-54921519 | p.T204fs*6 | 3 |
| chr17:54940083-54940083 | p.F545L | 2 |
| chr17:54926111-54926111 | p.D315N | 2 |
| chr17:54939558-54939558 | p.Q490Q | 2 |
| chr17:54926178-54926178 | p.R337Q | 2 |
| chr17:54939989-54939989 | p.S514F | 2 |
| chr17:54940014-54940014 | p.G522G | 2 |
| Top |
|
 |
| Point Mutation/ Tissue ID | 1 | 2 | 3 | 4 | 5 | 6 | 7 | 8 | 9 | 10 | 11 | 12 | 13 | 14 | 15 | 16 | 17 | 18 | 19 | 20 |
| # sample | 2 | 2 | 2 | 2 | 2 | 1 | 1 | 5 | 3 | 2 | 8 | 9 | 7 | |||||||
| # mutation | 2 | 2 | 2 | 2 | 2 | 1 | 1 | 5 | 3 | 2 | 8 | 9 | 7 | |||||||
| nonsynonymous SNV | 2 | 1 | 2 | 2 | 2 | 1 | 1 | 4 | 3 | 1 | 4 | 8 | 5 | |||||||
| synonymous SNV | 1 | 1 | 1 | 4 | 1 | 2 |
| cf) Tissue ID; Tissue type (1; BLCA[Bladder Urothelial Carcinoma], 2; BRCA[Breast invasive carcinoma], 3; CESC[Cervical squamous cell carcinoma and endocervical adenocarcinoma], 4; COAD[Colon adenocarcinoma], 5; GBM[Glioblastoma multiforme], 6; Glioma Low Grade, 7; HNSC[Head and Neck squamous cell carcinoma], 8; KICH[Kidney Chromophobe], 9; KIRC[Kidney renal clear cell carcinoma], 10; KIRP[Kidney renal papillary cell carcinoma], 11; LAML[Acute Myeloid Leukemia], 12; LUAD[Lung adenocarcinoma], 13; LUSC[Lung squamous cell carcinoma], 14; OV[Ovarian serous cystadenocarcinoma ], 15; PAAD[Pancreatic adenocarcinoma], 16; PRAD[Prostate adenocarcinoma], 17; SKCM[Skin Cutaneous Melanoma], 18:STAD[Stomach adenocarcinoma], 19:THCA[Thyroid carcinoma], 20:UCEC[Uterine Corpus Endometrial Carcinoma]) |
| Top |
| * We represented just top 10 SNVs. When you move the cursor on each content, you can see more deailed mutation information on the Tooltip. Those are primary_site, primary_histology, mutation(aa), pubmedID. |
| Genomic Position | Mutation(aa) | Unique sampleID count |
| chr17:54940014 | p.G522G | 2 |
| chr17:54923092 | p.D348H | 1 |
| chr17:54926211 | p.F545L | 1 |
| chr17:54912380 | p.D103H | 1 |
| chr17:54923105 | p.D348G | 1 |
| chr17:54926589 | p.S546P | 1 |
| chr17:54940026 | p.I111S | 1 |
| chr17:54912414 | p.P365L | 1 |
| chr17:54923152 | p.H125Y | 1 |
| chr17:54933967 | p.S398Y | 1 |
| * Copy number data were extracted from TCGA using R package TCGA-Assembler. The URLs of all public data files on TCGA DCC data server were gathered on Jan-05-2015. Function ProcessCNAData in TCGA-Assembler package was used to obtain gene-level copy number value which is calculated as the average copy number of the genomic region of a gene. |
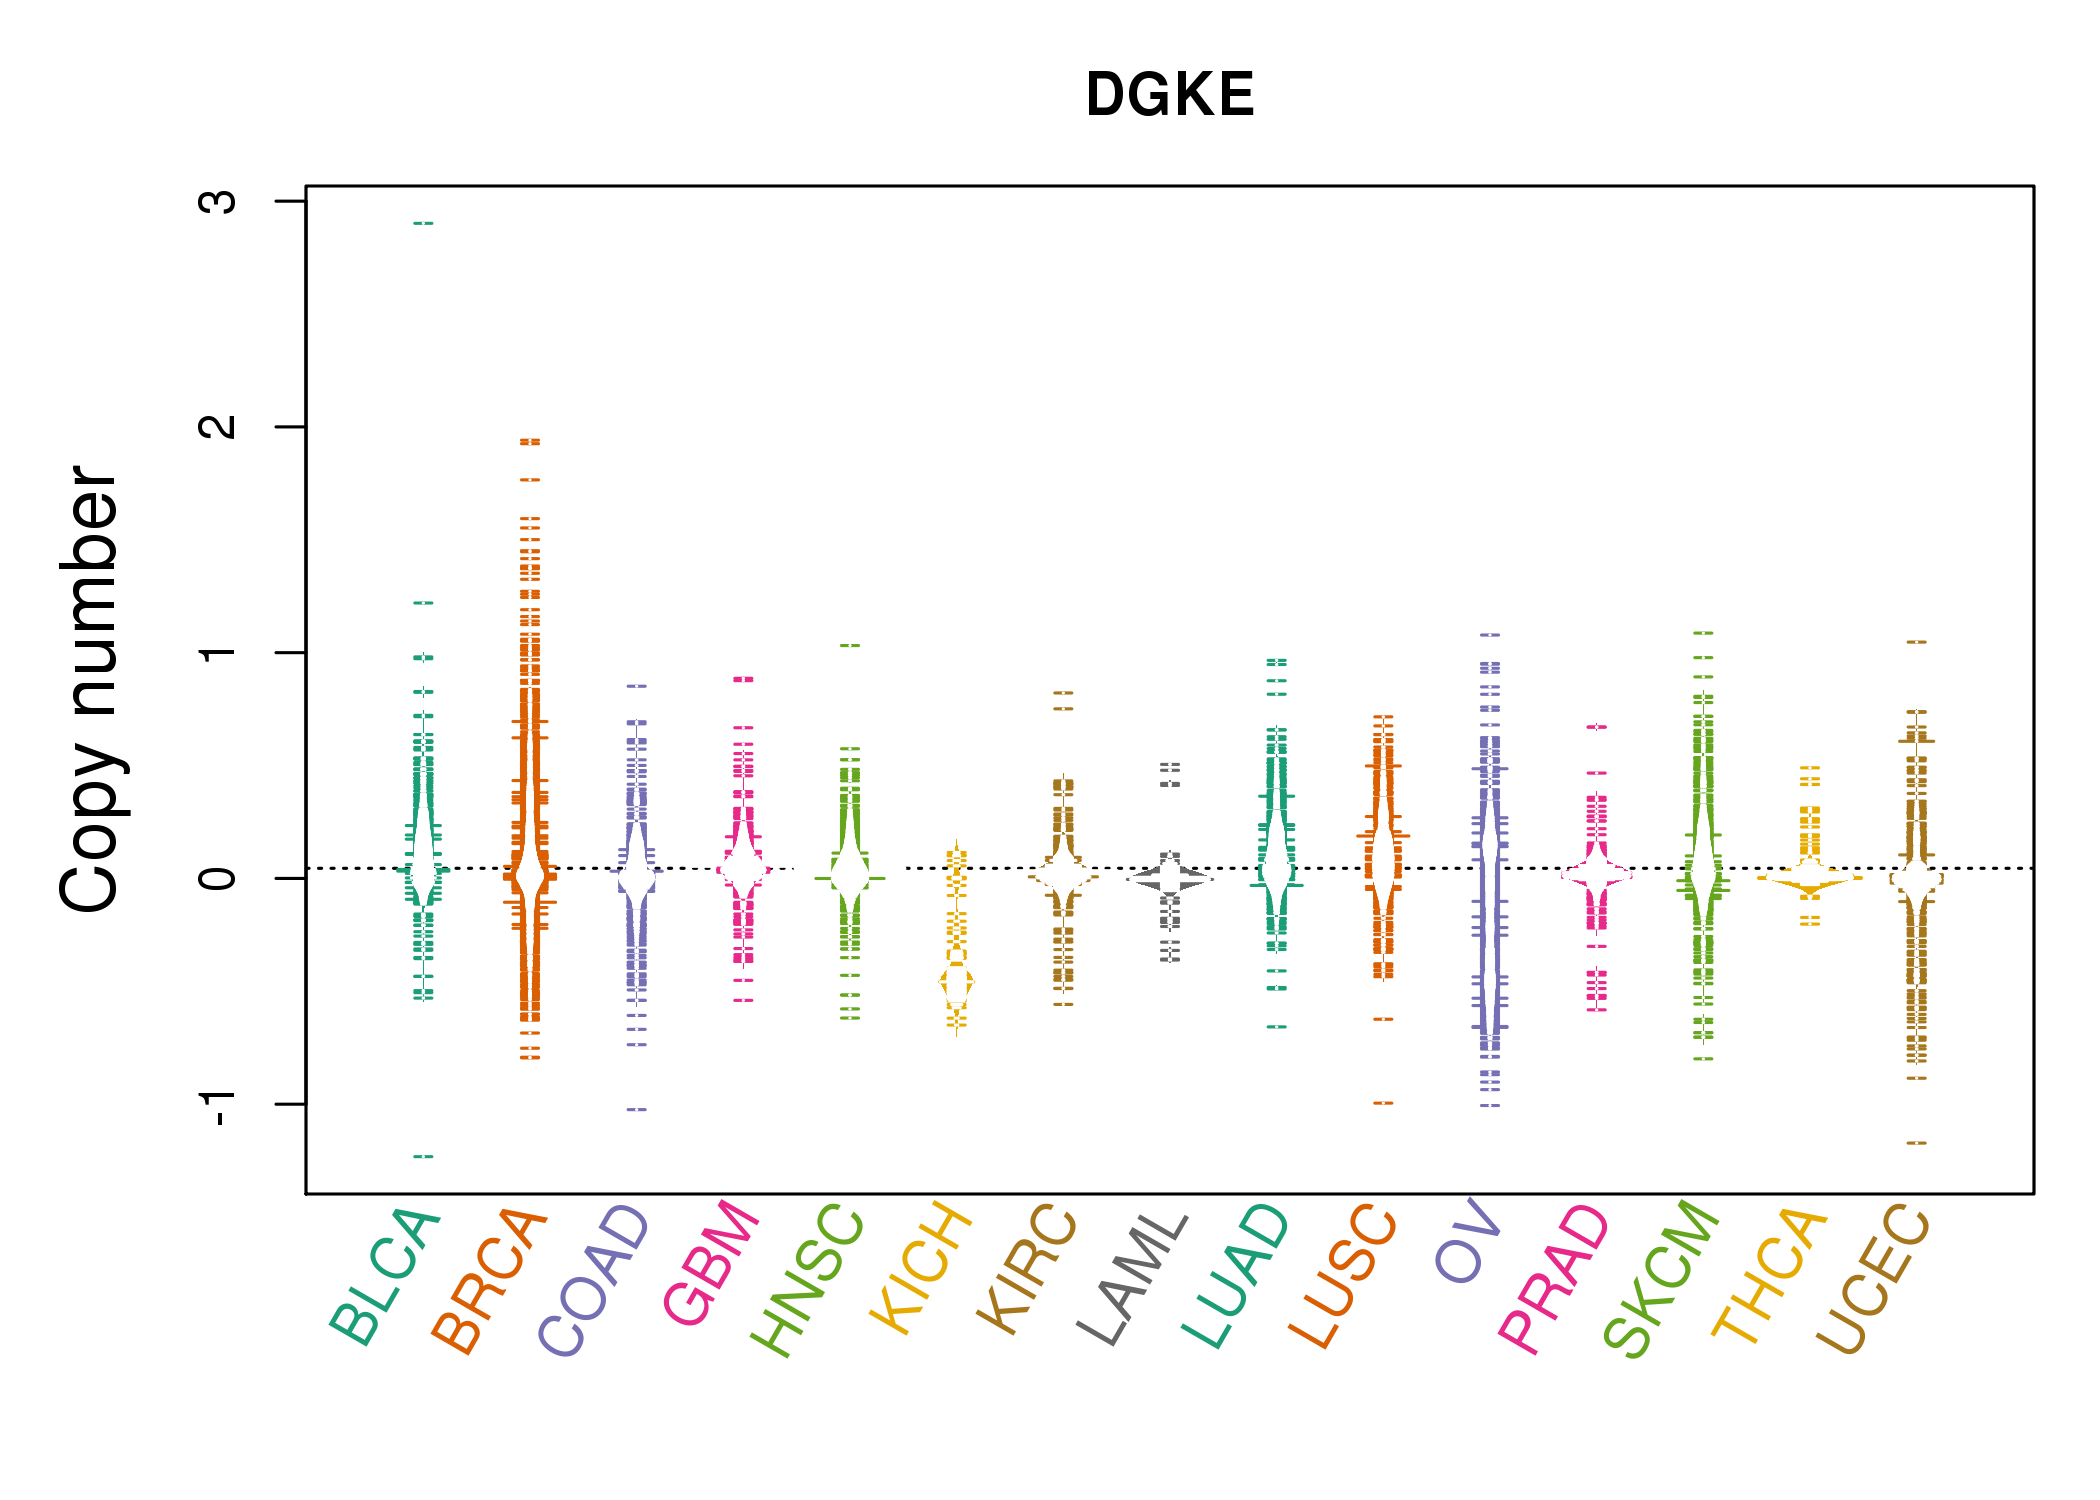 |
| cf) Tissue ID[Tissue type]: BLCA[Bladder Urothelial Carcinoma], BRCA[Breast invasive carcinoma], CESC[Cervical squamous cell carcinoma and endocervical adenocarcinoma], COAD[Colon adenocarcinoma], GBM[Glioblastoma multiforme], Glioma Low Grade, HNSC[Head and Neck squamous cell carcinoma], KICH[Kidney Chromophobe], KIRC[Kidney renal clear cell carcinoma], KIRP[Kidney renal papillary cell carcinoma], LAML[Acute Myeloid Leukemia], LUAD[Lung adenocarcinoma], LUSC[Lung squamous cell carcinoma], OV[Ovarian serous cystadenocarcinoma ], PAAD[Pancreatic adenocarcinoma], PRAD[Prostate adenocarcinoma], SKCM[Skin Cutaneous Melanoma], STAD[Stomach adenocarcinoma], THCA[Thyroid carcinoma], UCEC[Uterine Corpus Endometrial Carcinoma] |
| Top |
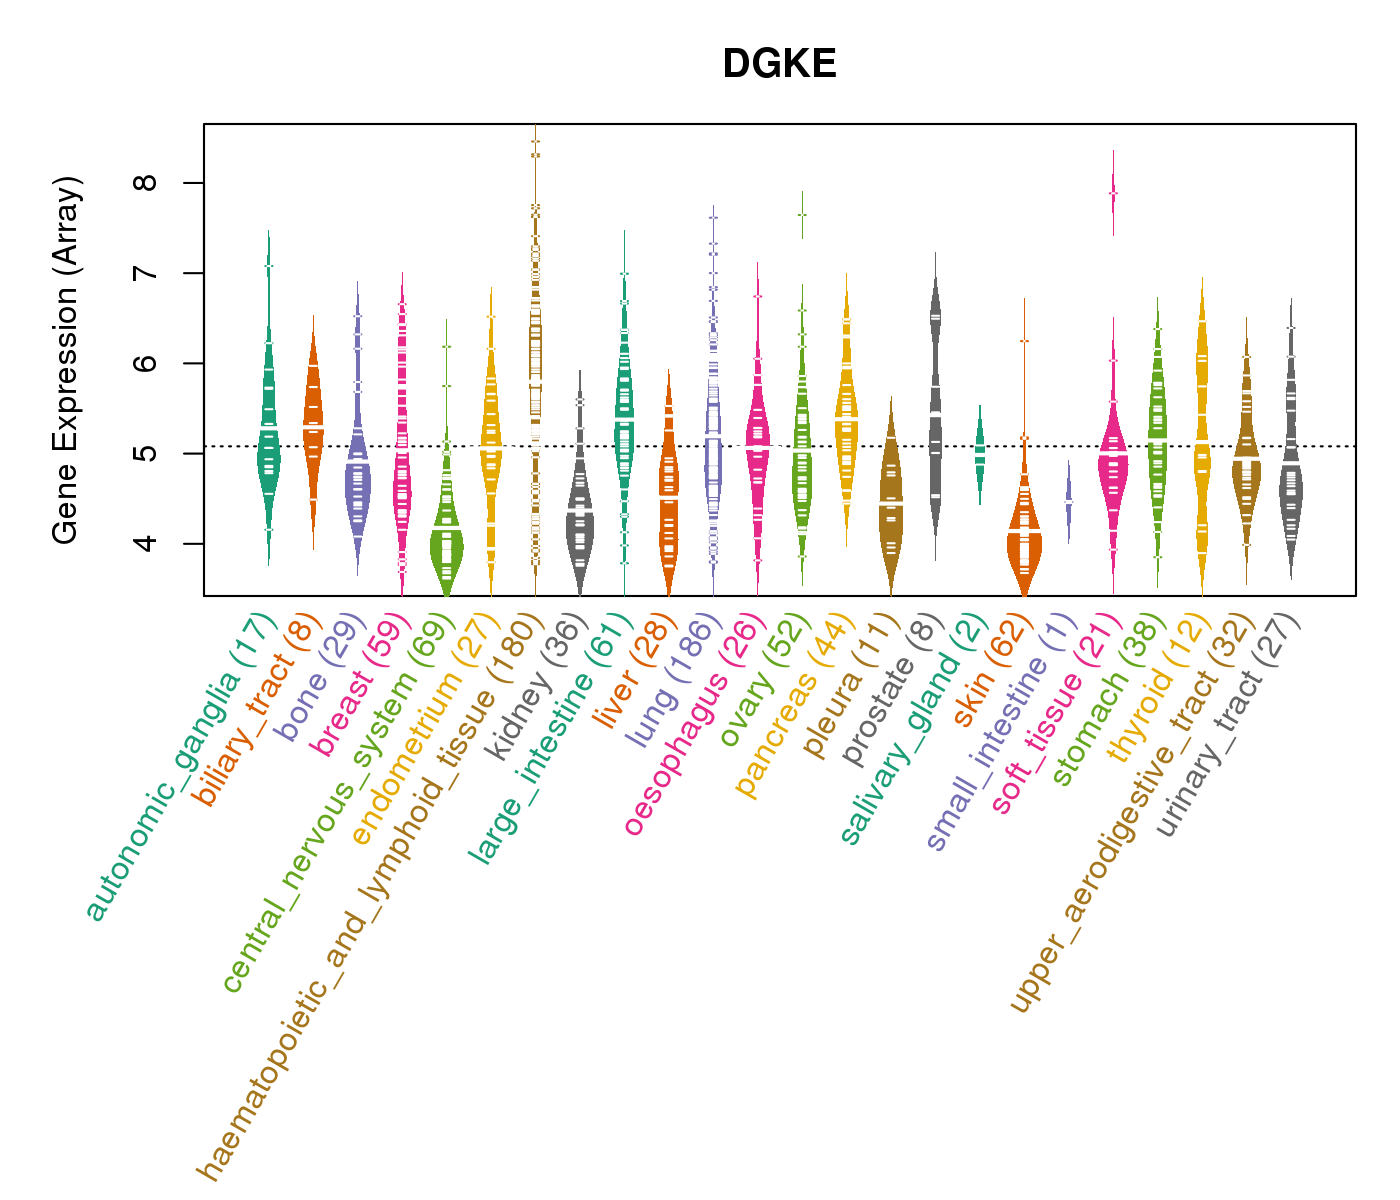
| Gene Expression for DGKE |
| * CCLE gene expression data were extracted from CCLE_Expression_Entrez_2012-10-18.res: Gene-centric RMA-normalized mRNA expression data. |
 |
| * Normalized gene expression data of RNASeqV2 was extracted from TCGA using R package TCGA-Assembler. The URLs of all public data files on TCGA DCC data server were gathered at Jan-05-2015. Only eight cancer types have enough normal control samples for differential expression analysis. (t test, adjusted p<0.05 (using Benjamini-Hochberg FDR)) |
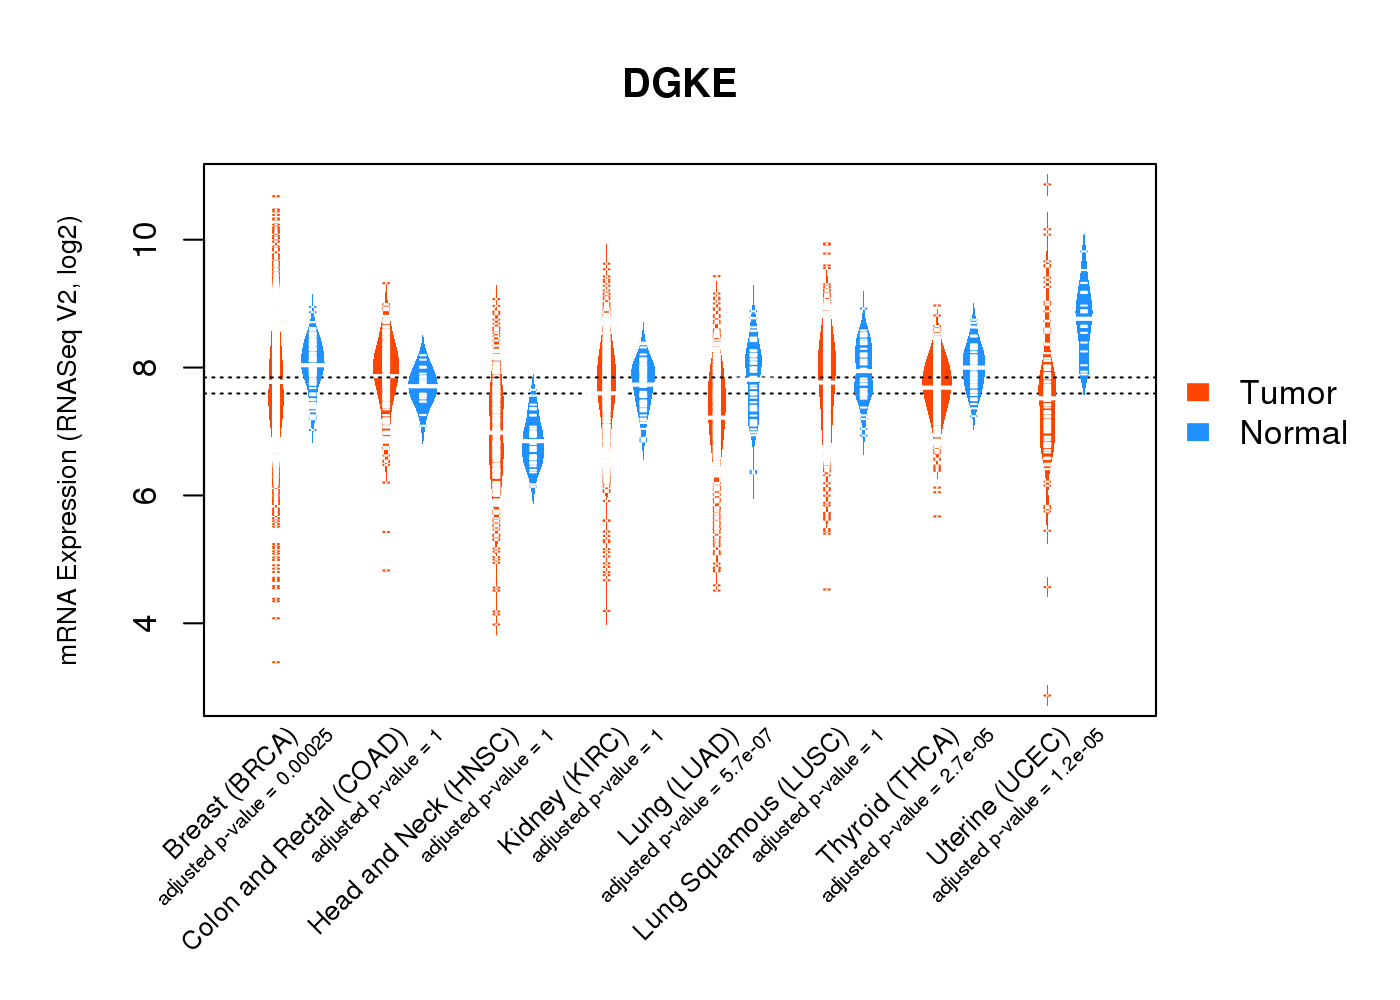 |
| Top |
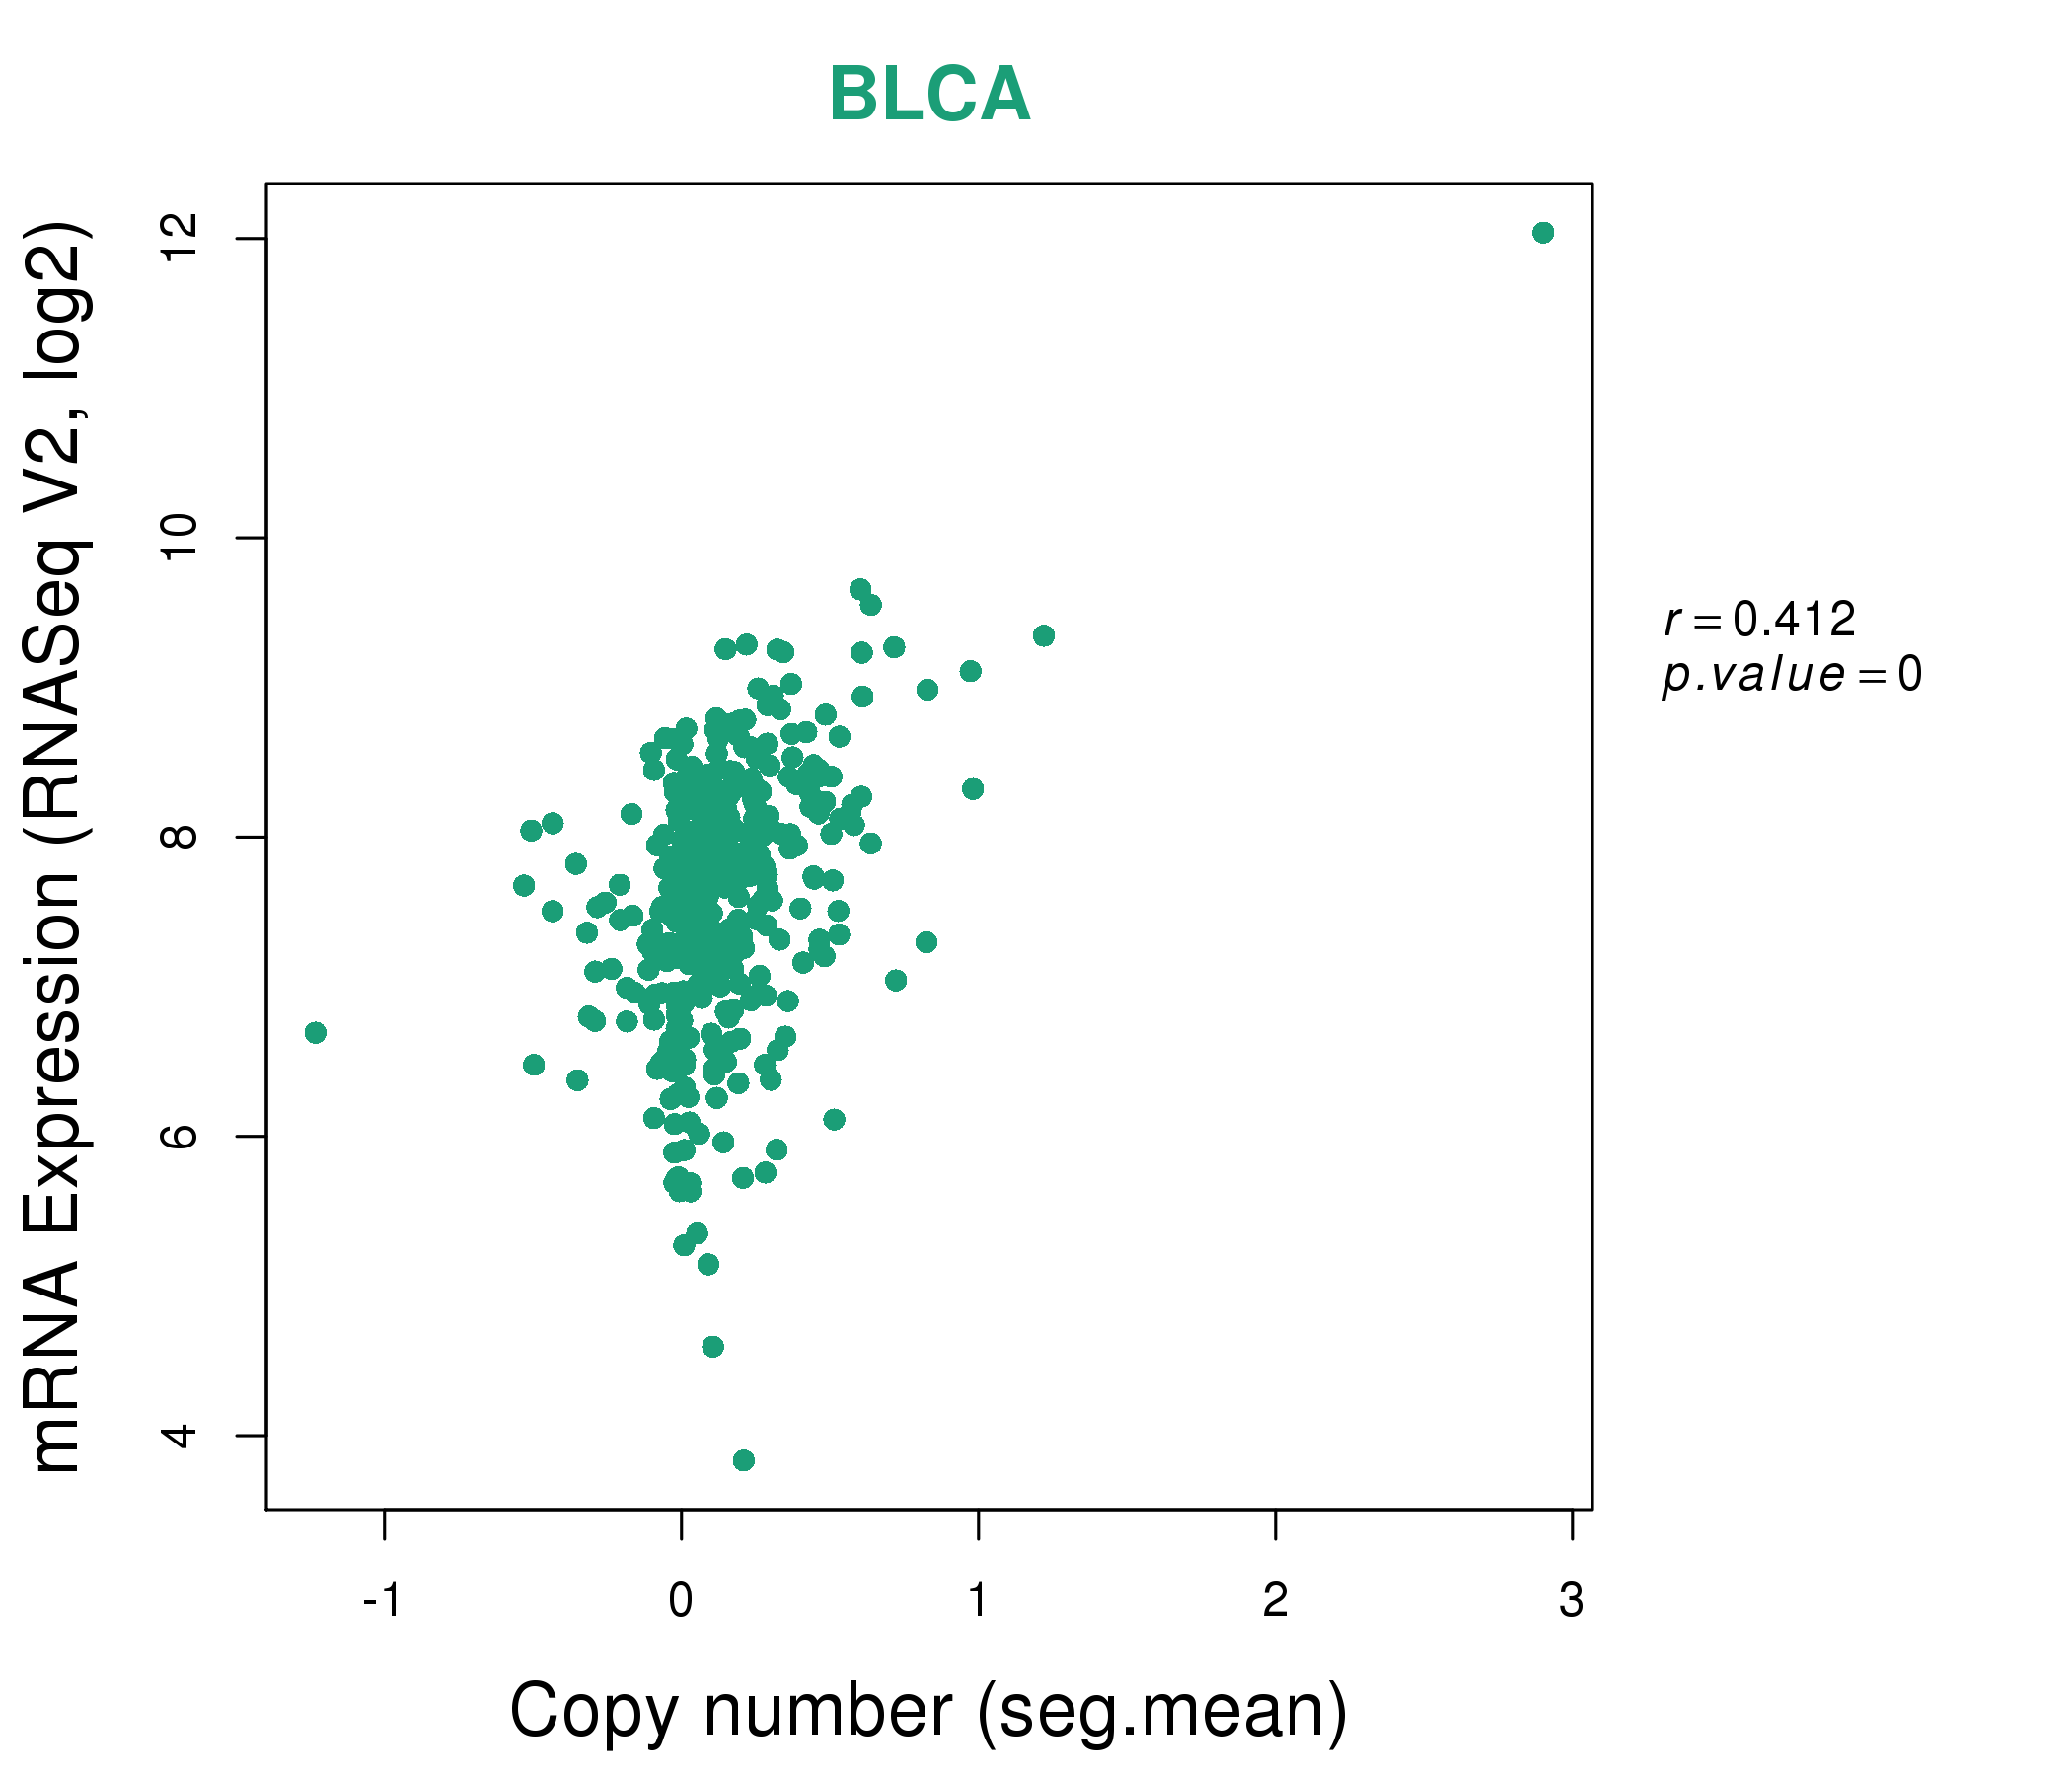
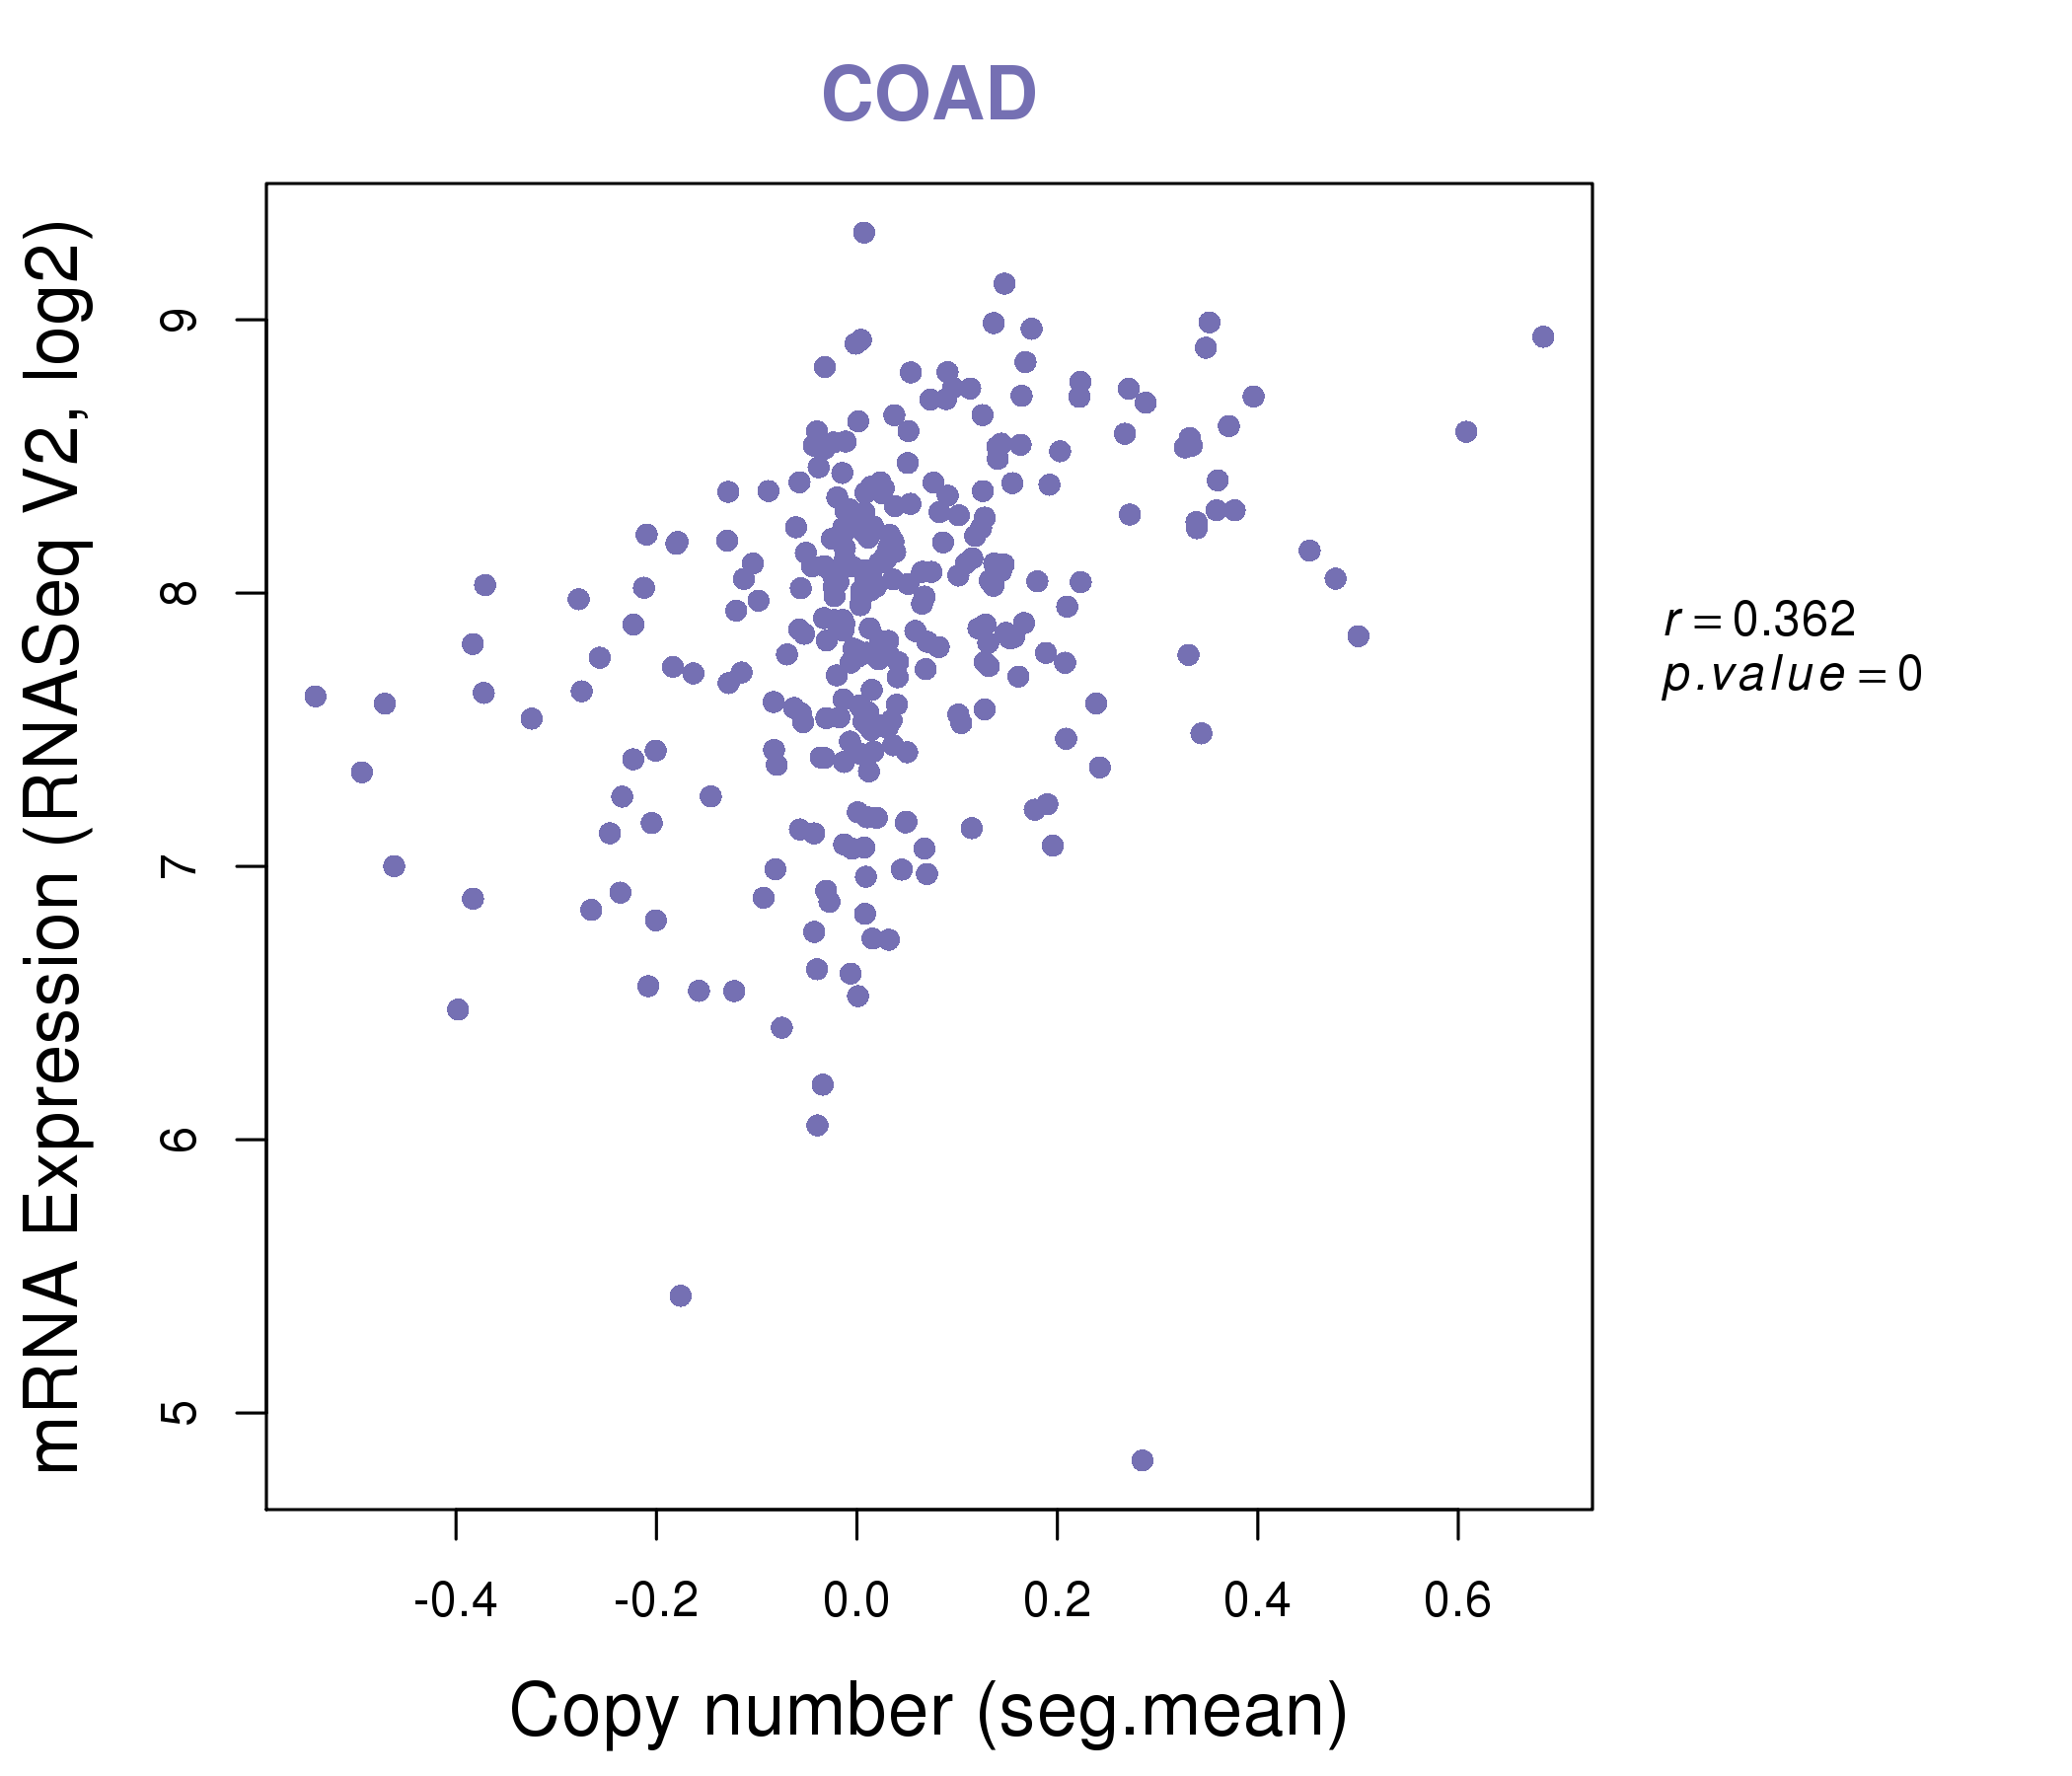
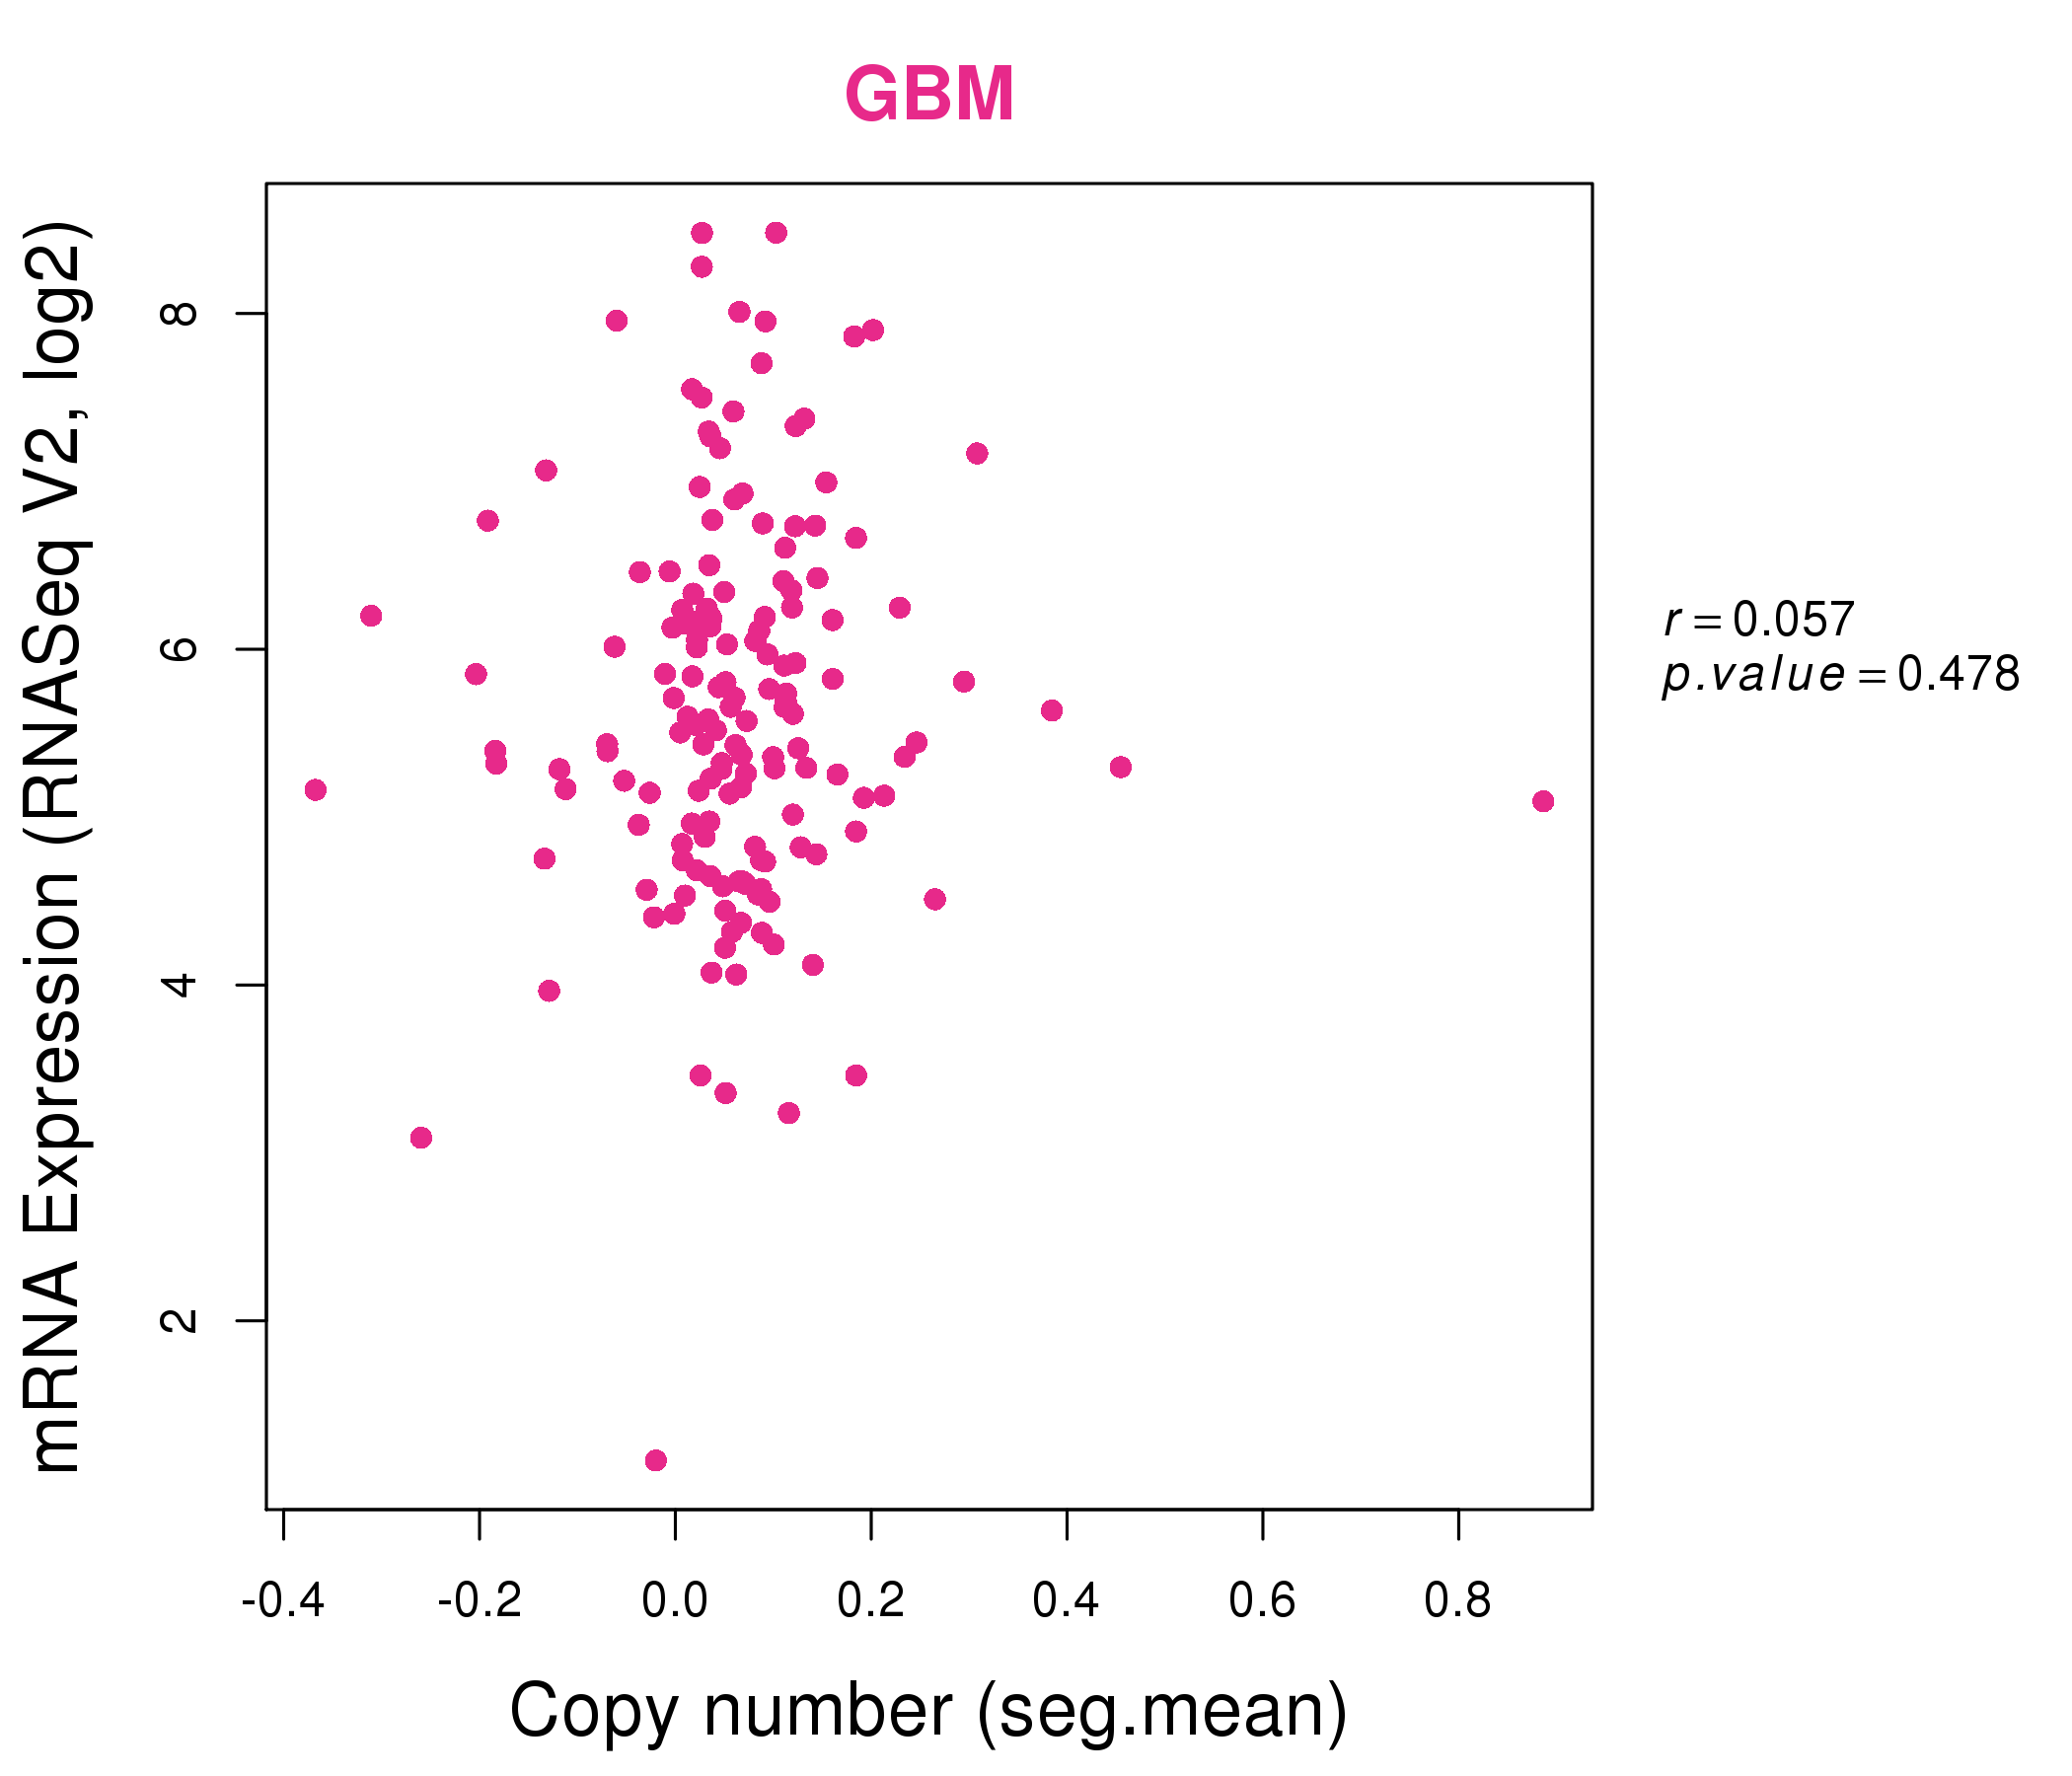
| * This plots show the correlation between CNV and gene expression. |
: Open all plots for all cancer types
 |
|
 |
|

| Top |
| Gene-Gene Network Information |
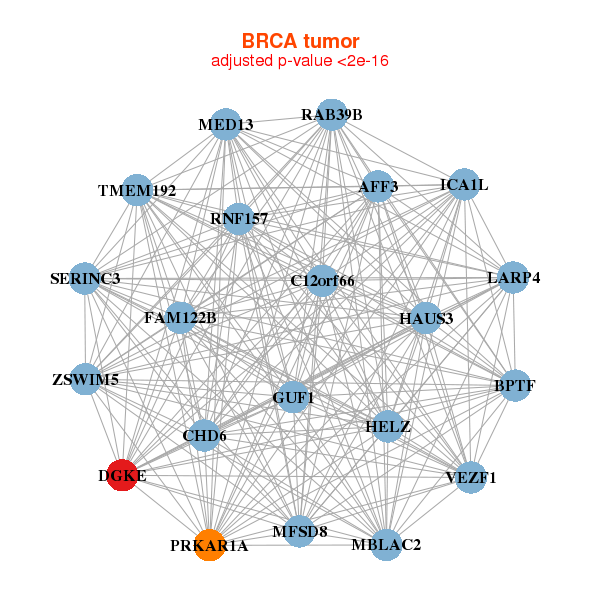
| * Co-Expression network figures were drawn using R package igraph. Only the top 20 genes with the highest correlations were shown. Red circle: input gene, orange circle: cell metabolism gene, sky circle: other gene |
: Open all plots for all cancer types
 |
|
| AFF3,BPTF,C12orf66,CHD6,DGKE,FAM122B,GUF1, HAUS3,HELZ,ICA1L,LARP4,MBLAC2,MED13,MFSD8, PRKAR1A,RAB39B,RNF157,SERINC3,TMEM192,VEZF1,ZSWIM5 | ALG10B,CARF,ANKRD12,BAZ2B,DGKE,DPY19L4,GAB1, HACE1,MFSD8,MON2,FTX,NFAT5,NKTR,PHC3, PHIP,SENP7,XRN1,ZMAT1,ZMYM1,ZNF451,ZNF75D |
 |
|
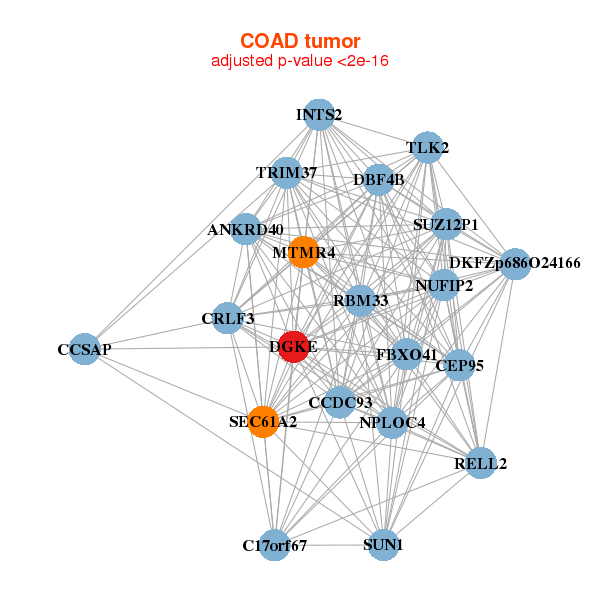
| ANKRD40,C17orf67,CCSAP,CEP95,CCDC93,CRLF3,DBF4B, DGKE,DKFZp686O24166,FBXO41,INTS2,MTMR4,NPLOC4,NUFIP2, RBM33,RELL2,SEC61A2,SUN1,SUZ12P1,TLK2,TRIM37 | ARMCX3,CAPRIN2,CHIC1,DGKE,EPM2AIP1,IRS1,KIAA1377, MYEF2,PHF10,PPP1R9A,RUFY2,SMAD5,SPIN3,TMX3, TULP3,TWSG1,USP13,WASF3,ZNF354B,ZNF449,ZNF793 |
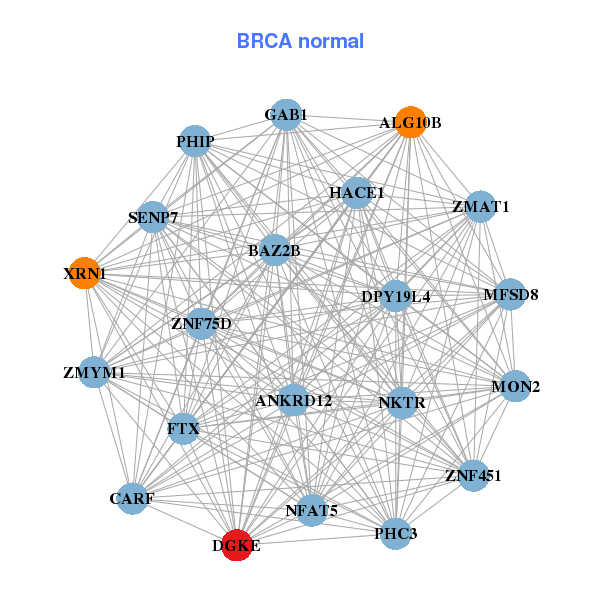

| * Co-Expression network figures were drawn using R package igraph. Only the top 20 genes with the highest correlations were shown. Red circle: input gene, orange circle: cell metabolism gene, sky circle: other gene |
: Open all plots for all cancer types
| Top |
: Open all interacting genes' information including KEGG pathway for all interacting genes from DAVID
| Top |
| Pharmacological Information for DGKE |
| There's no related Drug. |
| Top |
| Cross referenced IDs for DGKE |
| * We obtained these cross-references from Uniprot database. It covers 150 different DBs, 18 categories. http://www.uniprot.org/help/cross_references_section |
: Open all cross reference information
|
Copyright © 2016-Present - The Univsersity of Texas Health Science Center at Houston @ |