|
||||||||||||||||||||
| |
| Phenotypic Information (metabolism pathway, cancer, disease, phenome) |
| |
| |
| Gene-Gene Network Information: Co-Expression Network, Interacting Genes & KEGG |
| |
|


| Gene Summary for DDO |
| Basic gene info. | Gene symbol | DDO |
| Gene name | D-aspartate oxidase | |
| Synonyms | DASOX|DDO-1|DDO-2 | |
| Cytomap | UCSC genome browser: 6q21 | |
| Genomic location | chr6 :110713382-110736753 | |
| Type of gene | protein-coding | |
| RefGenes | NM_003649.2, NM_004032.2, | |
| Ensembl id | ENSG00000203797 | |
| Description | D-aspartate oxidase, DDOaspartic oxidase | |
| Modification date | 20141207 | |
| dbXrefs | MIM : 124450 | |
| HGNC : HGNC | ||
| Ensembl : ENSG00000203797 | ||
| HPRD : 00498 | ||
| Vega : OTTHUMG00000015360 | ||
| Protein | UniProt: go to UniProt's Cross Reference DB Table | |
| Expression | CleanEX: HS_DDO | |
| BioGPS: 8528 | ||
| Gene Expression Atlas: ENSG00000203797 | ||
| The Human Protein Atlas: ENSG00000203797 | ||
| Pathway | NCI Pathway Interaction Database: DDO | |
| KEGG: DDO | ||
| REACTOME: DDO | ||
| ConsensusPathDB | ||
| Pathway Commons: DDO | ||
| Metabolism | MetaCyc: DDO | |
| HUMANCyc: DDO | ||
| Regulation | Ensembl's Regulation: ENSG00000203797 | |
| miRBase: chr6 :110,713,382-110,736,753 | ||
| TargetScan: NM_003649 | ||
| cisRED: ENSG00000203797 | ||
| Context | iHOP: DDO | |
| cancer metabolism search in PubMed: DDO | ||
| UCL Cancer Institute: DDO | ||
| Assigned class in ccmGDB | C | |
| Top |
| Phenotypic Information for DDO(metabolism pathway, cancer, disease, phenome) |
| Cancer | CGAP: DDO |
| Familial Cancer Database: DDO | |
| * This gene is included in those cancer gene databases. |
|
|
|
|
|
| . | ||||||||||||||
Oncogene 1 | Significant driver gene in | |||||||||||||||||||
| cf) number; DB name 1 Oncogene; http://nar.oxfordjournals.org/content/35/suppl_1/D721.long, 2 Tumor Suppressor gene; https://bioinfo.uth.edu/TSGene/, 3 Cancer Gene Census; http://www.nature.com/nrc/journal/v4/n3/abs/nrc1299.html, 4 CancerGenes; http://nar.oxfordjournals.org/content/35/suppl_1/D721.long, 5 Network of Cancer Gene; http://ncg.kcl.ac.uk/index.php, 1Therapeutic Vulnerabilities in Cancer; http://cbio.mskcc.org/cancergenomics/statius/ |
| KEGG_ALANINE_ASPARTATE_AND_GLUTAMATE_METABOLISM | |
| OMIM | |
| Orphanet | |
| Disease | KEGG Disease: DDO |
| MedGen: DDO (Human Medical Genetics with Condition) | |
| ClinVar: DDO | |
| Phenotype | MGI: DDO (International Mouse Phenotyping Consortium) |
| PhenomicDB: DDO | |
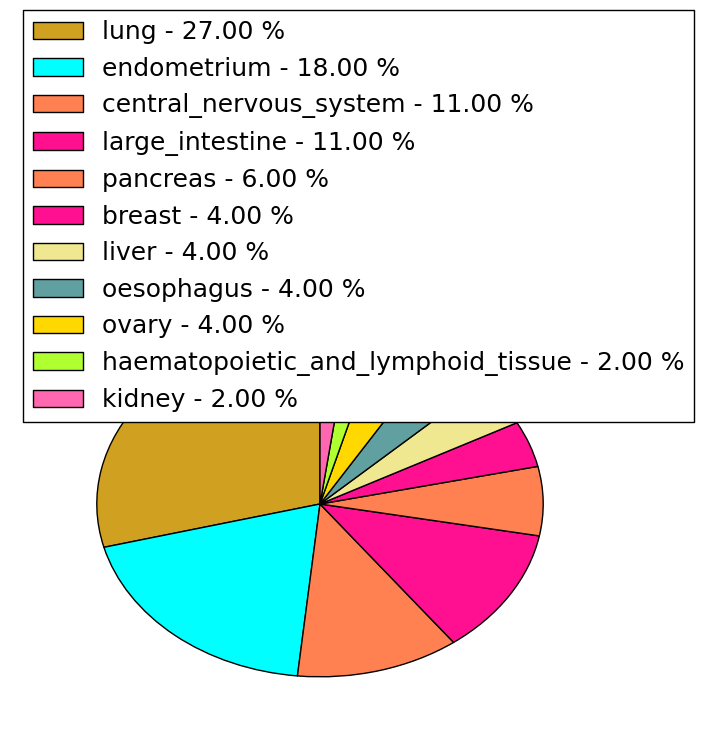
| Mutations for DDO |
| * Under tables are showing count per each tissue to give us broad intuition about tissue specific mutation patterns.You can go to the detailed page for each mutation database's web site. |
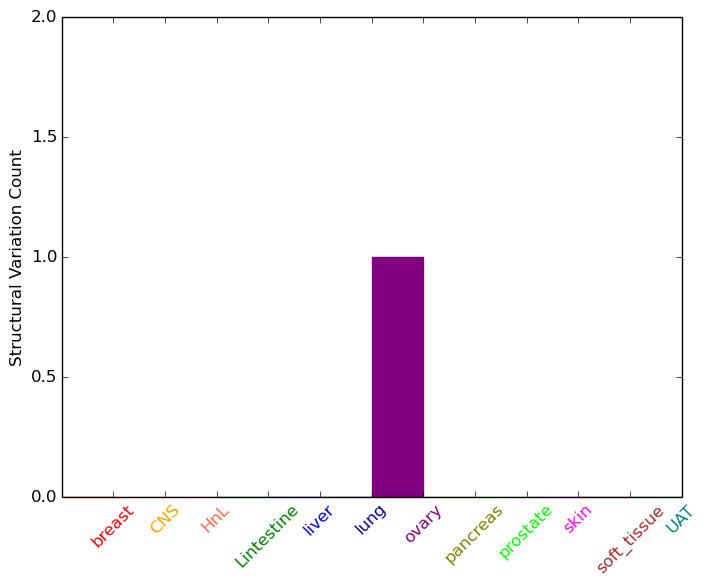
| - Statistics for Tissue and Mutation type | Top |
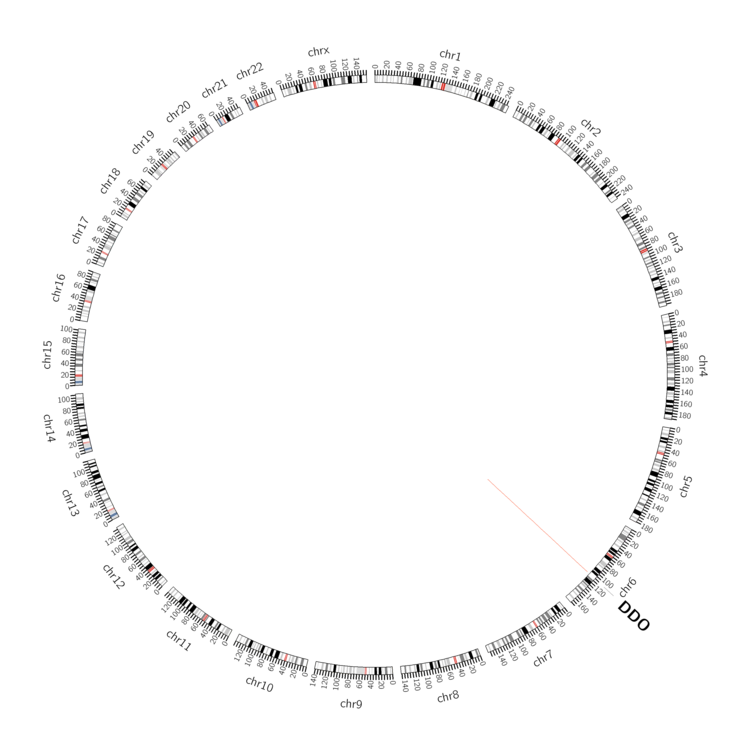 |
| - For Inter-chromosomal Variations |
| There's no inter-chromosomal structural variation. |
| - For Intra-chromosomal Variations |
| * Intra-chromosomal variantions includes 'intrachromosomal amplicon to amplicon', 'intrachromosomal amplicon to non-amplified dna', 'intrachromosomal deletion', 'intrachromosomal fold-back inversion', 'intrachromosomal inversion', 'intrachromosomal tandem duplication', 'Intrachromosomal unknown type', 'intrachromosomal with inverted orientation', 'intrachromosomal with non-inverted orientation'. |
 |
| Sample | Symbol_a | Chr_a | Start_a | End_a | Symbol_b | Chr_b | Start_b | End_b |
| ovary | DDO | chr6 | 110729308 | 110729328 | chr6 | 110704221 | 110704241 |
| cf) Tissue number; Tissue name (1;Breast, 2;Central_nervous_system, 3;Haematopoietic_and_lymphoid_tissue, 4;Large_intestine, 5;Liver, 6;Lung, 7;Ovary, 8;Pancreas, 9;Prostate, 10;Skin, 11;Soft_tissue, 12;Upper_aerodigestive_tract) |
| * From mRNA Sanger sequences, Chitars2.0 arranged chimeric transcripts. This table shows DDO related fusion information. |
| ID | Head Gene | Tail Gene | Accession | Gene_a | qStart_a | qEnd_a | Chromosome_a | tStart_a | tEnd_a | Gene_a | qStart_a | qEnd_a | Chromosome_a | tStart_a | tEnd_a |
| Top |
| There's no copy number variation information in COSMIC data for this gene. |
| Top |
|
 |
| Top |
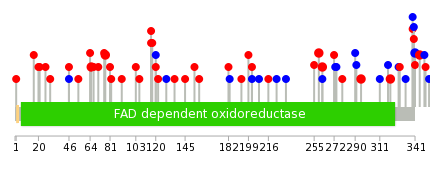
| Stat. for Non-Synonymous SNVs (# total SNVs=43) | (# total SNVs=16) |
 |  |
(# total SNVs=3) | (# total SNVs=0) |
 |
| Top |
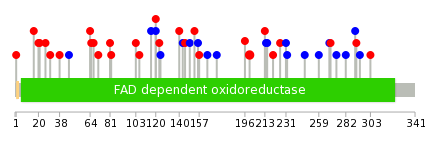
| * When you move the cursor on each content, you can see more deailed mutation information on the Tooltip. Those are primary_site,primary_histology,mutation(aa),pubmedID. |
| GRCh37 position | Mutation(aa) | Unique sampleID count |
| chr6:110734521-110734521 | p.G77R | 2 |
| chr6:110714313-110714313 | p.V259I | 2 |
| chr6:110734556-110734556 | p.K65T | 2 |
| chr6:110714054-110714054 | p.T345I | 2 |
| chr6:110714065-110714065 | p.V341V | 2 |
| chr6:110726086-110726086 | p.R145* | 2 |
| chr6:110714129-110714129 | p.A320V | 2 |
| chr6:110714304-110714304 | p.G262C | 2 |
| chr6:110714205-110714205 | p.G295R | 2 |
| chr6:110736689-110736689 | p.D21Y | 1 |
| Top |
|
 |
| Point Mutation/ Tissue ID | 1 | 2 | 3 | 4 | 5 | 6 | 7 | 8 | 9 | 10 | 11 | 12 | 13 | 14 | 15 | 16 | 17 | 18 | 19 | 20 |
| # sample | 7 | 1 | 1 | 1 | 8 | 2 | 3 | 10 | 6 | 7 | ||||||||||
| # mutation | 7 | 1 | 1 | 1 | 9 | 2 | 3 | 13 | 6 | 7 | ||||||||||
| nonsynonymous SNV | 5 | 1 | 4 | 2 | 2 | 7 | 3 | 6 | ||||||||||||
| synonymous SNV | 2 | 1 | 1 | 5 | 1 | 6 | 3 | 1 |
| cf) Tissue ID; Tissue type (1; BLCA[Bladder Urothelial Carcinoma], 2; BRCA[Breast invasive carcinoma], 3; CESC[Cervical squamous cell carcinoma and endocervical adenocarcinoma], 4; COAD[Colon adenocarcinoma], 5; GBM[Glioblastoma multiforme], 6; Glioma Low Grade, 7; HNSC[Head and Neck squamous cell carcinoma], 8; KICH[Kidney Chromophobe], 9; KIRC[Kidney renal clear cell carcinoma], 10; KIRP[Kidney renal papillary cell carcinoma], 11; LAML[Acute Myeloid Leukemia], 12; LUAD[Lung adenocarcinoma], 13; LUSC[Lung squamous cell carcinoma], 14; OV[Ovarian serous cystadenocarcinoma ], 15; PAAD[Pancreatic adenocarcinoma], 16; PRAD[Prostate adenocarcinoma], 17; SKCM[Skin Cutaneous Melanoma], 18:STAD[Stomach adenocarcinoma], 19:THCA[Thyroid carcinoma], 20:UCEC[Uterine Corpus Endometrial Carcinoma]) |
| Top |
| * We represented just top 10 SNVs. When you move the cursor on each content, you can see more deailed mutation information on the Tooltip. Those are primary_site, primary_histology, mutation(aa), pubmedID. |
| Genomic Position | Mutation(aa) | Unique sampleID count |
| chr6:110714313 | p.V200I,DDO | 2 |
| chr6:110714324 | p.A291V,DDO | 1 |
| chr6:110726085 | p.G196V,DDO | 1 |
| chr6:110714134 | p.L103I,DDO | 1 |
| chr6:110734560 | p.A290A,DDO | 1 |
| chr6:110714395 | p.V172V,DDO | 1 |
| chr6:110729542 | p.H82Y,DDO | 1 |
| chr6:110714170 | p.V282V,DDO | 1 |
| chr6:110734612 | p.K164K,DDO | 1 |
| chr6:110714419 | p.P81S,DDO | 1 |
| * Copy number data were extracted from TCGA using R package TCGA-Assembler. The URLs of all public data files on TCGA DCC data server were gathered on Jan-05-2015. Function ProcessCNAData in TCGA-Assembler package was used to obtain gene-level copy number value which is calculated as the average copy number of the genomic region of a gene. |
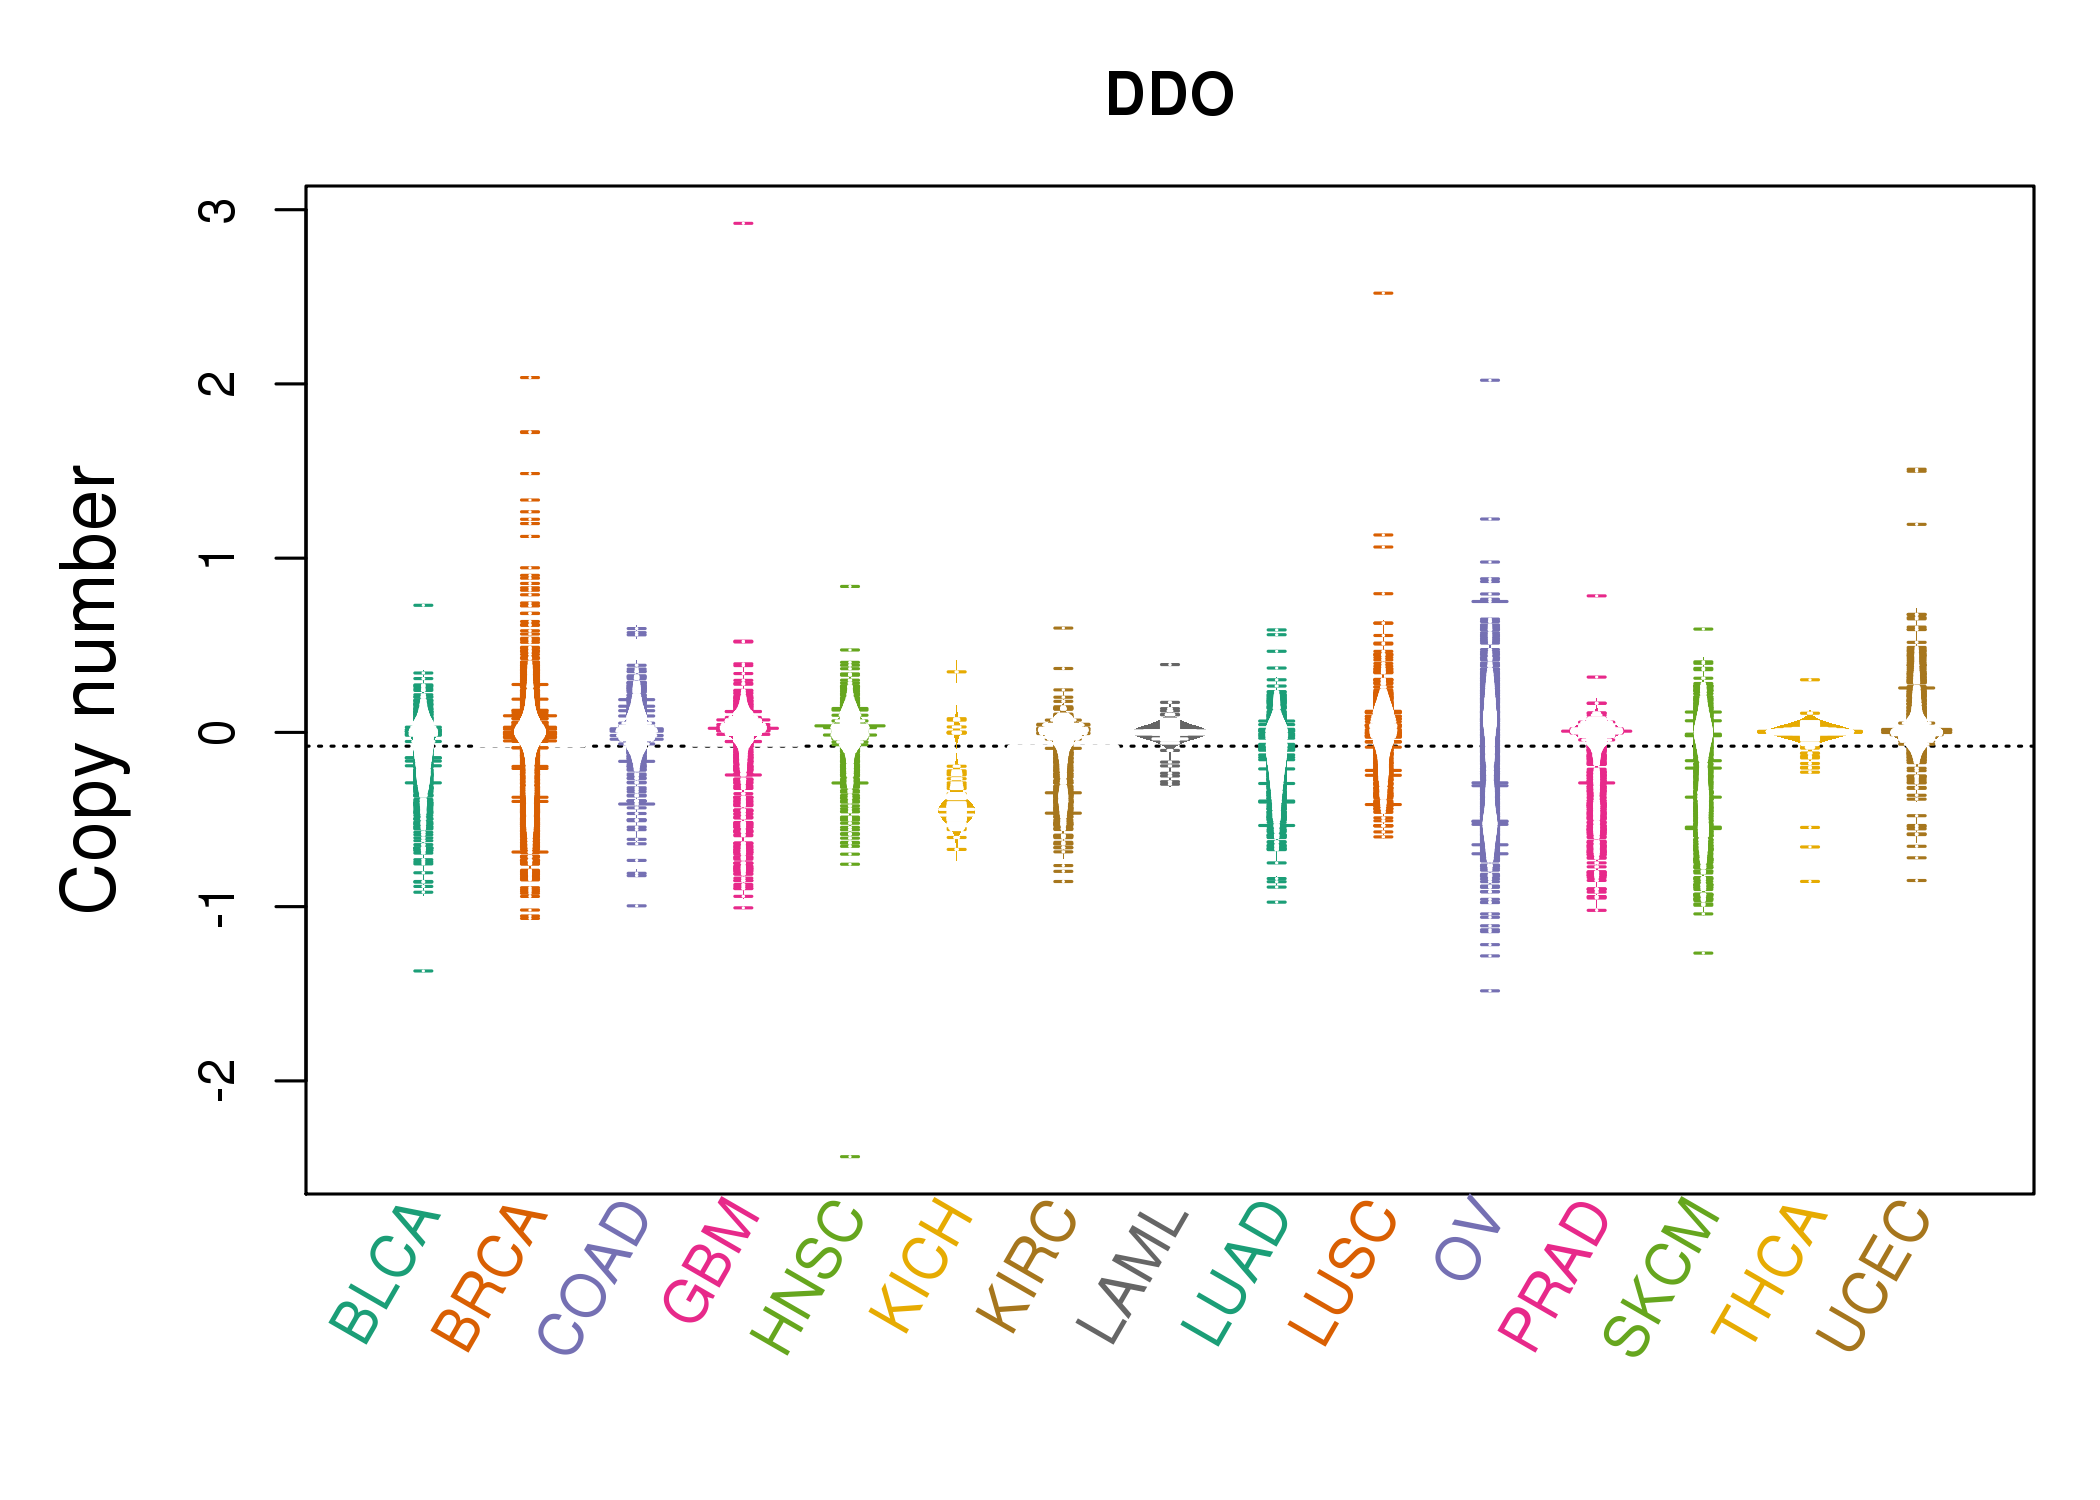 |
| cf) Tissue ID[Tissue type]: BLCA[Bladder Urothelial Carcinoma], BRCA[Breast invasive carcinoma], CESC[Cervical squamous cell carcinoma and endocervical adenocarcinoma], COAD[Colon adenocarcinoma], GBM[Glioblastoma multiforme], Glioma Low Grade, HNSC[Head and Neck squamous cell carcinoma], KICH[Kidney Chromophobe], KIRC[Kidney renal clear cell carcinoma], KIRP[Kidney renal papillary cell carcinoma], LAML[Acute Myeloid Leukemia], LUAD[Lung adenocarcinoma], LUSC[Lung squamous cell carcinoma], OV[Ovarian serous cystadenocarcinoma ], PAAD[Pancreatic adenocarcinoma], PRAD[Prostate adenocarcinoma], SKCM[Skin Cutaneous Melanoma], STAD[Stomach adenocarcinoma], THCA[Thyroid carcinoma], UCEC[Uterine Corpus Endometrial Carcinoma] |
| Top |
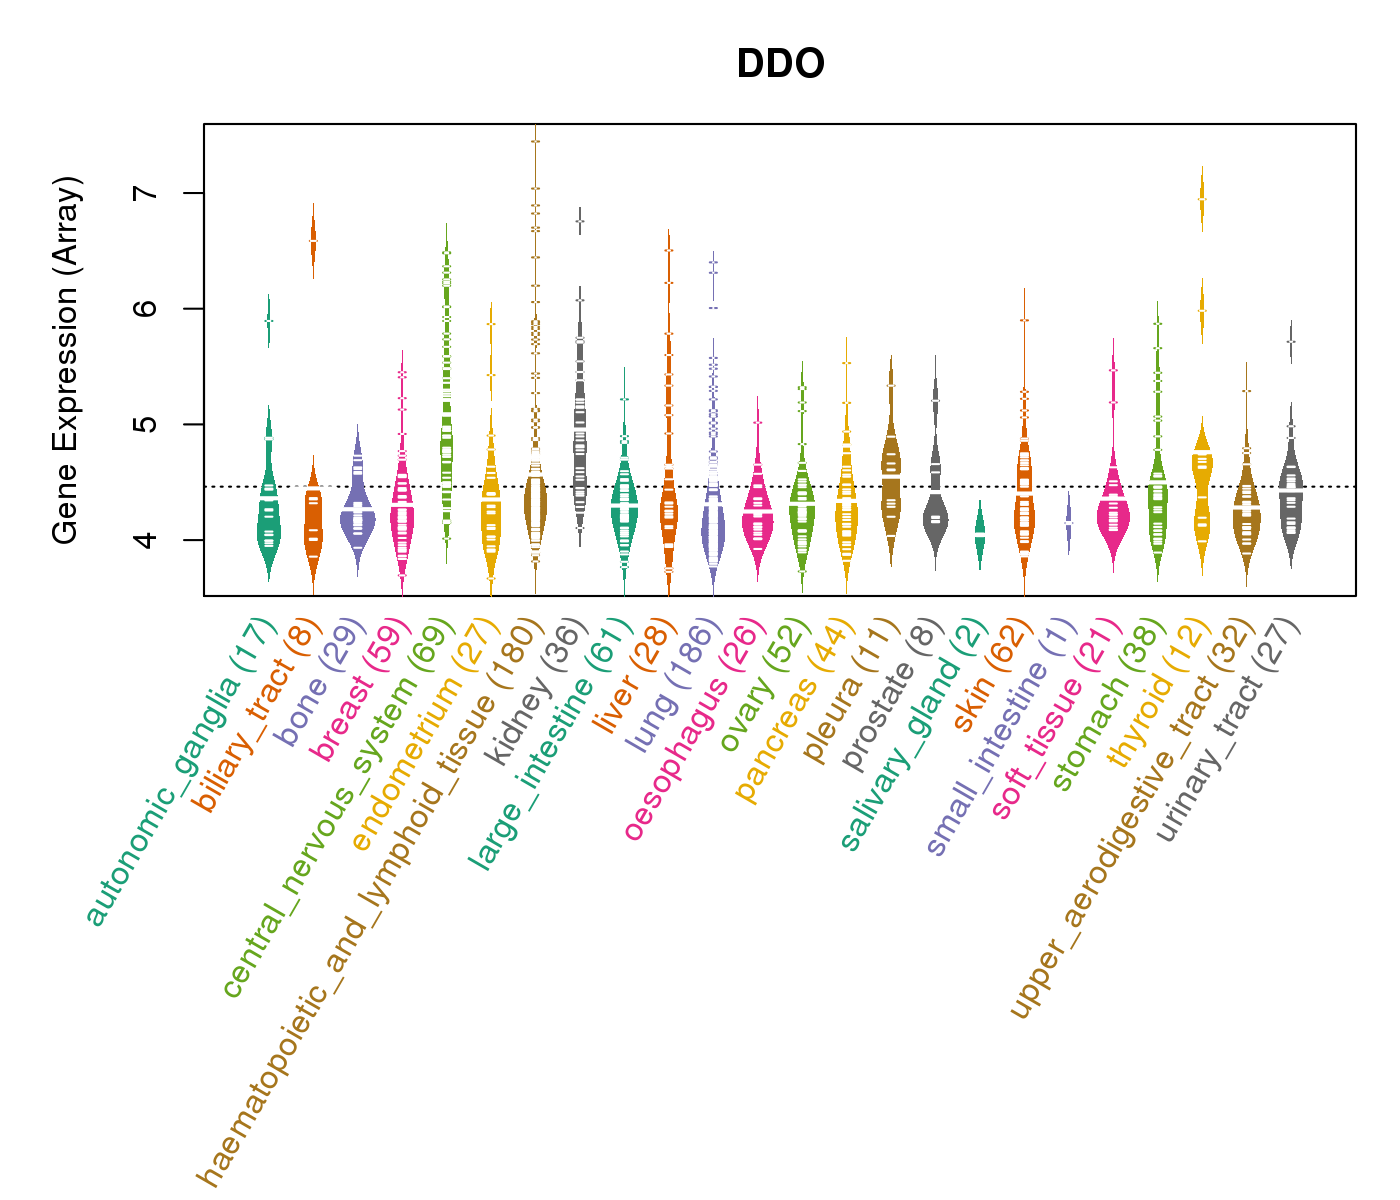
| Gene Expression for DDO |
| * CCLE gene expression data were extracted from CCLE_Expression_Entrez_2012-10-18.res: Gene-centric RMA-normalized mRNA expression data. |
 |
| * Normalized gene expression data of RNASeqV2 was extracted from TCGA using R package TCGA-Assembler. The URLs of all public data files on TCGA DCC data server were gathered at Jan-05-2015. Only eight cancer types have enough normal control samples for differential expression analysis. (t test, adjusted p<0.05 (using Benjamini-Hochberg FDR)) |
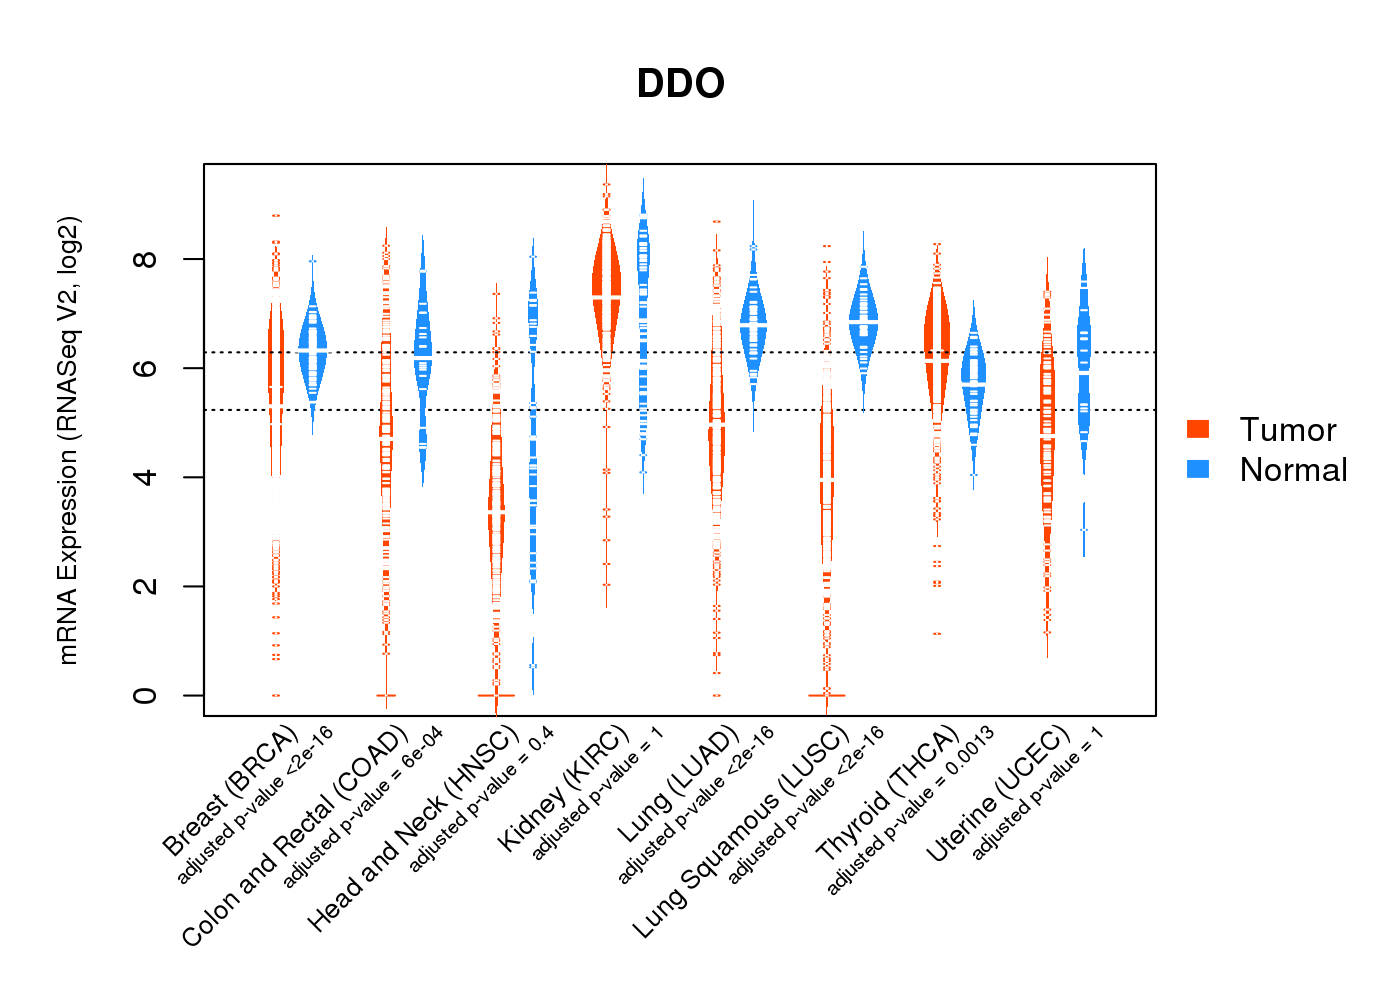 |
| Top |
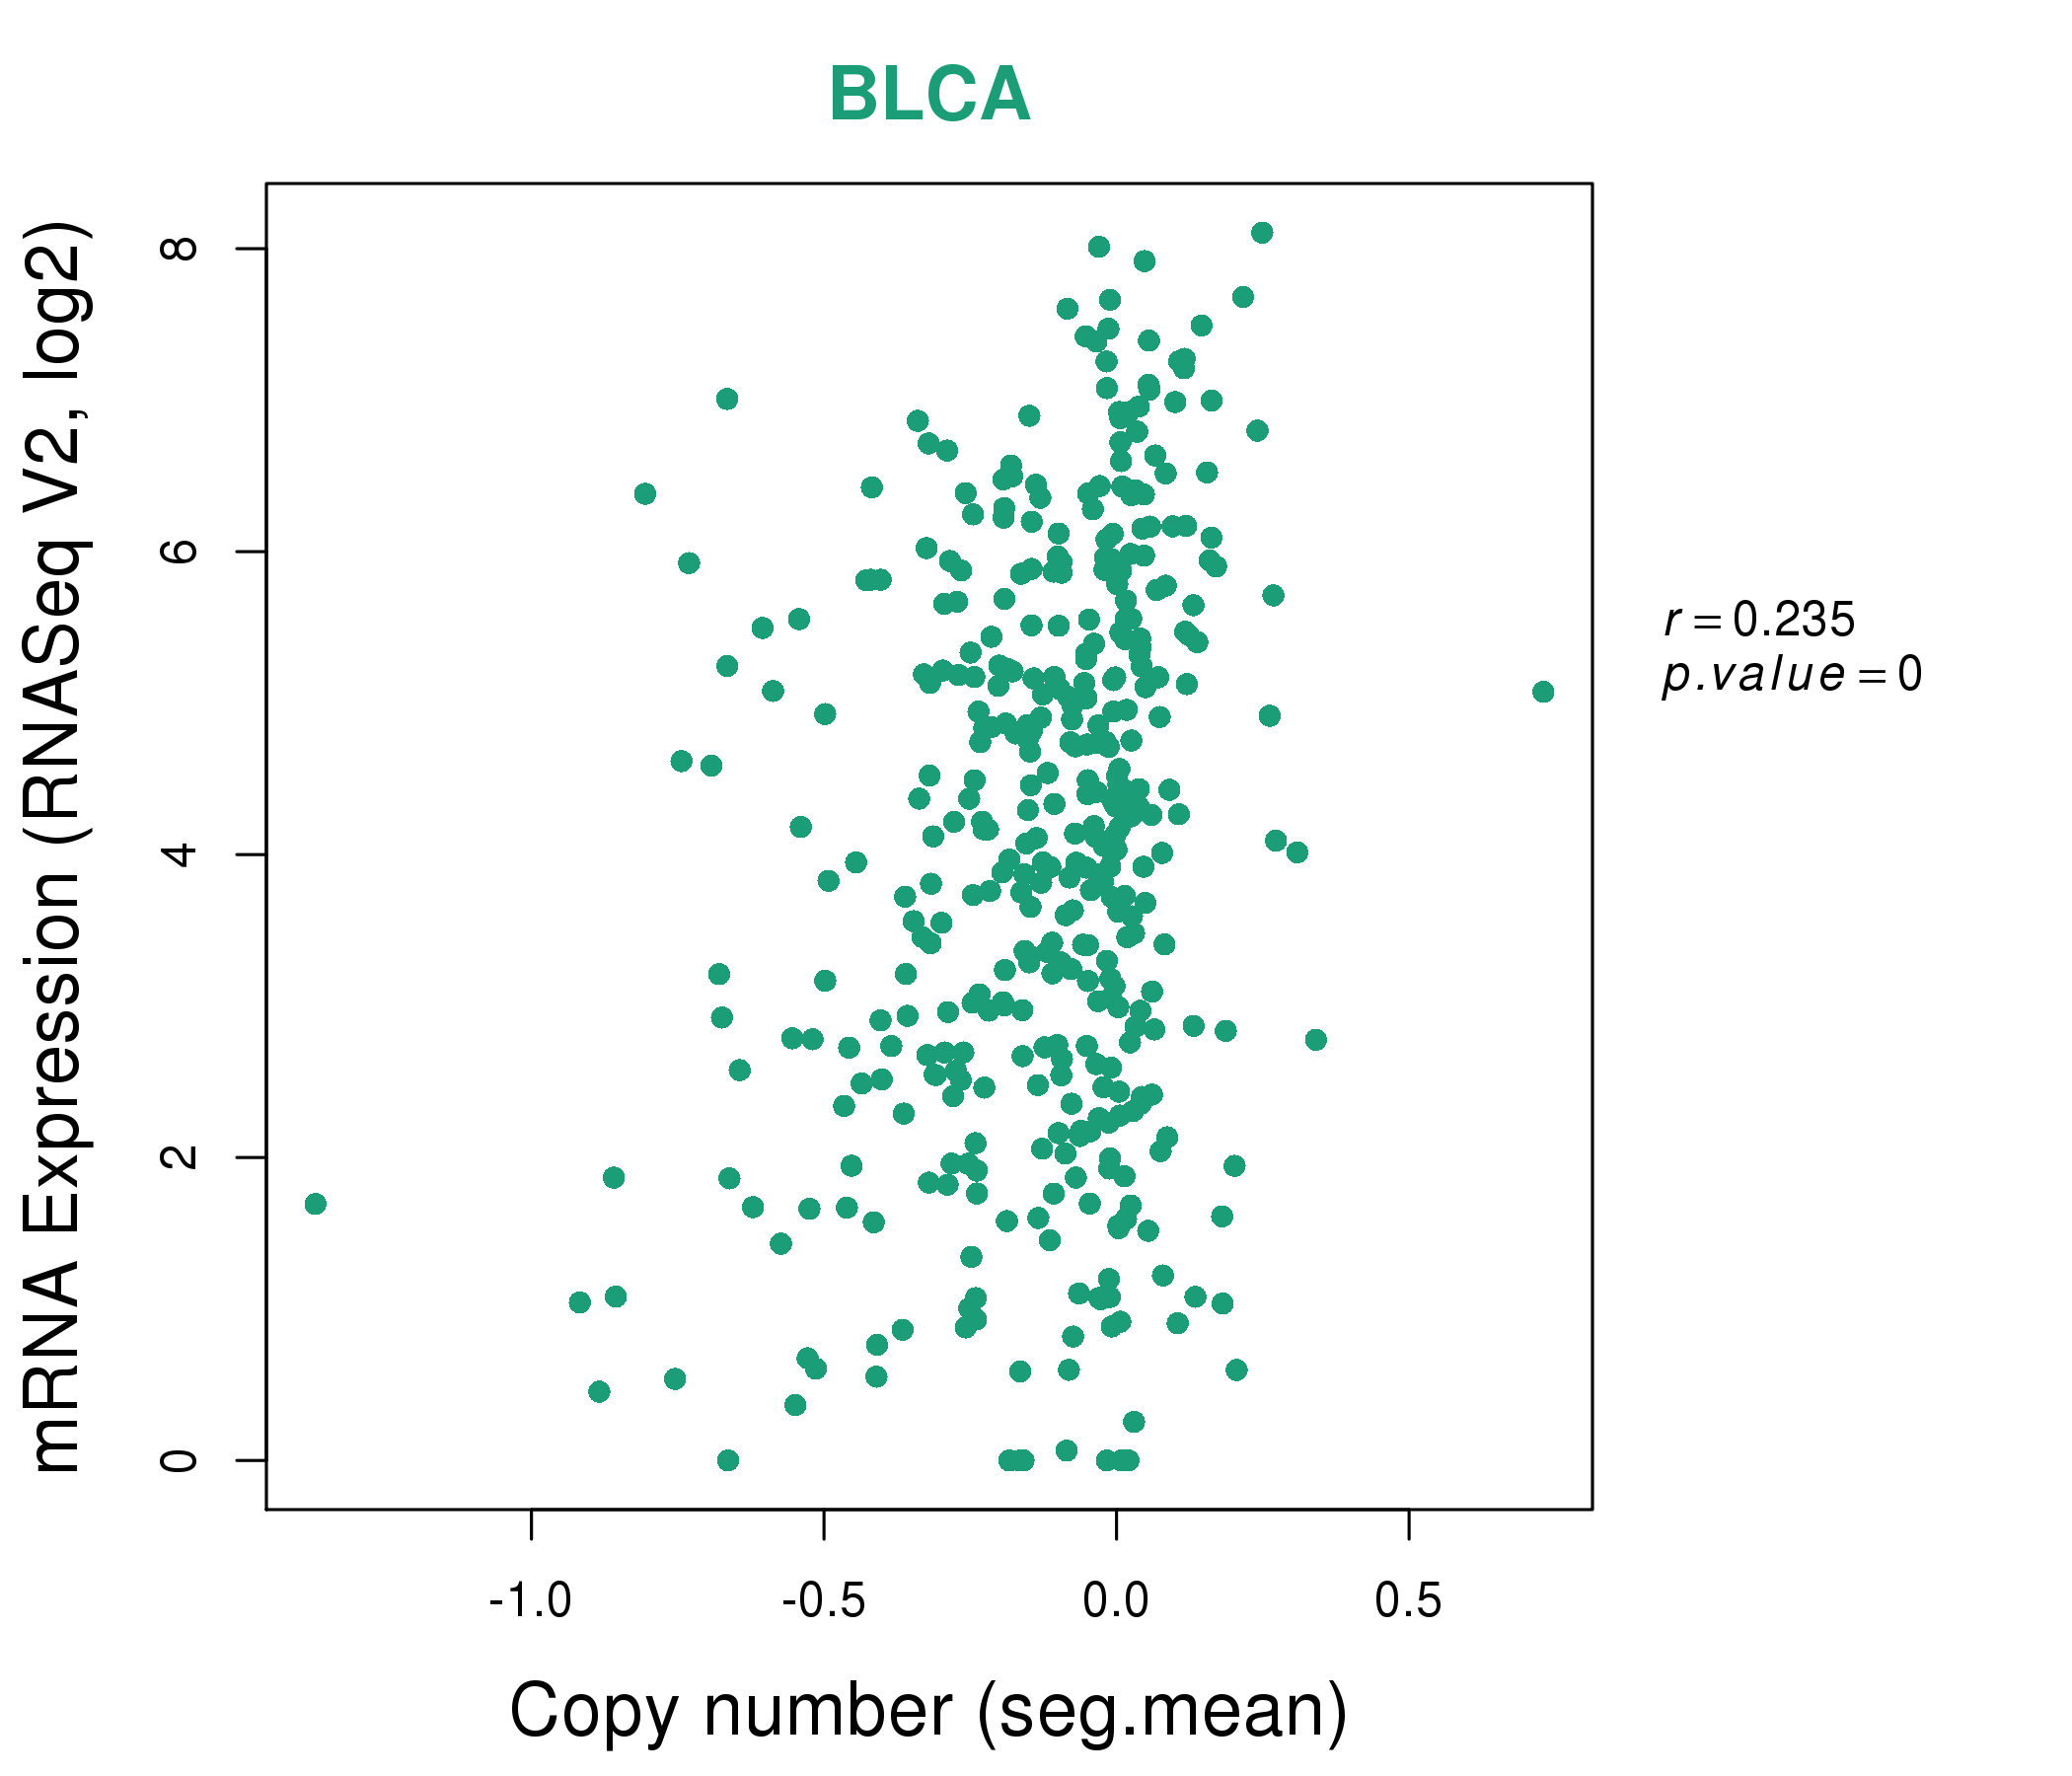
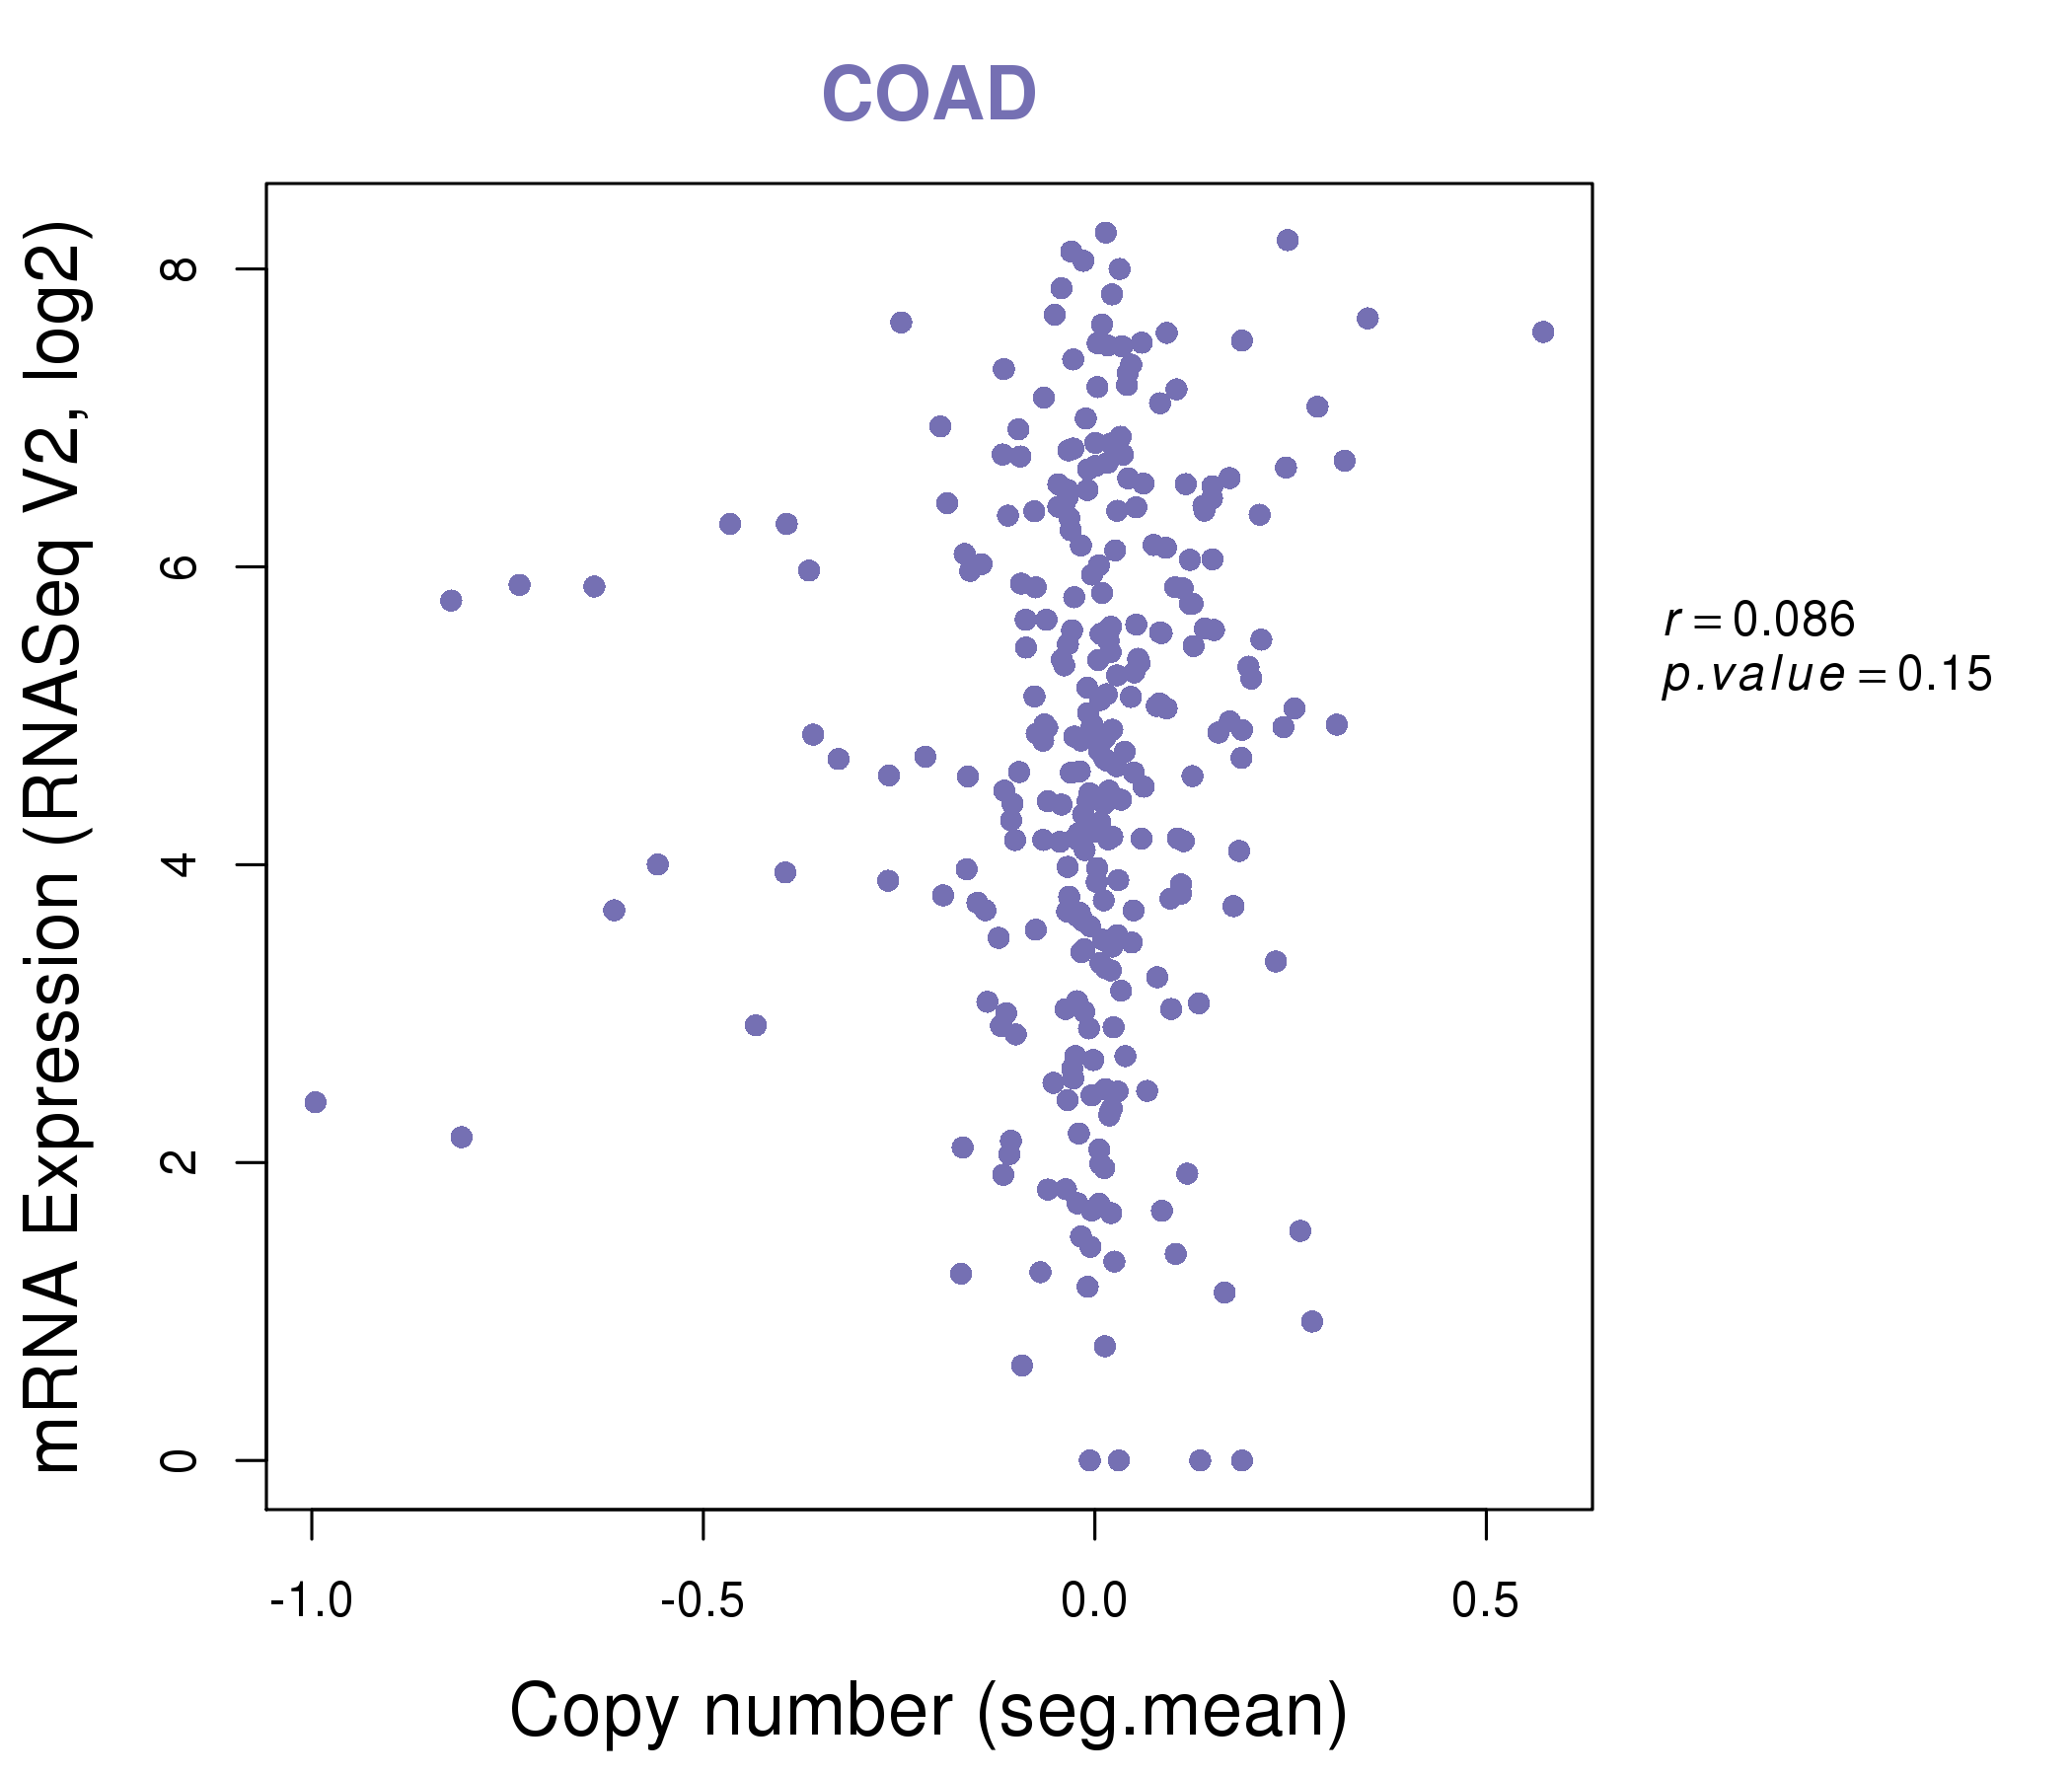
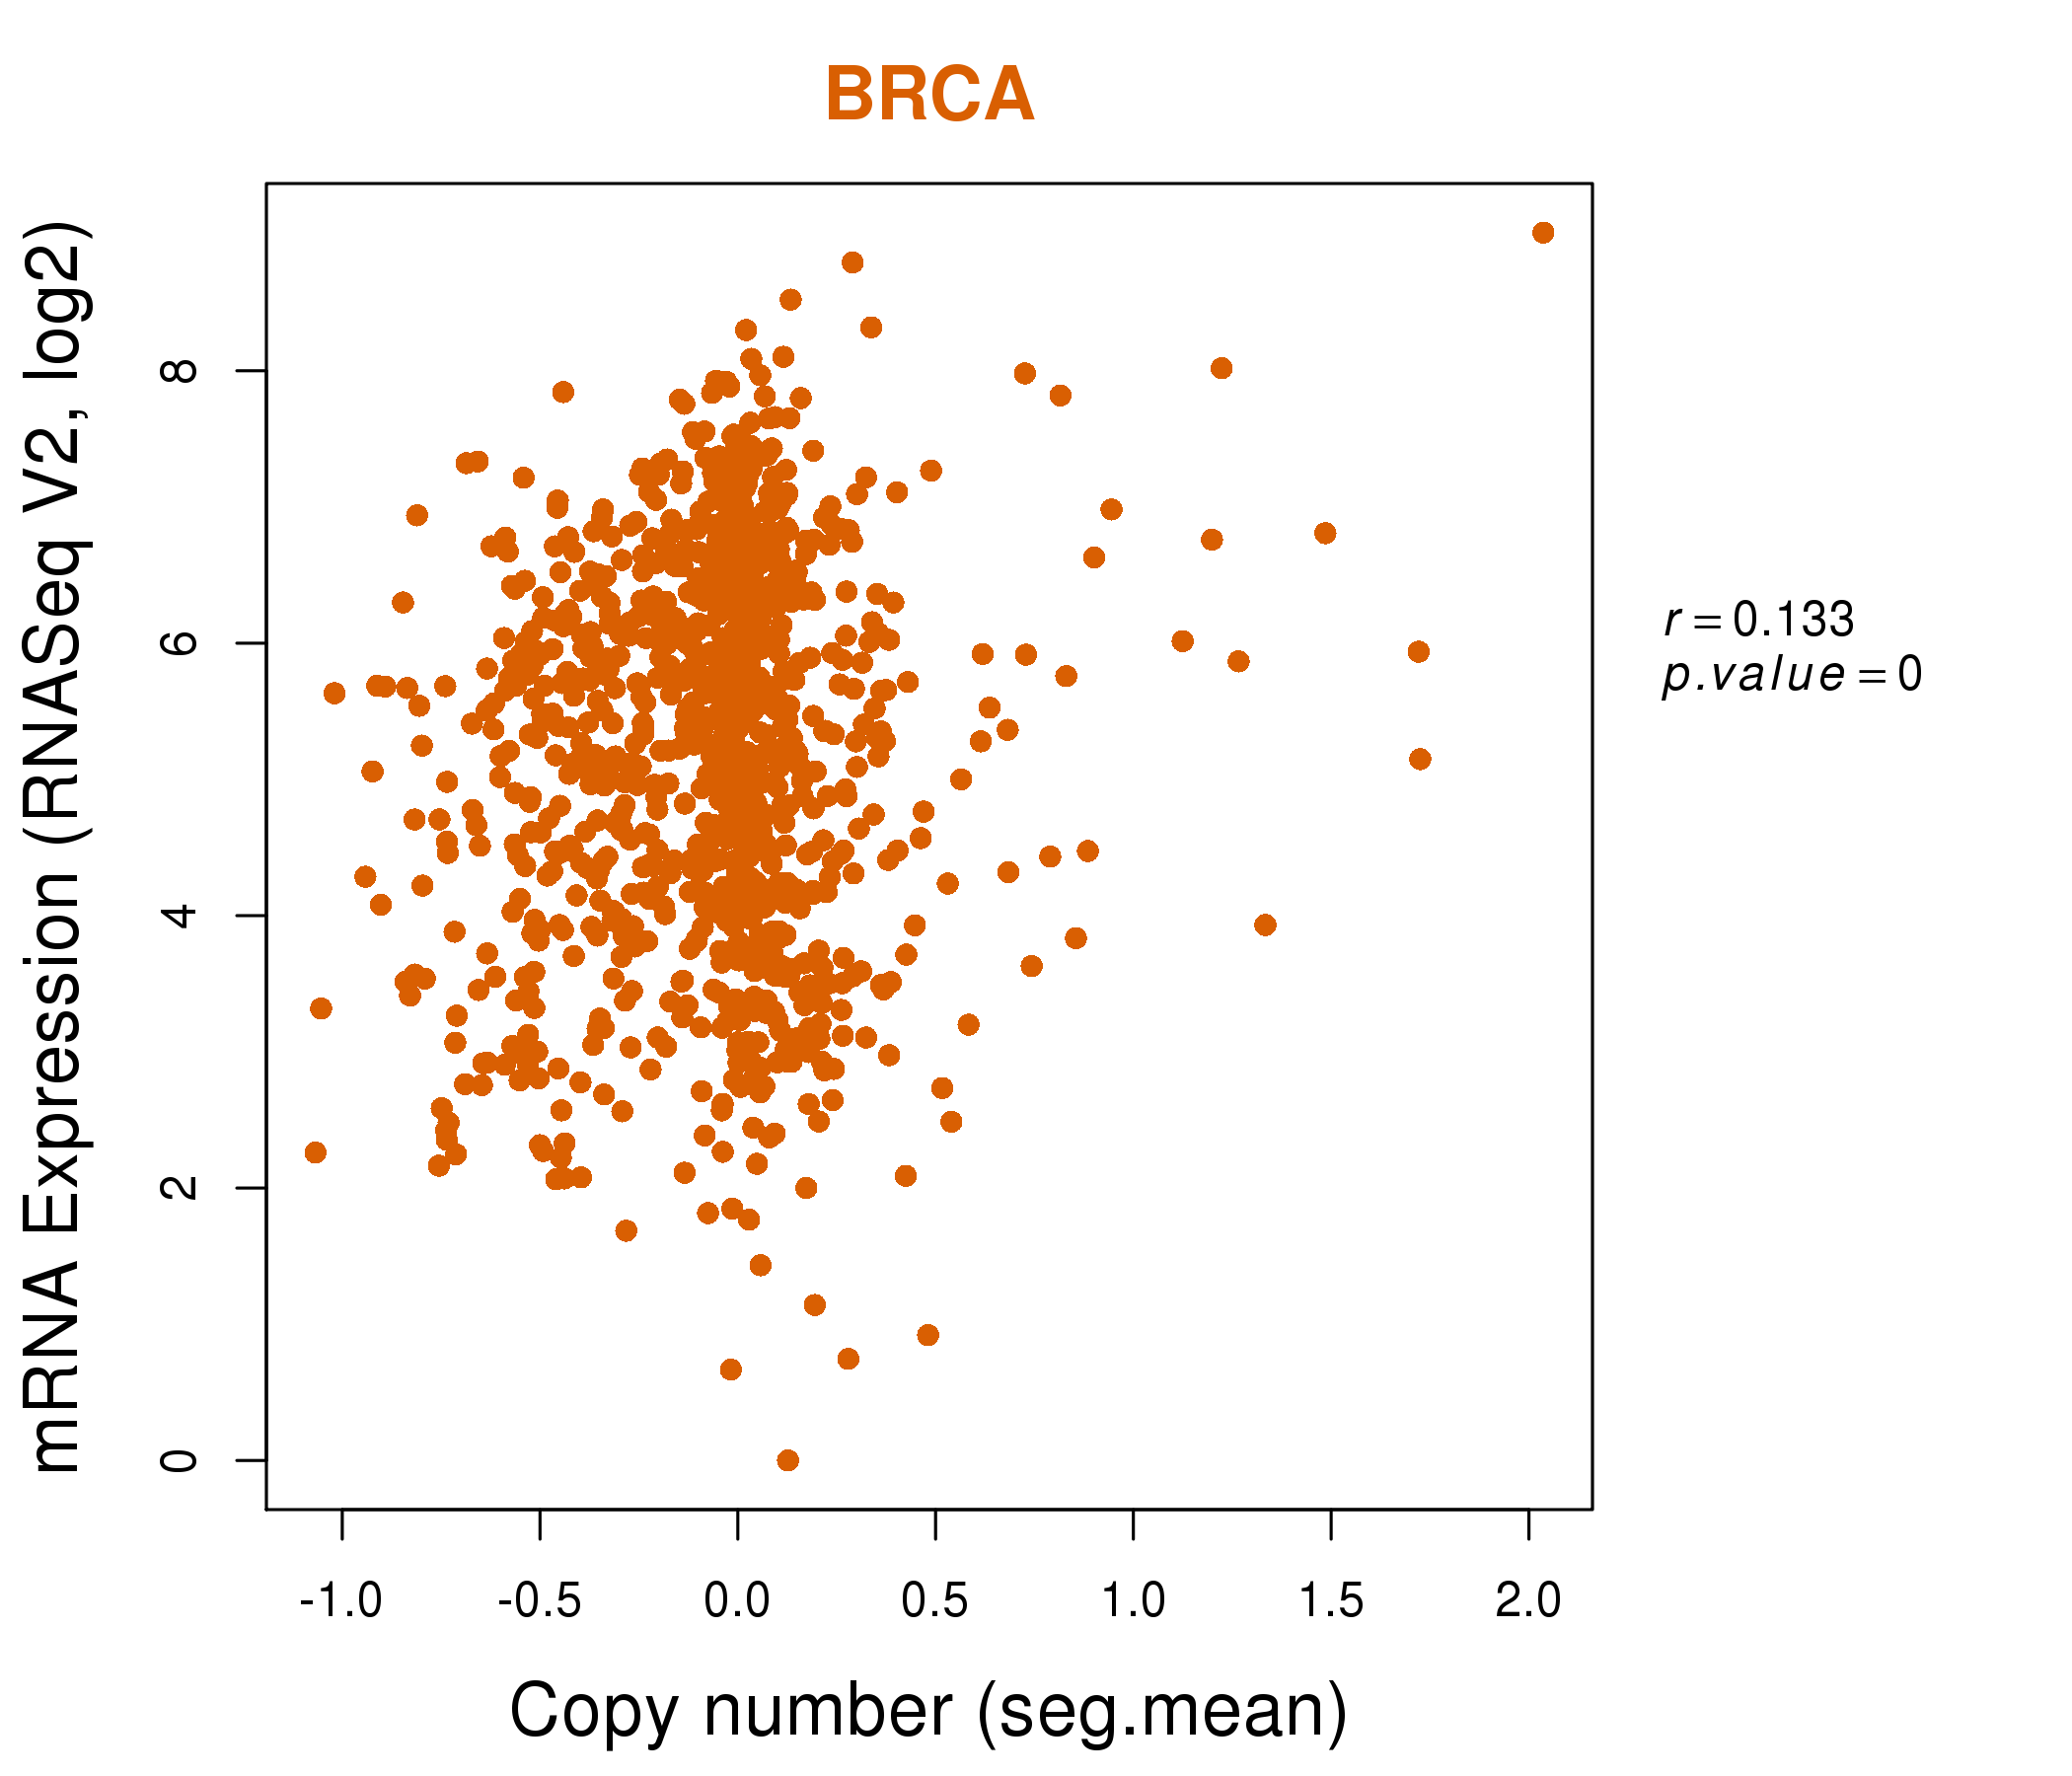
| * This plots show the correlation between CNV and gene expression. |
: Open all plots for all cancer types
 |
|
 |
|

| Top |
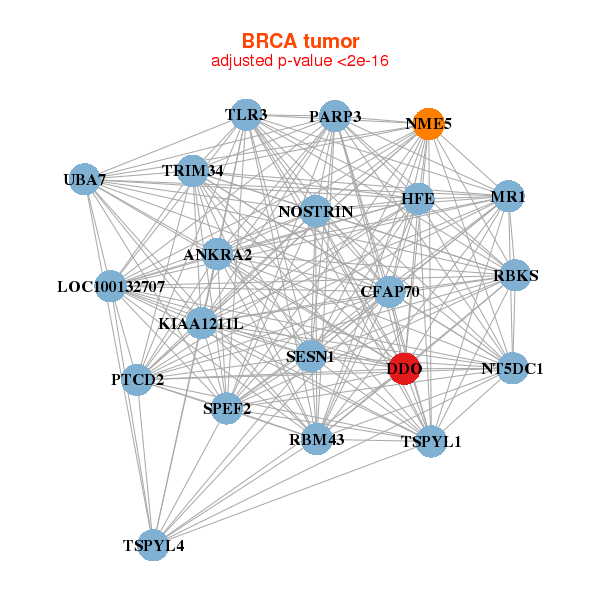
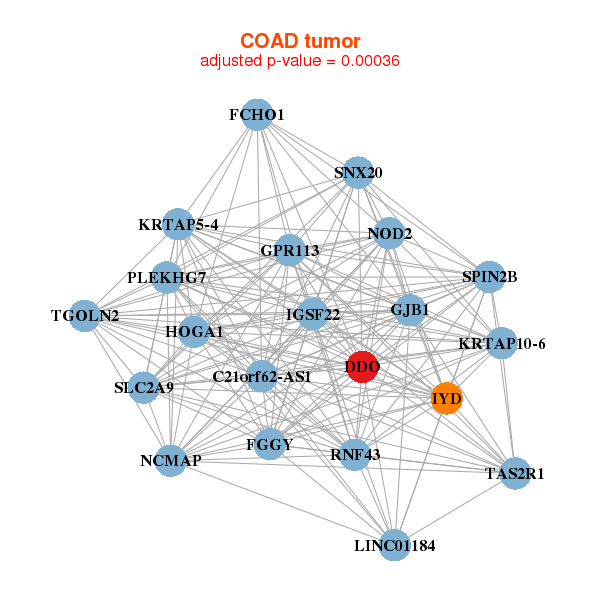
| Gene-Gene Network Information |
| * Co-Expression network figures were drawn using R package igraph. Only the top 20 genes with the highest correlations were shown. Red circle: input gene, orange circle: cell metabolism gene, sky circle: other gene |
: Open all plots for all cancer types
 |
|
| PITHD1,SZRD1,CALR,DDOST,DNAJB11,ENO1,KDM1A, EMC1,KIAA2013,LYPLA2,MRTO4,P4HB,PDIA4,PDIA5, PDIA6,PLOD1,PPIB,RCC2,RPN1,SEC61A1,SRM | AP1S1,APH1A,C11orf49,CAPN1,DDOST,EBNA1BP2,ERGIC3, GMDS,H2AFY2,MBOAT7,NIPSNAP1,NPM3,PAFAH1B3,PRPF19, RFC2,RNASEH2A,RUVBL1,SCAMP4,SLC35B2,STAP2,TMED3 |
 |
|
| AKR7A2,APITD1,C19orf10,PITHD1,SZRD1,MINOS1,KDF1, CDC42,DDOST,EIF3I,ENO1,GPN2,HMGN2,EMC1, MANF,MED18,MRTO4,NUDC,PPP1R8,SDF4,SDHB | APRT,BID,C19orf10,COPZ1,DDOST,ILF2,MTHFD2, NPM3,NUDT5,NUF2,NUP37,PCNA,PDIA6,PPIB, PRDX4,PYCR1,SNRPD3,SYNGR2,TMED3,TMED9,ZDHHC16 |
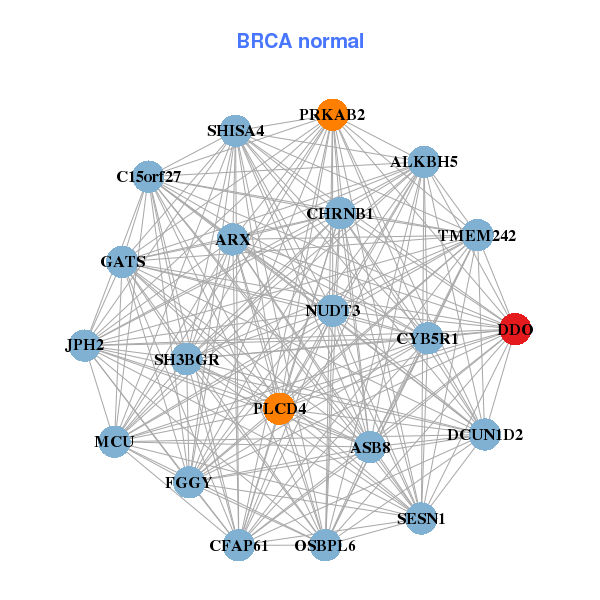
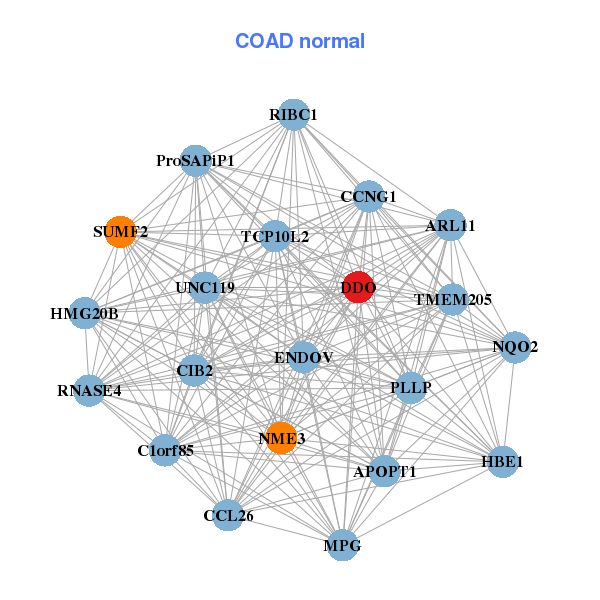
| * Co-Expression network figures were drawn using R package igraph. Only the top 20 genes with the highest correlations were shown. Red circle: input gene, orange circle: cell metabolism gene, sky circle: other gene |
: Open all plots for all cancer types
| Top |
: Open all interacting genes' information including KEGG pathway for all interacting genes from DAVID
| Top |
| Pharmacological Information for DDO |
| There's no related Drug. |
| Top |
| Cross referenced IDs for DDO |
| * We obtained these cross-references from Uniprot database. It covers 150 different DBs, 18 categories. http://www.uniprot.org/help/cross_references_section |
: Open all cross reference information
|
Copyright © 2016-Present - The Univsersity of Texas Health Science Center at Houston @ |