|
||||||||||||||||||||
| |
| Phenotypic Information (metabolism pathway, cancer, disease, phenome) |
| |
| |
| Gene-Gene Network Information: Co-Expression Network, Interacting Genes & KEGG |
| |
|


| Gene Summary for ALG2 |
| Basic gene info. | Gene symbol | ALG2 |
| Gene name | ALG2, alpha-1,3/1,6-mannosyltransferase | |
| Synonyms | CDGIi|NET38|hALPG2 | |
| Cytomap | UCSC genome browser: 9q22.33 | |
| Genomic location | chr9 :101978706-101984246 | |
| Type of gene | protein-coding | |
| RefGenes | NM_033087.3, NR_024532.1,NM_197973.2, | |
| Ensembl id | ENSG00000119523 | |
| Description | GDP-Man:Man(1)GlcNAc(2)-PP-Dol alpha-1,3-mannosyltransferaseGDP-Man:Man(1)GlcNAc(2)-PP-dolichol mannosyltransferaseGDP-Man:Man(2)GlcNAc(2)-PP-Dol alpha-1,6-mannosyltransferasealpha-1,3-mannosyltransferase ALG2alpha-1,3/1,6-mannosyltransferase ALG2asp | |
| Modification date | 20141222 | |
| dbXrefs | MIM : 607905 | |
| HGNC : HGNC | ||
| HPRD : 09716 | ||
| Protein | UniProt: go to UniProt's Cross Reference DB Table | |
| Expression | CleanEX: HS_ALG2 | |
| BioGPS: 85365 | ||
| Gene Expression Atlas: ENSG00000119523 | ||
| The Human Protein Atlas: ENSG00000119523 | ||
| Pathway | NCI Pathway Interaction Database: ALG2 | |
| KEGG: ALG2 | ||
| REACTOME: ALG2 | ||
| ConsensusPathDB | ||
| Pathway Commons: ALG2 | ||
| Metabolism | MetaCyc: ALG2 | |
| HUMANCyc: ALG2 | ||
| Regulation | Ensembl's Regulation: ENSG00000119523 | |
| miRBase: chr9 :101,978,706-101,984,246 | ||
| TargetScan: NM_033087 | ||
| cisRED: ENSG00000119523 | ||
| Context | iHOP: ALG2 | |
| cancer metabolism search in PubMed: ALG2 | ||
| UCL Cancer Institute: ALG2 | ||
| Assigned class in ccmGDB | C | |
| Top |
| Phenotypic Information for ALG2(metabolism pathway, cancer, disease, phenome) |
| Cancer | CGAP: ALG2 |
| Familial Cancer Database: ALG2 | |
| * This gene is included in those cancer gene databases. |
|
|
|
|
|
| . | ||||||||||||||
Oncogene 1 | Significant driver gene in | |||||||||||||||||||
| cf) number; DB name 1 Oncogene; http://nar.oxfordjournals.org/content/35/suppl_1/D721.long, 2 Tumor Suppressor gene; https://bioinfo.uth.edu/TSGene/, 3 Cancer Gene Census; http://www.nature.com/nrc/journal/v4/n3/abs/nrc1299.html, 4 CancerGenes; http://nar.oxfordjournals.org/content/35/suppl_1/D721.long, 5 Network of Cancer Gene; http://ncg.kcl.ac.uk/index.php, 1Therapeutic Vulnerabilities in Cancer; http://cbio.mskcc.org/cancergenomics/statius/ |
| REACTOME_METABOLISM_OF_PROTEINS | |
| OMIM | |
| Orphanet | |
| Disease | KEGG Disease: ALG2 |
| MedGen: ALG2 (Human Medical Genetics with Condition) | |
| ClinVar: ALG2 | |
| Phenotype | MGI: ALG2 (International Mouse Phenotyping Consortium) |
| PhenomicDB: ALG2 | |
| Mutations for ALG2 |
| * Under tables are showing count per each tissue to give us broad intuition about tissue specific mutation patterns.You can go to the detailed page for each mutation database's web site. |
| - Statistics for Tissue and Mutation type | Top |
 |
| - For Inter-chromosomal Variations |
| There's no inter-chromosomal structural variation. |
| - For Intra-chromosomal Variations |
| There's no intra-chromosomal structural variation. |
| Sample | Symbol_a | Chr_a | Start_a | End_a | Symbol_b | Chr_b | Start_b | End_b |
| cf) Tissue number; Tissue name (1;Breast, 2;Central_nervous_system, 3;Haematopoietic_and_lymphoid_tissue, 4;Large_intestine, 5;Liver, 6;Lung, 7;Ovary, 8;Pancreas, 9;Prostate, 10;Skin, 11;Soft_tissue, 12;Upper_aerodigestive_tract) |
| * From mRNA Sanger sequences, Chitars2.0 arranged chimeric transcripts. This table shows ALG2 related fusion information. |
| ID | Head Gene | Tail Gene | Accession | Gene_a | qStart_a | qEnd_a | Chromosome_a | tStart_a | tEnd_a | Gene_a | qStart_a | qEnd_a | Chromosome_a | tStart_a | tEnd_a |
| AI371982 | TNRC6C | 1 | 276 | 17 | 76100746 | 76101021 | ALG2 | 273 | 494 | 9 | 101980528 | 101980749 | |
| Top |
| There's no copy number variation information in COSMIC data for this gene. |
| Top |
|
 |
| Top |
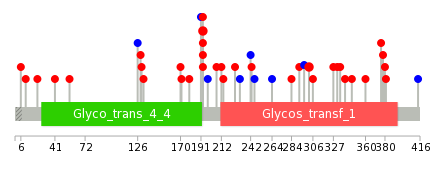
| Stat. for Non-Synonymous SNVs (# total SNVs=28) | (# total SNVs=6) |
 |  |
(# total SNVs=0) | (# total SNVs=0) |
| Top |
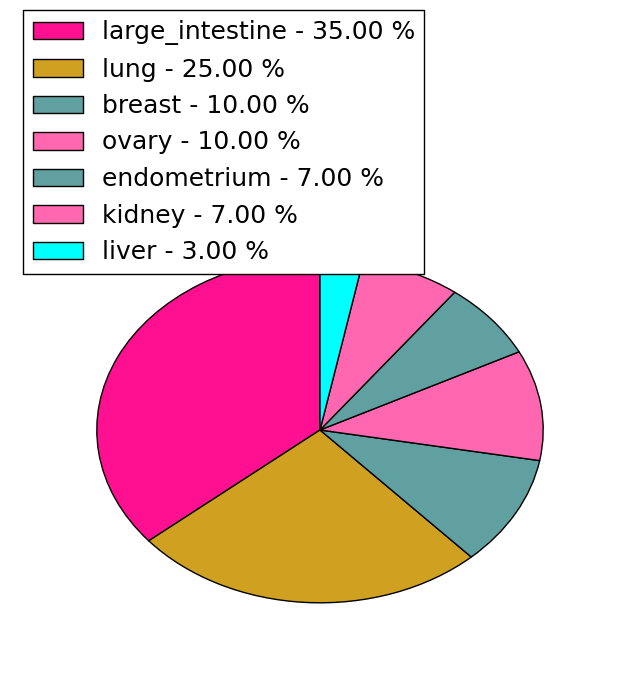
| * When you move the cursor on each content, you can see more deailed mutation information on the Tooltip. Those are primary_site,primary_histology,mutation(aa),pubmedID. |
| GRCh37 position | Mutation(aa) | Unique sampleID count |
| chr9:101980889-101980889 | p.H193R | 4 |
| chr9:101980890-101980890 | p.H193Y | 2 |
| chr9:101980562-101980562 | p.S302Y | 2 |
| chr9:101980847-101980847 | p.S207N | 1 |
| chr9:101981082-101981082 | p.R129W | 1 |
| chr9:101980334-101980334 | p.R378P | 1 |
| chr9:101980593-101980593 | p.D292N | 1 |
| chr9:101980873-101980873 | p.V198V | 1 |
| chr9:101981091-101981091 | p.L126L | 1 |
| chr9:101980340-101980340 | p.F376S | 1 |
| Top |
|
 |
| Point Mutation/ Tissue ID | 1 | 2 | 3 | 4 | 5 | 6 | 7 | 8 | 9 | 10 | 11 | 12 | 13 | 14 | 15 | 16 | 17 | 18 | 19 | 20 |
| # sample | 3 | 2 | 8 | 3 | 1 | 1 | 3 | 5 | 1 | 1 | 5 | 1 | 2 | |||||||
| # mutation | 3 | 2 | 5 | 3 | 1 | 1 | 4 | 5 | 1 | 1 | 5 | 1 | 3 | |||||||
| nonsynonymous SNV | 2 | 2 | 5 | 2 | 1 | 3 | 3 | 1 | 4 | 1 | 2 | |||||||||
| synonymous SNV | 1 | 1 | 1 | 1 | 2 | 1 | 1 | 1 |
| cf) Tissue ID; Tissue type (1; BLCA[Bladder Urothelial Carcinoma], 2; BRCA[Breast invasive carcinoma], 3; CESC[Cervical squamous cell carcinoma and endocervical adenocarcinoma], 4; COAD[Colon adenocarcinoma], 5; GBM[Glioblastoma multiforme], 6; Glioma Low Grade, 7; HNSC[Head and Neck squamous cell carcinoma], 8; KICH[Kidney Chromophobe], 9; KIRC[Kidney renal clear cell carcinoma], 10; KIRP[Kidney renal papillary cell carcinoma], 11; LAML[Acute Myeloid Leukemia], 12; LUAD[Lung adenocarcinoma], 13; LUSC[Lung squamous cell carcinoma], 14; OV[Ovarian serous cystadenocarcinoma ], 15; PAAD[Pancreatic adenocarcinoma], 16; PRAD[Prostate adenocarcinoma], 17; SKCM[Skin Cutaneous Melanoma], 18:STAD[Stomach adenocarcinoma], 19:THCA[Thyroid carcinoma], 20:UCEC[Uterine Corpus Endometrial Carcinoma]) |
| Top |
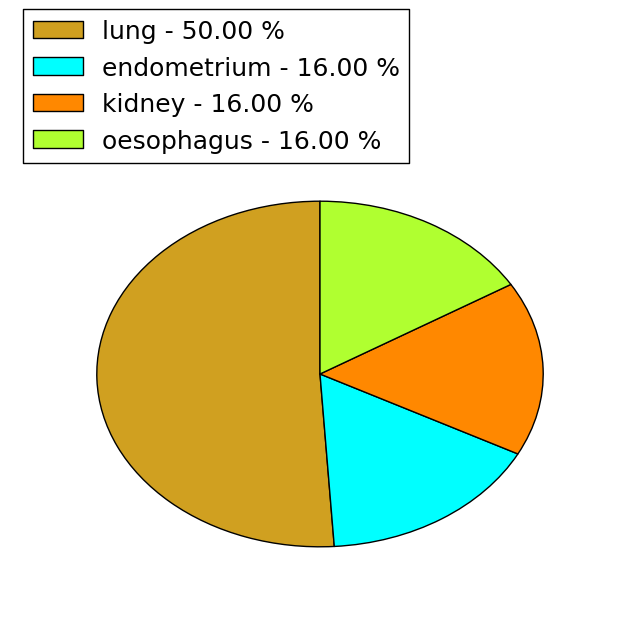
| * We represented just top 10 SNVs. When you move the cursor on each content, you can see more deailed mutation information on the Tooltip. Those are primary_site, primary_histology, mutation(aa), pubmedID. |
| Genomic Position | Mutation(aa) | Unique sampleID count |
| chr9:101980889 | p.H193R | 4 |
| chr9:101980890 | p.P366L | 2 |
| chr9:101980370 | p.H193Y | 2 |
| chr9:101980562 | p.S302Y | 2 |
| chr9:101980615 | p.F226I | 1 |
| chr9:101980325 | p.R409R | 1 |
| chr9:101980621 | p.E214K | 1 |
| chr9:101980896 | p.S381F | 1 |
| chr9:101980329 | p.V212A | 1 |
| chr9:101980675 | p.P380S | 1 |
| * Copy number data were extracted from TCGA using R package TCGA-Assembler. The URLs of all public data files on TCGA DCC data server were gathered on Jan-05-2015. Function ProcessCNAData in TCGA-Assembler package was used to obtain gene-level copy number value which is calculated as the average copy number of the genomic region of a gene. |
 |
| cf) Tissue ID[Tissue type]: BLCA[Bladder Urothelial Carcinoma], BRCA[Breast invasive carcinoma], CESC[Cervical squamous cell carcinoma and endocervical adenocarcinoma], COAD[Colon adenocarcinoma], GBM[Glioblastoma multiforme], Glioma Low Grade, HNSC[Head and Neck squamous cell carcinoma], KICH[Kidney Chromophobe], KIRC[Kidney renal clear cell carcinoma], KIRP[Kidney renal papillary cell carcinoma], LAML[Acute Myeloid Leukemia], LUAD[Lung adenocarcinoma], LUSC[Lung squamous cell carcinoma], OV[Ovarian serous cystadenocarcinoma ], PAAD[Pancreatic adenocarcinoma], PRAD[Prostate adenocarcinoma], SKCM[Skin Cutaneous Melanoma], STAD[Stomach adenocarcinoma], THCA[Thyroid carcinoma], UCEC[Uterine Corpus Endometrial Carcinoma] |
| Top |
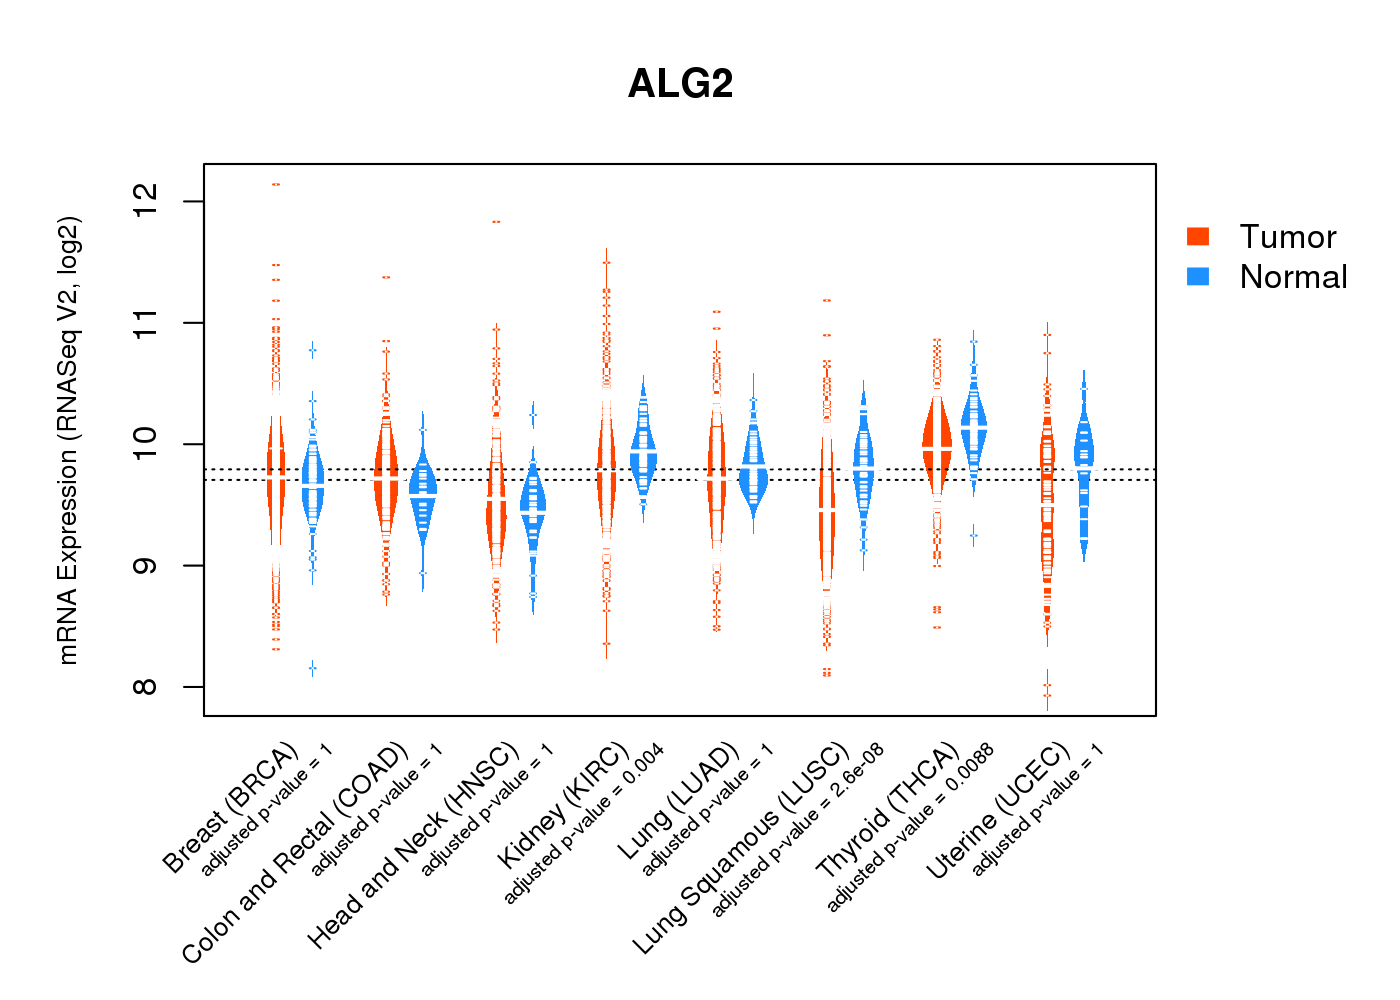
| Gene Expression for ALG2 |
| * CCLE gene expression data were extracted from CCLE_Expression_Entrez_2012-10-18.res: Gene-centric RMA-normalized mRNA expression data. |
 |
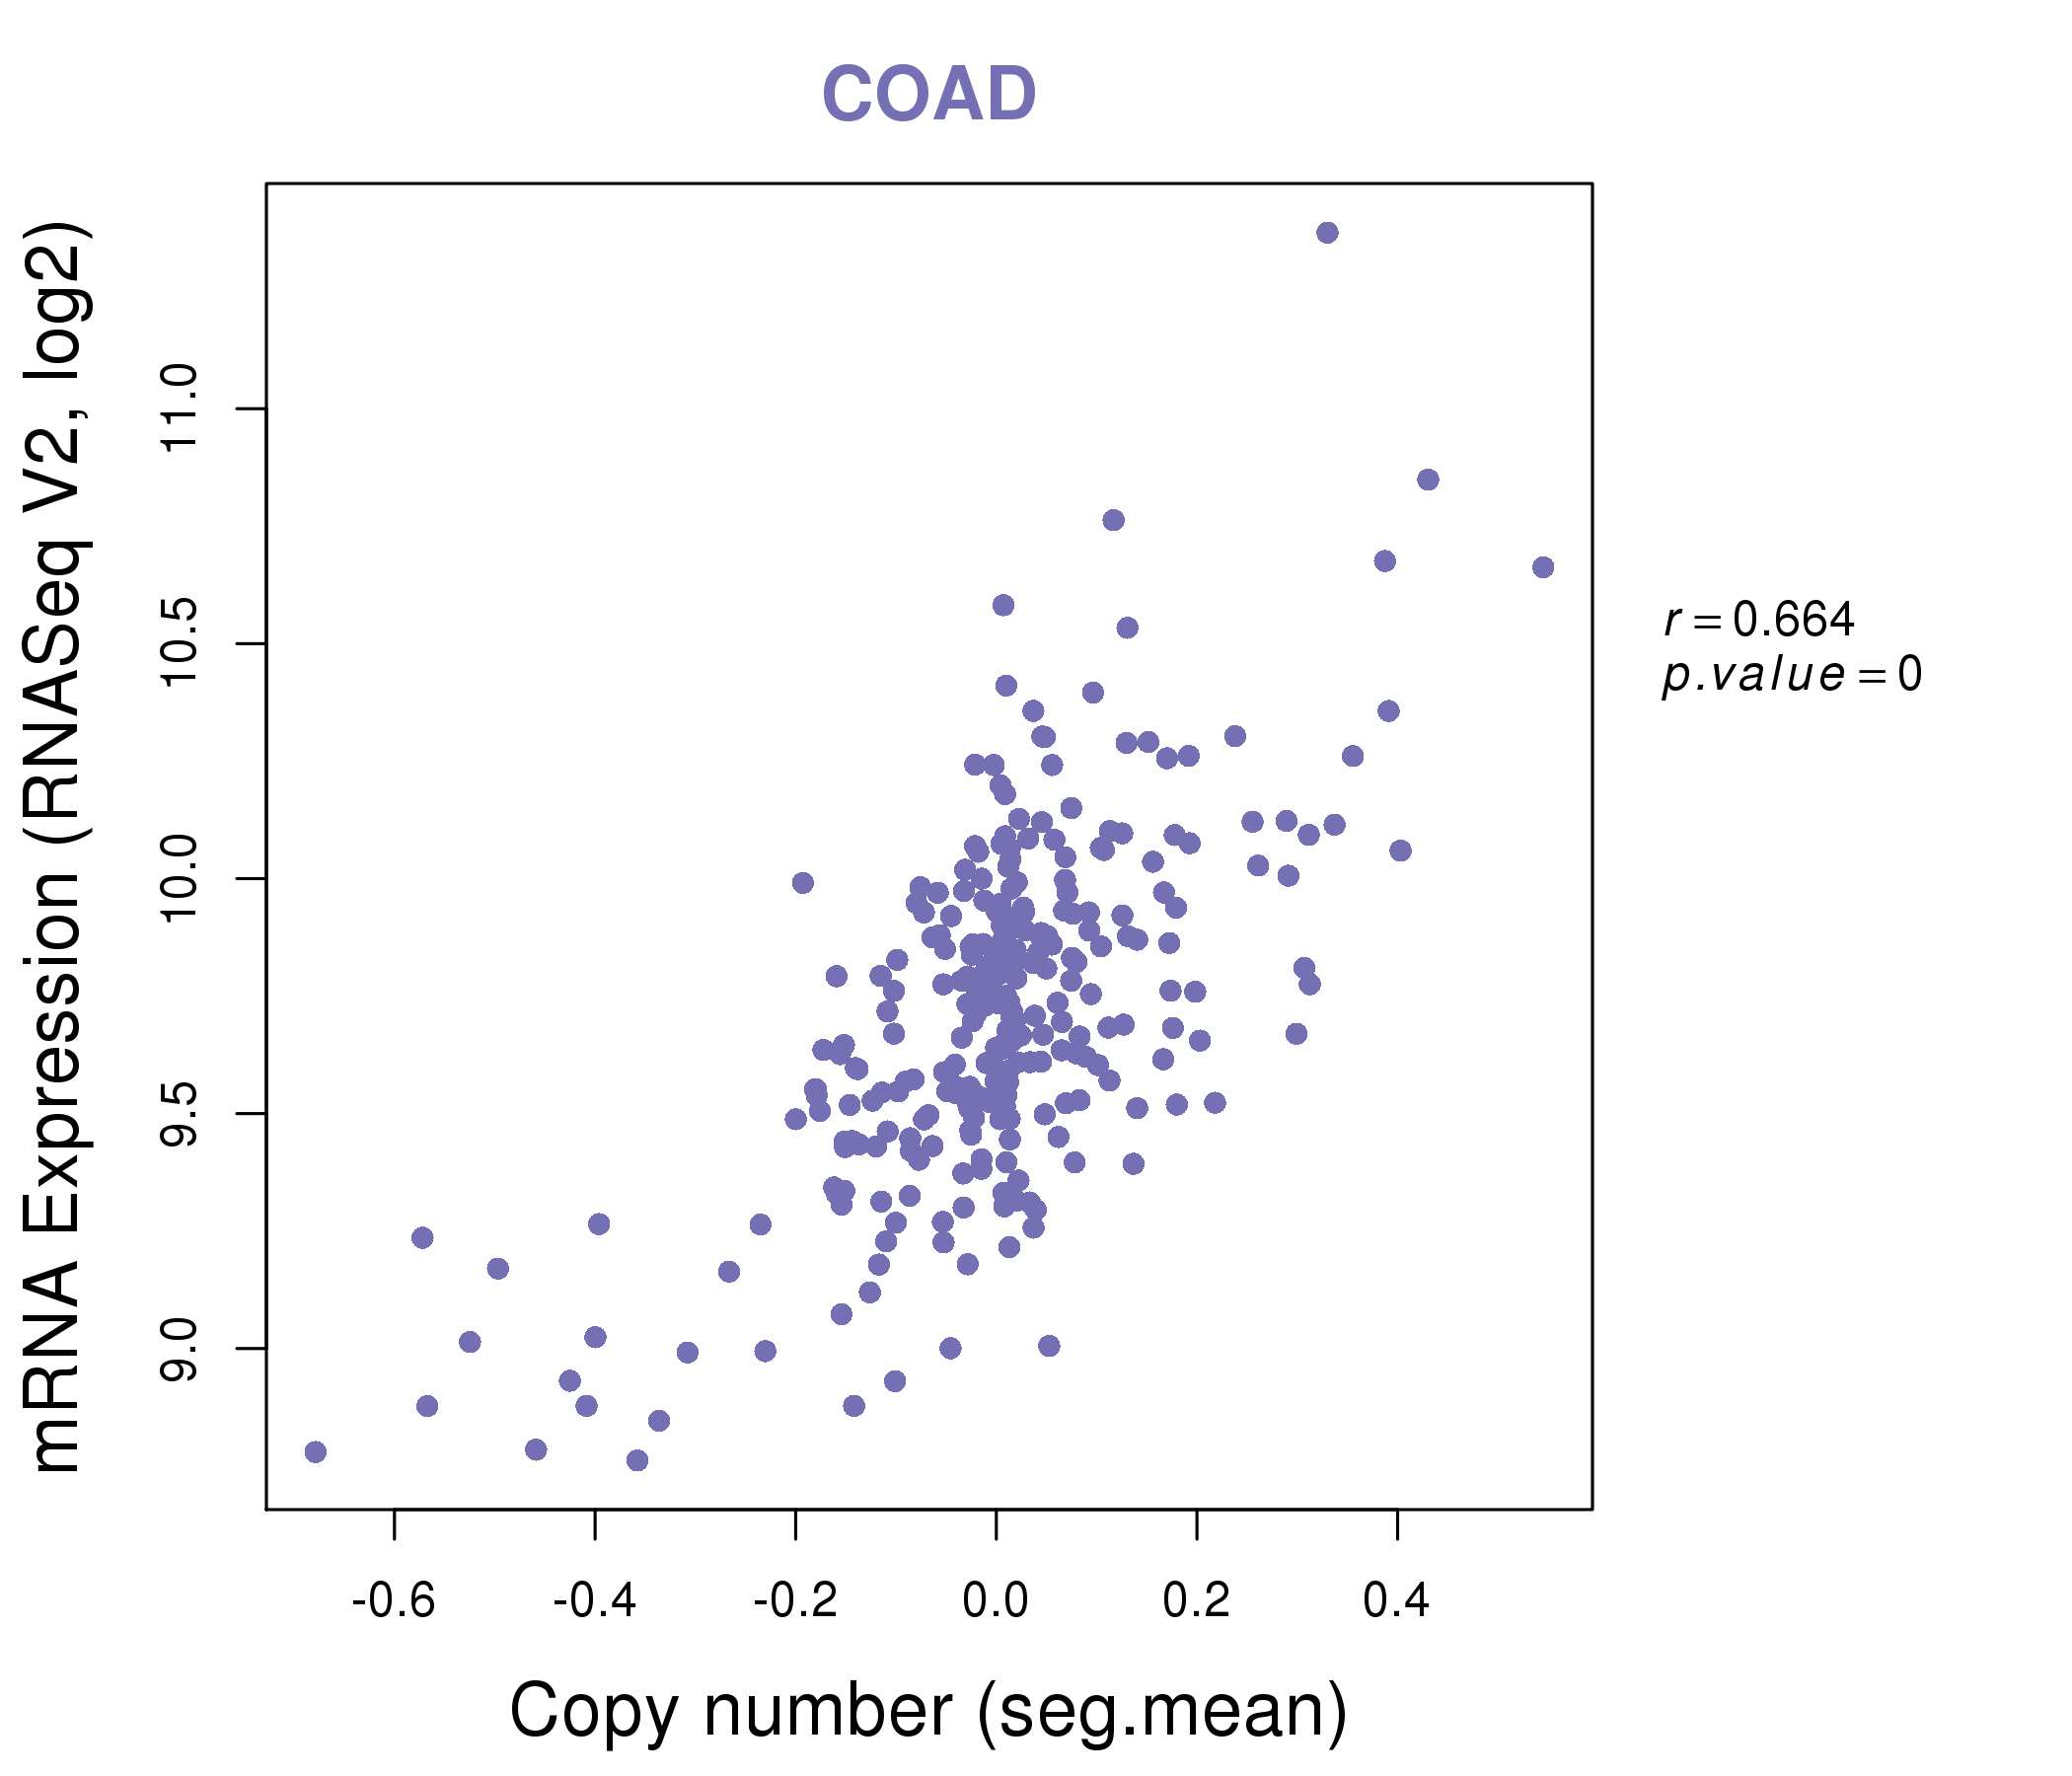
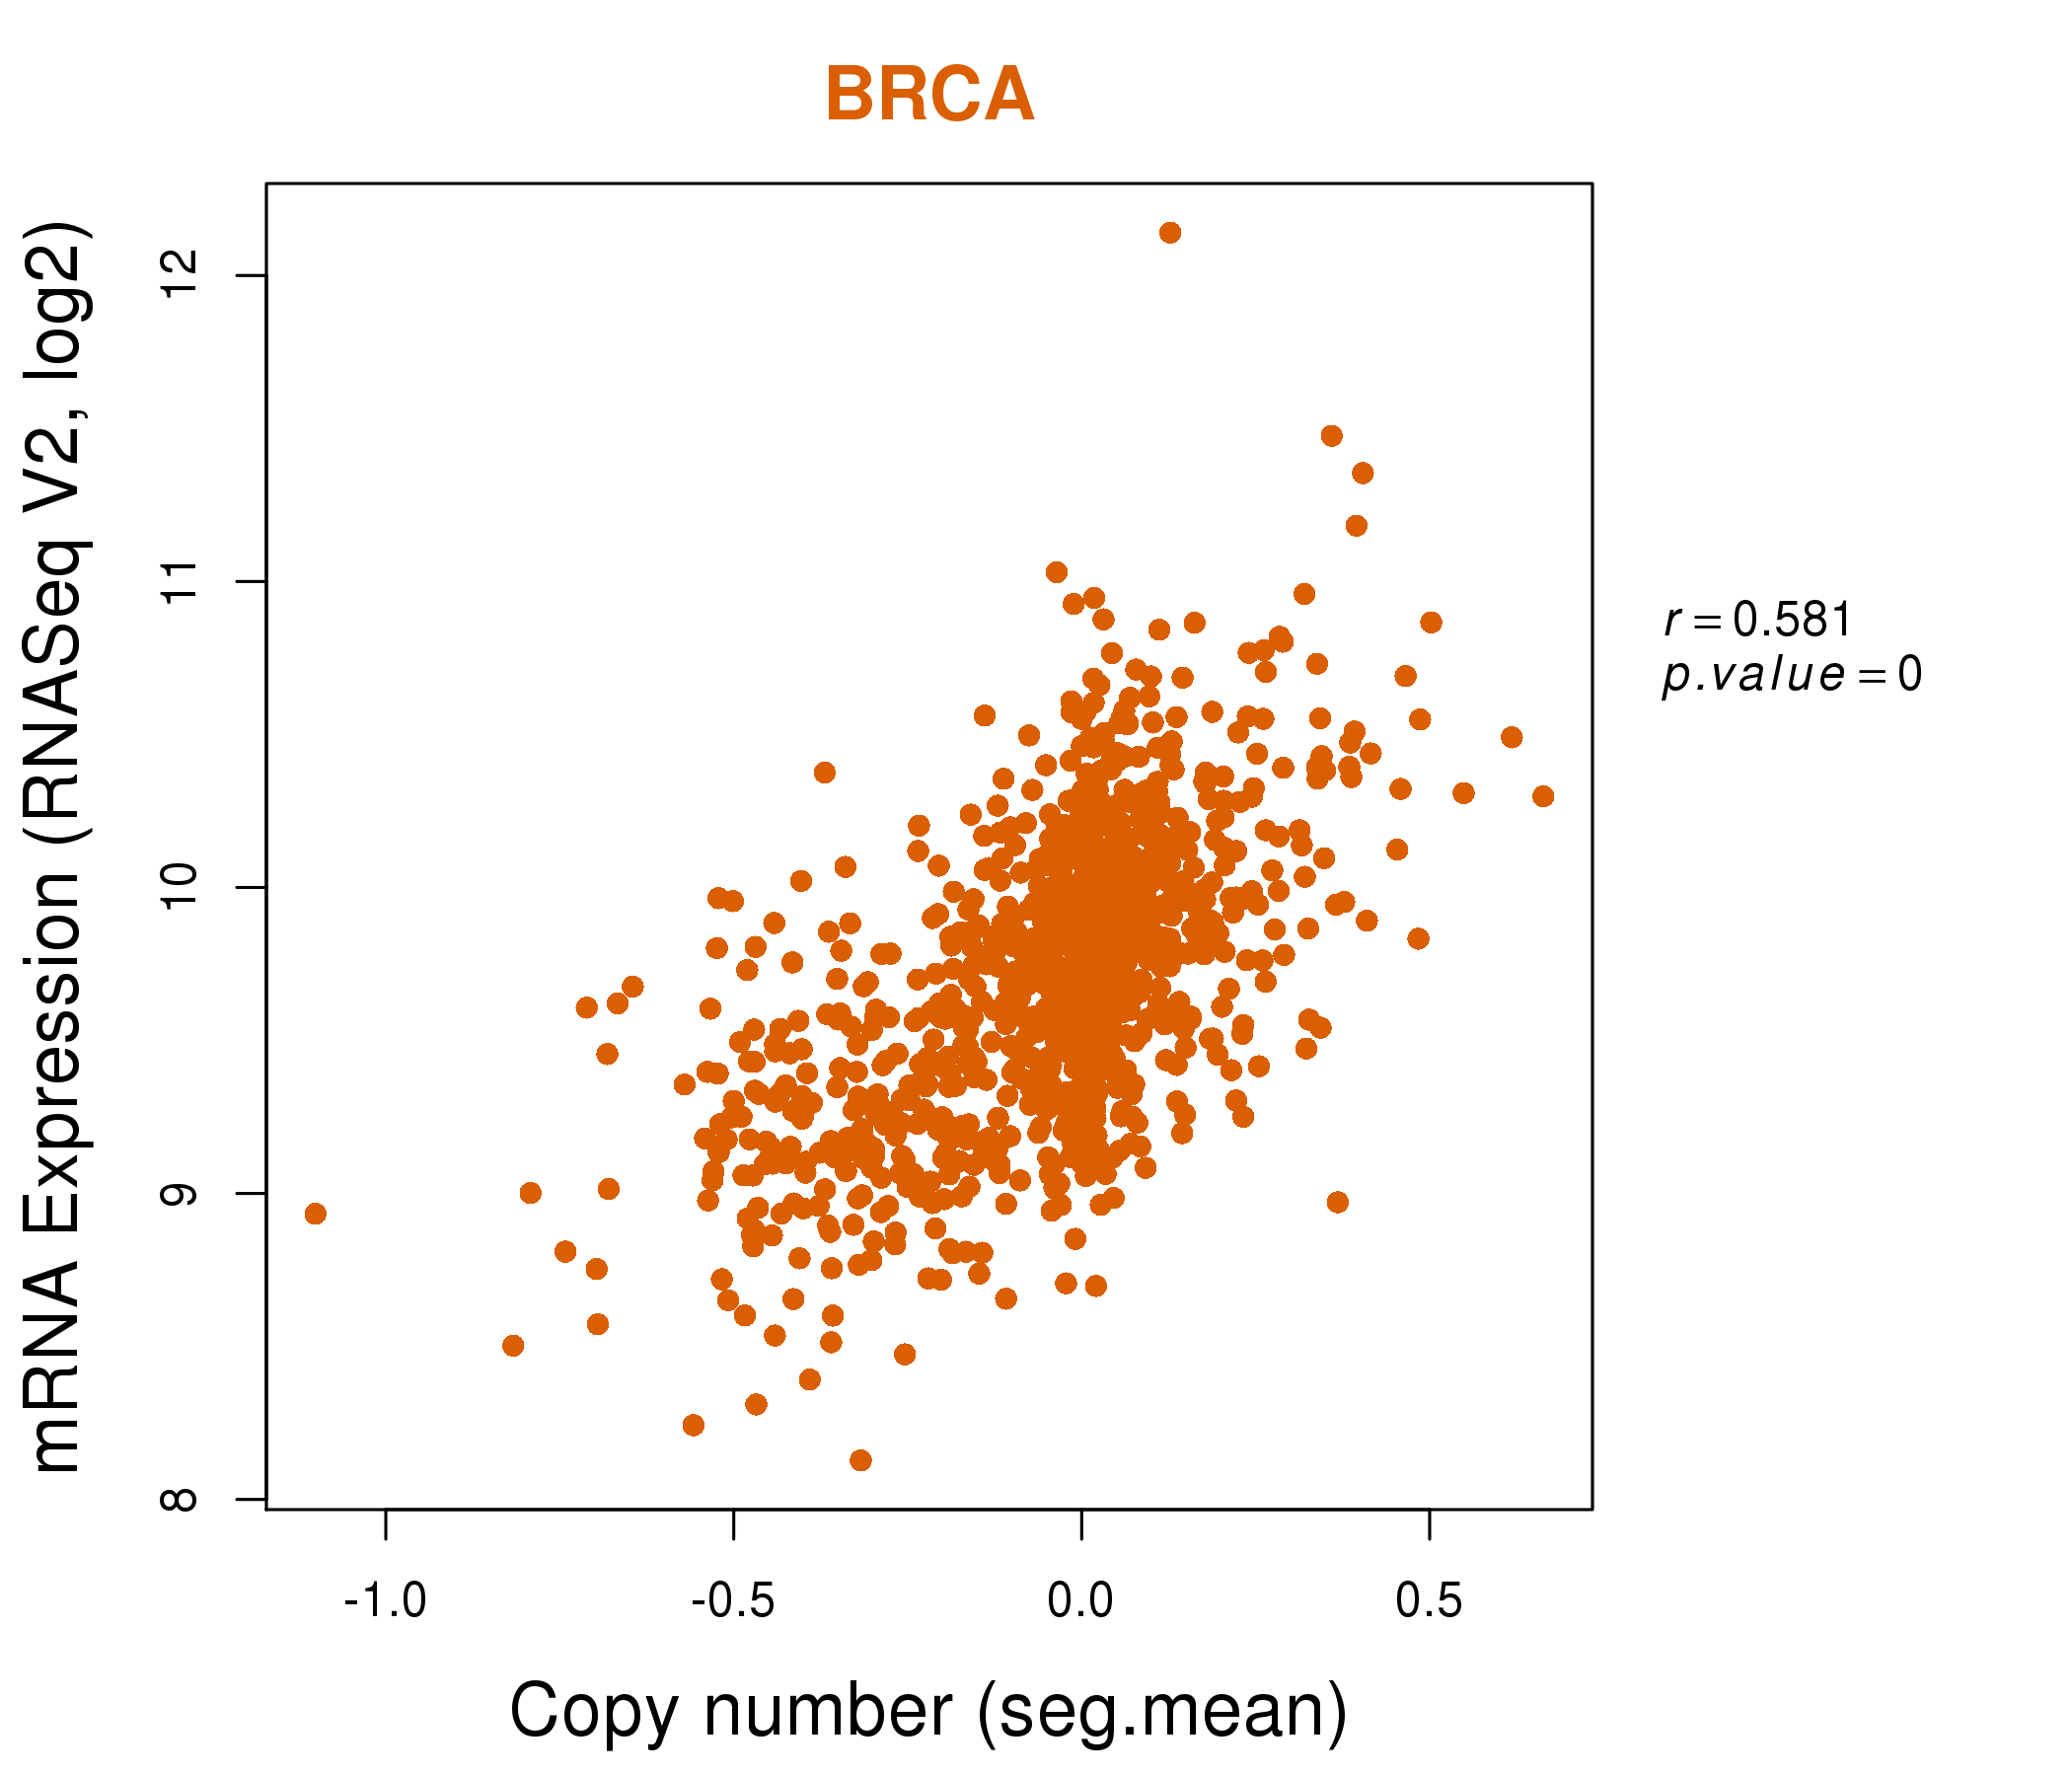
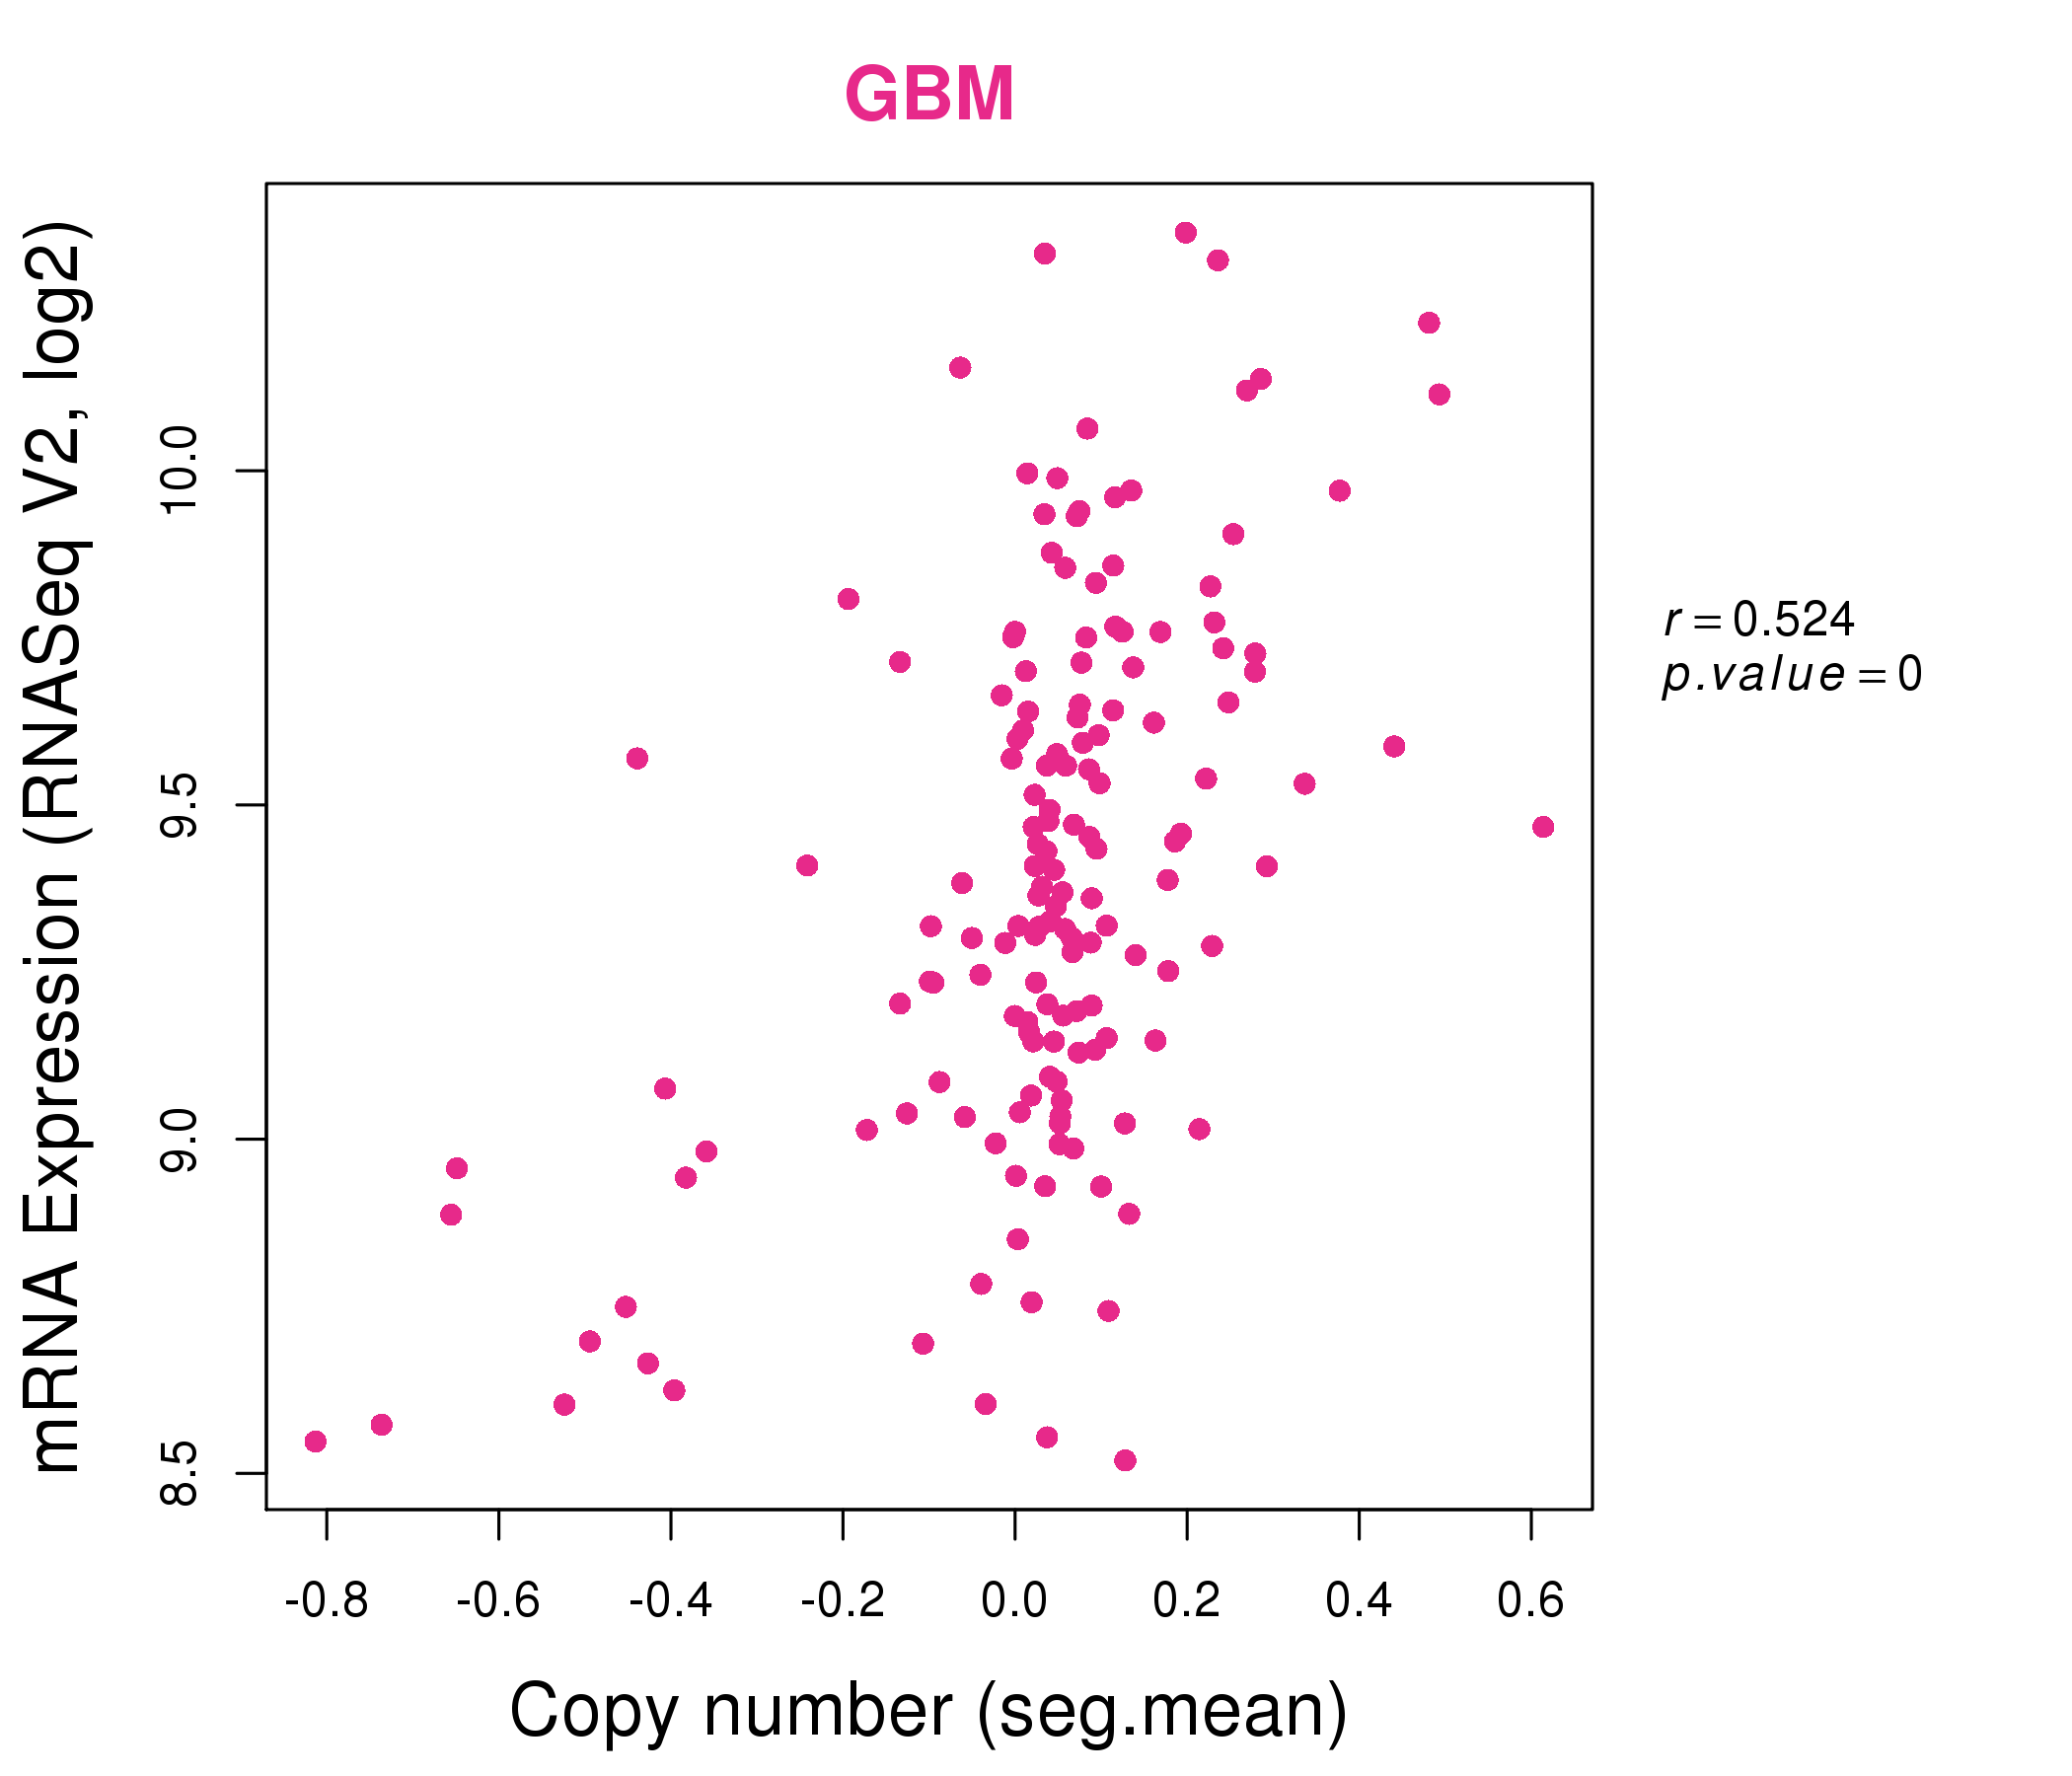
| * Normalized gene expression data of RNASeqV2 was extracted from TCGA using R package TCGA-Assembler. The URLs of all public data files on TCGA DCC data server were gathered at Jan-05-2015. Only eight cancer types have enough normal control samples for differential expression analysis. (t test, adjusted p<0.05 (using Benjamini-Hochberg FDR)) |
 |
| Top |
| * This plots show the correlation between CNV and gene expression. |
: Open all plots for all cancer types
 |
|
 |
|
| Top |
| Gene-Gene Network Information |
| * Co-Expression network figures were drawn using R package igraph. Only the top 20 genes with the highest correlations were shown. Red circle: input gene, orange circle: cell metabolism gene, sky circle: other gene |
: Open all plots for all cancer types
 |
|
| ALG2,C9orf156,FAM206A,DNAJB9,DNAJC25,ERP44,FAM120A, FAM120AOS,HIATL1,ISCA1,MRPL50,NAA35,PSMD5,RAB14, RAD23B,RNF103,RNF20,SEC61B,SPTLC1,STX17,ZNF189 | ADO,ADSS,ALG2,SMIM15,CISD2,DAZAP2,HPRT1, IQCK,LOC653566,MARCKS,MYCBP,NPTN,PERP,RAB14, SERP1,TMCO1,TMEM14A,TMEM33,TMEM9B,TP53RK,YWHAQ |
 |
|
| ALG2,ATP6V1G1,C9orf156,CAAP1,C9orf85,CHMP5,DNAJC25, DOLK,ERP44,FXN,ISCA1,ISCA1P1,MRPL50,NANS, POLE3,PSMD5,SEC61B,SERP1,SRPRB,SURF4,TEX10 | ADPGK,ALG2,VWA9,DCBLD1,ERLIN1,FAM136A,KIAA0391, MEST,MIOS,MRPS30,MRRF,PIGF,RFWD2,RINT1, SERP1,SHQ1,SLC30A5,SLC30A9,TMED5,UTP18,XBP1 |

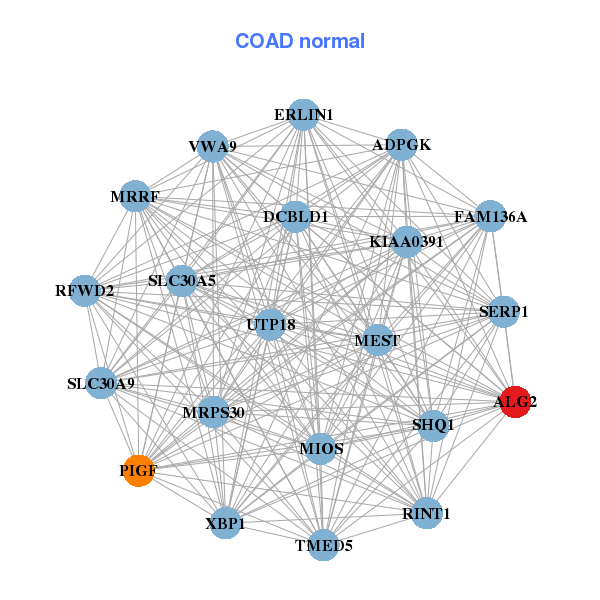
| * Co-Expression network figures were drawn using R package igraph. Only the top 20 genes with the highest correlations were shown. Red circle: input gene, orange circle: cell metabolism gene, sky circle: other gene |
: Open all plots for all cancer types
| Top |
: Open all interacting genes' information including KEGG pathway for all interacting genes from DAVID
| Top |
| Pharmacological Information for ALG2 |
| There's no related Drug. |
| Top |
| Cross referenced IDs for ALG2 |
| * We obtained these cross-references from Uniprot database. It covers 150 different DBs, 18 categories. http://www.uniprot.org/help/cross_references_section |
: Open all cross reference information
|
Copyright © 2016-Present - The Univsersity of Texas Health Science Center at Houston @ |