|
||||||||||||||||||||||||||||||||||||||||||||||||||||||||||||||||||||||||||||||||||||||||||||||||||||||||||||||||||||||||||||||||||||||||||||||||||||||||||||||||||||||||||||||||||||||||||||||||||||||||||||||||||||||||||||||||||||||||||||||||||||||||||||||||||||||||||||||||||||||||||||||||||||||||||||||||||||||||||
| |
| Phenotypic Information (metabolism pathway, cancer, disease, phenome) |
| |
| |
| Gene-Gene Network Information: Co-Expression Network, Interacting Genes & KEGG |
| |
|


| Gene Summary for TNKS1BP1 |
| Top |
| Phenotypic Information for TNKS1BP1(metabolism pathway, cancer, disease, phenome) |
| Cancer | CGAP: TNKS1BP1 |
| Familial Cancer Database: TNKS1BP1 | |
| * This gene is included in those cancer gene databases. |
|
|
|
|
|
| . | ||||||||||||||||||||||||||||||||||||||||||||||||||||||||||||||||||||||||||||||||||||||||||||||||||||||||||||||||||||||||||||||||||||||||||||||||||||||||||||||||||||||||||||||||||||||||||||||||||||||||||||||||||||||||||||||||||||||||||||||||||||||||||||||||||||||||||||||||||||||||||||||||||||||||||||||||||||
Oncogene 1 | Significant driver gene in | |||||||||||||||||||||||||||||||||||||||||||||||||||||||||||||||||||||||||||||||||||||||||||||||||||||||||||||||||||||||||||||||||||||||||||||||||||||||||||||||||||||||||||||||||||||||||||||||||||||||||||||||||||||||||||||||||||||||||||||||||||||||||||||||||||||||||||||||||||||||||||||||||||||||||||||||||||||||||
| cf) number; DB name 1 Oncogene; http://nar.oxfordjournals.org/content/35/suppl_1/D721.long, 2 Tumor Suppressor gene; https://bioinfo.uth.edu/TSGene/, 3 Cancer Gene Census; http://www.nature.com/nrc/journal/v4/n3/abs/nrc1299.html, 4 CancerGenes; http://nar.oxfordjournals.org/content/35/suppl_1/D721.long, 5 Network of Cancer Gene; http://ncg.kcl.ac.uk/index.php, 1Therapeutic Vulnerabilities in Cancer; http://cbio.mskcc.org/cancergenomics/statius/ |
| REACTOME_METABOLISM_OF_MRNA REACTOME_METABOLISM_OF_RNA | |
| Mutations for TNKS1BP1 |
| * Under tables are showing count per each tissue to give us broad intuition about tissue specific mutation patterns.You can go to the detailed page for each mutation database's web site. |
| - Statistics for Tissue and Mutation type | Top |
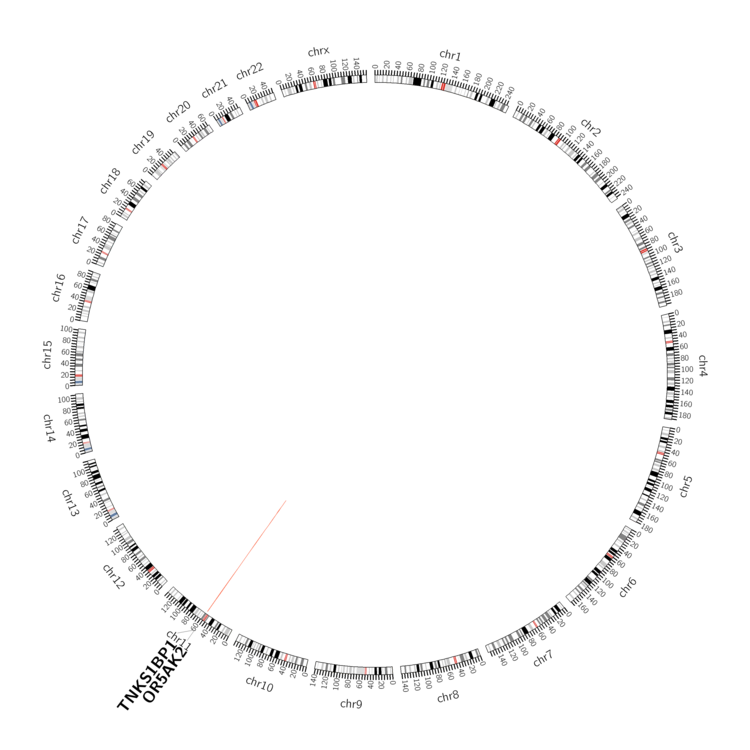 |
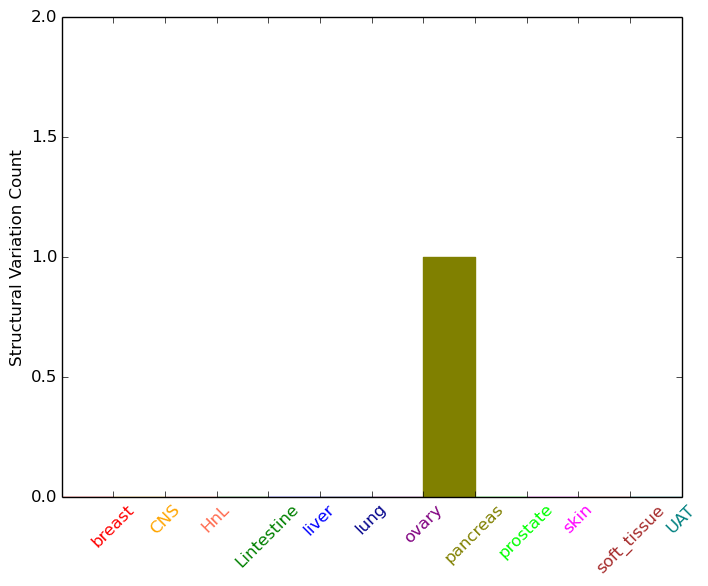
| - For Inter-chromosomal Variations |
| There's no inter-chromosomal structural variation. |
| - For Intra-chromosomal Variations |
| * Intra-chromosomal variantions includes 'intrachromosomal amplicon to amplicon', 'intrachromosomal amplicon to non-amplified dna', 'intrachromosomal deletion', 'intrachromosomal fold-back inversion', 'intrachromosomal inversion', 'intrachromosomal tandem duplication', 'Intrachromosomal unknown type', 'intrachromosomal with inverted orientation', 'intrachromosomal with non-inverted orientation'. |
 |
| Sample | Symbol_a | Chr_a | Start_a | End_a | Symbol_b | Chr_b | Start_b | End_b |
| pancreas | TNKS1BP1 | chr11 | 57070857 | 57070877 | OR5AK2 | chr11 | 56756813 | 56756833 |
| cf) Tissue number; Tissue name (1;Breast, 2;Central_nervous_system, 3;Haematopoietic_and_lymphoid_tissue, 4;Large_intestine, 5;Liver, 6;Lung, 7;Ovary, 8;Pancreas, 9;Prostate, 10;Skin, 11;Soft_tissue, 12;Upper_aerodigestive_tract) |
| * From mRNA Sanger sequences, Chitars2.0 arranged chimeric transcripts. This table shows TNKS1BP1 related fusion information. |
| ID | Head Gene | Tail Gene | Accession | Gene_a | qStart_a | qEnd_a | Chromosome_a | tStart_a | tEnd_a | Gene_a | qStart_a | qEnd_a | Chromosome_a | tStart_a | tEnd_a |
| BF810602 | TNKS1BP1 | 2 | 202 | 11 | 57077167 | 57077371 | MACF1 | 198 | 363 | 1 | 39802872 | 39806207 | |
| BG436080 | TNKS1BP1 | 1 | 106 | 11 | 57083289 | 57083394 | PSG3 | 102 | 672 | 19 | 43407538 | 43411312 | |
| BF812770 | ZNF207 | 18 | 156 | 17 | 30700470 | 30700610 | TNKS1BP1 | 142 | 380 | 11 | 57074938 | 57075174 | |
| BF844047 | FHL2 | 82 | 103 | 2 | 106025408 | 106025429 | TNKS1BP1 | 92 | 356 | 11 | 57067207 | 57067473 | |
| BF950679 | NLGN3 | 5 | 401 | X | 70390280 | 70390675 | TNKS1BP1 | 390 | 583 | 11 | 57076478 | 57076671 | |
| BF838059 | ANKDD1A | 22 | 122 | 15 | 65218757 | 65218859 | TNKS1BP1 | 111 | 216 | 11 | 57067297 | 57067402 | |
| BF756786 | IGFBP4 | 1 | 248 | 17 | 38613640 | 38613889 | TNKS1BP1 | 246 | 402 | 11 | 57076360 | 57076516 | |
| AV704306 | TNKS1BP1 | 1 | 499 | 11 | 57075094 | 57075591 | LRCH4 | 496 | 614 | 7 | 100172283 | 100172403 | |
| BM693293 | TNKS1BP1 | 1 | 142 | 11 | 57075020 | 57075161 | XCR1 | 134 | 201 | 3 | 46066340 | 46066411 | |
| Top |
| Mutation type/ Tissue ID | brca | cns | cerv | endome | haematopo | kidn | Lintest | liver | lung | ns | ovary | pancre | prost | skin | stoma | thyro | urina | |||
| Total # sample | 1 | |||||||||||||||||||
| GAIN (# sample) | 1 | |||||||||||||||||||
| LOSS (# sample) |
| cf) Tissue ID; Tissue type (1; Breast, 2; Central_nervous_system, 3; Cervix, 4; Endometrium, 5; Haematopoietic_and_lymphoid_tissue, 6; Kidney, 7; Large_intestine, 8; Liver, 9; Lung, 10; NS, 11; Ovary, 12; Pancreas, 13; Prostate, 14; Skin, 15; Stomach, 16; Thyroid, 17; Urinary_tract) |
| Top |
|
 |
| Top |
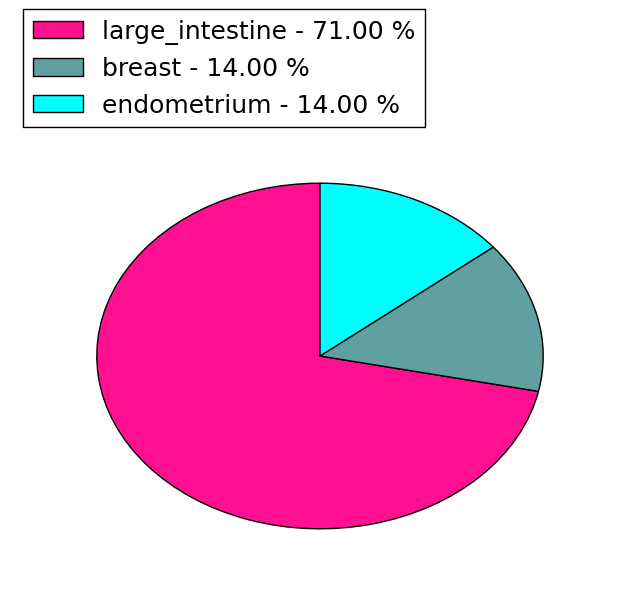
| Stat. for Non-Synonymous SNVs (# total SNVs=114) | (# total SNVs=38) |
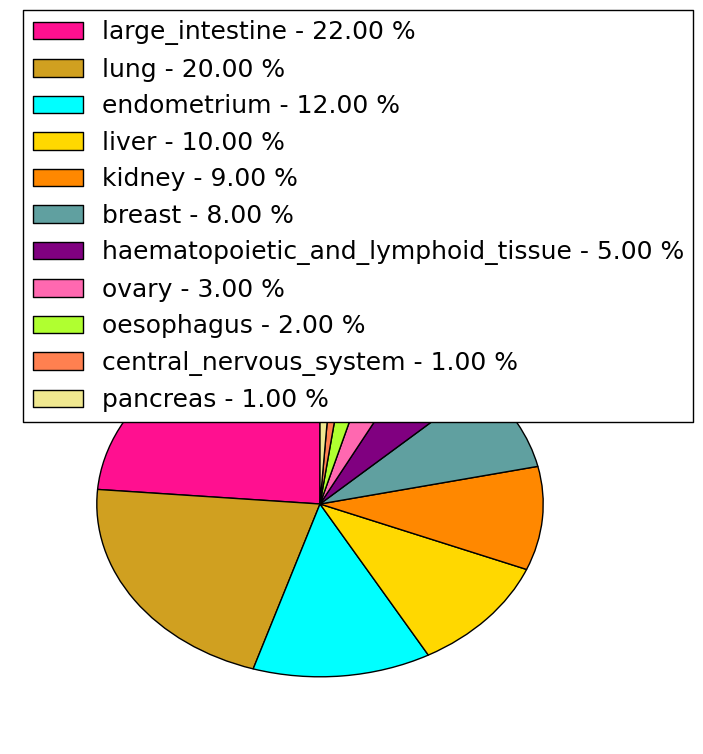 | 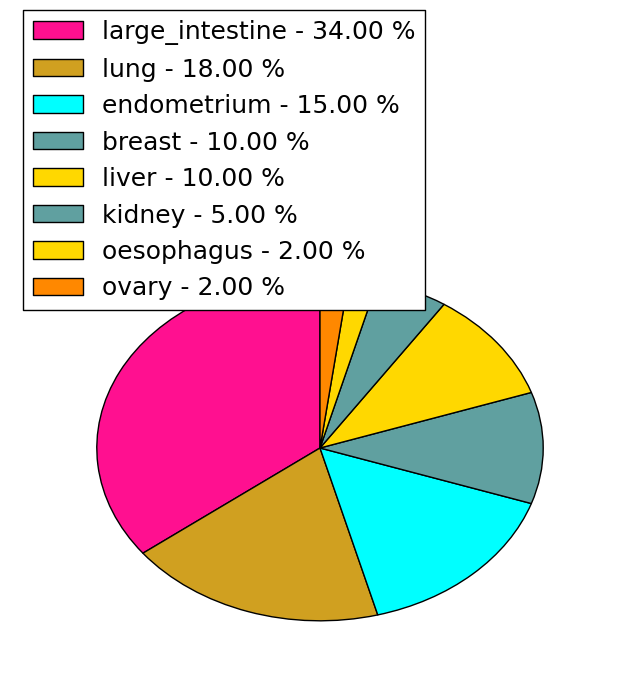 |
(# total SNVs=7) | (# total SNVs=1) |
 | 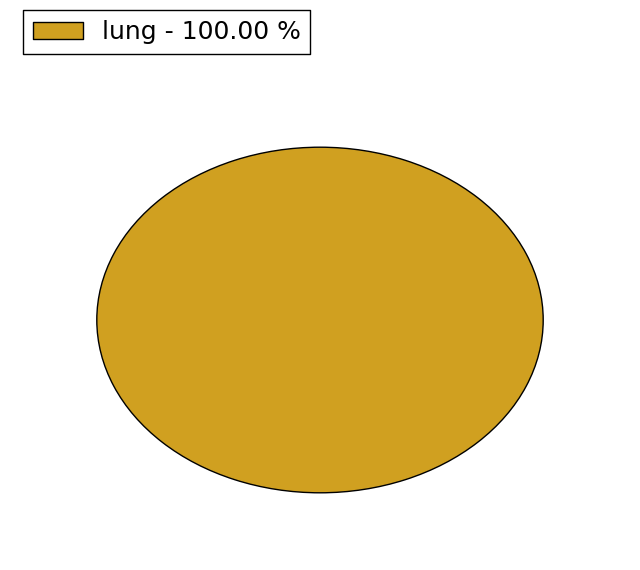 |
| Top |
| * When you move the cursor on each content, you can see more deailed mutation information on the Tooltip. Those are primary_site,primary_histology,mutation(aa),pubmedID. |
| GRCh37 position | Mutation(aa) | Unique sampleID count |
| chr11:57077353-57077353 | p.A944A | 7 |
| chr11:57081197-57081197 | p.T322S | 3 |
| chr11:57080736-57080736 | p.F476I | 3 |
| chr11:57077354-57077354 | p.A944G | 2 |
| chr11:57076529-57076529 | p.G1219fs*15 | 2 |
| chr11:57080907-57080907 | p.R419C | 2 |
| chr11:57089263-57089263 | p.? | 2 |
| chr11:57069988-57069988 | p.R1543Q | 2 |
| chr11:57087724-57087724 | p.R186H | 2 |
| chr11:57076793-57076793 | p.R1131I | 2 |
| Top |
|
 |
| Point Mutation/ Tissue ID | 1 | 2 | 3 | 4 | 5 | 6 | 7 | 8 | 9 | 10 | 11 | 12 | 13 | 14 | 15 | 16 | 17 | 18 | 19 | 20 |
| # sample | 7 | 6 | 22 | 7 | 8 | 3 | 16 | 10 | 3 | 1 | 20 | 11 | 1 | 15 | ||||||
| # mutation | 7 | 6 | 26 | 7 | 8 | 3 | 17 | 12 | 3 | 1 | 25 | 13 | 1 | 19 | ||||||
| nonsynonymous SNV | 5 | 5 | 16 | 5 | 7 | 2 | 13 | 9 | 3 | 1 | 19 | 11 | 13 | |||||||
| synonymous SNV | 2 | 1 | 10 | 2 | 1 | 1 | 4 | 3 | 6 | 2 | 1 | 6 |
| cf) Tissue ID; Tissue type (1; BLCA[Bladder Urothelial Carcinoma], 2; BRCA[Breast invasive carcinoma], 3; CESC[Cervical squamous cell carcinoma and endocervical adenocarcinoma], 4; COAD[Colon adenocarcinoma], 5; GBM[Glioblastoma multiforme], 6; Glioma Low Grade, 7; HNSC[Head and Neck squamous cell carcinoma], 8; KICH[Kidney Chromophobe], 9; KIRC[Kidney renal clear cell carcinoma], 10; KIRP[Kidney renal papillary cell carcinoma], 11; LAML[Acute Myeloid Leukemia], 12; LUAD[Lung adenocarcinoma], 13; LUSC[Lung squamous cell carcinoma], 14; OV[Ovarian serous cystadenocarcinoma ], 15; PAAD[Pancreatic adenocarcinoma], 16; PRAD[Prostate adenocarcinoma], 17; SKCM[Skin Cutaneous Melanoma], 18:STAD[Stomach adenocarcinoma], 19:THCA[Thyroid carcinoma], 20:UCEC[Uterine Corpus Endometrial Carcinoma]) |
| Top |
| * We represented just top 10 SNVs. When you move the cursor on each content, you can see more deailed mutation information on the Tooltip. Those are primary_site, primary_histology, mutation(aa), pubmedID. |
| Genomic Position | Mutation(aa) | Unique sampleID count |
| chr11:57077271 | p.S955S | 2 |
| chr11:57077309 | p.T607T | 2 |
| chr11:57077320 | p.R1131T | 2 |
| chr11:57080341 | p.P604R | 2 |
| chr11:57080351 | p.A898V | 2 |
| chr11:57087724 | p.R186H | 2 |
| chr11:57077492 | p.A972T | 2 |
| chr11:57076793 | p.R959K | 2 |
| chr11:57080210 | p.R389Q | 1 |
| chr11:57068382 | p.Q1351H | 1 |
| * Copy number data were extracted from TCGA using R package TCGA-Assembler. The URLs of all public data files on TCGA DCC data server were gathered on Jan-05-2015. Function ProcessCNAData in TCGA-Assembler package was used to obtain gene-level copy number value which is calculated as the average copy number of the genomic region of a gene. |
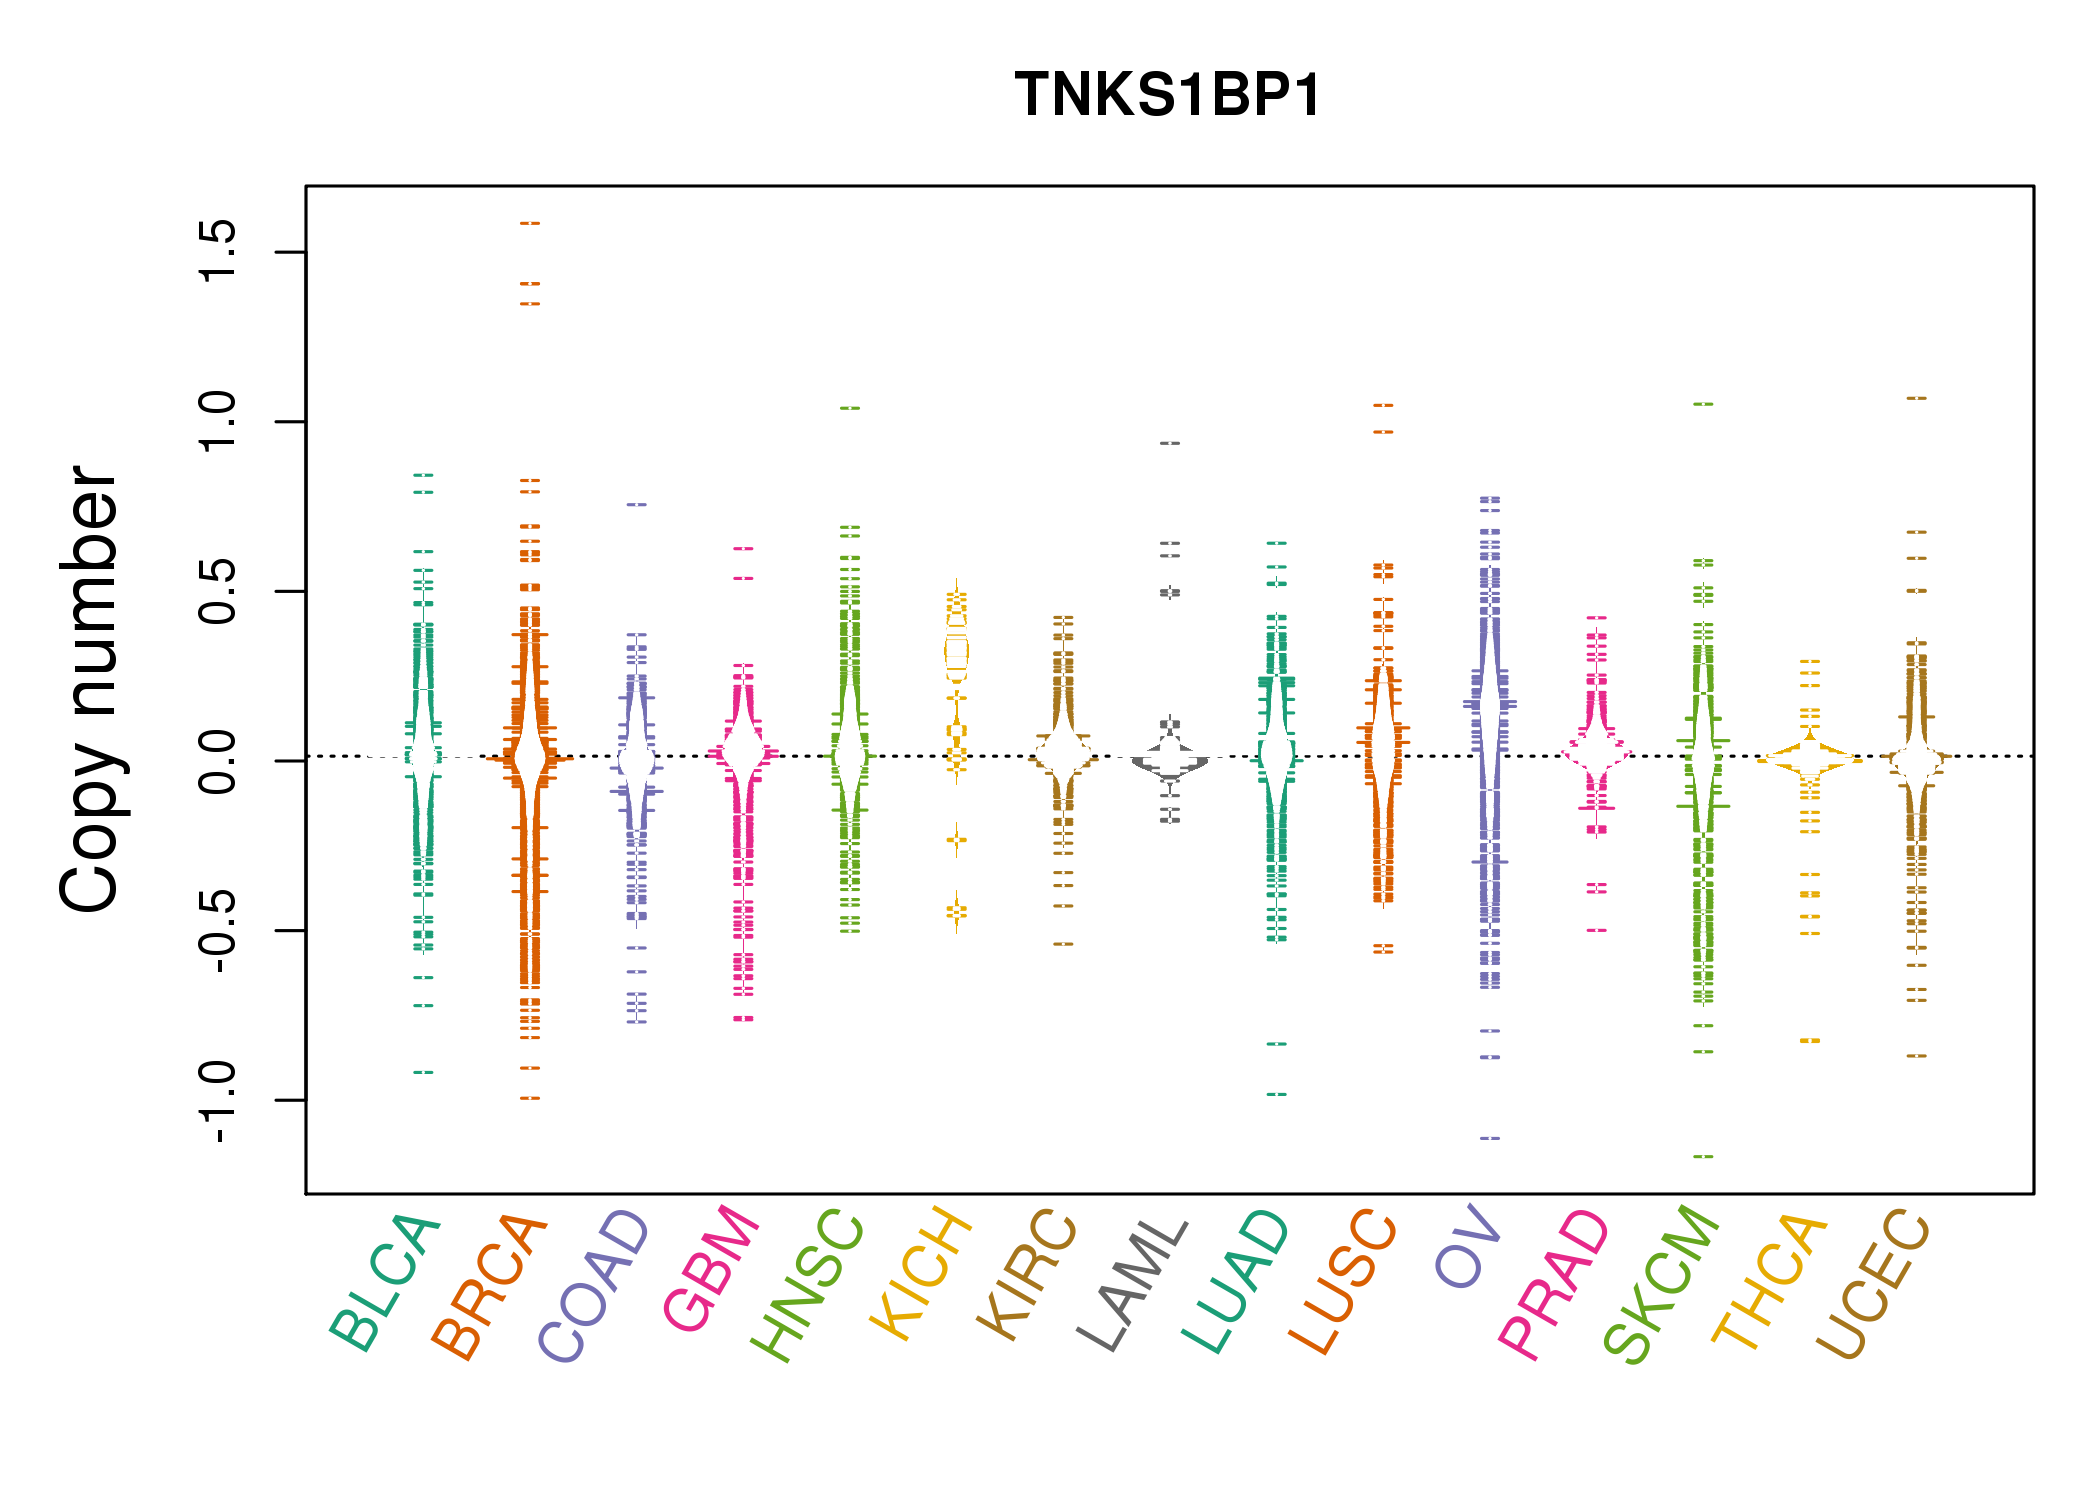 |
| cf) Tissue ID[Tissue type]: BLCA[Bladder Urothelial Carcinoma], BRCA[Breast invasive carcinoma], CESC[Cervical squamous cell carcinoma and endocervical adenocarcinoma], COAD[Colon adenocarcinoma], GBM[Glioblastoma multiforme], Glioma Low Grade, HNSC[Head and Neck squamous cell carcinoma], KICH[Kidney Chromophobe], KIRC[Kidney renal clear cell carcinoma], KIRP[Kidney renal papillary cell carcinoma], LAML[Acute Myeloid Leukemia], LUAD[Lung adenocarcinoma], LUSC[Lung squamous cell carcinoma], OV[Ovarian serous cystadenocarcinoma ], PAAD[Pancreatic adenocarcinoma], PRAD[Prostate adenocarcinoma], SKCM[Skin Cutaneous Melanoma], STAD[Stomach adenocarcinoma], THCA[Thyroid carcinoma], UCEC[Uterine Corpus Endometrial Carcinoma] |
| Top |
| Gene Expression for TNKS1BP1 |
| * CCLE gene expression data were extracted from CCLE_Expression_Entrez_2012-10-18.res: Gene-centric RMA-normalized mRNA expression data. |
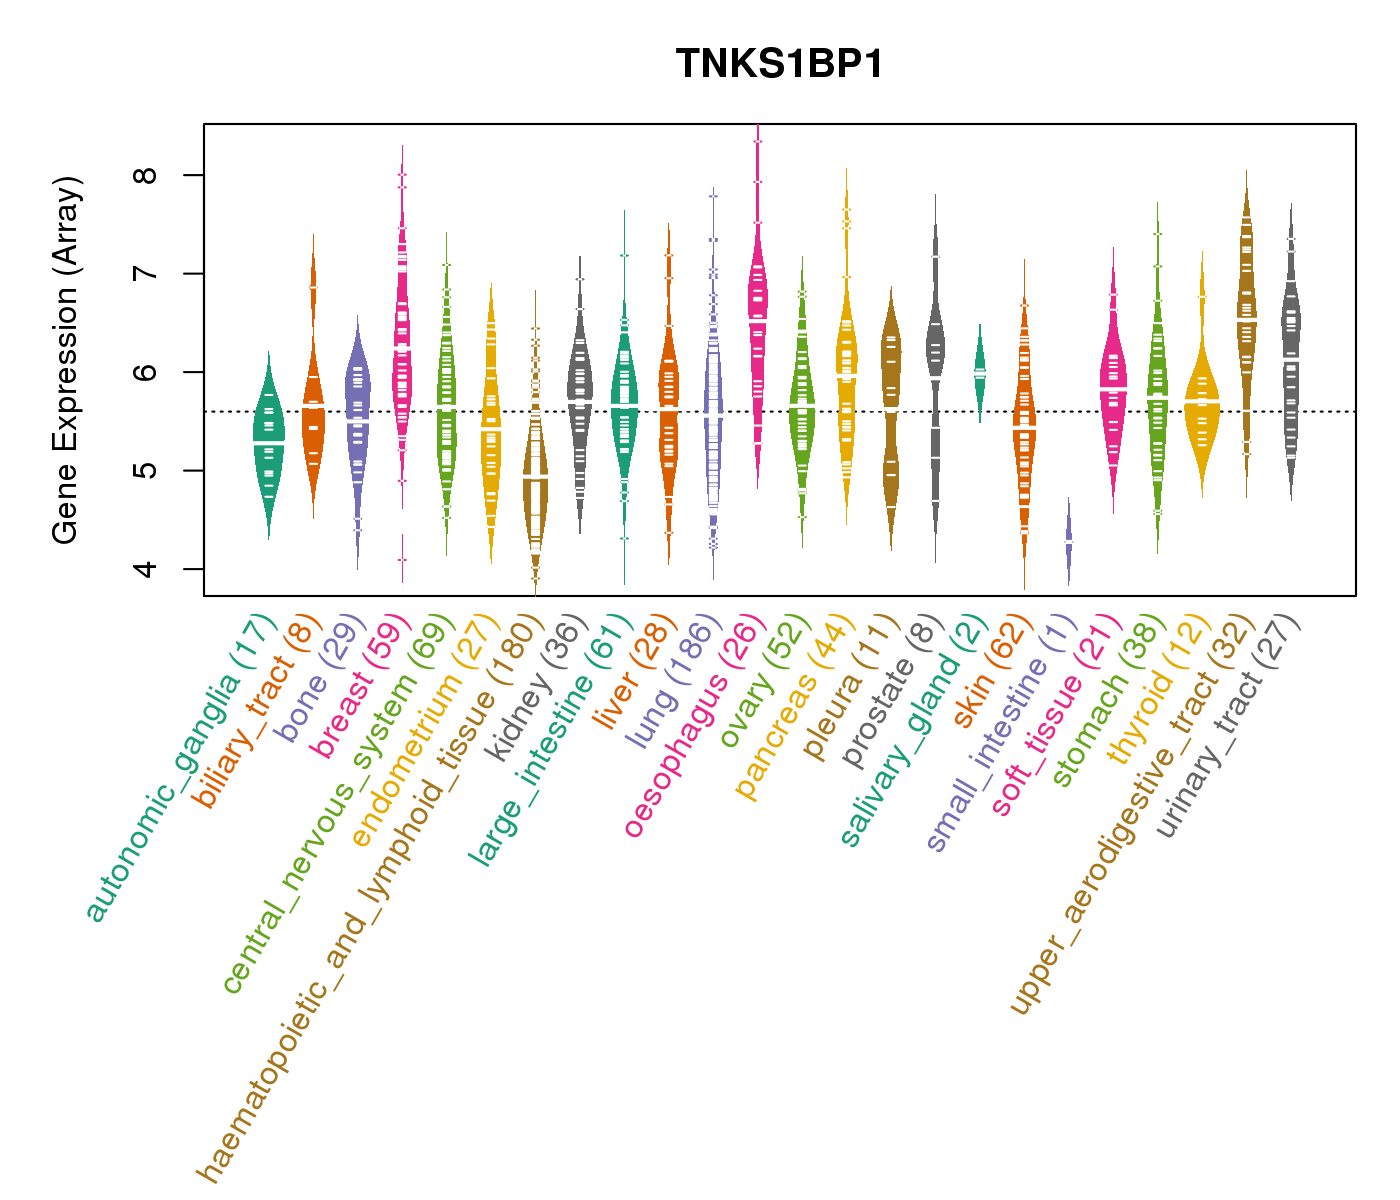 |
| * Normalized gene expression data of RNASeqV2 was extracted from TCGA using R package TCGA-Assembler. The URLs of all public data files on TCGA DCC data server were gathered at Jan-05-2015. Only eight cancer types have enough normal control samples for differential expression analysis. (t test, adjusted p<0.05 (using Benjamini-Hochberg FDR)) |
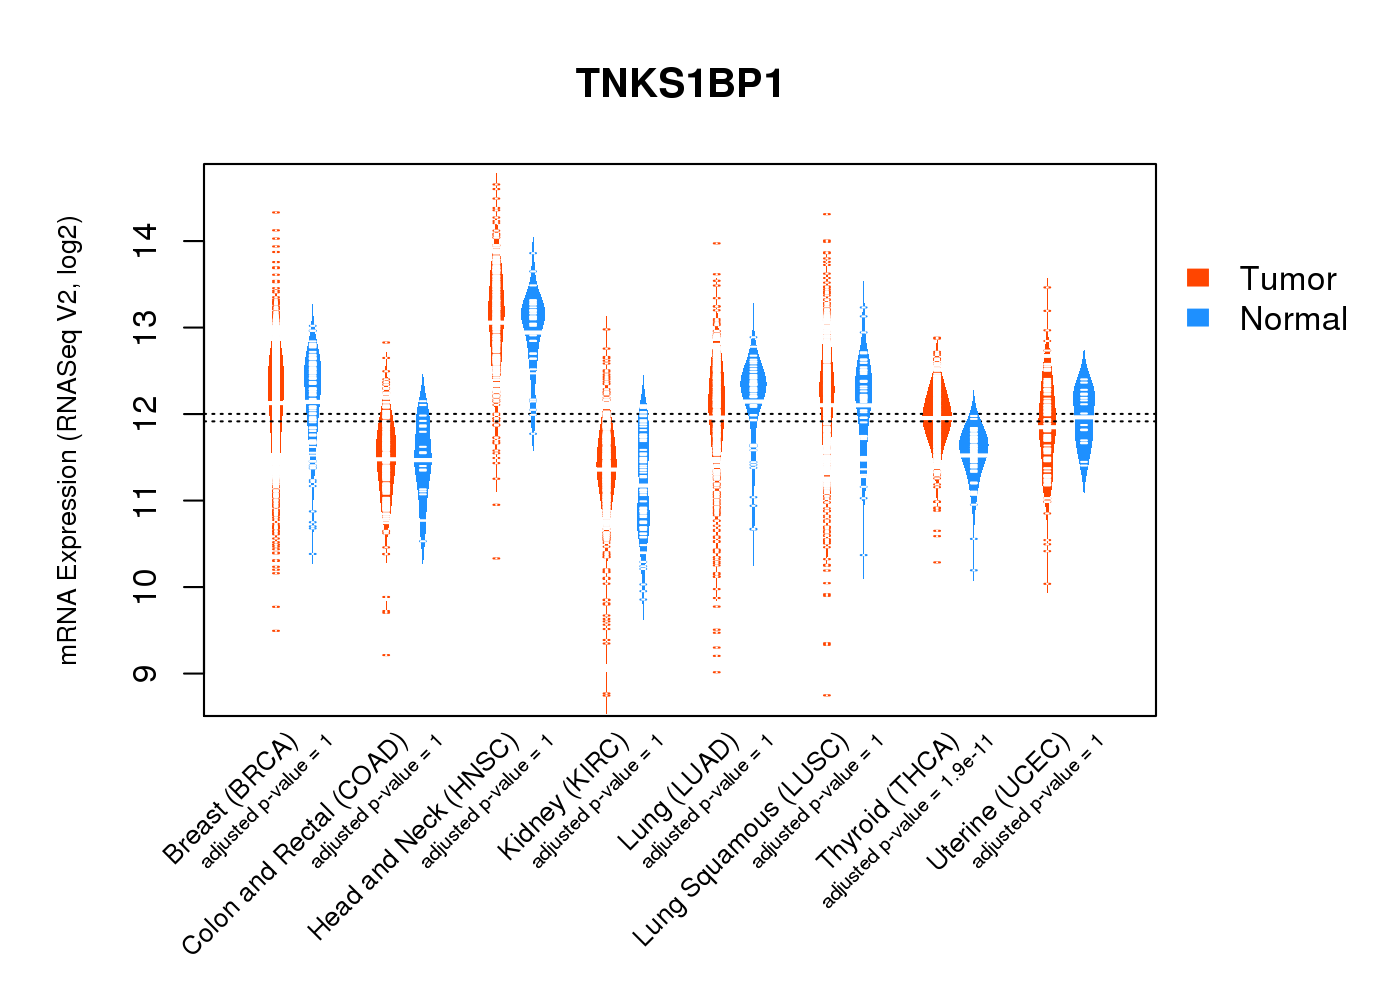 |
| Top |
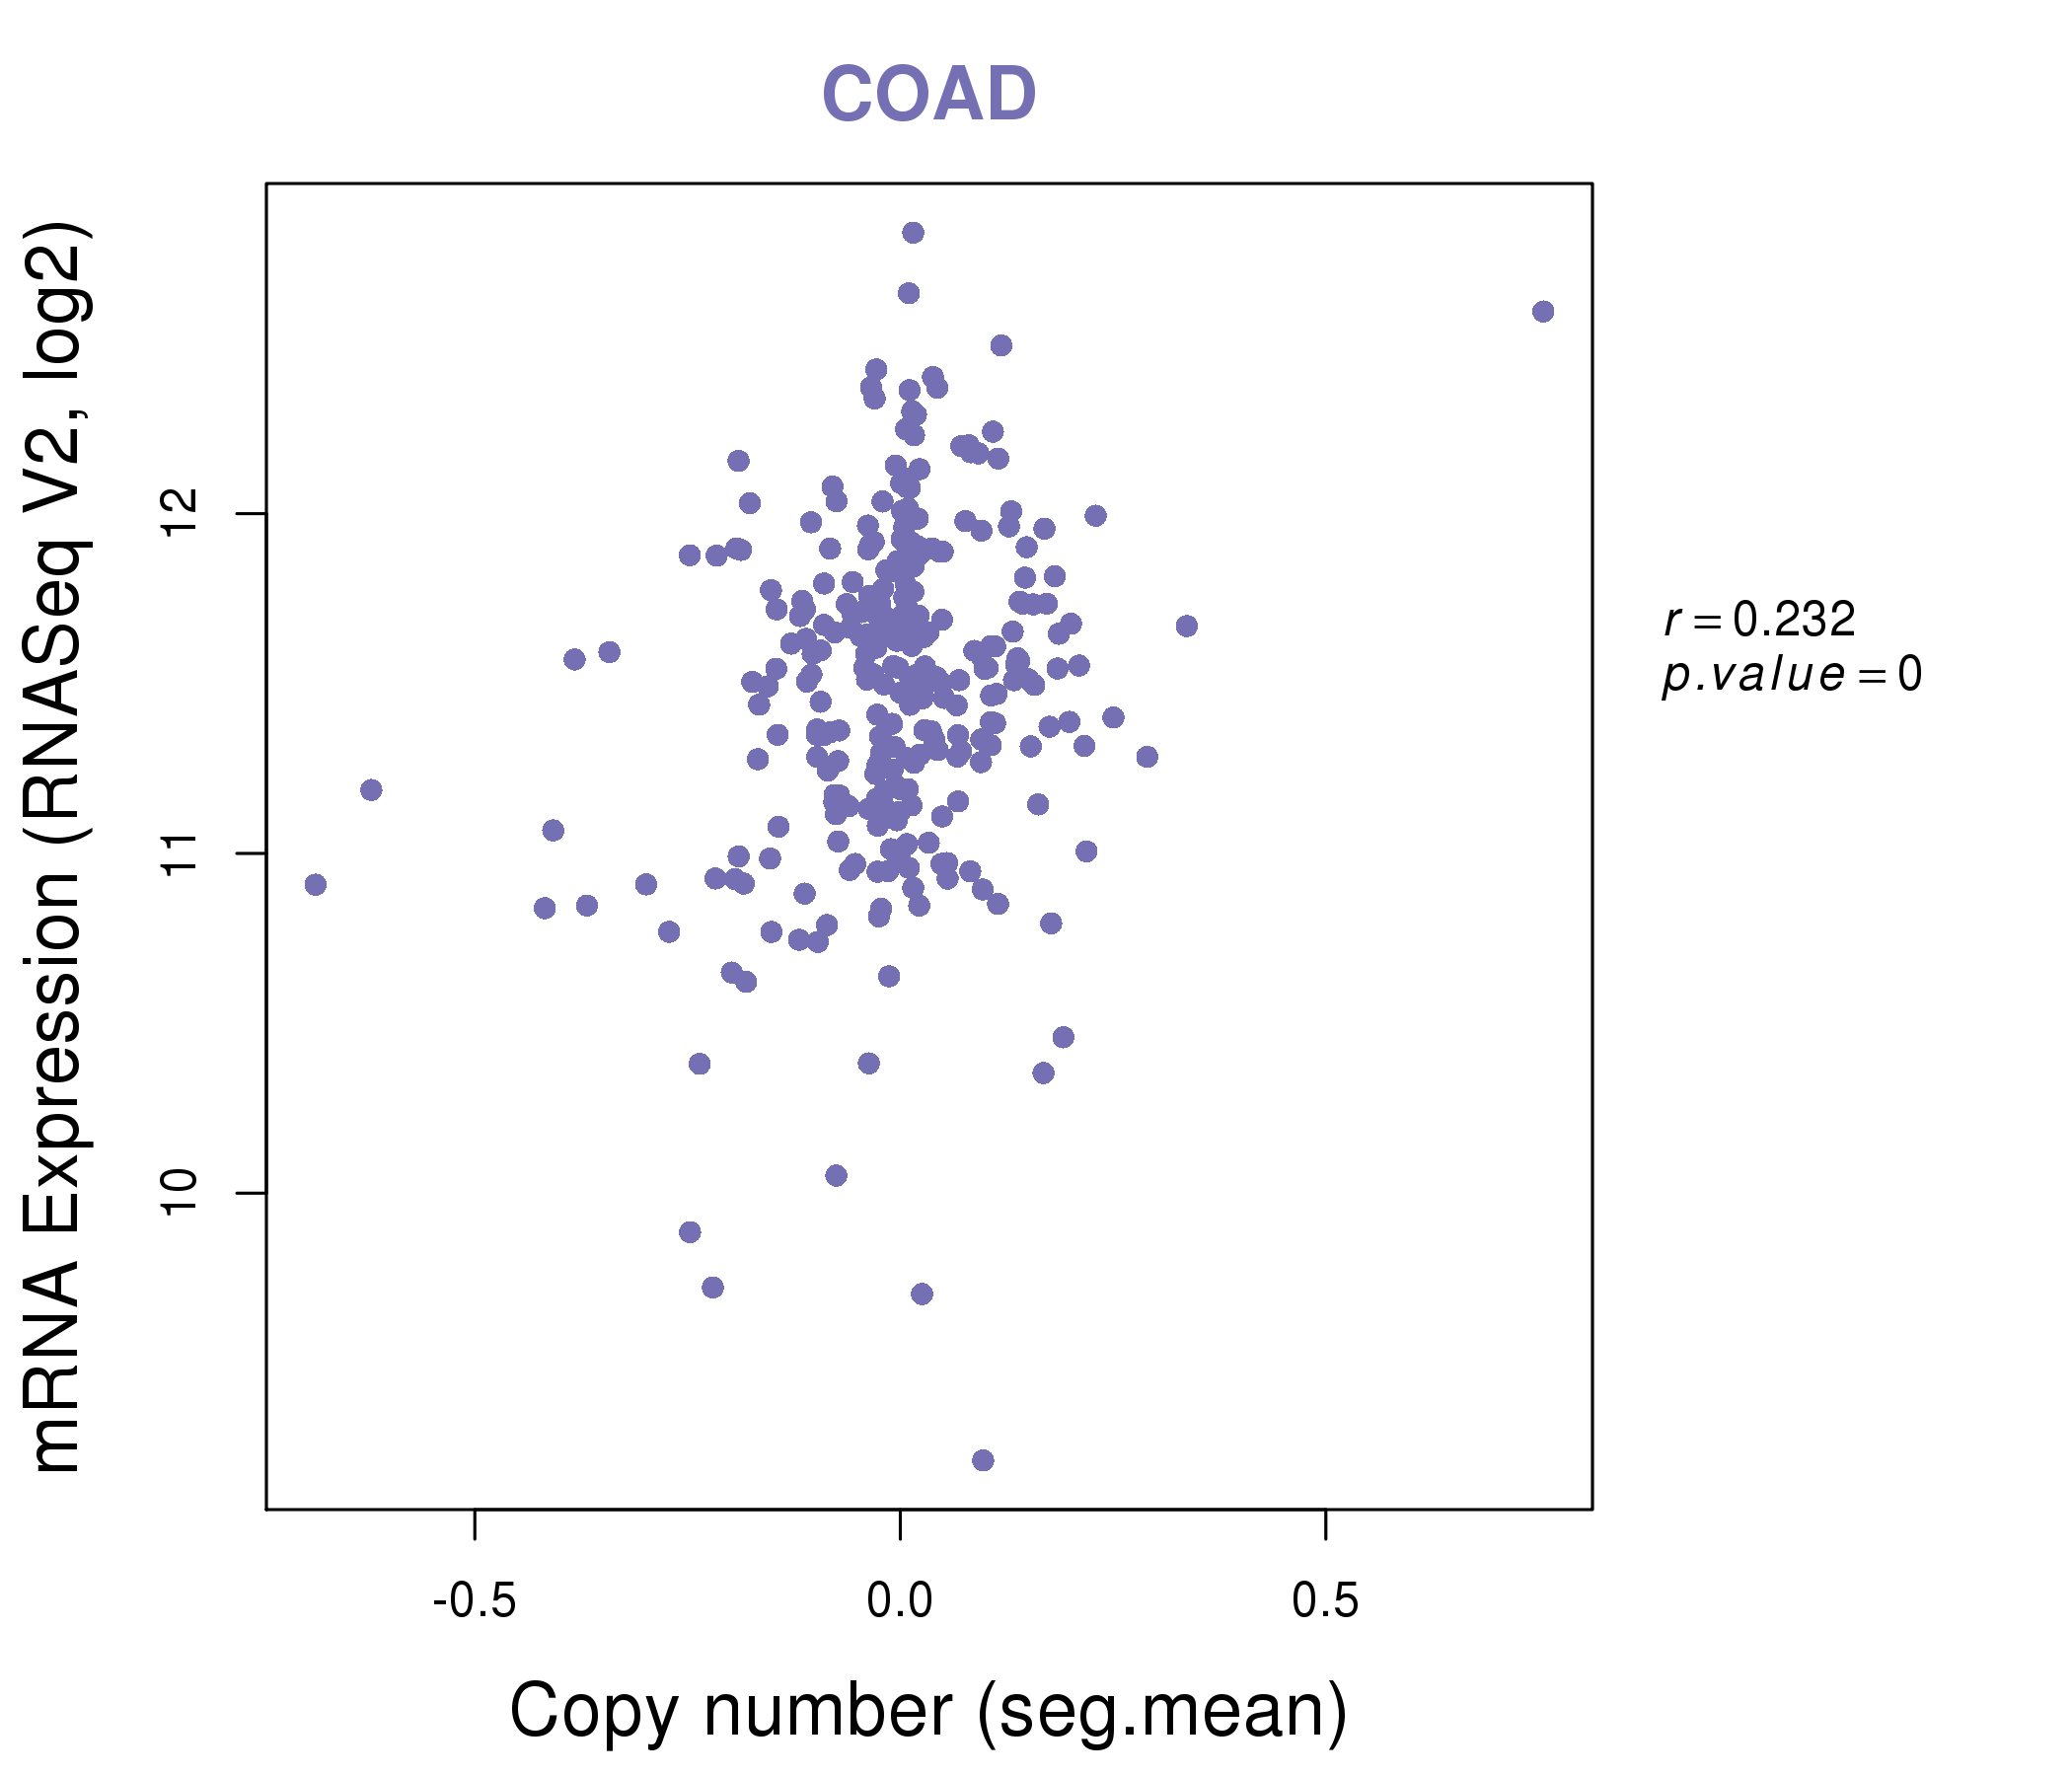
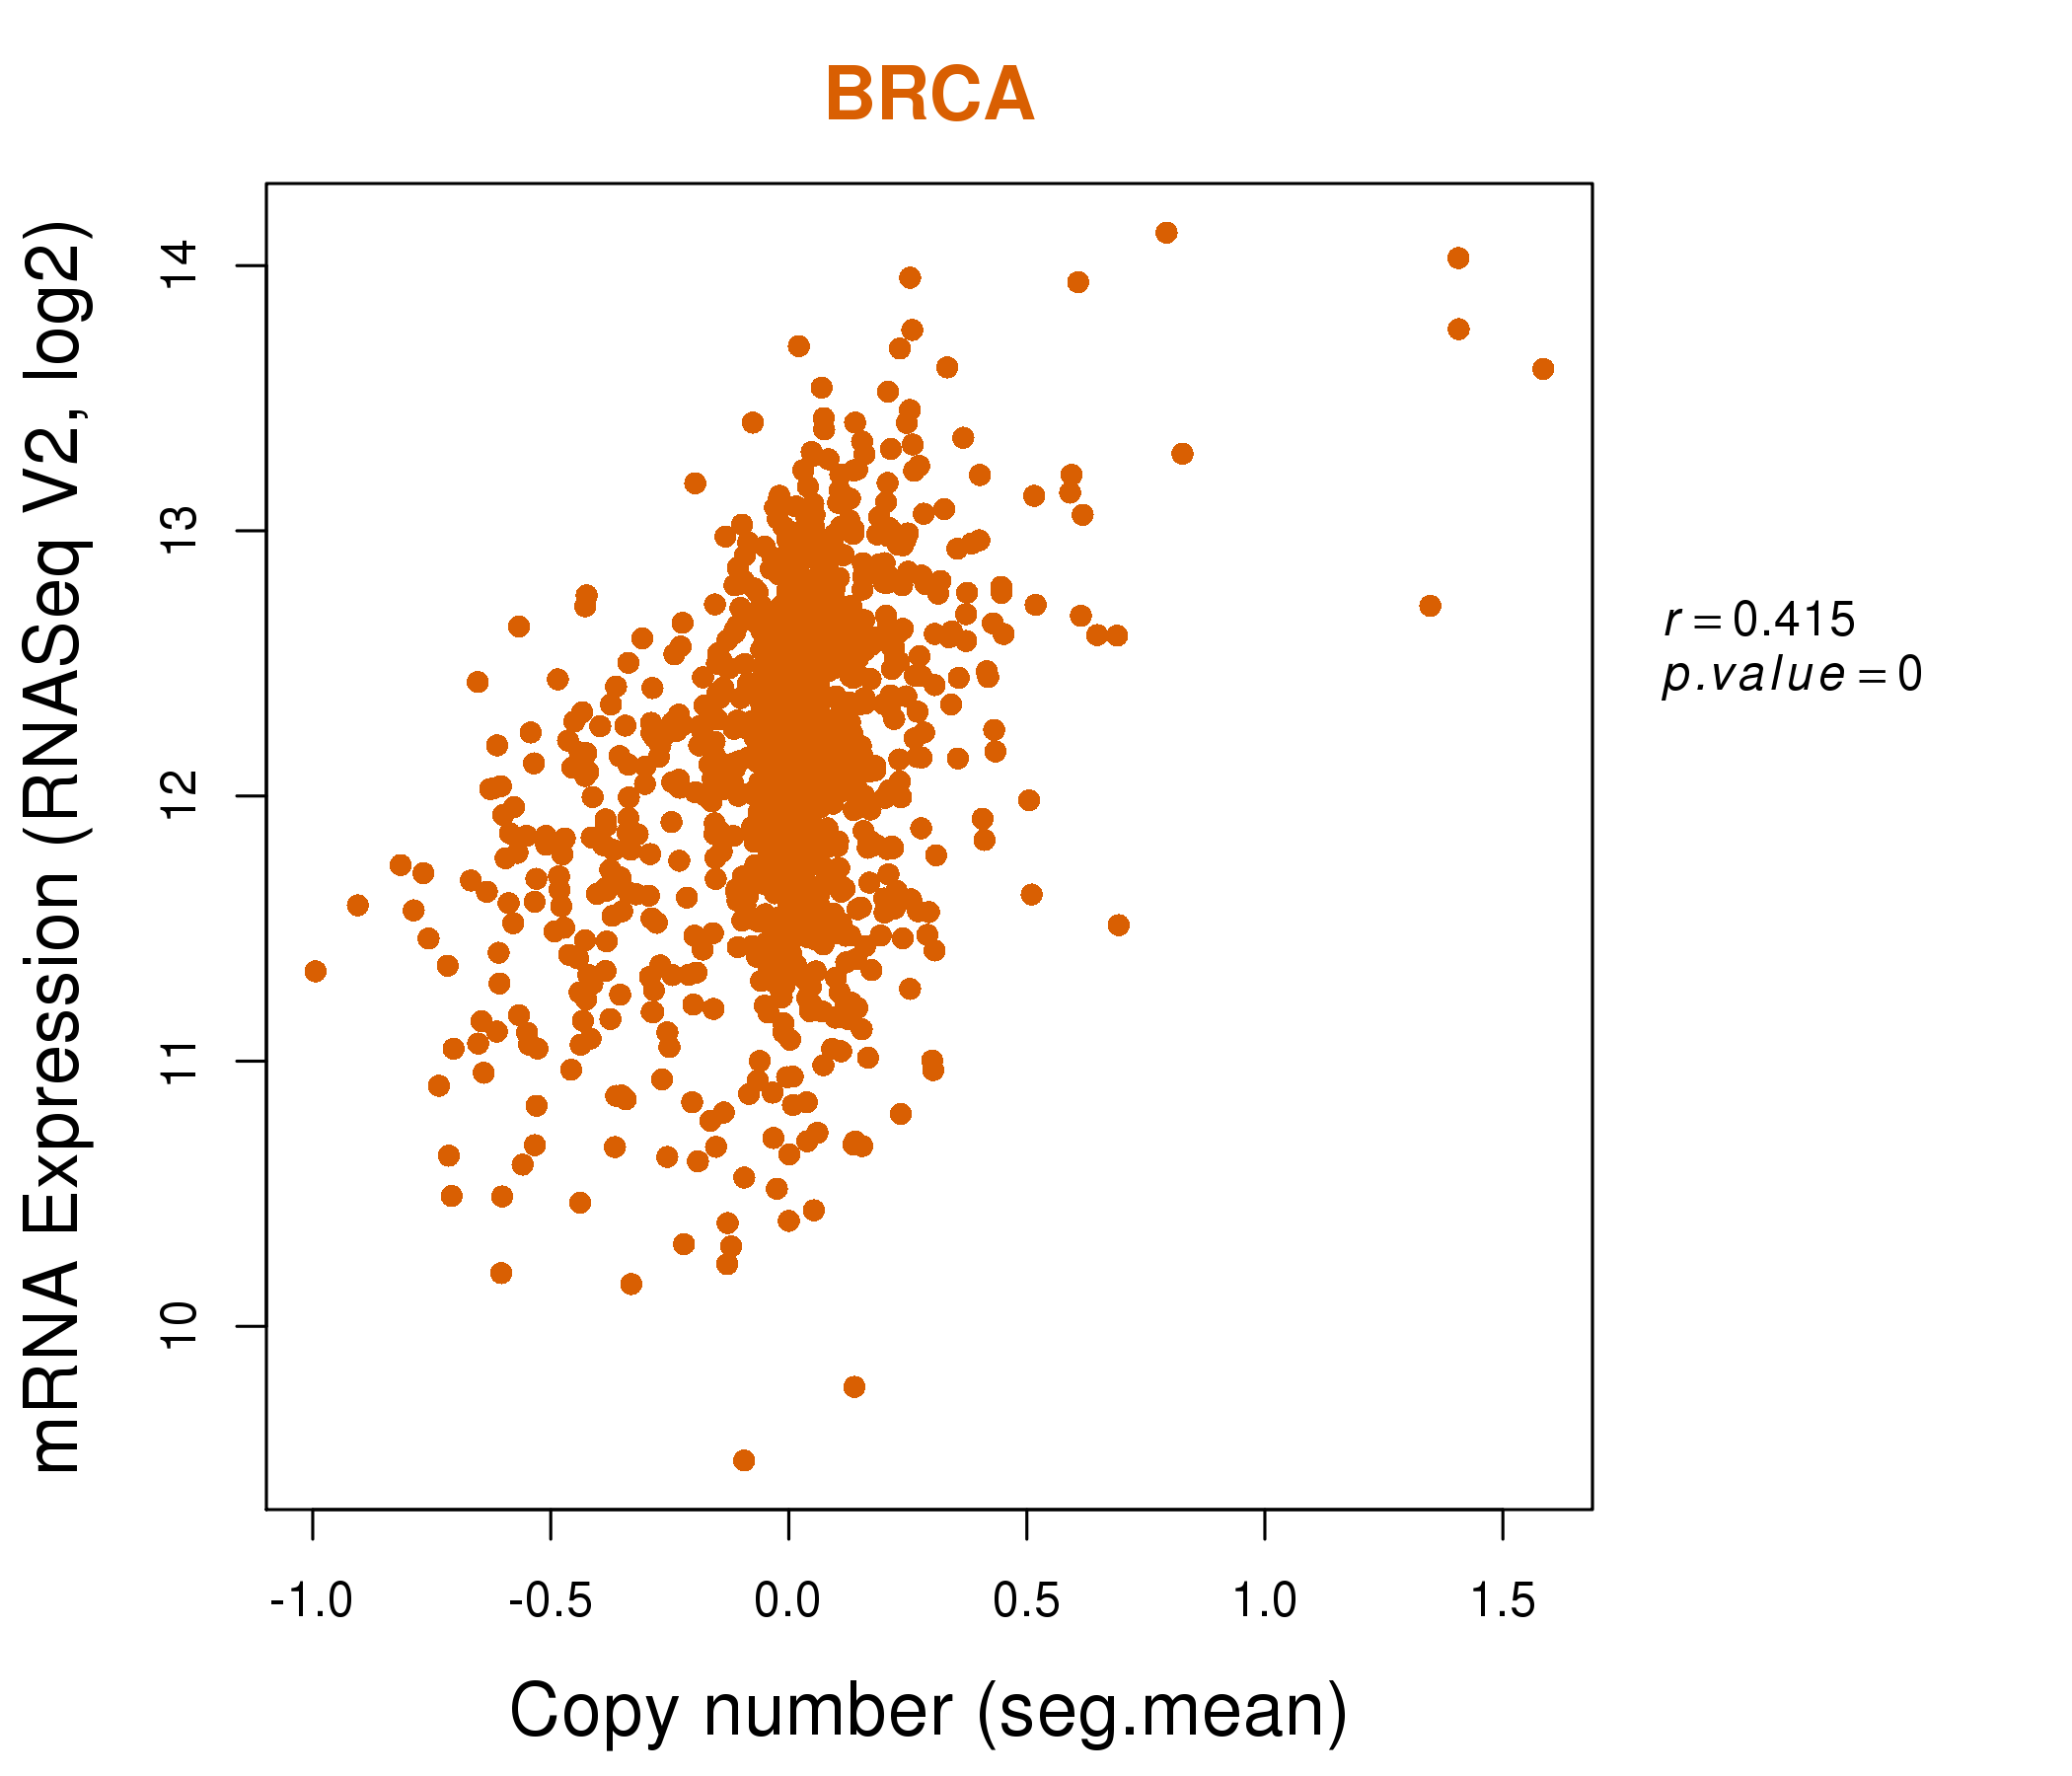
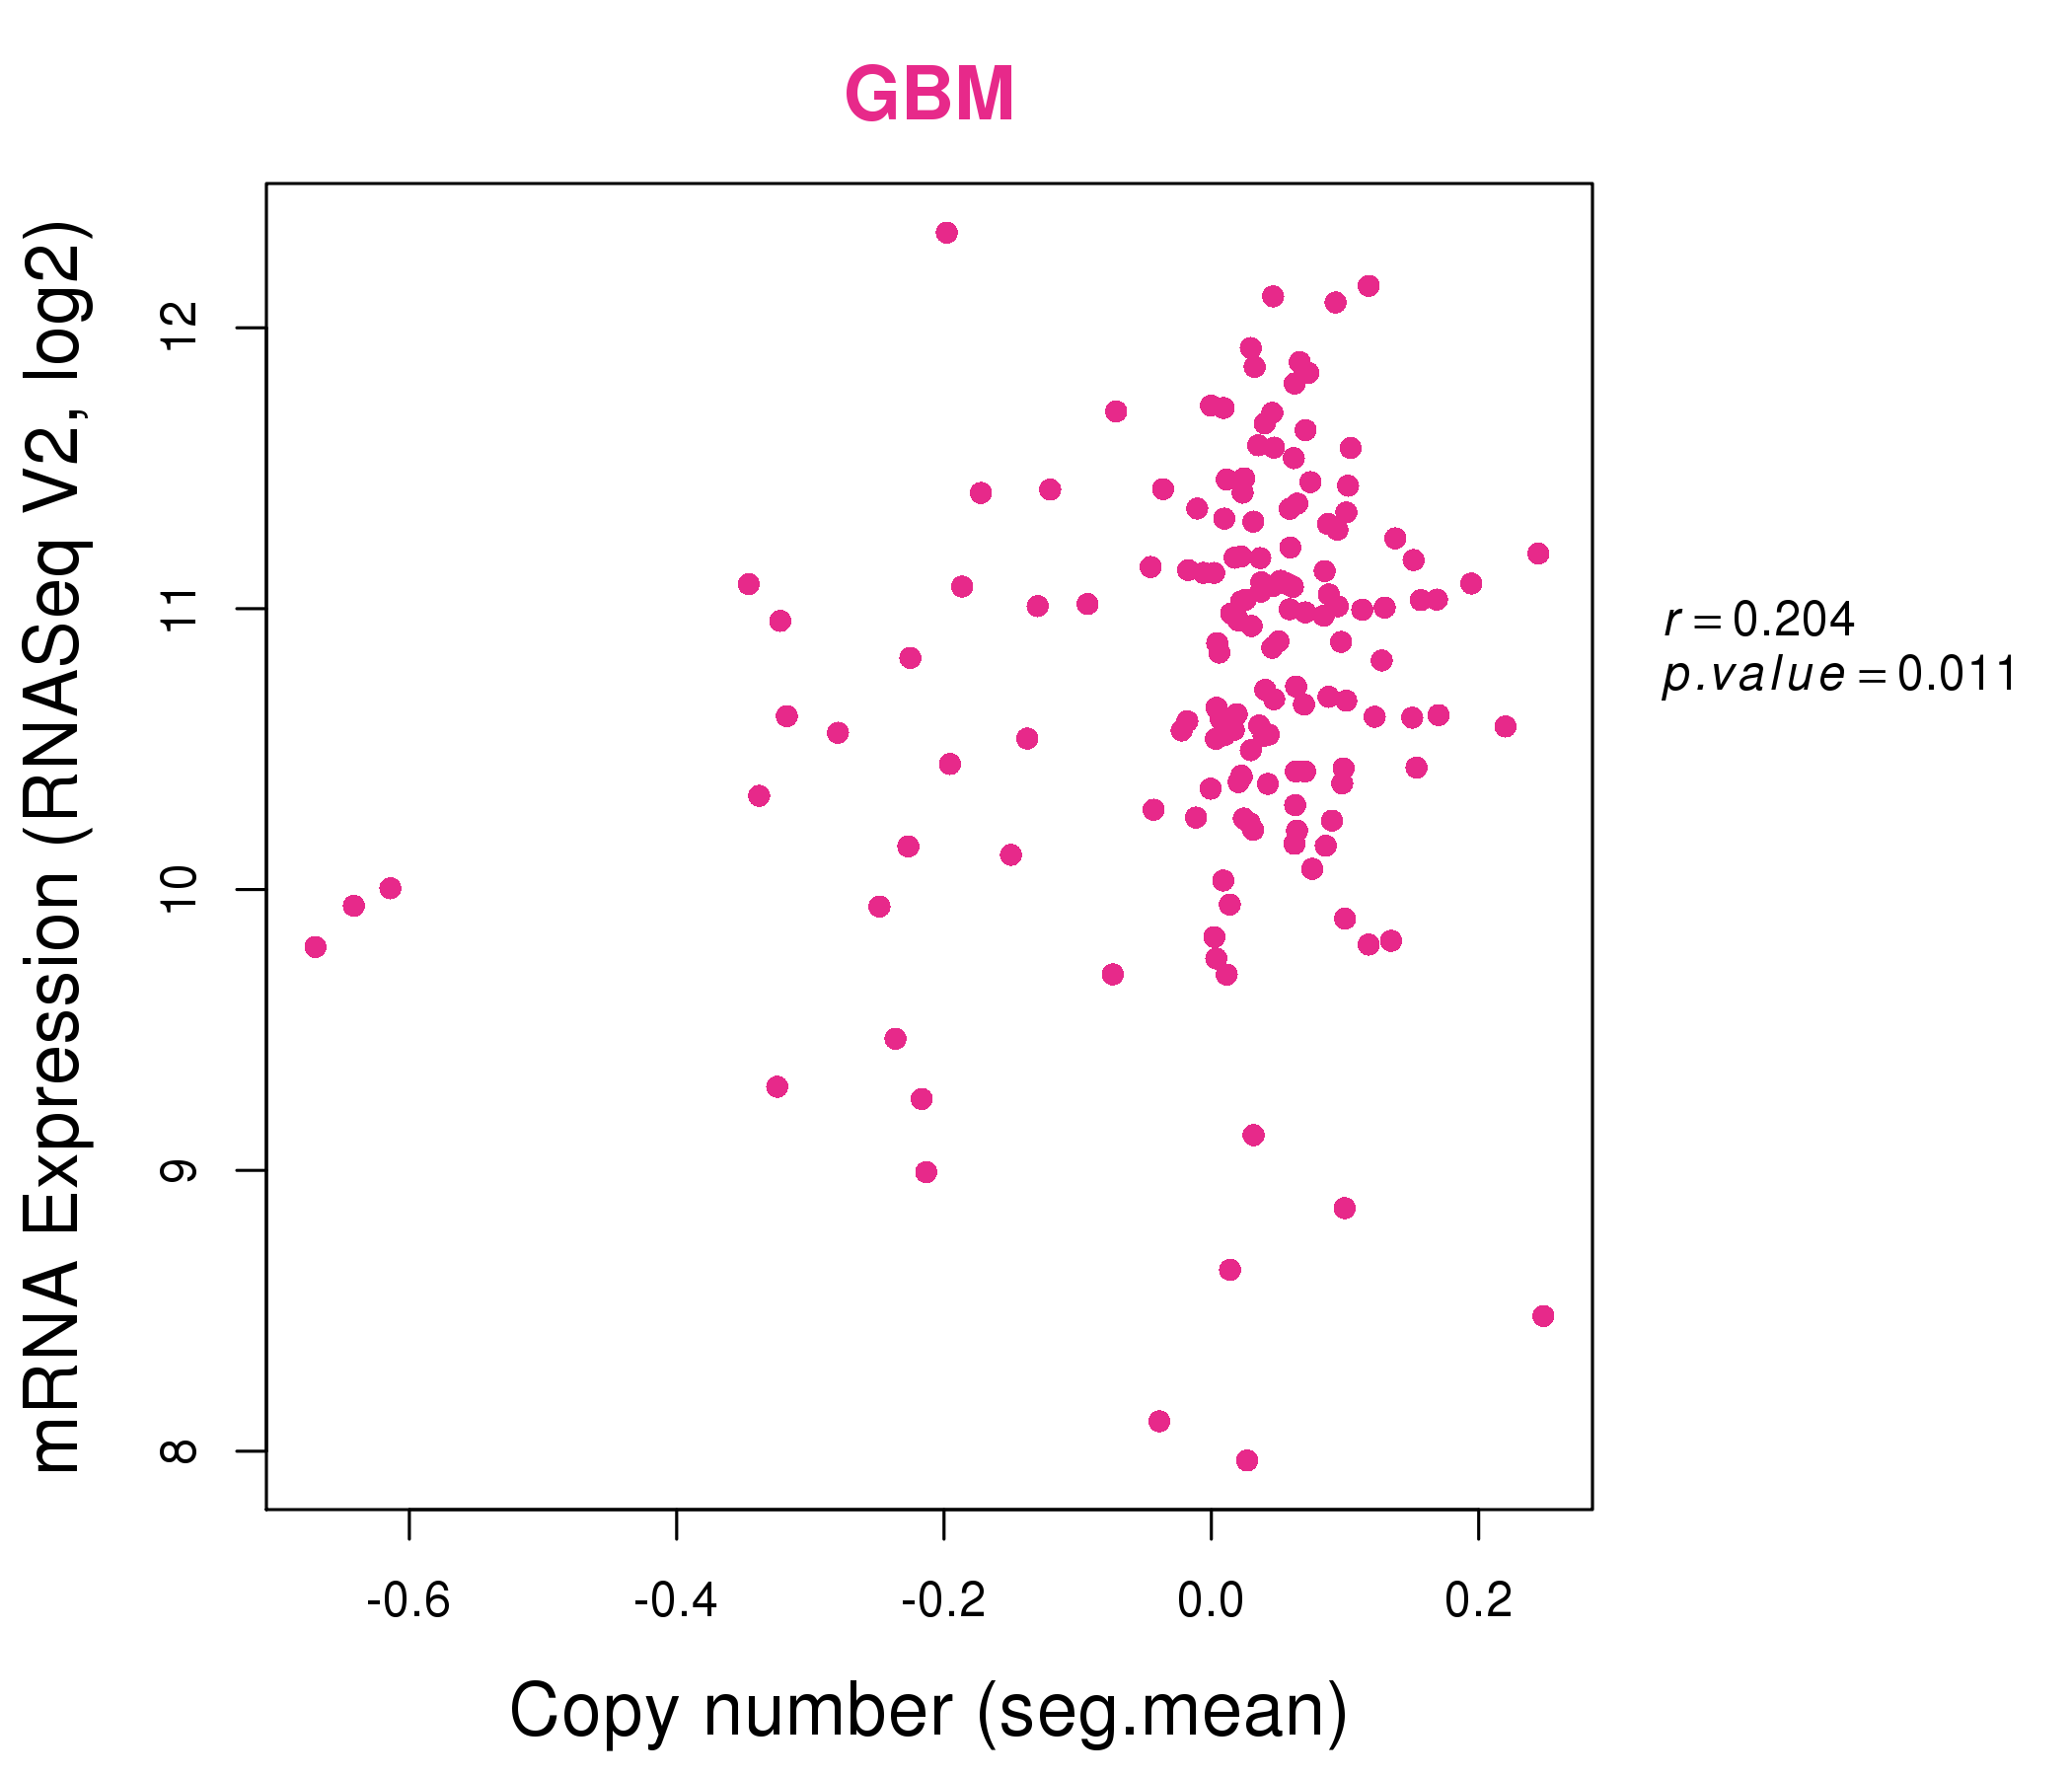
| * This plots show the correlation between CNV and gene expression. |
: Open all plots for all cancer types
 |
|
 |
|
| Top |
| Gene-Gene Network Information |
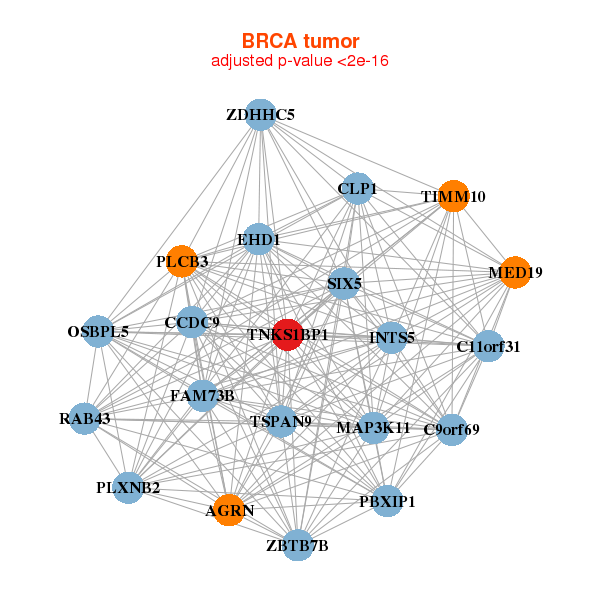
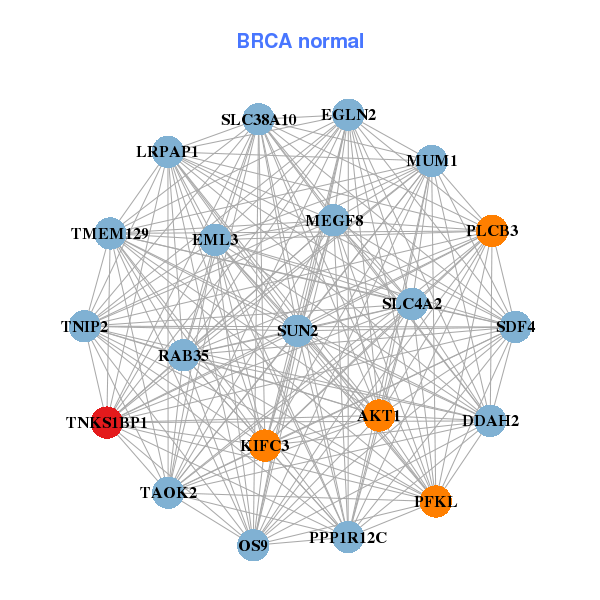
| * Co-Expression network figures were drawn using R package igraph. Only the top 20 genes with the highest correlations were shown. Red circle: input gene, orange circle: cell metabolism gene, sky circle: other gene |
: Open all plots for all cancer types
 |
|
| AGRN,C11orf31,C9orf69,CCDC9,CLP1,EHD1,FAM73B, INTS5,MAP3K11,MED19,OSBPL5,PBXIP1,PLCB3,PLXNB2, RAB43,SIX5,TIMM10,TNKS1BP1,TSPAN9,ZBTB7B,ZDHHC5 | AKT1,DDAH2,EGLN2,EML3,KIFC3,LRPAP1,MEGF8, MUM1,OS9,PFKL,PLCB3,PPP1R12C,RAB35,SDF4, SLC38A10,SLC4A2,SUN2,TAOK2,TMEM129,TNIP2,TNKS1BP1 |
 |
|
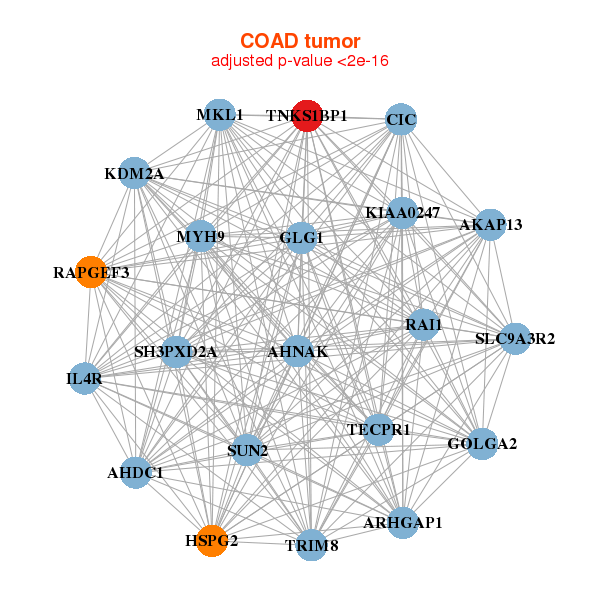
| AHDC1,AHNAK,AKAP13,ARHGAP1,CIC,GLG1,GOLGA2, HSPG2,IL4R,KDM2A,KIAA0247,MKL1,MYH9,RAI1, RAPGEF3,SH3PXD2A,SLC9A3R2,SUN2,TECPR1,TNKS1BP1,TRIM8 | AGRN,ANKRD11,ANKRD52,BRD4,FBXL19,GTF3C1,KDM2A, LARP1,MCM3AP,KMT2B___KMT2D,MUC4,PHRF1,SEC16A,SMARCA4, SPEN,SRCAP,TAOK2,TNKS1BP1,TRIM56,TRRAP,VPS13D |
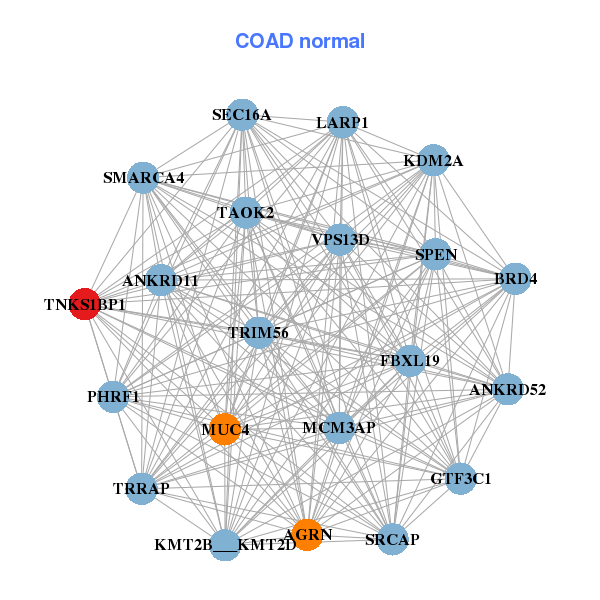
| * Co-Expression network figures were drawn using R package igraph. Only the top 20 genes with the highest correlations were shown. Red circle: input gene, orange circle: cell metabolism gene, sky circle: other gene |
: Open all plots for all cancer types
| Top |
: Open all interacting genes' information including KEGG pathway for all interacting genes from DAVID
| Top |
| Pharmacological Information for TNKS1BP1 |
| There's no related Drug. |
| Top |
| Cross referenced IDs for TNKS1BP1 |
| * We obtained these cross-references from Uniprot database. It covers 150 different DBs, 18 categories. http://www.uniprot.org/help/cross_references_section |
: Open all cross reference information
|
Copyright © 2016-Present - The Univsersity of Texas Health Science Center at Houston @ |