|
|||||||||||||||||||||||||||||||||||||||||||||||||||||||||||||||||||||||||||||||||||||||||||||||||||||||||||||||||||||||||||||||||||||||||||||||||||||||||||||||||||||||||||||||||||||||||||||||||||||||||||||||||||||||||||||||||||||||||||||||||||||||||||||||||||||||||||||||||||||||||||||||||||||||||||||||||||||||||||||||||||||||||||||||||||||||||
| |
| Phenotypic Information (metabolism pathway, cancer, disease, phenome) |
| |
| |
| Gene-Gene Network Information: Co-Expression Network, Interacting Genes & KEGG |
| |
|


| Gene Summary for KMO |
| Basic gene info. | Gene symbol | KMO |
| Gene name | kynurenine 3-monooxygenase (kynurenine 3-hydroxylase) | |
| Synonyms | dJ317G22.1 | |
| Cytomap | UCSC genome browser: 1q42-q44 | |
| Genomic location | chr1 :241695433-241758949 | |
| Type of gene | protein-coding | |
| RefGenes | NM_003679.4, | |
| Ensembl id | ENSG00000117009 | |
| Description | kynurenine 3-hydroxylasekynurenine 3-monooxygenase | |
| Modification date | 20141207 | |
| dbXrefs | MIM : 603538 | |
| HGNC : HGNC | ||
| Ensembl : ENSG00000117009 | ||
| HPRD : 04642 | ||
| Vega : OTTHUMG00000039635 | ||
| Protein | UniProt: go to UniProt's Cross Reference DB Table | |
| Expression | CleanEX: HS_KMO | |
| BioGPS: 8564 | ||
| Gene Expression Atlas: ENSG00000117009 | ||
| The Human Protein Atlas: ENSG00000117009 | ||
| Pathway | NCI Pathway Interaction Database: KMO | |
| KEGG: KMO | ||
| REACTOME: KMO | ||
| ConsensusPathDB | ||
| Pathway Commons: KMO | ||
| Metabolism | MetaCyc: KMO | |
| HUMANCyc: KMO | ||
| Regulation | Ensembl's Regulation: ENSG00000117009 | |
| miRBase: chr1 :241,695,433-241,758,949 | ||
| TargetScan: NM_003679 | ||
| cisRED: ENSG00000117009 | ||
| Context | iHOP: KMO | |
| cancer metabolism search in PubMed: KMO | ||
| UCL Cancer Institute: KMO | ||
| Assigned class in ccmGDB | C | |
| Top |
| Phenotypic Information for KMO(metabolism pathway, cancer, disease, phenome) |
| Cancer | CGAP: KMO |
| Familial Cancer Database: KMO | |
| * This gene is included in those cancer gene databases. |
|
|
|
|
|
| . | |||||||||||||||||||||||||||||||||||||||||||||||||||||||||||||||||||||||||||||||||||||||||||||||||||||||||||||||||||||||||||||||||||||||||||||||||||||||||||||||||||||||||||||||||||||||||||||||||||||||||||||||||||||||||||||||||||||||||||||||||||||||||||||||||||||||||||||||||||||||||||||||||||||||||||||||||||||||||||||||||||||||||||||||||||
Oncogene 1 | Significant driver gene in | ||||||||||||||||||||||||||||||||||||||||||||||||||||||||||||||||||||||||||||||||||||||||||||||||||||||||||||||||||||||||||||||||||||||||||||||||||||||||||||||||||||||||||||||||||||||||||||||||||||||||||||||||||||||||||||||||||||||||||||||||||||||||||||||||||||||||||||||||||||||||||||||||||||||||||||||||||||||||||||||||||||||||||||||||||||||||
| cf) number; DB name 1 Oncogene; http://nar.oxfordjournals.org/content/35/suppl_1/D721.long, 2 Tumor Suppressor gene; https://bioinfo.uth.edu/TSGene/, 3 Cancer Gene Census; http://www.nature.com/nrc/journal/v4/n3/abs/nrc1299.html, 4 CancerGenes; http://nar.oxfordjournals.org/content/35/suppl_1/D721.long, 5 Network of Cancer Gene; http://ncg.kcl.ac.uk/index.php, 1Therapeutic Vulnerabilities in Cancer; http://cbio.mskcc.org/cancergenomics/statius/ |
| KEGG_TRYPTOPHAN_METABOLISM REACTOME_METABOLISM_OF_AMINO_ACIDS_AND_DERIVATIVES | |
| OMIM | |
| Orphanet | |
| Disease | KEGG Disease: KMO |
| MedGen: KMO (Human Medical Genetics with Condition) | |
| ClinVar: KMO | |
| Phenotype | MGI: KMO (International Mouse Phenotyping Consortium) |
| PhenomicDB: KMO | |
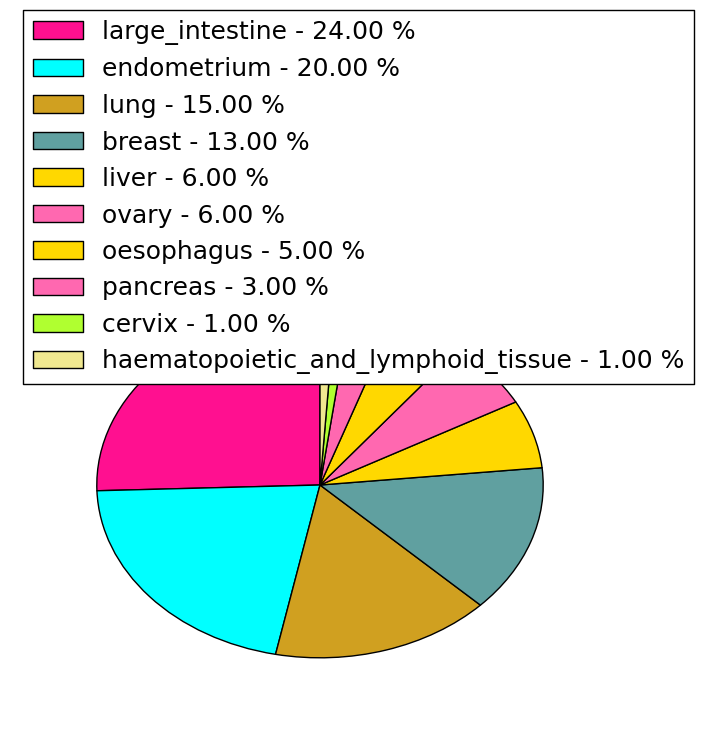
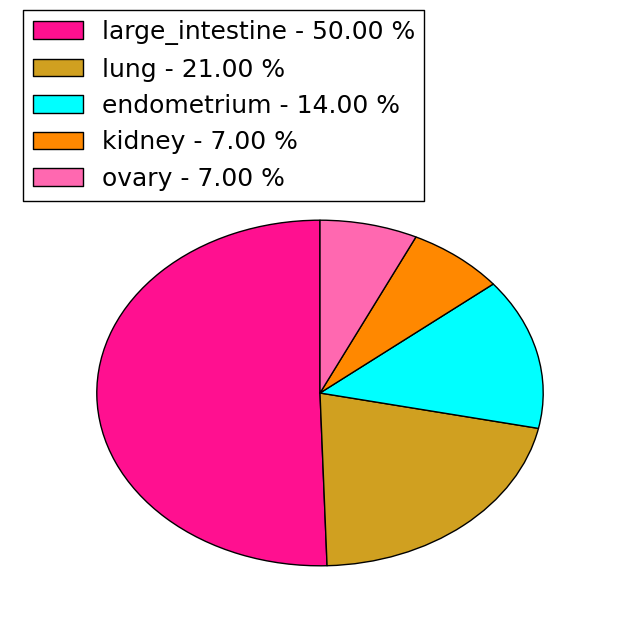
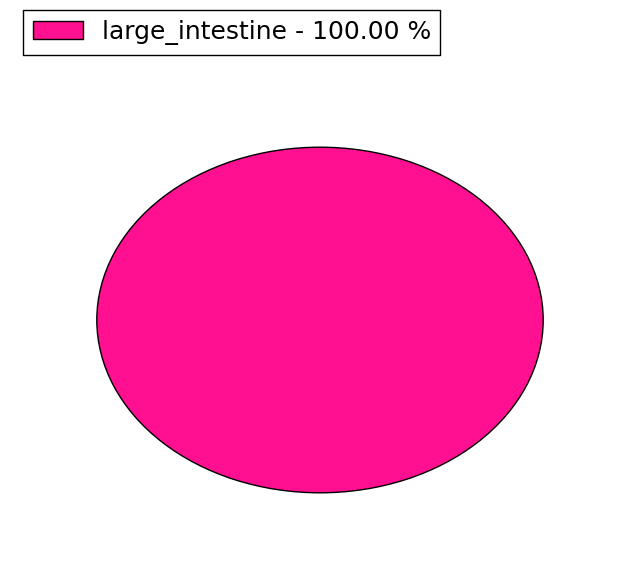
| Mutations for KMO |
| * Under tables are showing count per each tissue to give us broad intuition about tissue specific mutation patterns.You can go to the detailed page for each mutation database's web site. |
| There's no structural variation information in COSMIC data for this gene. |
| * From mRNA Sanger sequences, Chitars2.0 arranged chimeric transcripts. This table shows KMO related fusion information. |
| ID | Head Gene | Tail Gene | Accession | Gene_a | qStart_a | qEnd_a | Chromosome_a | tStart_a | tEnd_a | Gene_a | qStart_a | qEnd_a | Chromosome_a | tStart_a | tEnd_a |
| AI819879 | PSTPIP2 | 1 | 308 | 18 | 43563502 | 43563809 | KMO | 303 | 449 | 1 | 241720844 | 241720990 | |
| BG573396 | KMO | 1 | 146 | 1 | 241749339 | 241749484 | MALAT1 | 141 | 571 | 11 | 65266714 | 65267143 | |
| AW451493 | PSTPIP2 | 17 | 324 | 18 | 43563502 | 43563809 | KMO | 319 | 500 | 1 | 241720809 | 241720990 | |
| Top |
| Mutation type/ Tissue ID | brca | cns | cerv | endome | haematopo | kidn | Lintest | liver | lung | ns | ovary | pancre | prost | skin | stoma | thyro | urina | |||
| Total # sample | 1 | 1 | 2 | 1 | 2 | 2 | 1 | |||||||||||||
| GAIN (# sample) | 1 | 1 | 1 | 2 | 1 | |||||||||||||||
| LOSS (# sample) | 1 | 1 | 2 |
| cf) Tissue ID; Tissue type (1; Breast, 2; Central_nervous_system, 3; Cervix, 4; Endometrium, 5; Haematopoietic_and_lymphoid_tissue, 6; Kidney, 7; Large_intestine, 8; Liver, 9; Lung, 10; NS, 11; Ovary, 12; Pancreas, 13; Prostate, 14; Skin, 15; Stomach, 16; Thyroid, 17; Urinary_tract) |
| Top |
|
 |
| Top |
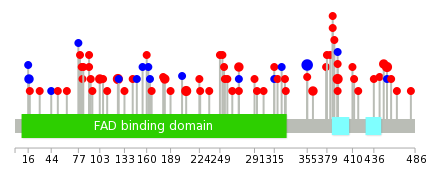
| Stat. for Non-Synonymous SNVs (# total SNVs=58) | (# total SNVs=14) |
 |  |
(# total SNVs=1) | (# total SNVs=2) |
 |  |
| Top |
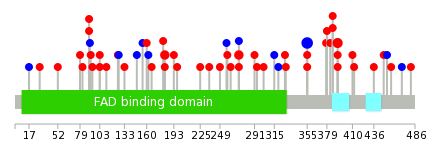
| * When you move the cursor on each content, you can see more deailed mutation information on the Tooltip. Those are primary_site,primary_histology,mutation(aa),pubmedID. |
| GRCh37 position | Mutation(aa) | Unique sampleID count |
| chr1:241752099-241752099 | p.A355A | 6 |
| chr1:241723977-241723977 | p.Y125C | 3 |
| chr1:241755348-241755348 | p.R452C | 3 |
| chr1:241728295-241728295 | p.M208I | 3 |
| chr1:241753390-241753390 | p.S392L | 3 |
| chr1:241714340-241714340 | p.S103Y | 2 |
| chr1:241752119-241752119 | p.Y362C | 2 |
| chr1:241725561-241725561 | p.R182C | 2 |
| chr1:241695795-241695795 | p.G17G | 2 |
| chr1:241753371-241753371 | p.L386I | 2 |
| Top |
|
 |
| Point Mutation/ Tissue ID | 1 | 2 | 3 | 4 | 5 | 6 | 7 | 8 | 9 | 10 | 11 | 12 | 13 | 14 | 15 | 16 | 17 | 18 | 19 | 20 |
| # sample | 1 | 1 | 17 | 1 | 1 | 9 | 5 | 3 | 10 | 3 | 12 | |||||||||
| # mutation | 1 | 1 | 15 | 1 | 1 | 8 | 5 | 3 | 10 | 3 | 12 | |||||||||
| nonsynonymous SNV | 1 | 1 | 12 | 1 | 5 | 4 | 2 | 8 | 1 | 11 | ||||||||||
| synonymous SNV | 3 | 1 | 3 | 1 | 1 | 2 | 2 | 1 |
| cf) Tissue ID; Tissue type (1; BLCA[Bladder Urothelial Carcinoma], 2; BRCA[Breast invasive carcinoma], 3; CESC[Cervical squamous cell carcinoma and endocervical adenocarcinoma], 4; COAD[Colon adenocarcinoma], 5; GBM[Glioblastoma multiforme], 6; Glioma Low Grade, 7; HNSC[Head and Neck squamous cell carcinoma], 8; KICH[Kidney Chromophobe], 9; KIRC[Kidney renal clear cell carcinoma], 10; KIRP[Kidney renal papillary cell carcinoma], 11; LAML[Acute Myeloid Leukemia], 12; LUAD[Lung adenocarcinoma], 13; LUSC[Lung squamous cell carcinoma], 14; OV[Ovarian serous cystadenocarcinoma ], 15; PAAD[Pancreatic adenocarcinoma], 16; PRAD[Prostate adenocarcinoma], 17; SKCM[Skin Cutaneous Melanoma], 18:STAD[Stomach adenocarcinoma], 19:THCA[Thyroid carcinoma], 20:UCEC[Uterine Corpus Endometrial Carcinoma]) |
| Top |
| * We represented just top 10 SNVs. When you move the cursor on each content, you can see more deailed mutation information on the Tooltip. Those are primary_site, primary_histology, mutation(aa), pubmedID. |
| Genomic Position | Mutation(aa) | Unique sampleID count |
| chr1:241752099 | p.A355A | 6 |
| chr1:241753390 | p.S392L | 3 |
| chr1:241752098 | p.L386I | 2 |
| chr1:241714340 | p.S392P | 2 |
| chr1:241725561 | p.L272P | 2 |
| chr1:241731805 | p.R182C | 2 |
| chr1:241753371 | p.L90V | 2 |
| chr1:241753389 | p.A355G | 2 |
| chr1:241714300 | p.S103F | 2 |
| chr1:241725514 | p.Y125C | 1 |
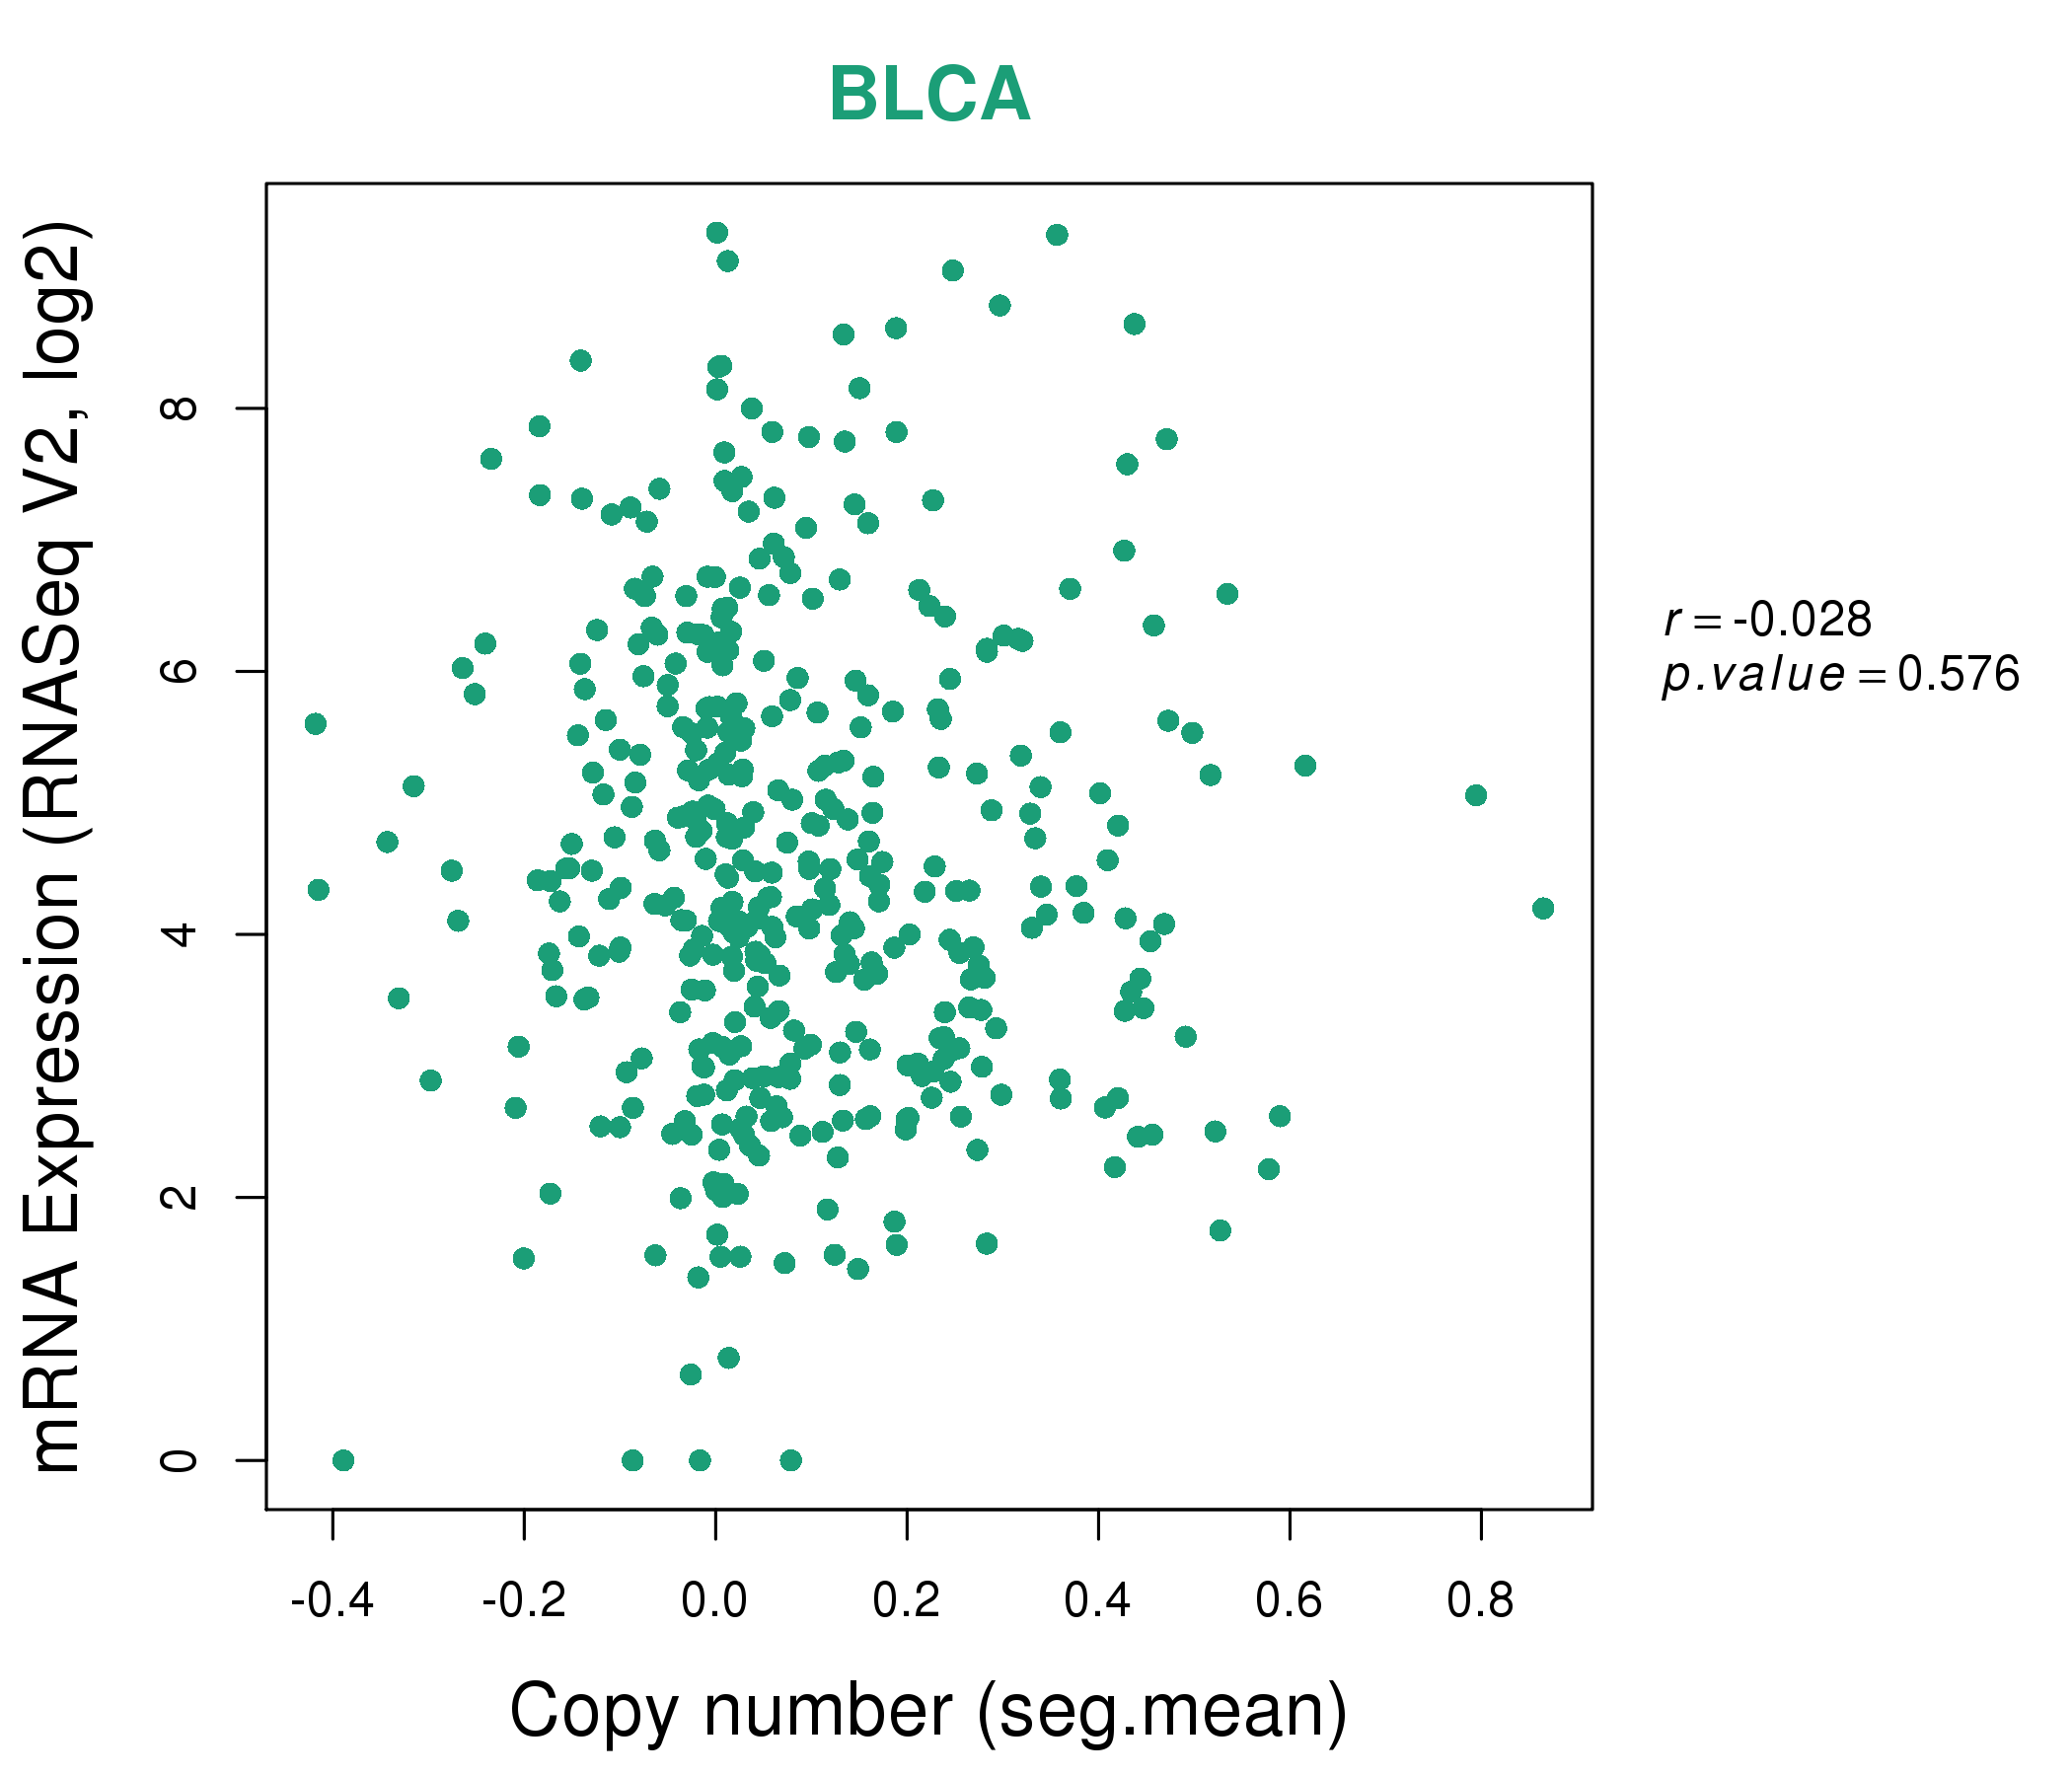
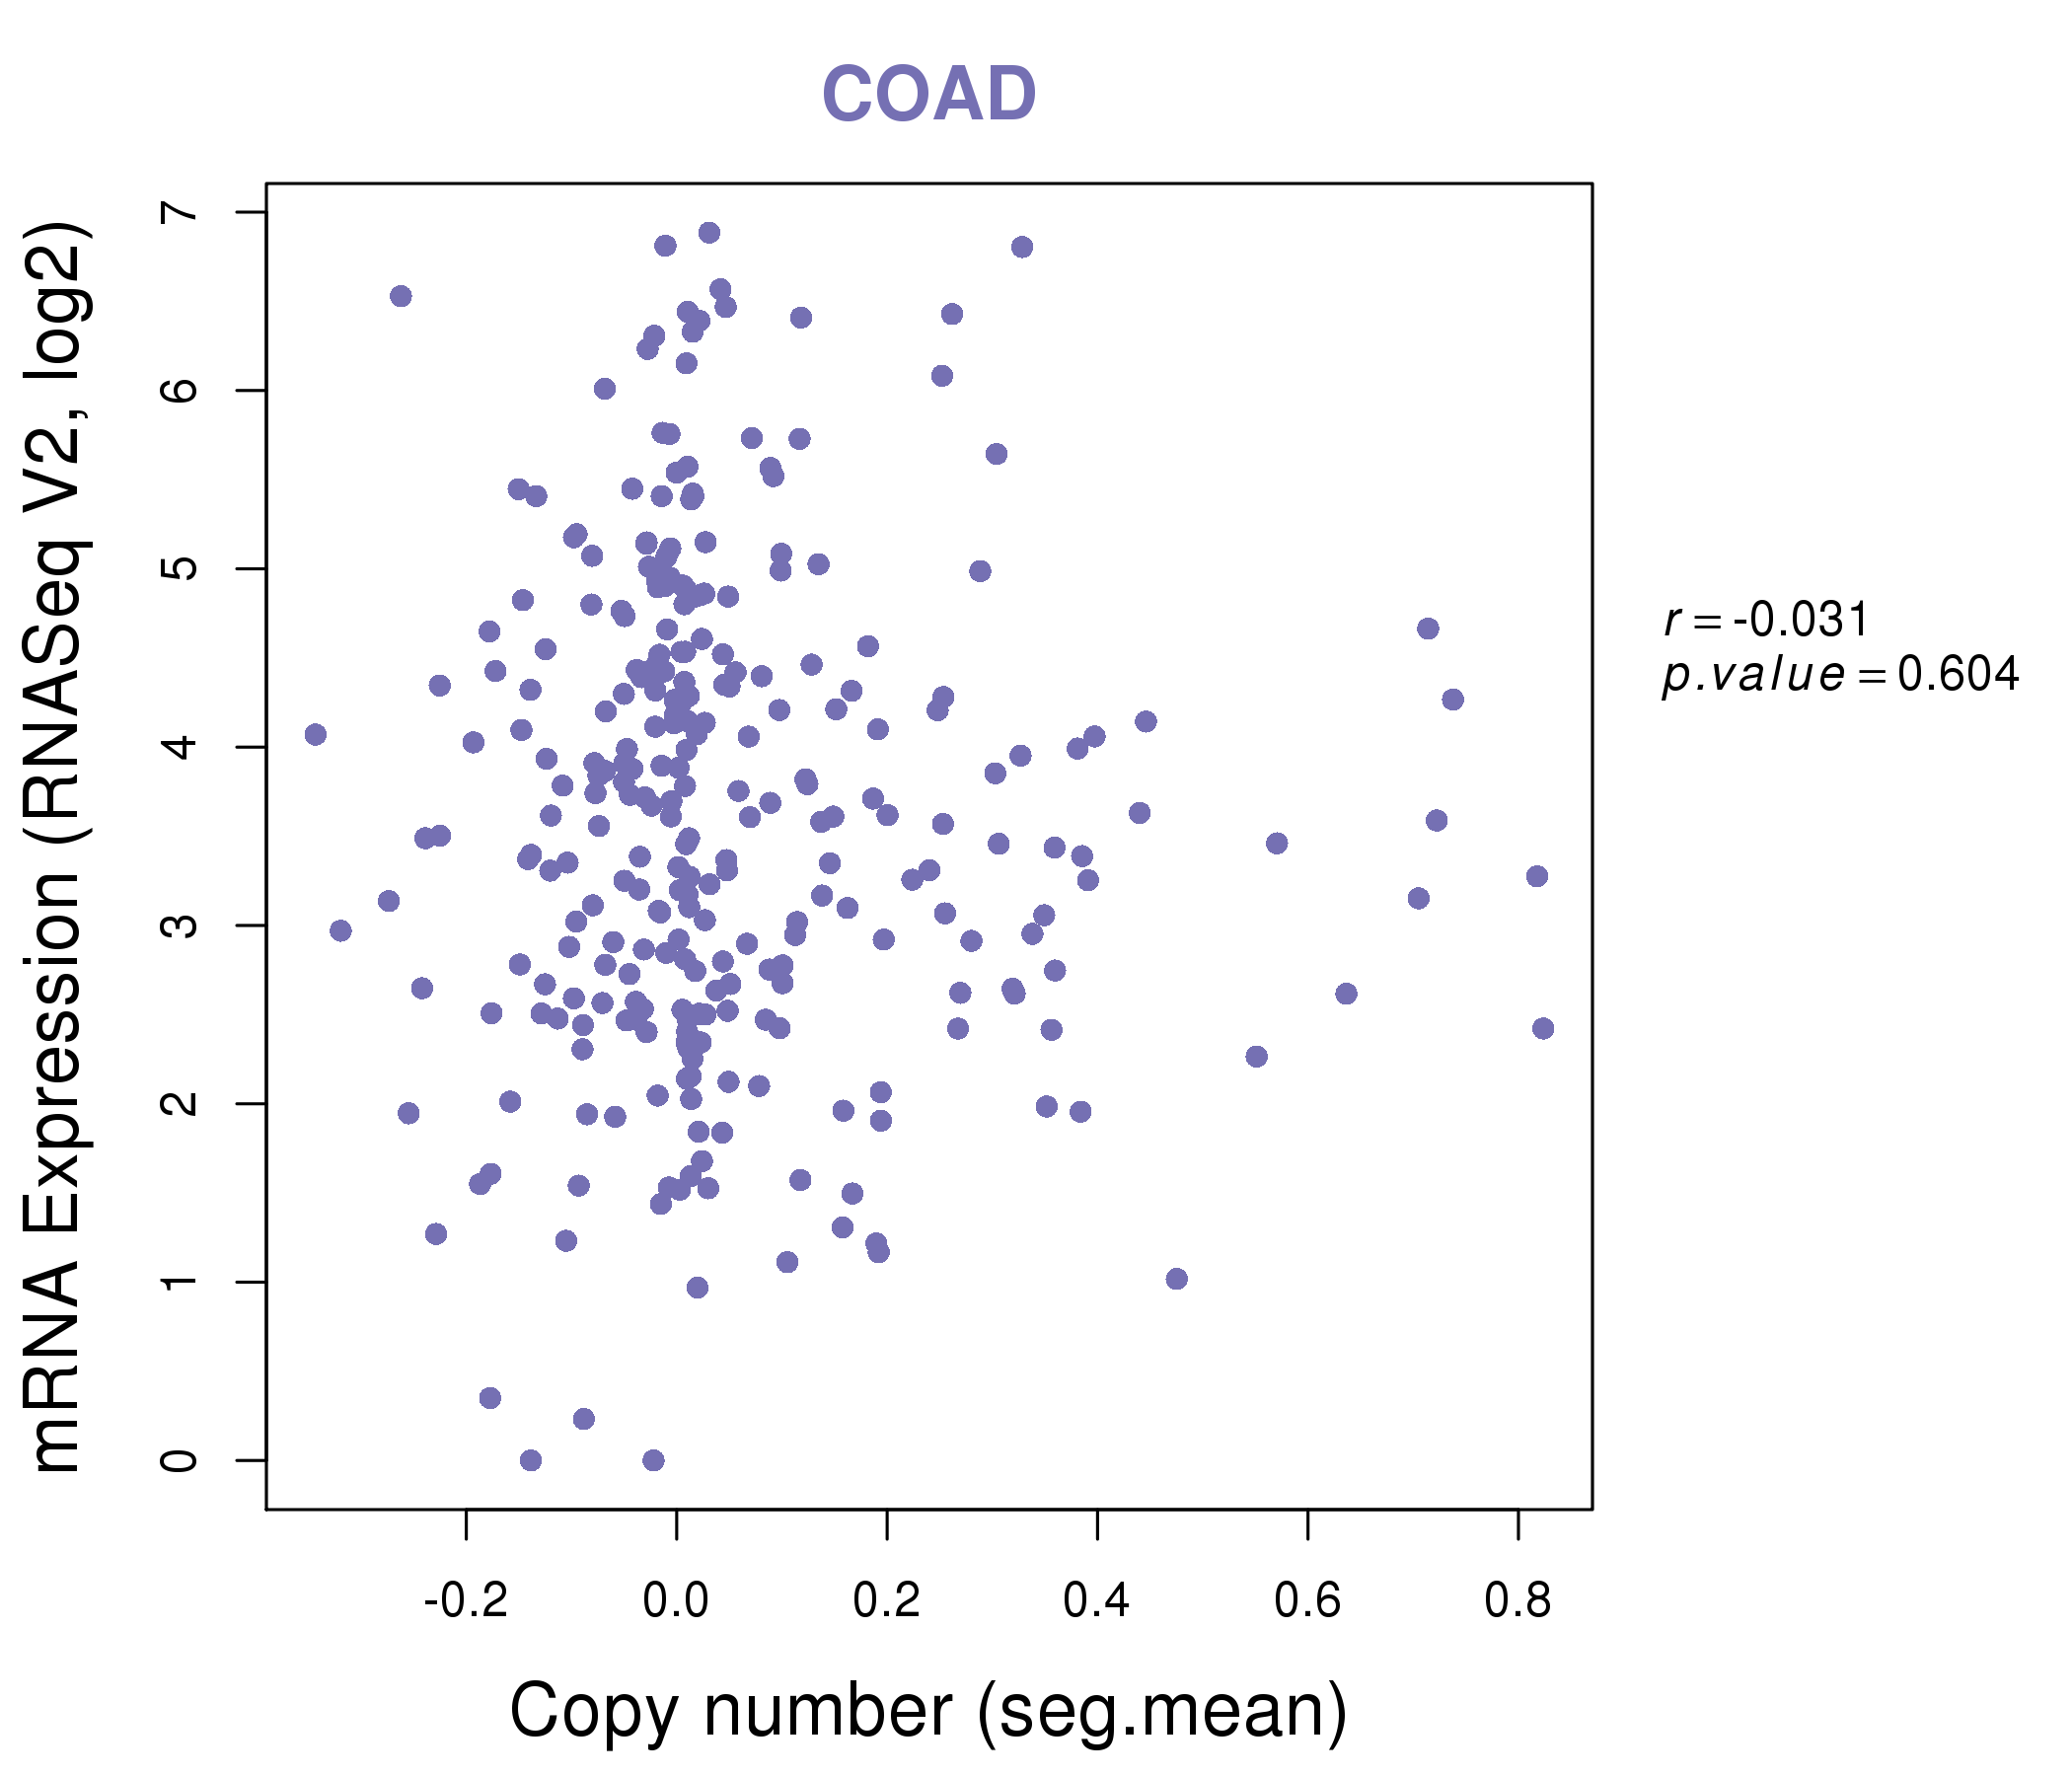
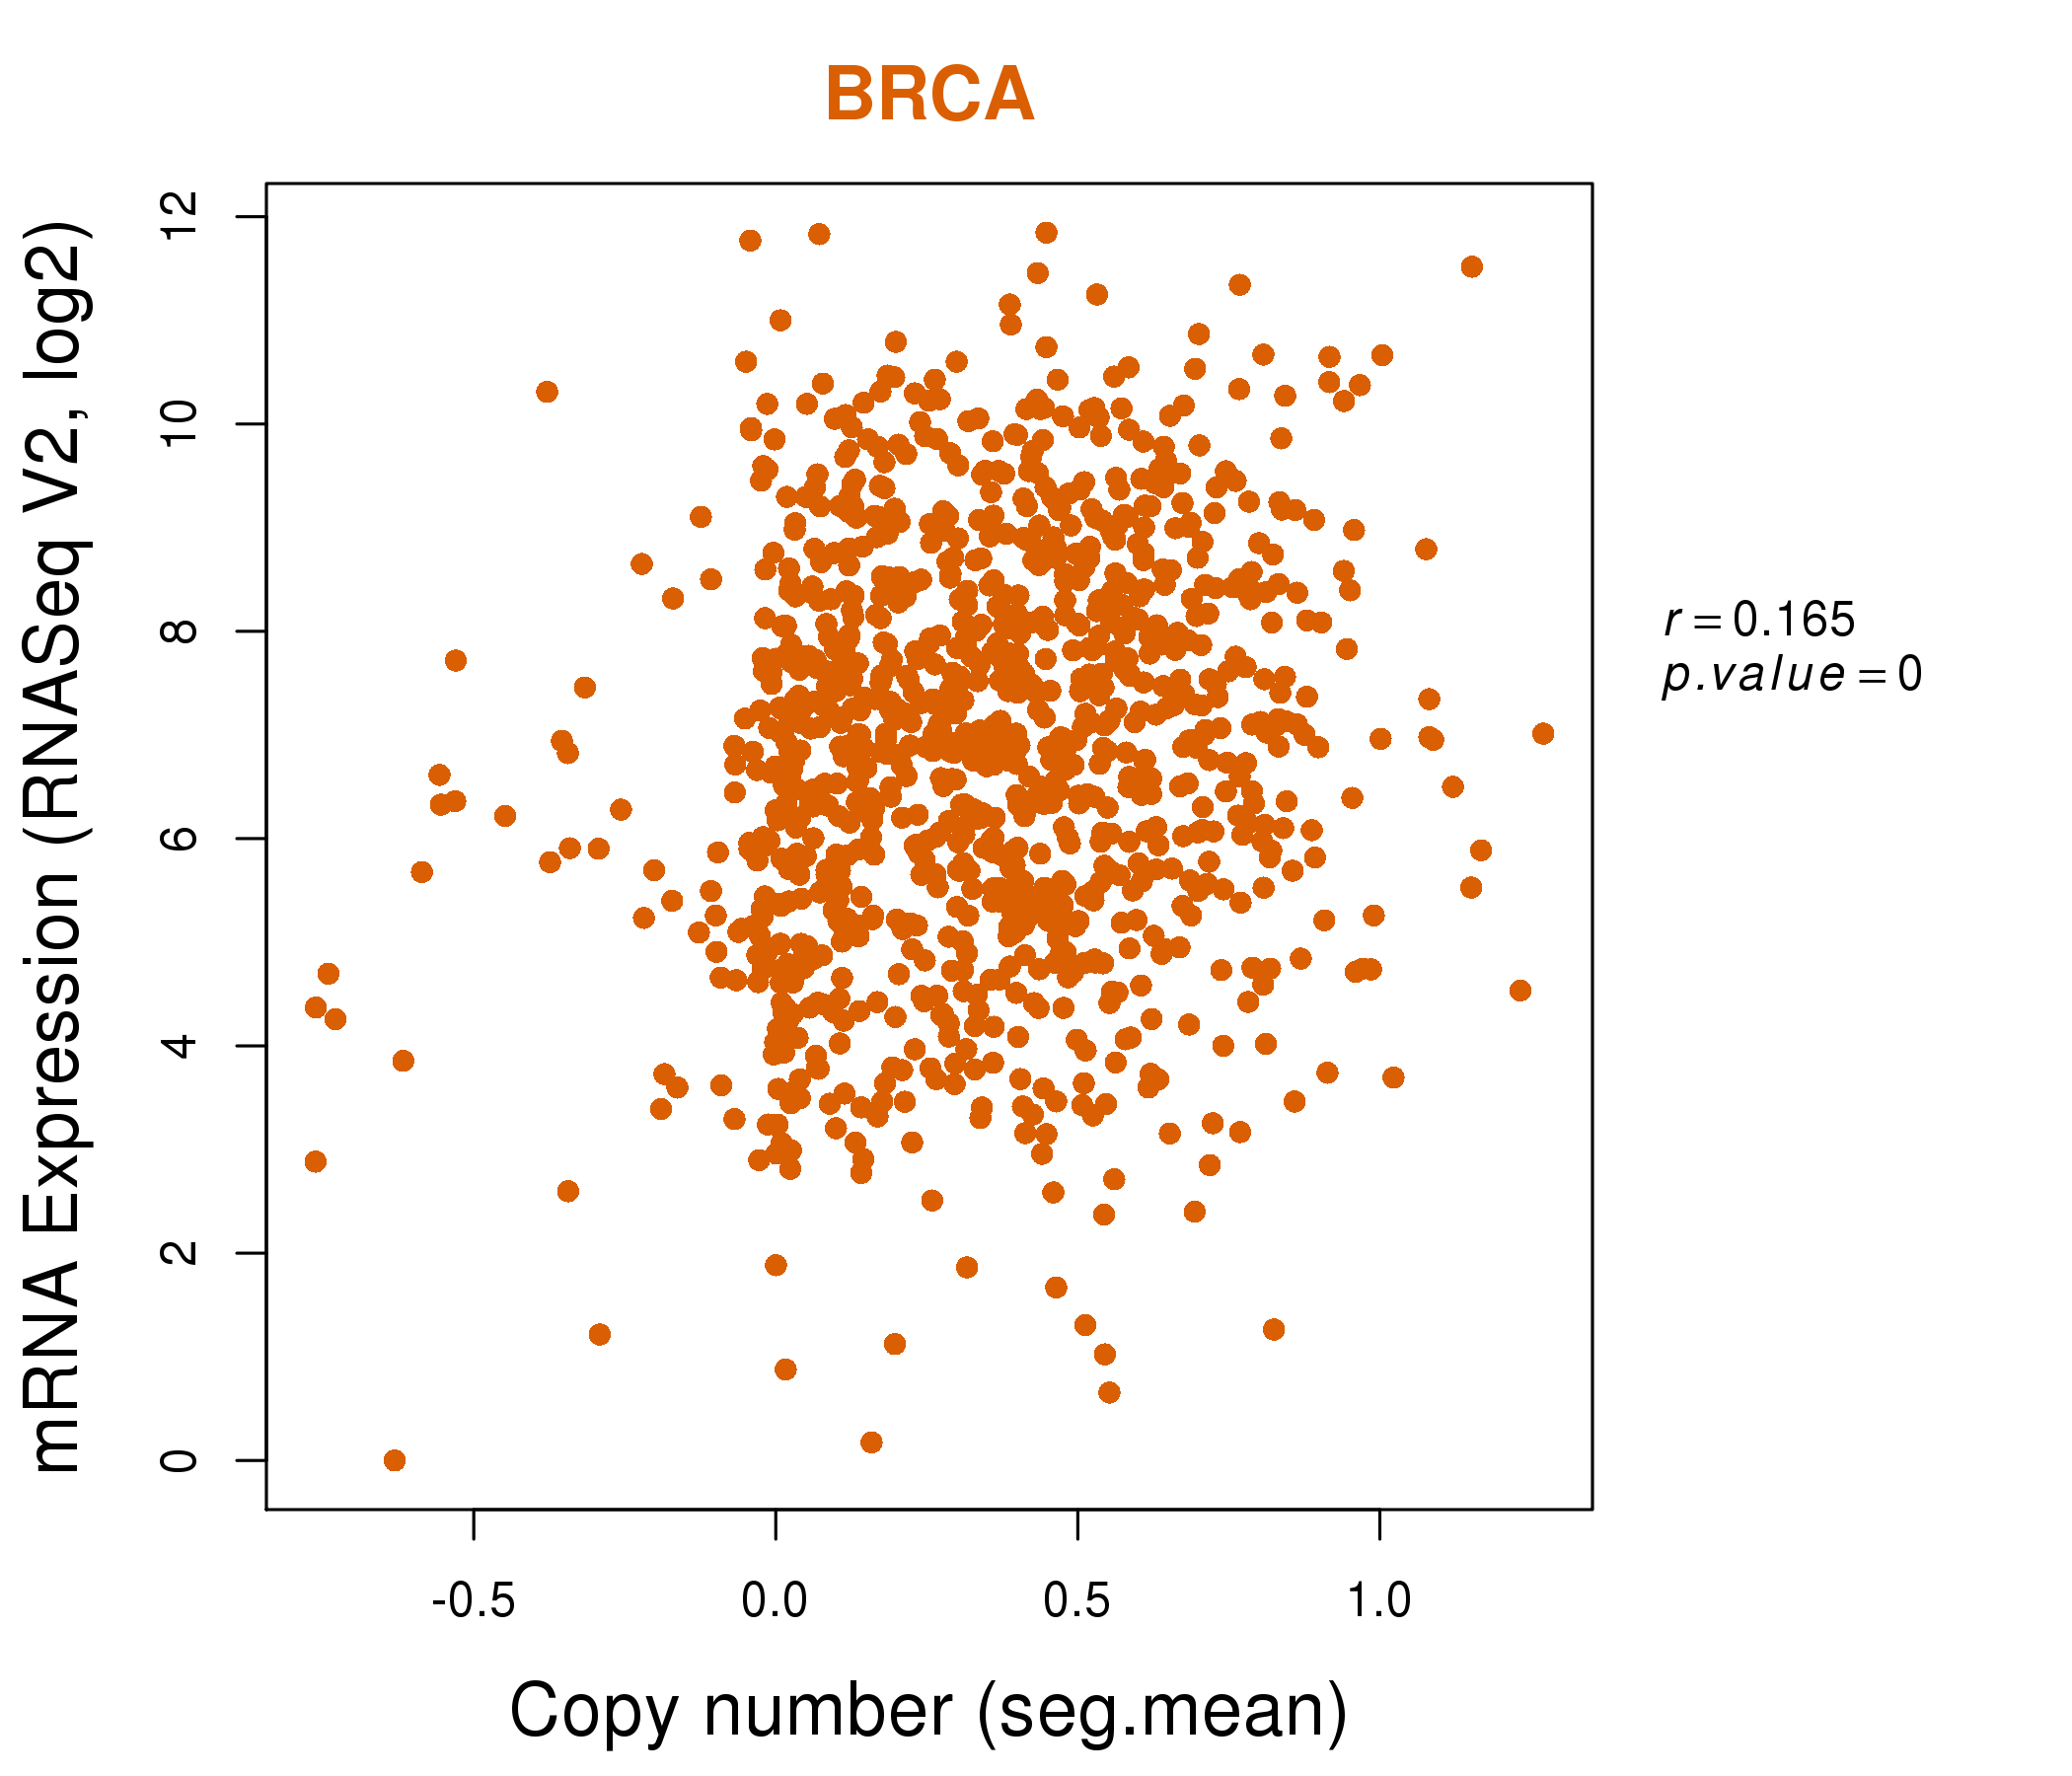
| * Copy number data were extracted from TCGA using R package TCGA-Assembler. The URLs of all public data files on TCGA DCC data server were gathered on Jan-05-2015. Function ProcessCNAData in TCGA-Assembler package was used to obtain gene-level copy number value which is calculated as the average copy number of the genomic region of a gene. |
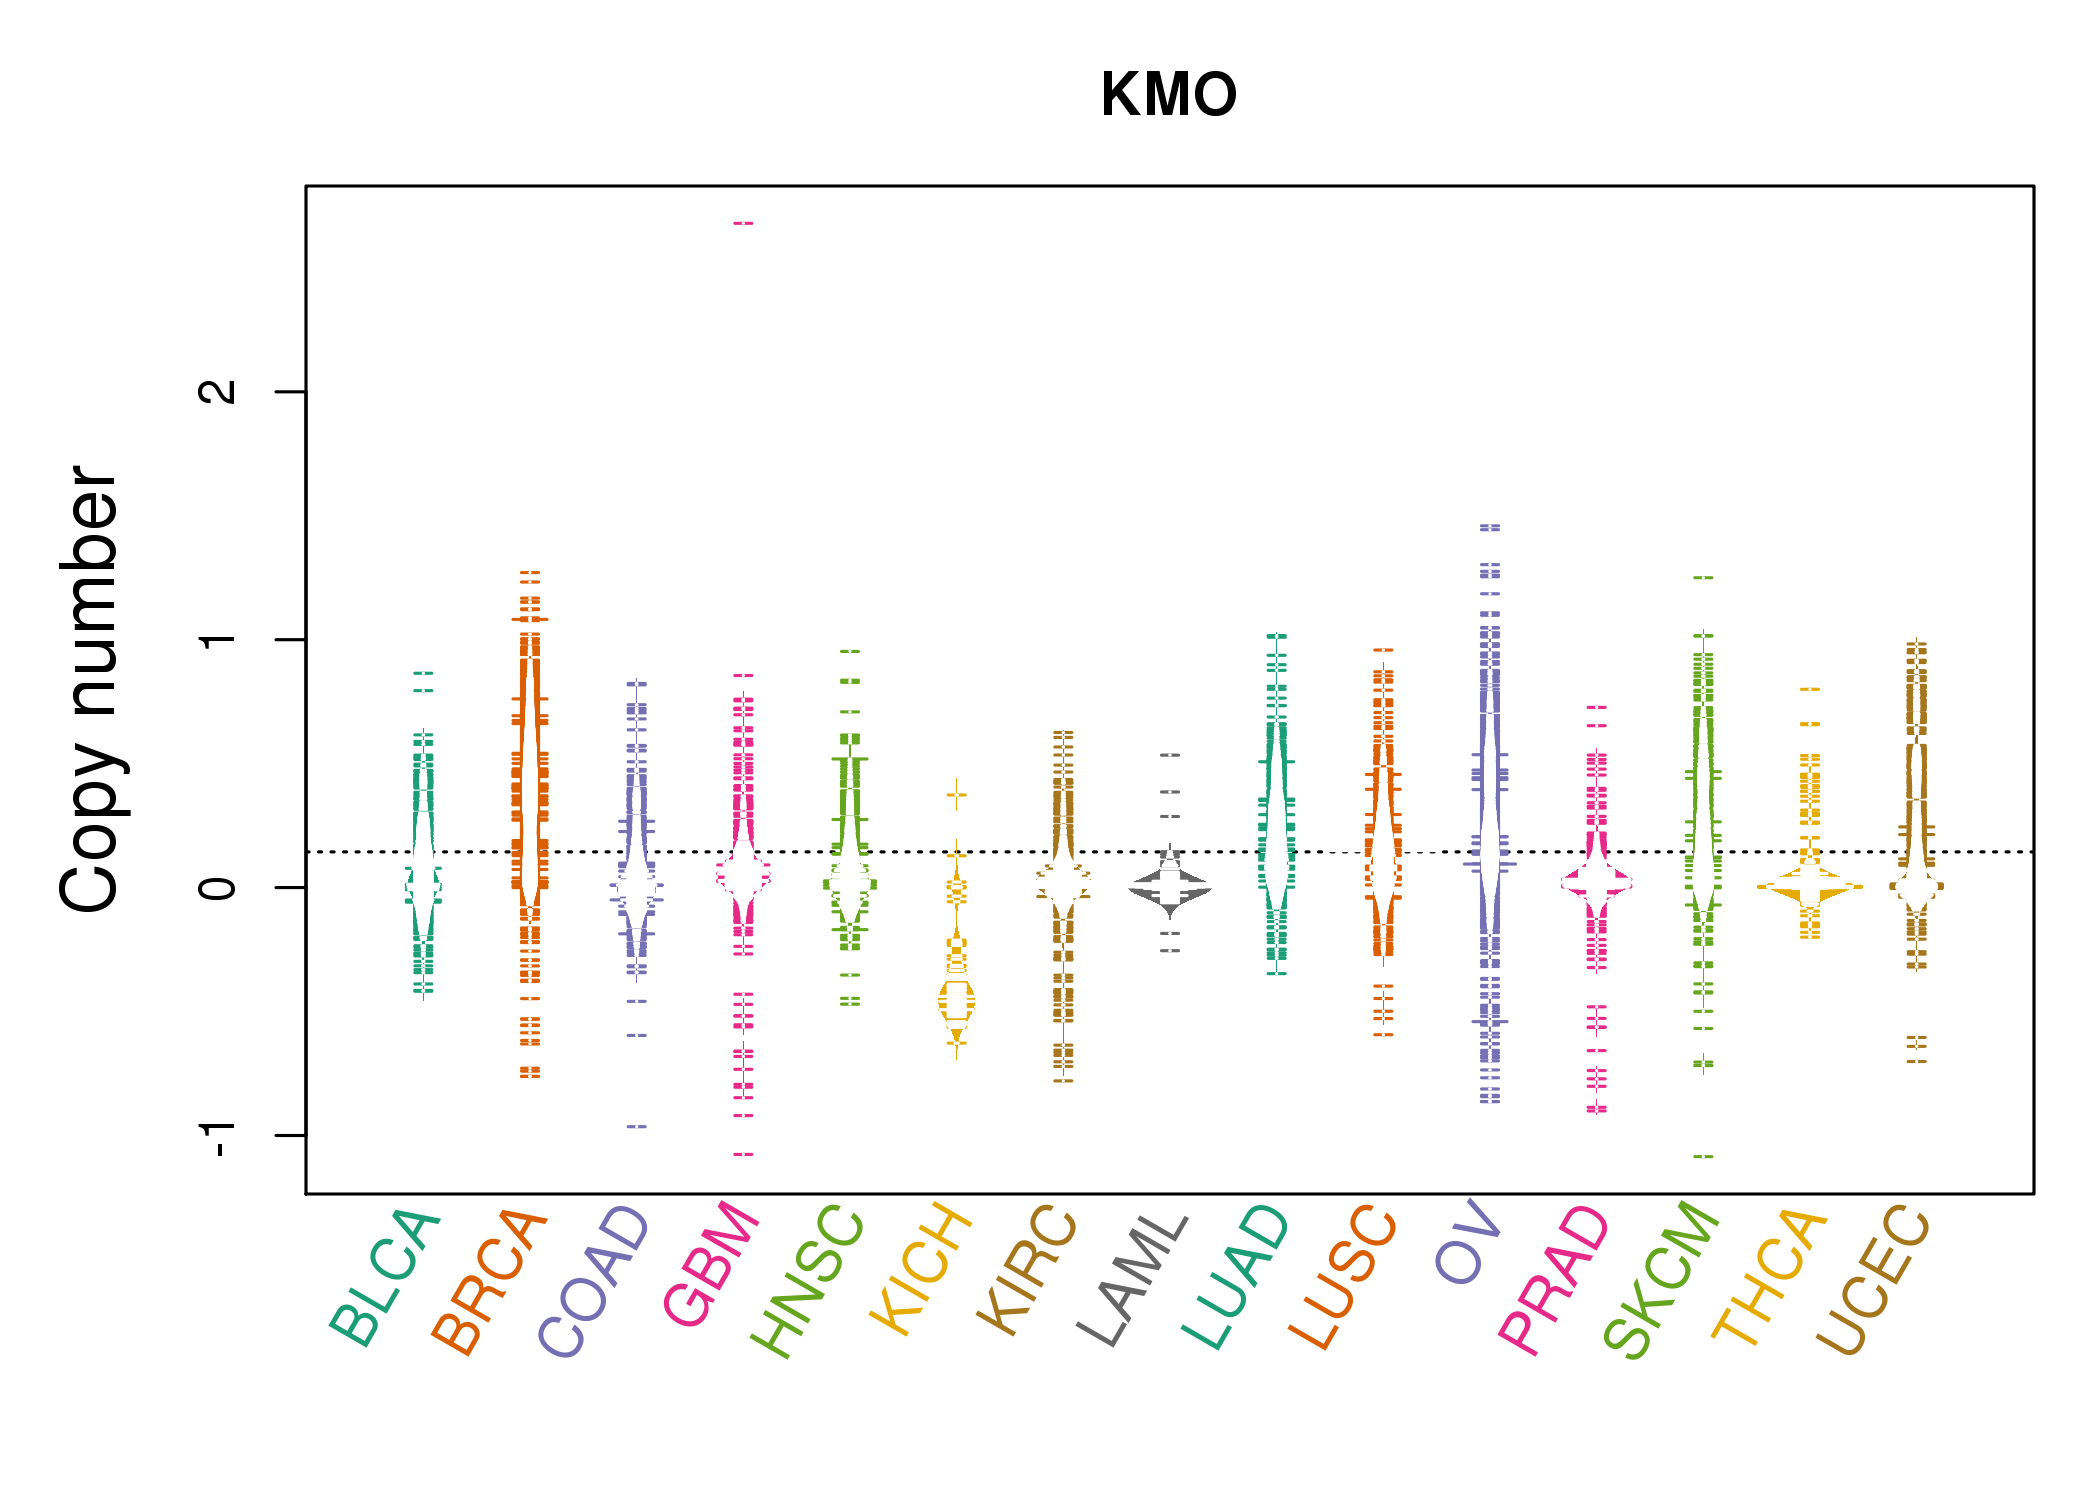 |
| cf) Tissue ID[Tissue type]: BLCA[Bladder Urothelial Carcinoma], BRCA[Breast invasive carcinoma], CESC[Cervical squamous cell carcinoma and endocervical adenocarcinoma], COAD[Colon adenocarcinoma], GBM[Glioblastoma multiforme], Glioma Low Grade, HNSC[Head and Neck squamous cell carcinoma], KICH[Kidney Chromophobe], KIRC[Kidney renal clear cell carcinoma], KIRP[Kidney renal papillary cell carcinoma], LAML[Acute Myeloid Leukemia], LUAD[Lung adenocarcinoma], LUSC[Lung squamous cell carcinoma], OV[Ovarian serous cystadenocarcinoma ], PAAD[Pancreatic adenocarcinoma], PRAD[Prostate adenocarcinoma], SKCM[Skin Cutaneous Melanoma], STAD[Stomach adenocarcinoma], THCA[Thyroid carcinoma], UCEC[Uterine Corpus Endometrial Carcinoma] |
| Top |
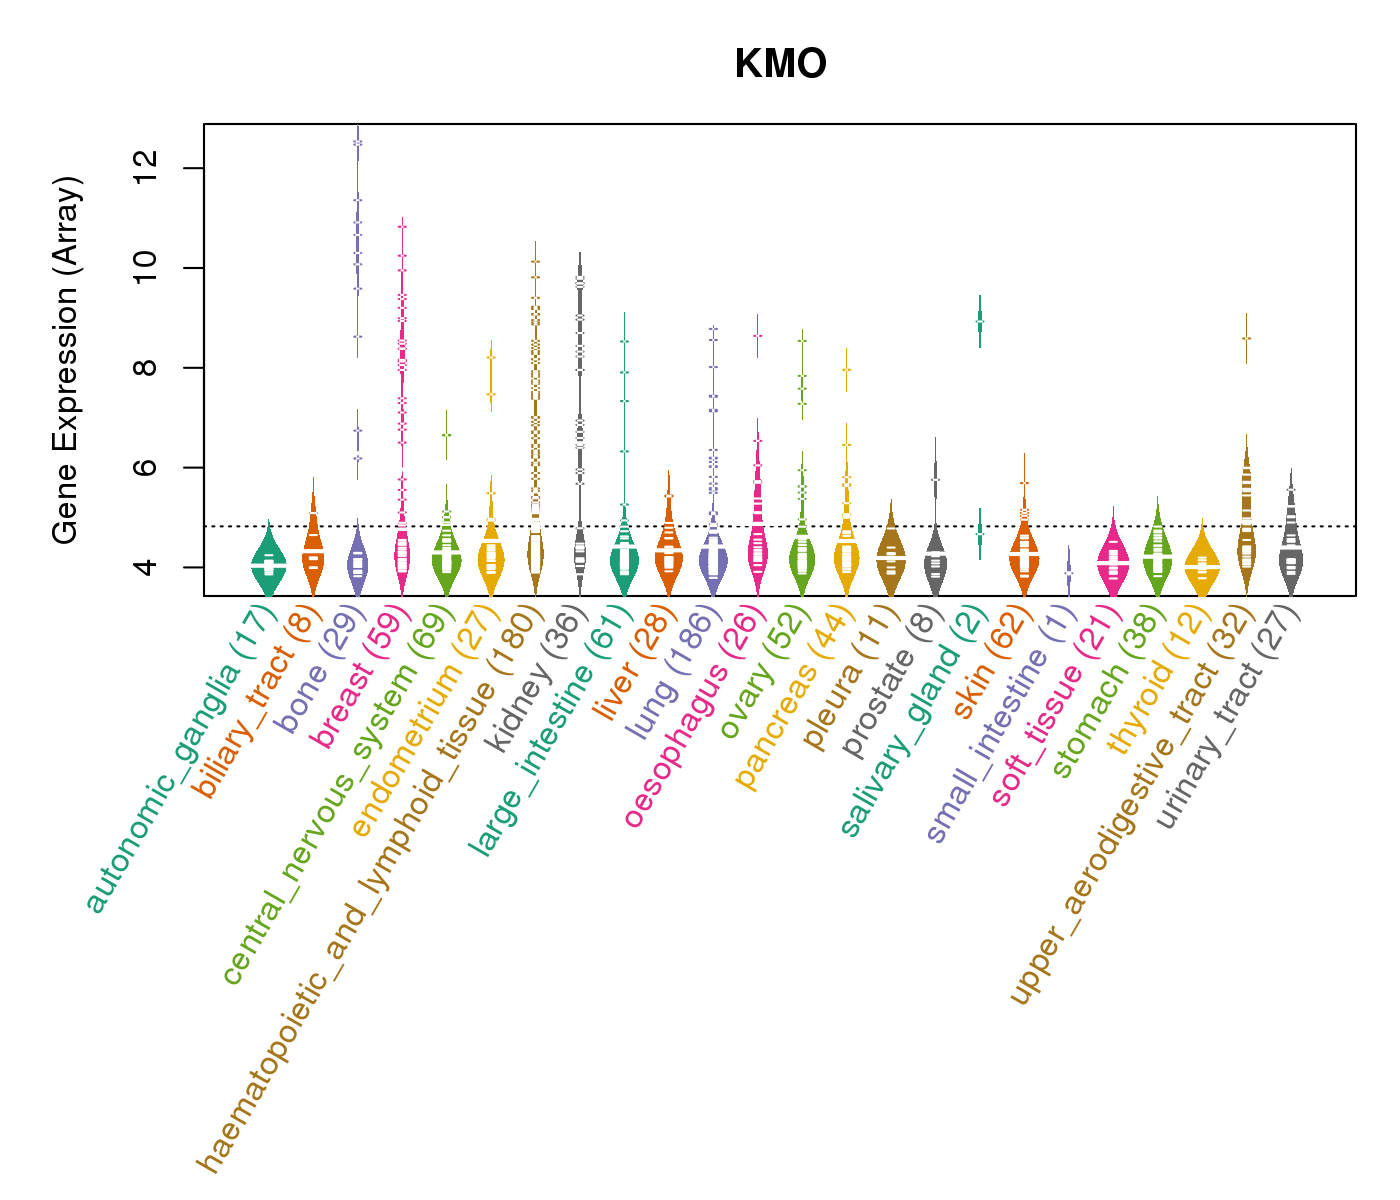
| Gene Expression for KMO |
| * CCLE gene expression data were extracted from CCLE_Expression_Entrez_2012-10-18.res: Gene-centric RMA-normalized mRNA expression data. |
 |
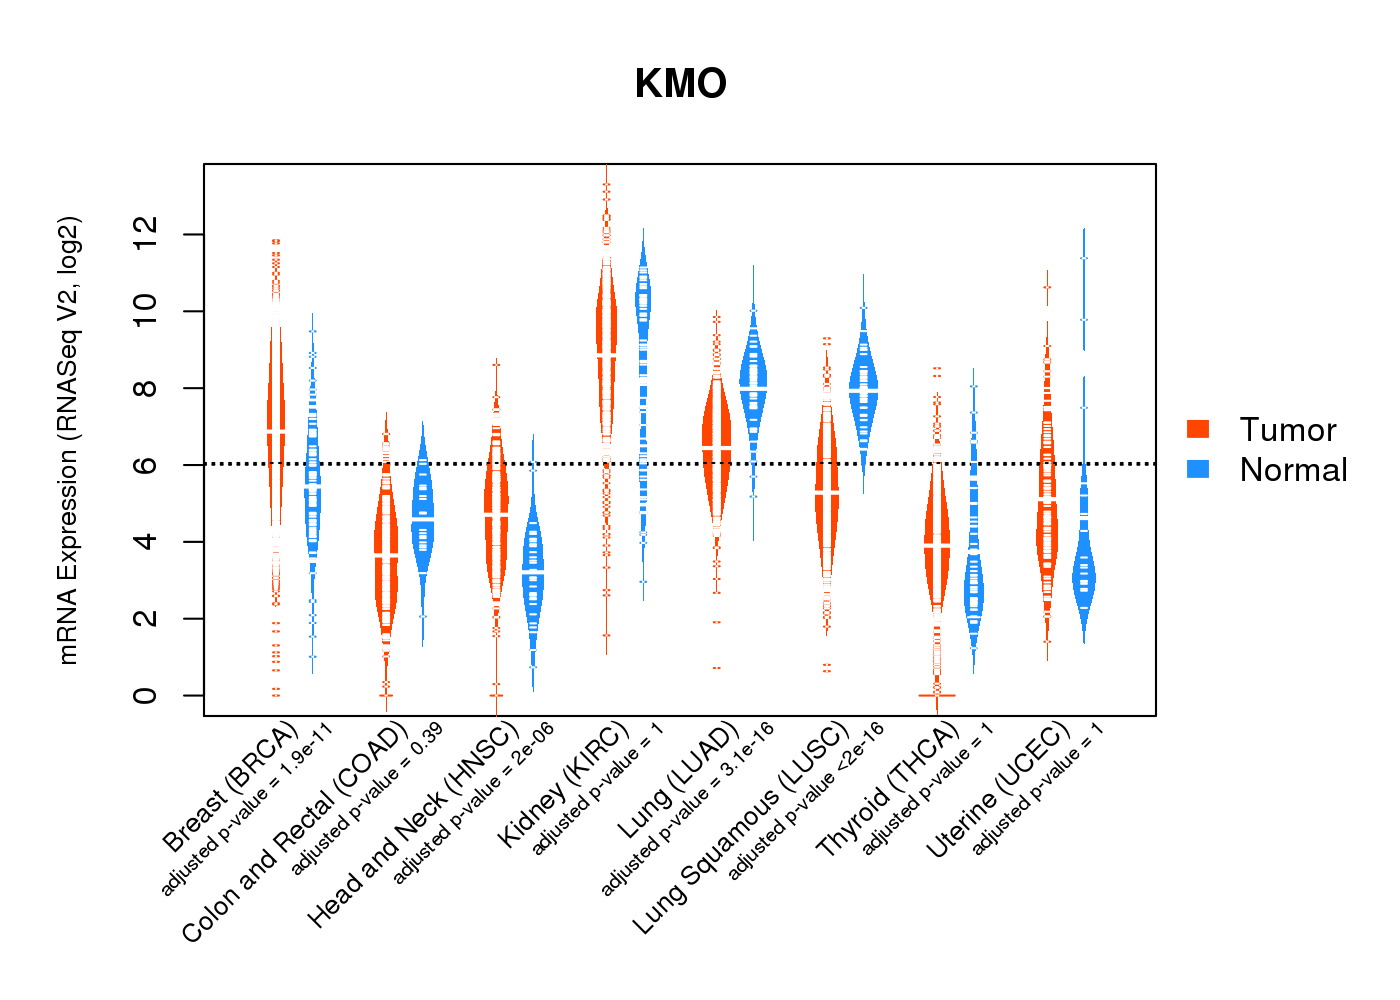
| * Normalized gene expression data of RNASeqV2 was extracted from TCGA using R package TCGA-Assembler. The URLs of all public data files on TCGA DCC data server were gathered at Jan-05-2015. Only eight cancer types have enough normal control samples for differential expression analysis. (t test, adjusted p<0.05 (using Benjamini-Hochberg FDR)) |
 |
| Top |
| * This plots show the correlation between CNV and gene expression. |
: Open all plots for all cancer types
 |
|
 |
|

| Top |
| Gene-Gene Network Information |
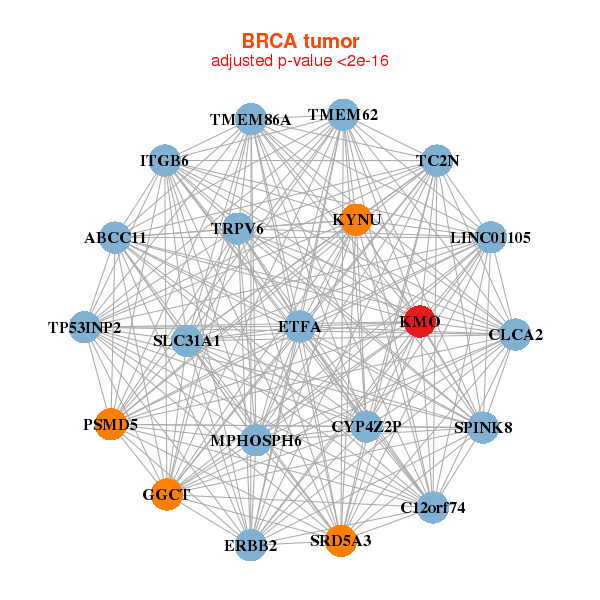
| * Co-Expression network figures were drawn using R package igraph. Only the top 20 genes with the highest correlations were shown. Red circle: input gene, orange circle: cell metabolism gene, sky circle: other gene |
: Open all plots for all cancer types
 |
| ||||
| ABCC11,C12orf74,CLCA2,CYP4Z2P,ERBB2,ETFA,GGCT, ITGB6,KMO,KYNU,LINC01105,MPHOSPH6,PSMD5,SLC31A1, SPINK8,SRD5A3,TC2N,TMEM62,TMEM86A,TP53INP2,TRPV6 | AFMID,AKR1B15,ALDH3B2,DHRS2,GGT1,GGTLC2,HIST1H2AE, HIST1H2BG,HIST1H3D,HIST1H4H,HMGCS2,HRASLS2,KMO,KYNU, PPEF1,RASGRF1,SERHL2,SERHL,SPINK8,UGT2B10,UGT2B28 | ||||
 |
| ||||
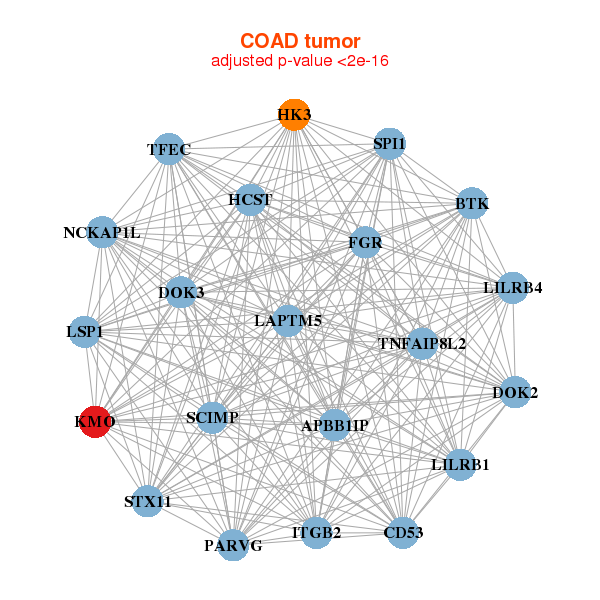
| APBB1IP,BTK,SCIMP,CD53,DOK2,DOK3,FGR, HCST,HK3,ITGB2,KMO,LAPTM5,LILRB1,LILRB4, LSP1,NCKAP1L,PARVG,SPI1,STX11,TFEC,TNFAIP8L2 | ARHGAP15,ARHGAP25,ARHGDIB,BTK,BTLA,CCL19,CD53, CD72,CSTA,DAPP1,GAPT,HLA-DOB,ICOS,KMO, LAT2,LY86,PTPRC,RGS19,RHOH,SERPINB9,TNFAIP8 |
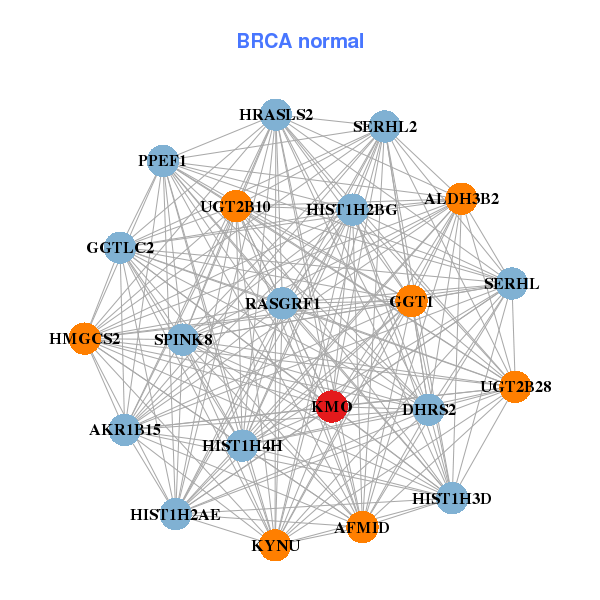
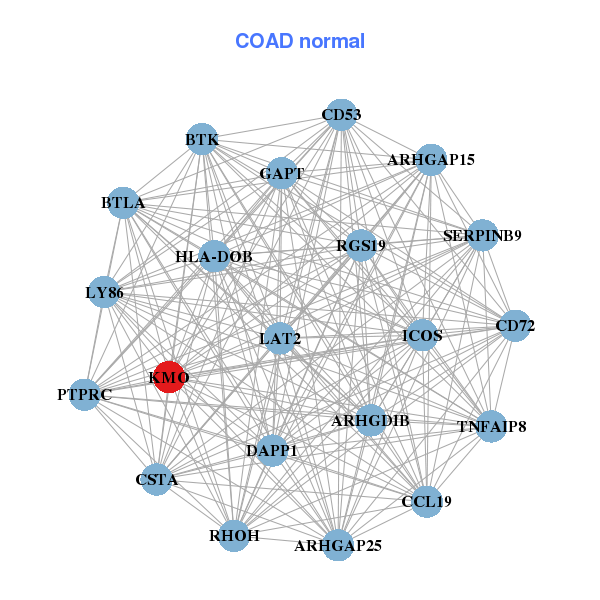
| * Co-Expression network figures were drawn using R package igraph. Only the top 20 genes with the highest correlations were shown. Red circle: input gene, orange circle: cell metabolism gene, sky circle: other gene |
: Open all plots for all cancer types
| Top |
: Open all interacting genes' information including KEGG pathway for all interacting genes from DAVID
| Top |
| Pharmacological Information for KMO |
| DB Category | DB Name | DB's ID and Url link |
| * Gene Centered Interaction Network. |
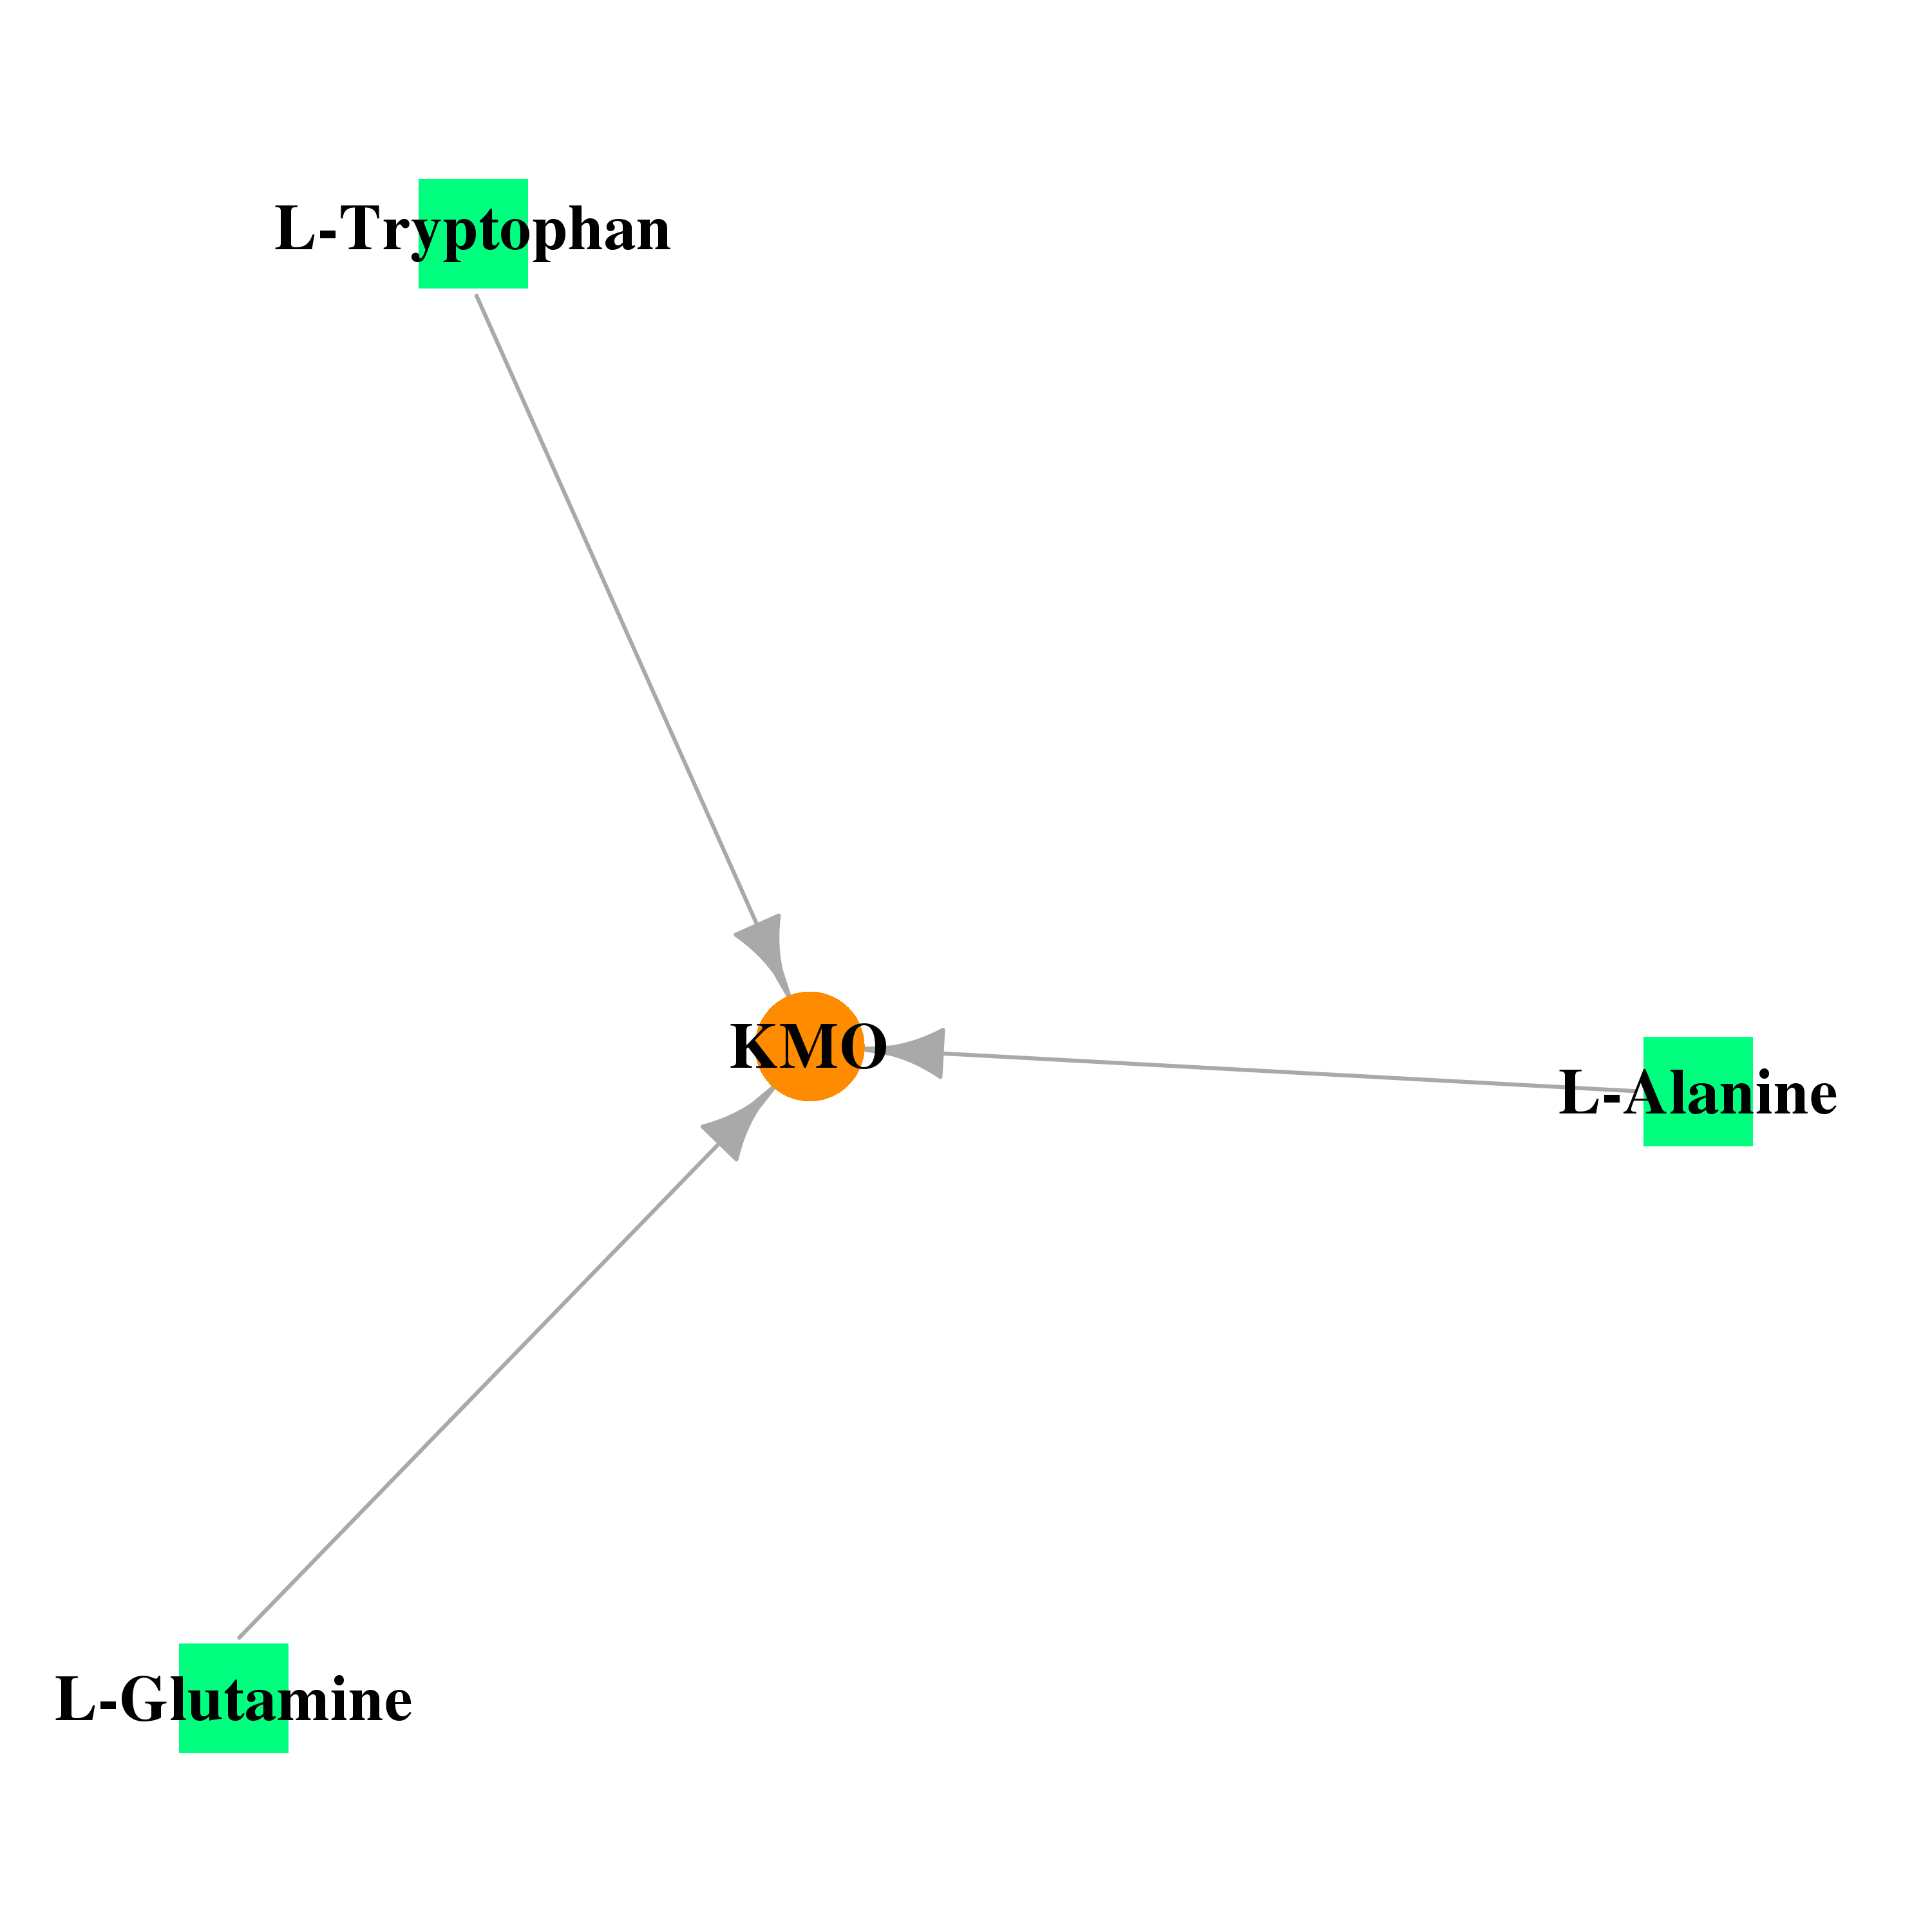 |
| * Drug Centered Interaction Network. |
| DrugBank ID | Target Name | Drug Groups | Generic Name | Drug Centered Network | Drug Structure |
| DB00130 | kynurenine 3-monooxygenase (kynurenine 3-hydroxylase) | approved; nutraceutical; investigational | L-Glutamine |  |  |
| DB00160 | kynurenine 3-monooxygenase (kynurenine 3-hydroxylase) | approved; nutraceutical | L-Alanine |  | 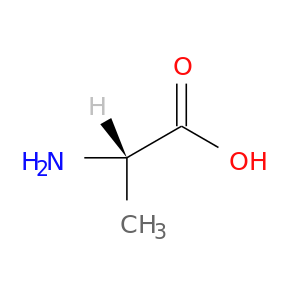 |
| DB00150 | kynurenine 3-monooxygenase (kynurenine 3-hydroxylase) | approved; nutraceutical | L-Tryptophan | 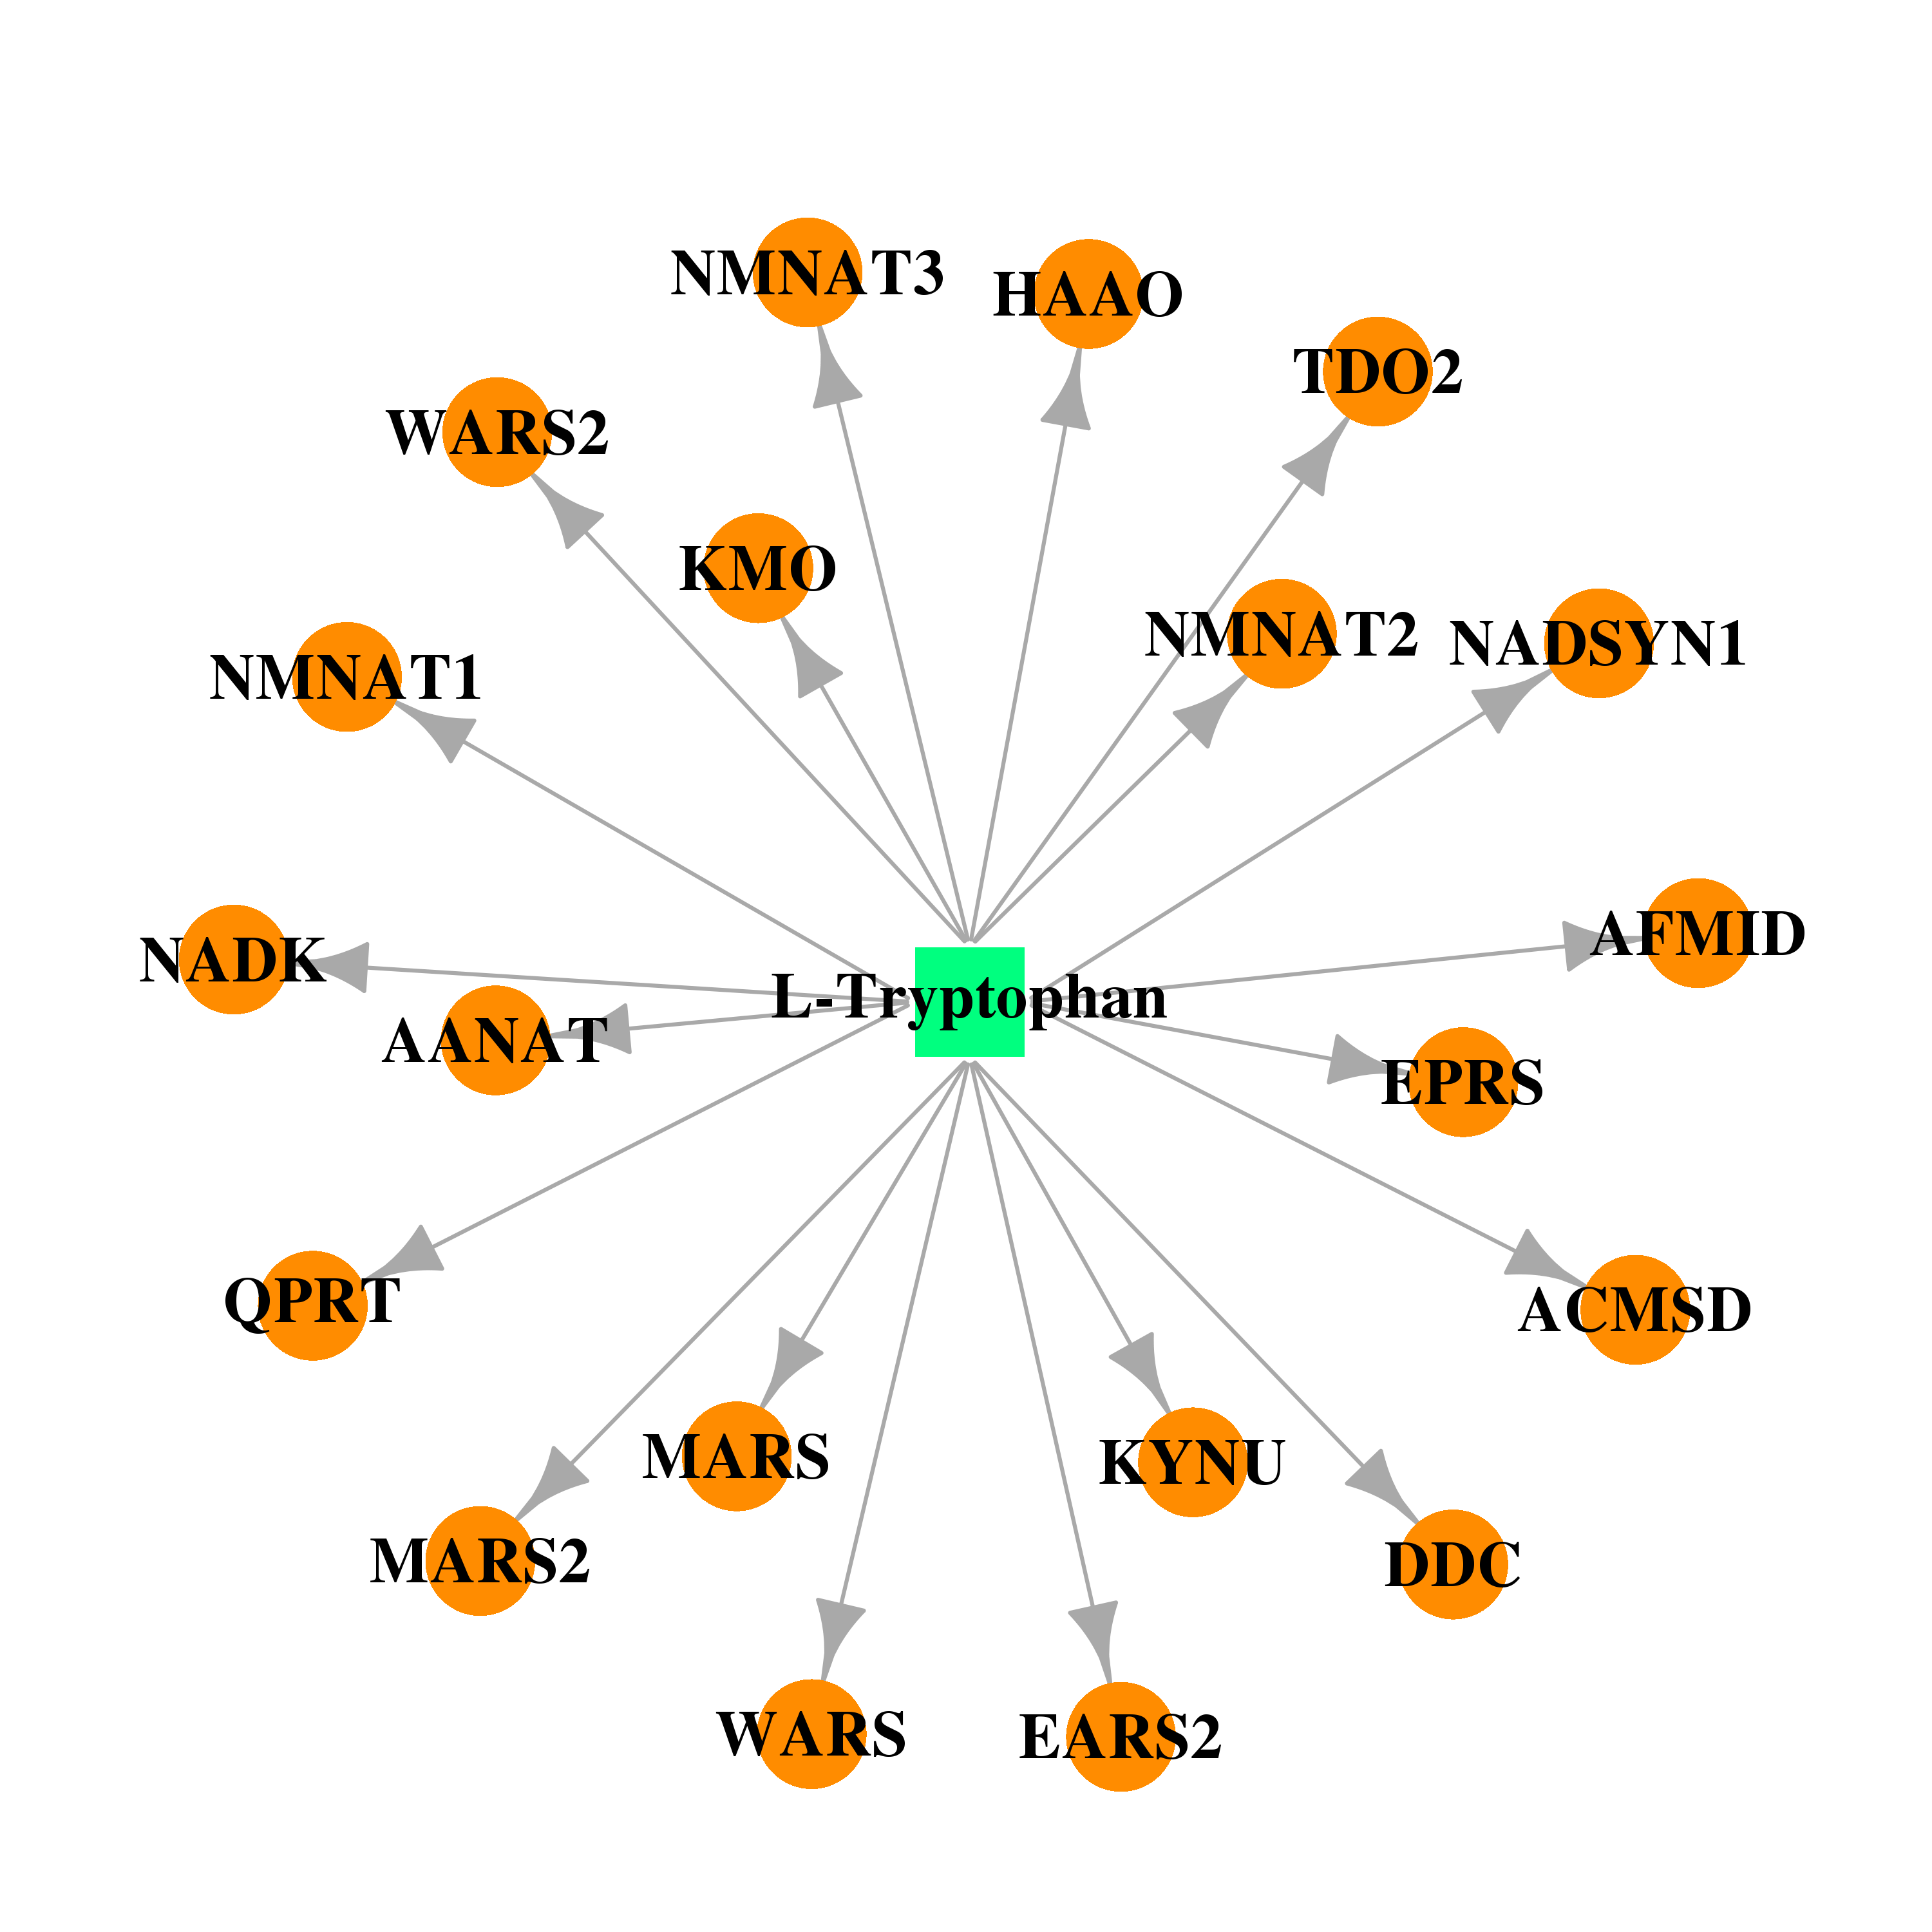 | 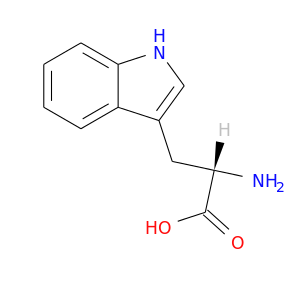 |
| Top |
| Cross referenced IDs for KMO |
| * We obtained these cross-references from Uniprot database. It covers 150 different DBs, 18 categories. http://www.uniprot.org/help/cross_references_section |
: Open all cross reference information
|
Copyright © 2016-Present - The Univsersity of Texas Health Science Center at Houston @ |