|
||||||||||||||||||||||||||||||||||||||||||||||||||||||||||||||||||||||||||||||||||||||||||||||||||||||||||||||||||||||||||||||||||||||||||||||||||||||||||||||||||||||||||||||||||||||||||||||||||||||||||||||||||||||||||||||||||||||||||||||||||||||||||||||||||||||||||||||||||||||||||||||||||||||||||||||||||||||||||
| |
| Phenotypic Information (metabolism pathway, cancer, disease, phenome) |
| |
| |
| Gene-Gene Network Information: Co-Expression Network, Interacting Genes & KEGG |
| |
|


| Gene Summary for KHSRP |
| Top |
| Phenotypic Information for KHSRP(metabolism pathway, cancer, disease, phenome) |
| Cancer | CGAP: KHSRP |
| Familial Cancer Database: KHSRP | |
| * This gene is included in those cancer gene databases. |
|
|
|
|
|
| . | ||||||||||||||||||||||||||||||||||||||||||||||||||||||||||||||||||||||||||||||||||||||||||||||||||||||||||||||||||||||||||||||||||||||||||||||||||||||||||||||||||||||||||||||||||||||||||||||||||||||||||||||||||||||||||||||||||||||||||||||||||||||||||||||||||||||||||||||||||||||||||||||||||||||||||||||||||||
Oncogene 1 | Significant driver gene in | |||||||||||||||||||||||||||||||||||||||||||||||||||||||||||||||||||||||||||||||||||||||||||||||||||||||||||||||||||||||||||||||||||||||||||||||||||||||||||||||||||||||||||||||||||||||||||||||||||||||||||||||||||||||||||||||||||||||||||||||||||||||||||||||||||||||||||||||||||||||||||||||||||||||||||||||||||||||||
| cf) number; DB name 1 Oncogene; http://nar.oxfordjournals.org/content/35/suppl_1/D721.long, 2 Tumor Suppressor gene; https://bioinfo.uth.edu/TSGene/, 3 Cancer Gene Census; http://www.nature.com/nrc/journal/v4/n3/abs/nrc1299.html, 4 CancerGenes; http://nar.oxfordjournals.org/content/35/suppl_1/D721.long, 5 Network of Cancer Gene; http://ncg.kcl.ac.uk/index.php, 1Therapeutic Vulnerabilities in Cancer; http://cbio.mskcc.org/cancergenomics/statius/ |
| REACTOME_METABOLISM_OF_MRNA REACTOME_METABOLISM_OF_RNA | |
| OMIM | |
| Orphanet | |
| Disease | KEGG Disease: KHSRP |
| MedGen: KHSRP (Human Medical Genetics with Condition) | |
| ClinVar: KHSRP | |
| Phenotype | MGI: KHSRP (International Mouse Phenotyping Consortium) |
| PhenomicDB: KHSRP | |
| Mutations for KHSRP |
| * Under tables are showing count per each tissue to give us broad intuition about tissue specific mutation patterns.You can go to the detailed page for each mutation database's web site. |
| There's no structural variation information in COSMIC data for this gene. |
| * From mRNA Sanger sequences, Chitars2.0 arranged chimeric transcripts. This table shows KHSRP related fusion information. |
| ID | Head Gene | Tail Gene | Accession | Gene_a | qStart_a | qEnd_a | Chromosome_a | tStart_a | tEnd_a | Gene_a | qStart_a | qEnd_a | Chromosome_a | tStart_a | tEnd_a |
| BU902214 | KHSRP | 10 | 76 | 19 | 6424675 | 6424741 | CRTAP | 74 | 896 | 3 | 33155645 | 33171525 | |
| BU619509 | KHSRP | 14 | 188 | 19 | 6413362 | 6414007 | KHSRP | 186 | 531 | 19 | 6413834 | 6414179 | |
| AA628946 | KHSRP | 1 | 501 | 19 | 6413849 | 6414351 | IGFBP5 | 495 | 603 | 2 | 217541404 | 217541512 | |
| M64437 | KHSRP | 353 | 378 | 19 | 6424751 | 6424776 | BHLHE41 | 362 | 658 | 12 | 26275216 | 26275577 | |
| Top |
| Mutation type/ Tissue ID | brca | cns | cerv | endome | haematopo | kidn | Lintest | liver | lung | ns | ovary | pancre | prost | skin | stoma | thyro | urina | |||
| Total # sample | 1 | |||||||||||||||||||
| GAIN (# sample) | 1 | |||||||||||||||||||
| LOSS (# sample) |
| cf) Tissue ID; Tissue type (1; Breast, 2; Central_nervous_system, 3; Cervix, 4; Endometrium, 5; Haematopoietic_and_lymphoid_tissue, 6; Kidney, 7; Large_intestine, 8; Liver, 9; Lung, 10; NS, 11; Ovary, 12; Pancreas, 13; Prostate, 14; Skin, 15; Stomach, 16; Thyroid, 17; Urinary_tract) |
| Top |
|
 |
| Top |
| Stat. for Non-Synonymous SNVs (# total SNVs=40) | (# total SNVs=17) |
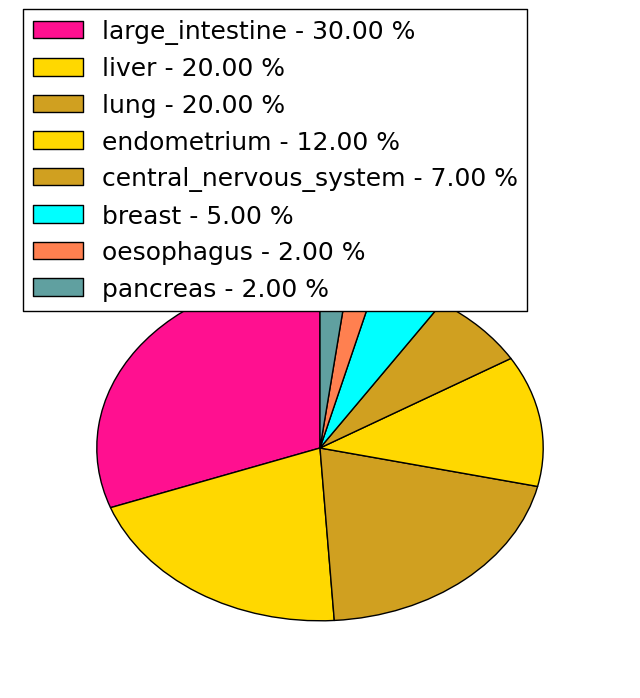 | 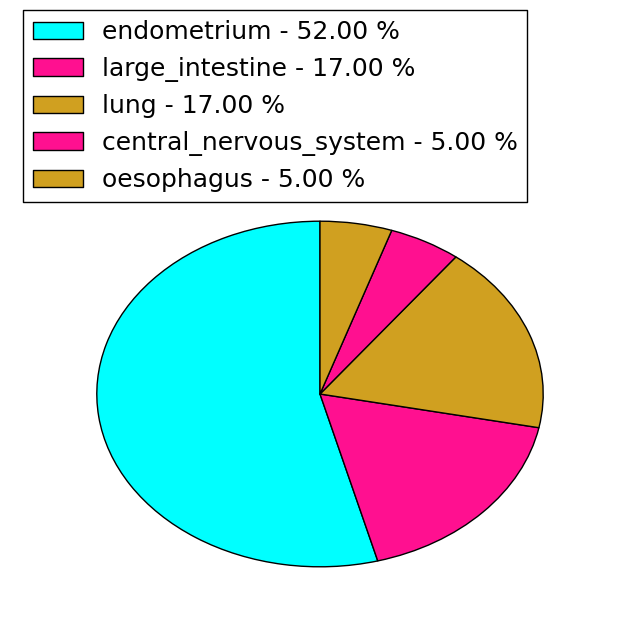 |
(# total SNVs=1) | (# total SNVs=0) |
 |
| Top |
| * When you move the cursor on each content, you can see more deailed mutation information on the Tooltip. Those are primary_site,primary_histology,mutation(aa),pubmedID. |
| GRCh37 position | Mutation(aa) | Unique sampleID count |
| chr19:6416504-6416504 | p.I495I | 3 |
| chr19:6422425-6422425 | p.D91G | 3 |
| chr19:6418513-6418513 | p.G287E | 3 |
| chr19:6420483-6420483 | p.? | 2 |
| chr19:6421313-6421313 | p.L134R | 2 |
| chr19:6417826-6417826 | p.G335G | 2 |
| chr19:6416853-6416853 | p.P408R | 2 |
| chr19:6421699-6421699 | p.D116G | 2 |
| chr19:6422415-6422415 | p.T94T | 2 |
| chr19:6418059-6418059 | p.R304Q | 2 |
| Top |
|
 |
| Point Mutation/ Tissue ID | 1 | 2 | 3 | 4 | 5 | 6 | 7 | 8 | 9 | 10 | 11 | 12 | 13 | 14 | 15 | 16 | 17 | 18 | 19 | 20 |
| # sample | 1 | 1 | 12 | 1 | 2 | 6 | 2 | 4 | 4 | 9 | ||||||||||
| # mutation | 1 | 1 | 9 | 1 | 2 | 6 | 2 | 4 | 4 | 13 | ||||||||||
| nonsynonymous SNV | 1 | 1 | 7 | 1 | 2 | 4 | 1 | 3 | 3 | 5 | ||||||||||
| synonymous SNV | 2 | 2 | 1 | 1 | 1 | 8 |
| cf) Tissue ID; Tissue type (1; BLCA[Bladder Urothelial Carcinoma], 2; BRCA[Breast invasive carcinoma], 3; CESC[Cervical squamous cell carcinoma and endocervical adenocarcinoma], 4; COAD[Colon adenocarcinoma], 5; GBM[Glioblastoma multiforme], 6; Glioma Low Grade, 7; HNSC[Head and Neck squamous cell carcinoma], 8; KICH[Kidney Chromophobe], 9; KIRC[Kidney renal clear cell carcinoma], 10; KIRP[Kidney renal papillary cell carcinoma], 11; LAML[Acute Myeloid Leukemia], 12; LUAD[Lung adenocarcinoma], 13; LUSC[Lung squamous cell carcinoma], 14; OV[Ovarian serous cystadenocarcinoma ], 15; PAAD[Pancreatic adenocarcinoma], 16; PRAD[Prostate adenocarcinoma], 17; SKCM[Skin Cutaneous Melanoma], 18:STAD[Stomach adenocarcinoma], 19:THCA[Thyroid carcinoma], 20:UCEC[Uterine Corpus Endometrial Carcinoma]) |
| Top |
| * We represented just top 10 SNVs. When you move the cursor on each content, you can see more deailed mutation information on the Tooltip. Those are primary_site, primary_histology, mutation(aa), pubmedID. |
| Genomic Position | Mutation(aa) | Unique sampleID count |
| chr19:6416504 | p.I495I | 4 |
| chr19:6417826 | p.P408L | 2 |
| chr19:6416853 | p.G335G | 2 |
| chr19:6422415 | p.T94T | 2 |
| chr19:6416628 | p.G416V | 1 |
| chr19:6422425 | p.R284C | 1 |
| chr19:6418740 | p.D272D | 1 |
| chr19:6416646 | p.H381H | 1 |
| chr19:6422426 | p.K251K | 1 |
| chr19:6418013 | p.P375P | 1 |
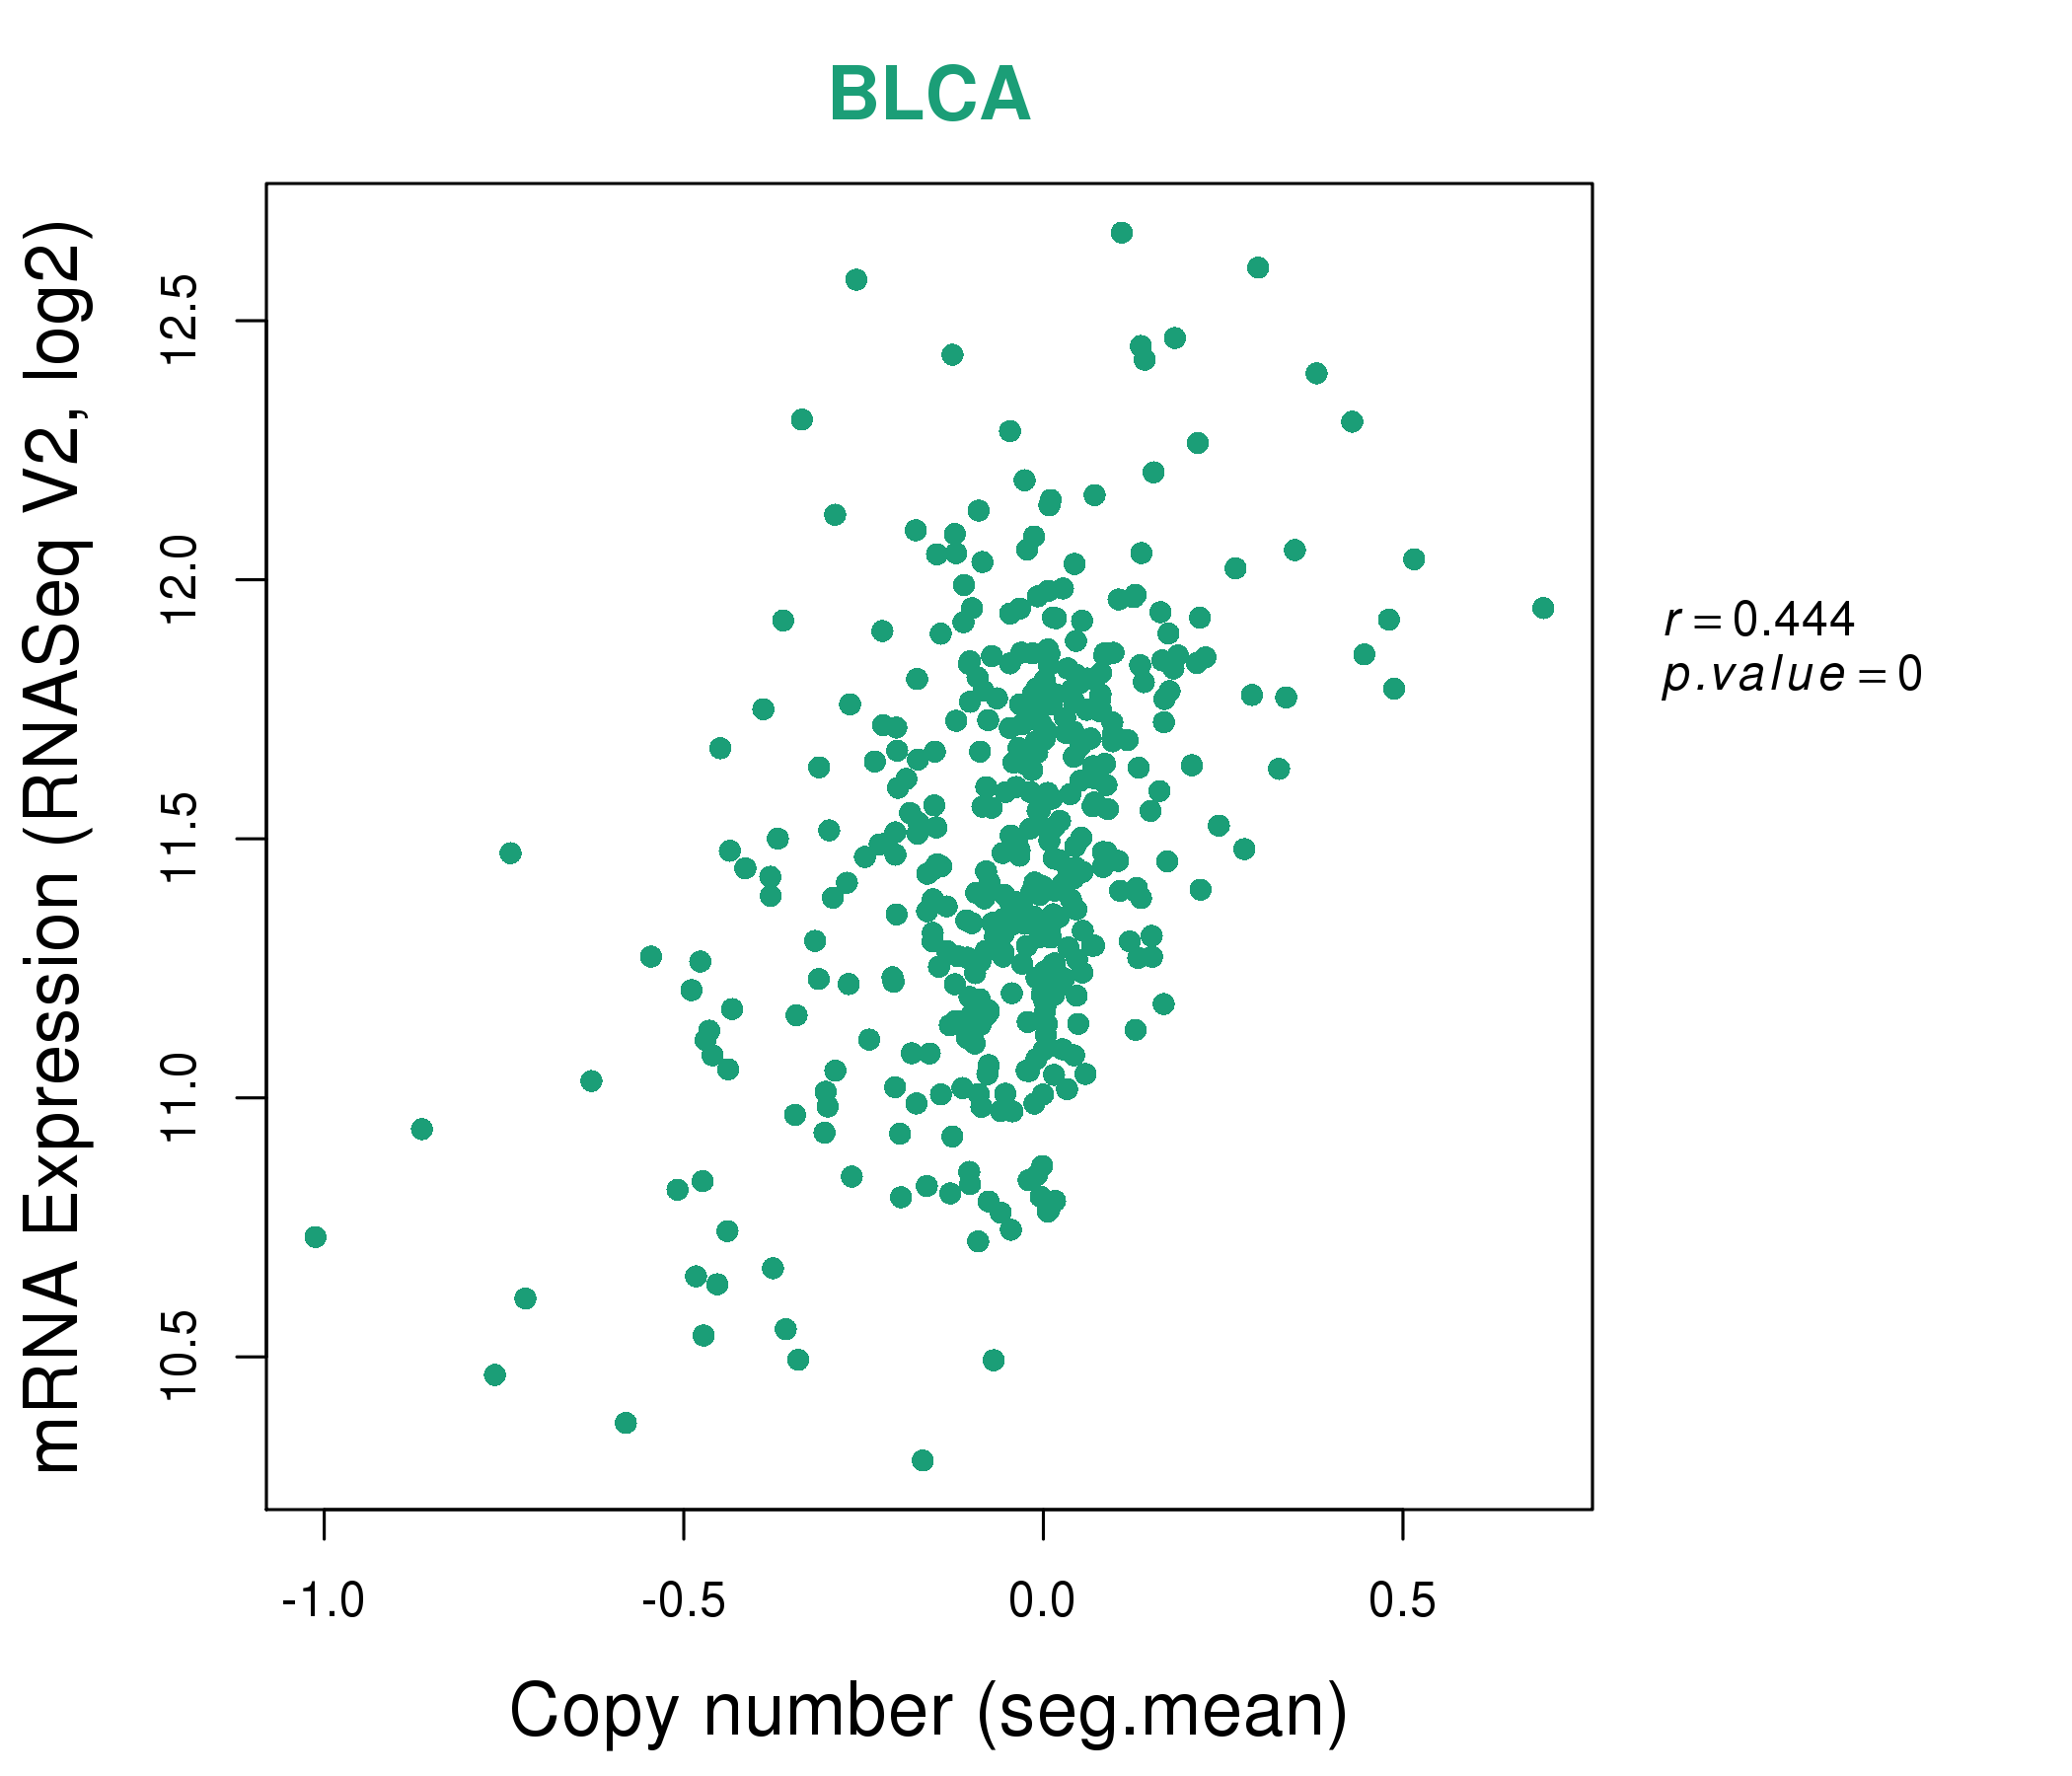
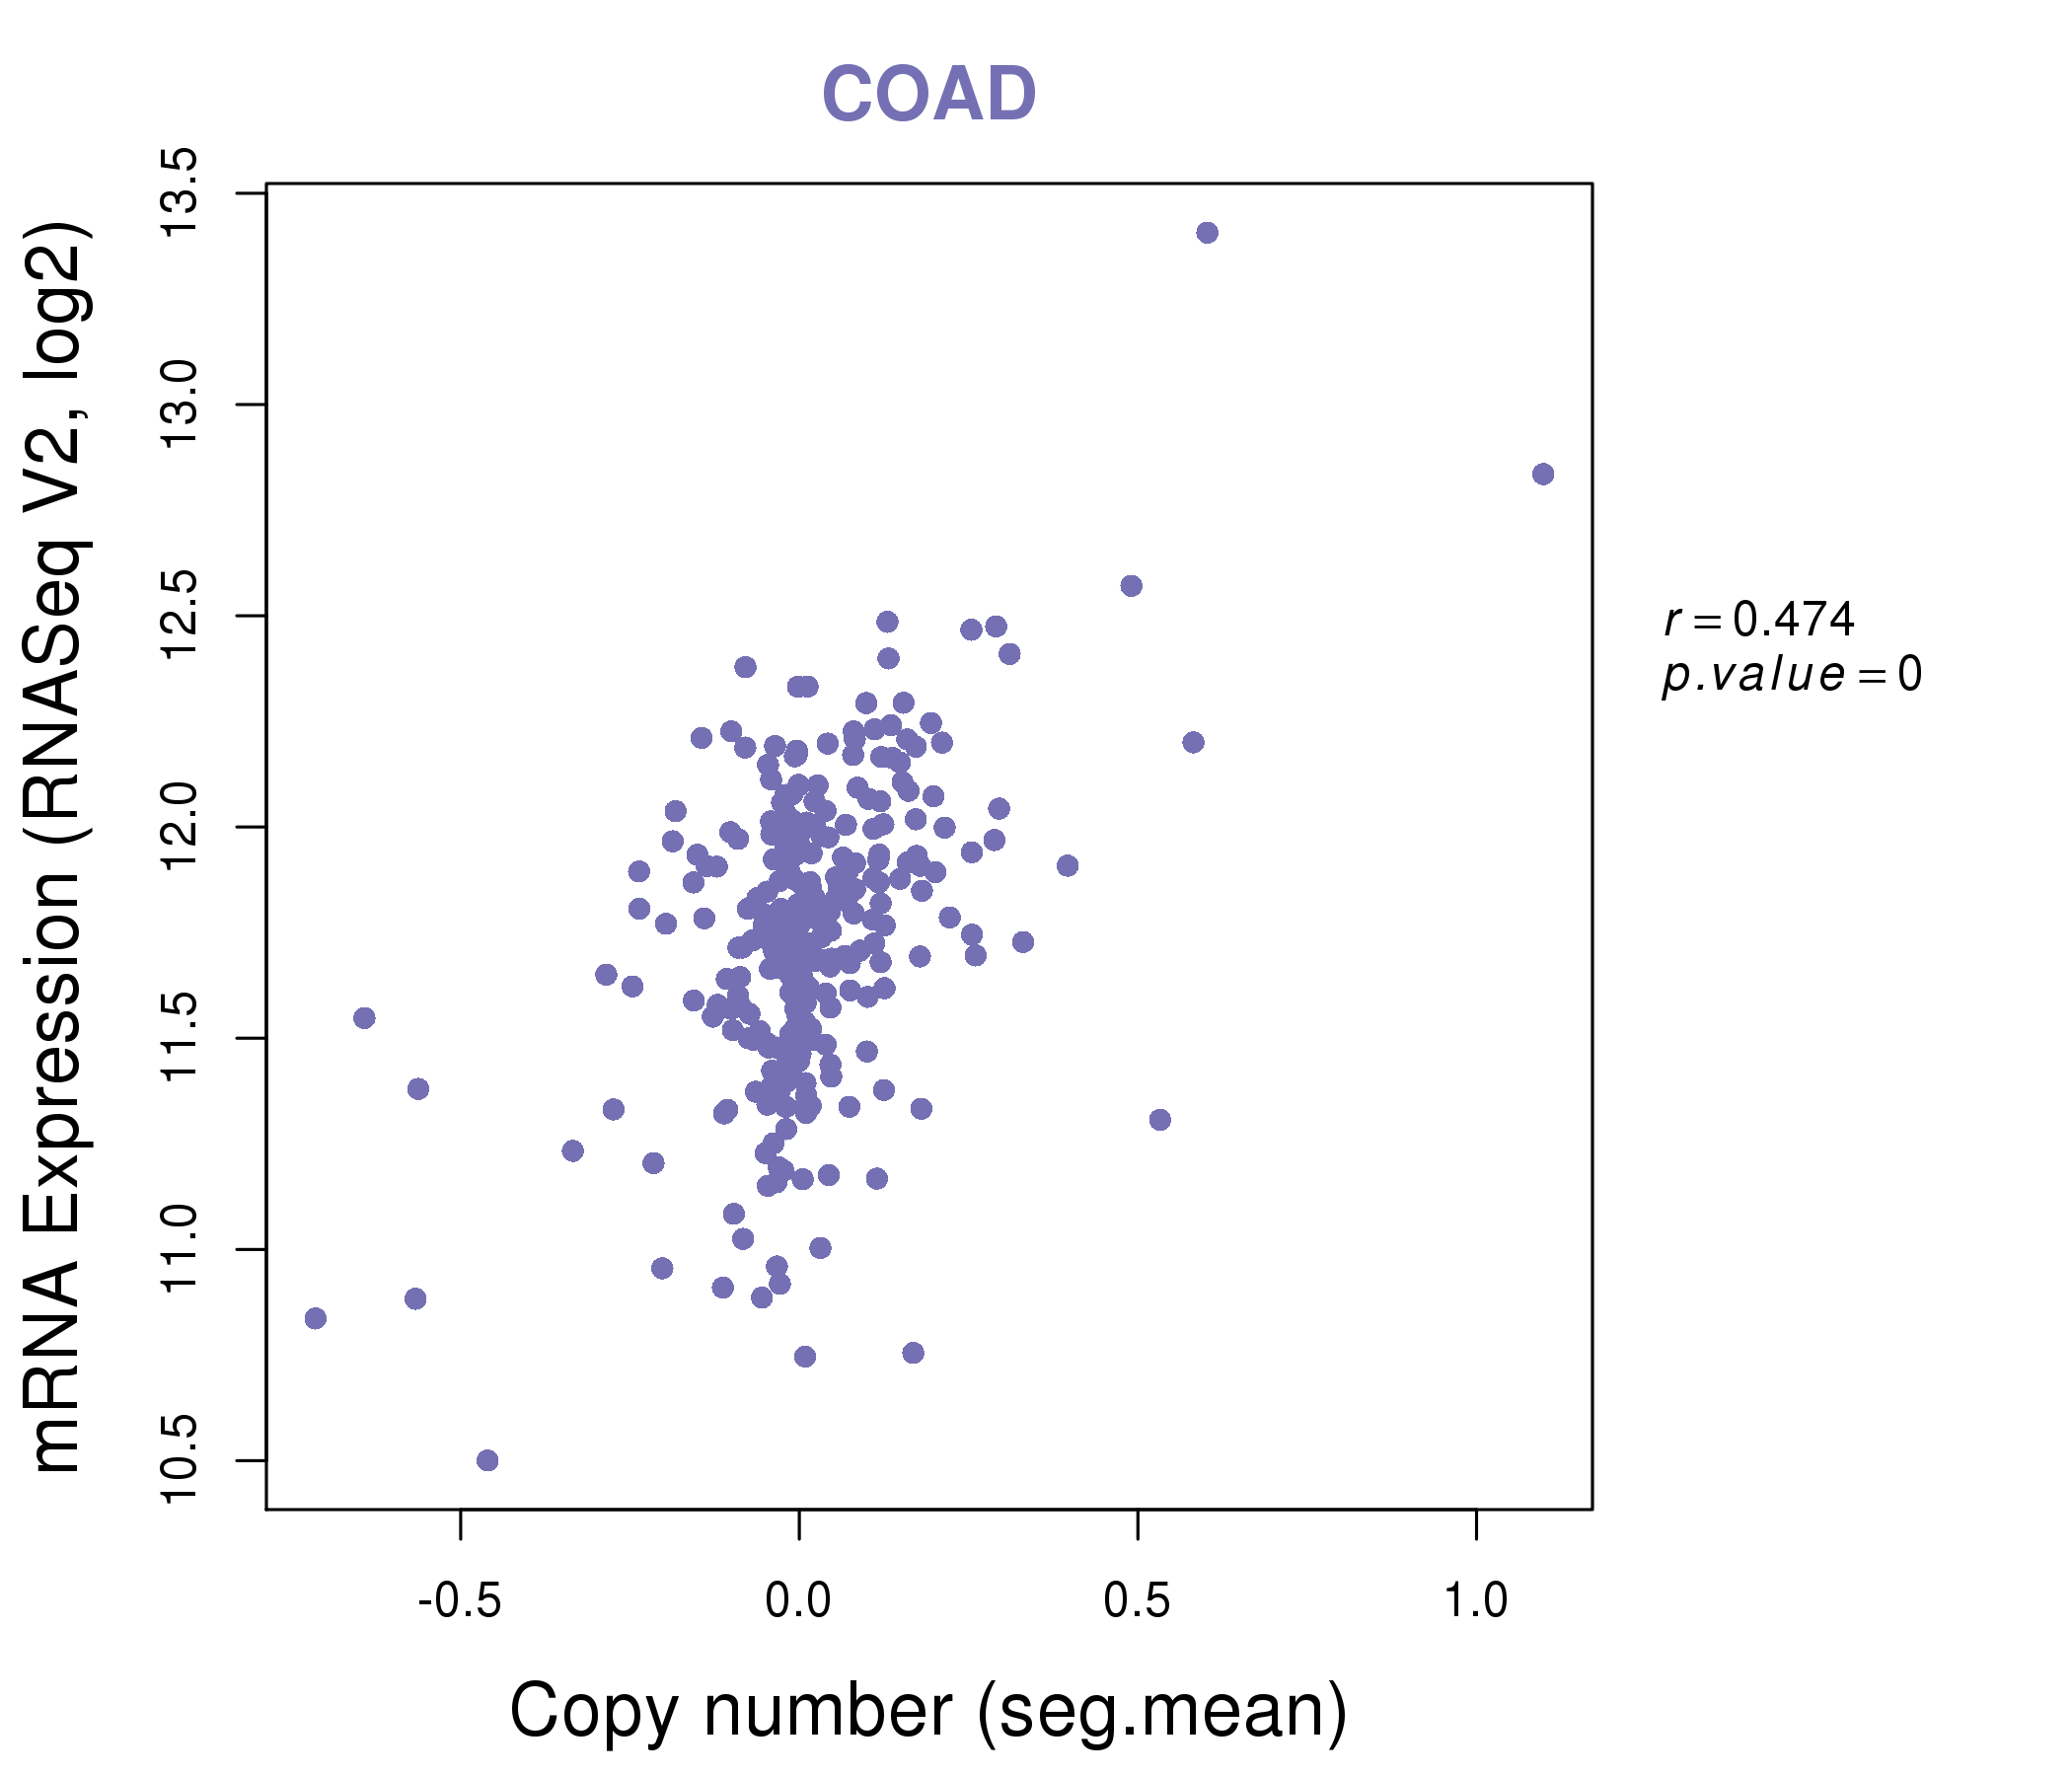
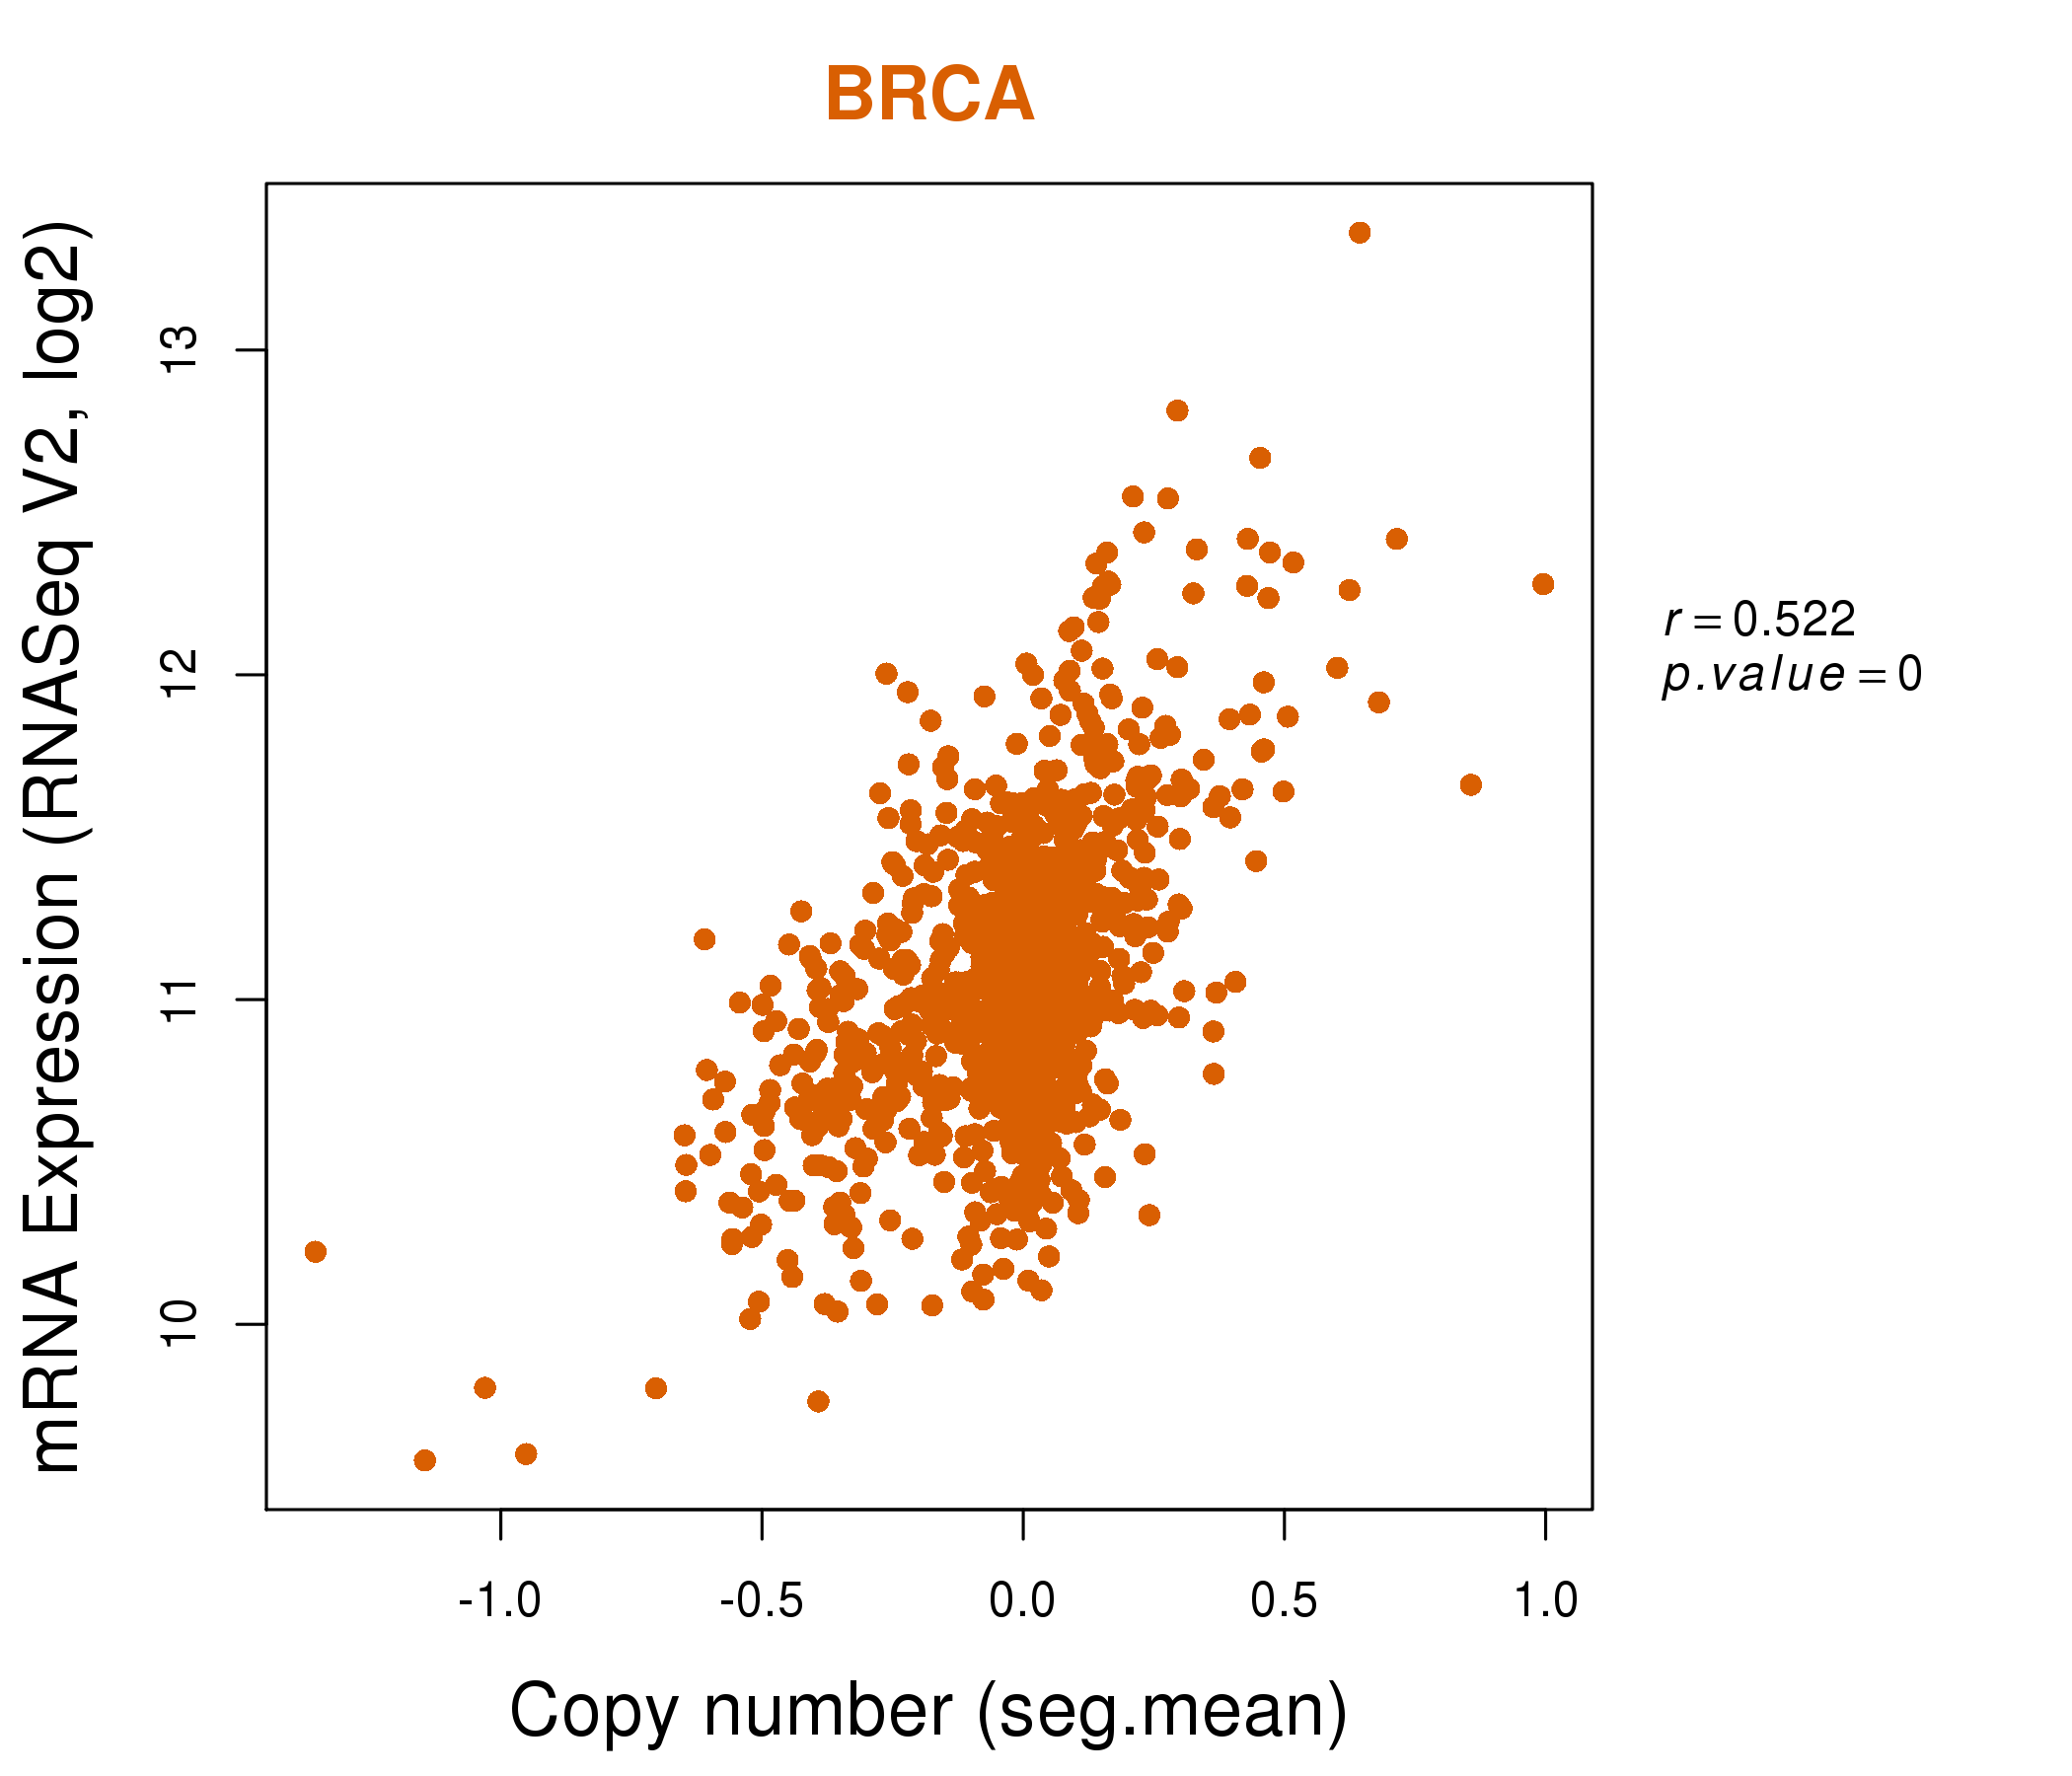
| * Copy number data were extracted from TCGA using R package TCGA-Assembler. The URLs of all public data files on TCGA DCC data server were gathered on Jan-05-2015. Function ProcessCNAData in TCGA-Assembler package was used to obtain gene-level copy number value which is calculated as the average copy number of the genomic region of a gene. |
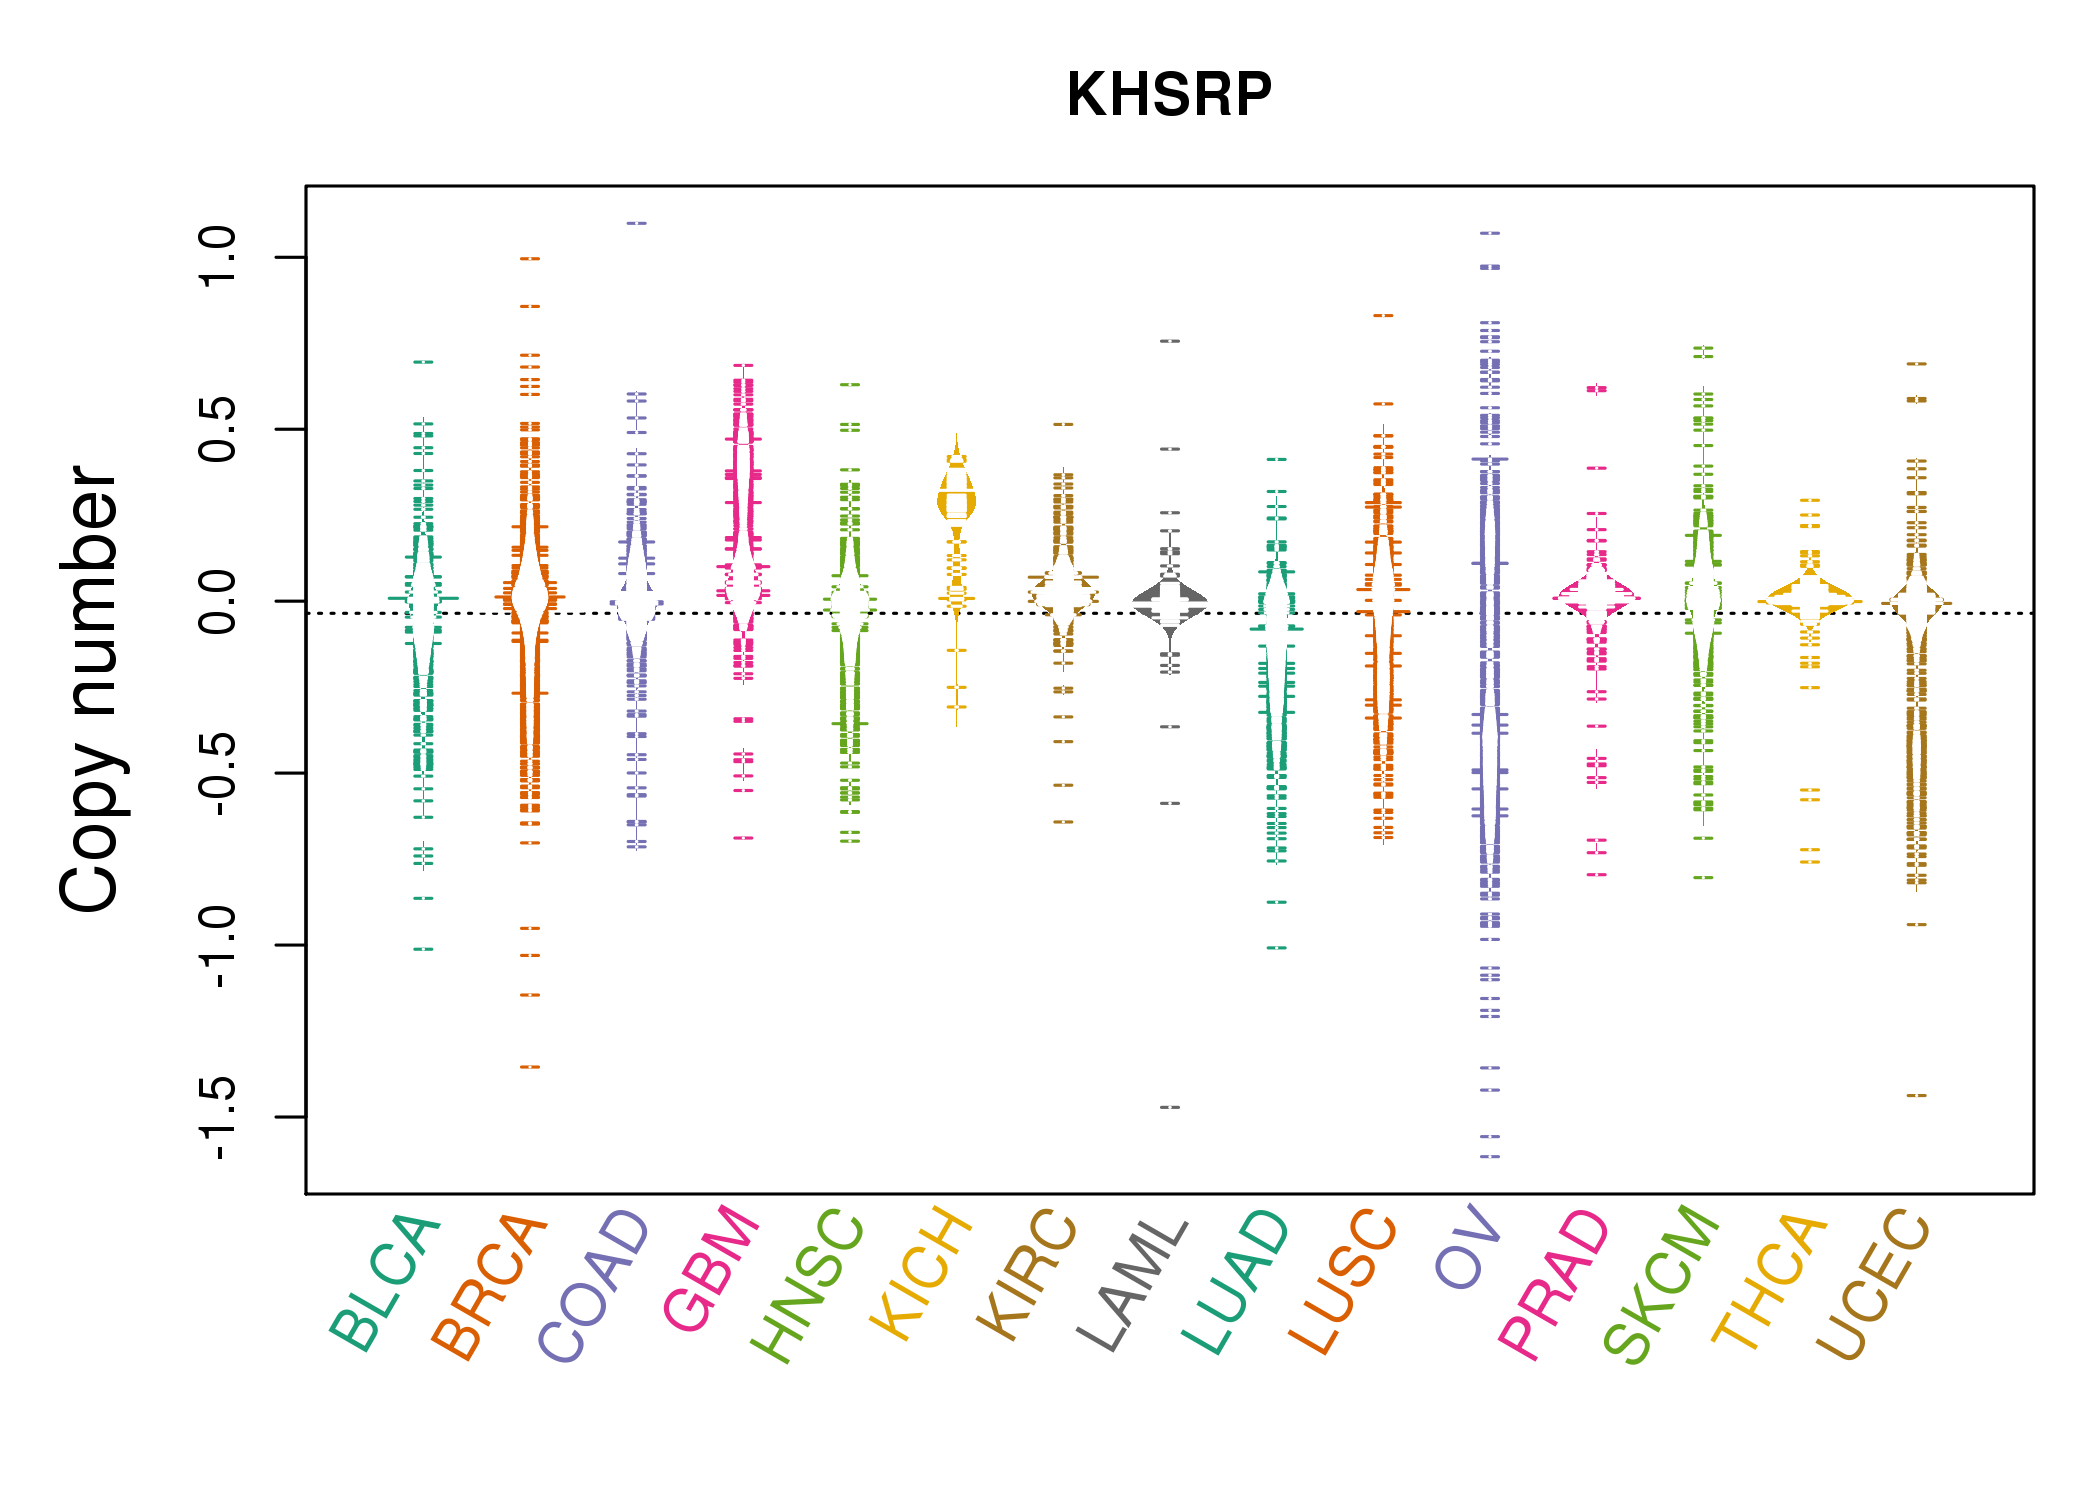 |
| cf) Tissue ID[Tissue type]: BLCA[Bladder Urothelial Carcinoma], BRCA[Breast invasive carcinoma], CESC[Cervical squamous cell carcinoma and endocervical adenocarcinoma], COAD[Colon adenocarcinoma], GBM[Glioblastoma multiforme], Glioma Low Grade, HNSC[Head and Neck squamous cell carcinoma], KICH[Kidney Chromophobe], KIRC[Kidney renal clear cell carcinoma], KIRP[Kidney renal papillary cell carcinoma], LAML[Acute Myeloid Leukemia], LUAD[Lung adenocarcinoma], LUSC[Lung squamous cell carcinoma], OV[Ovarian serous cystadenocarcinoma ], PAAD[Pancreatic adenocarcinoma], PRAD[Prostate adenocarcinoma], SKCM[Skin Cutaneous Melanoma], STAD[Stomach adenocarcinoma], THCA[Thyroid carcinoma], UCEC[Uterine Corpus Endometrial Carcinoma] |
| Top |
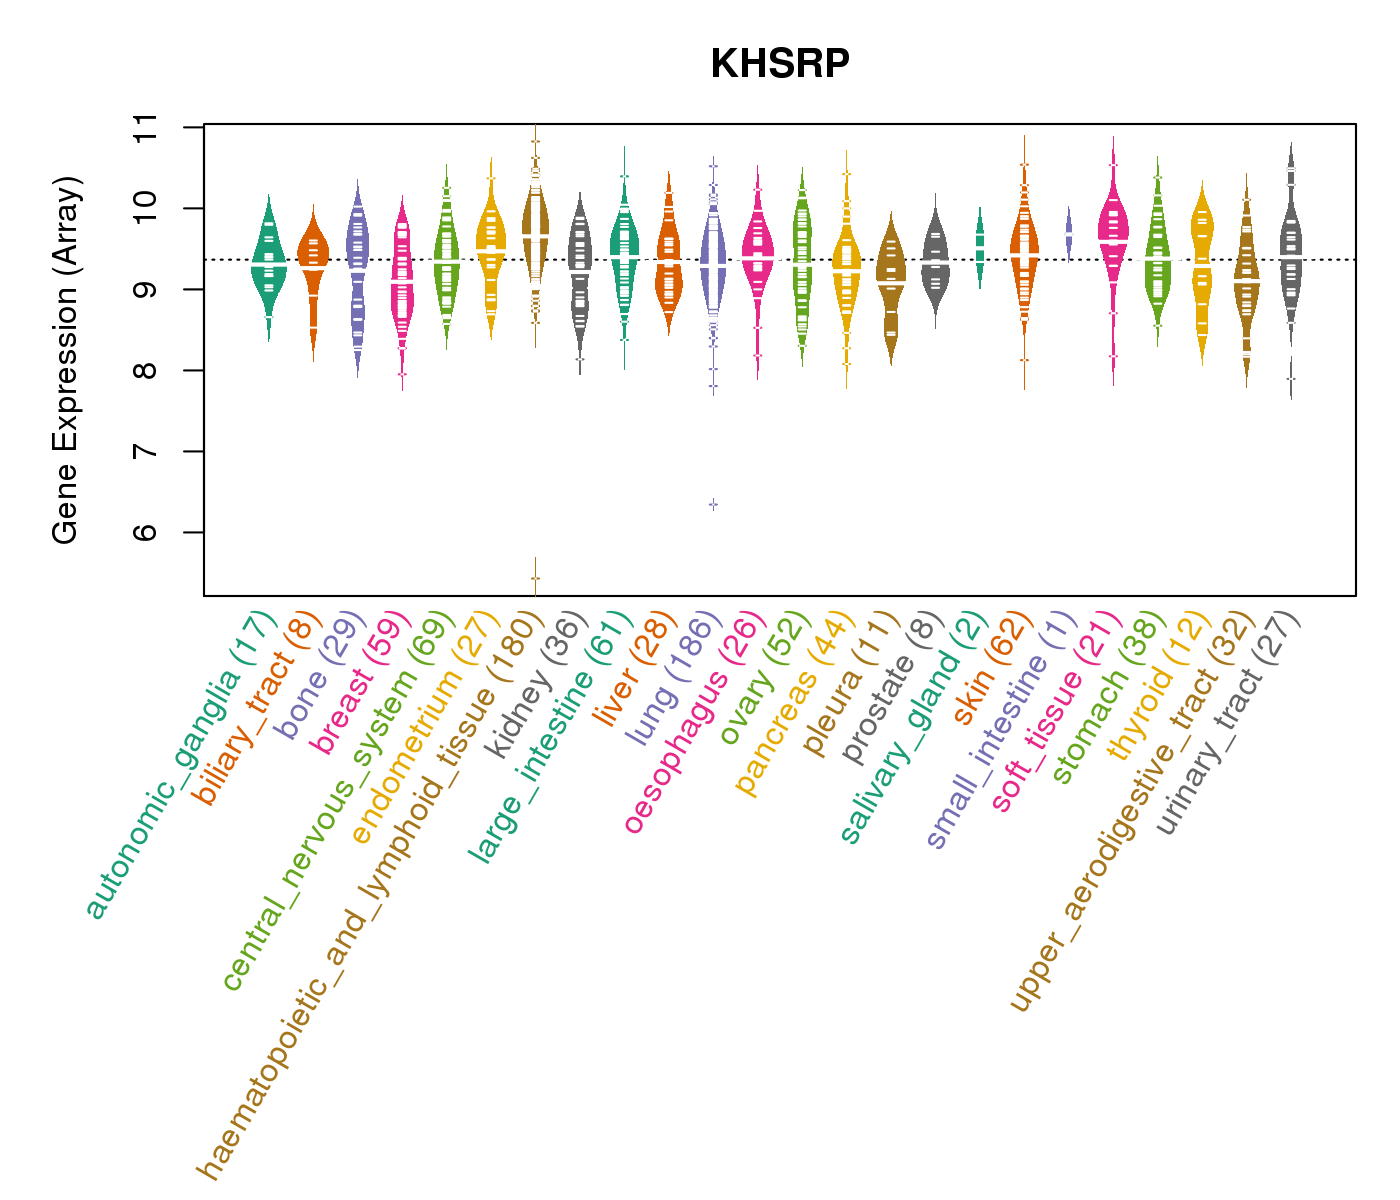
| Gene Expression for KHSRP |
| * CCLE gene expression data were extracted from CCLE_Expression_Entrez_2012-10-18.res: Gene-centric RMA-normalized mRNA expression data. |
 |
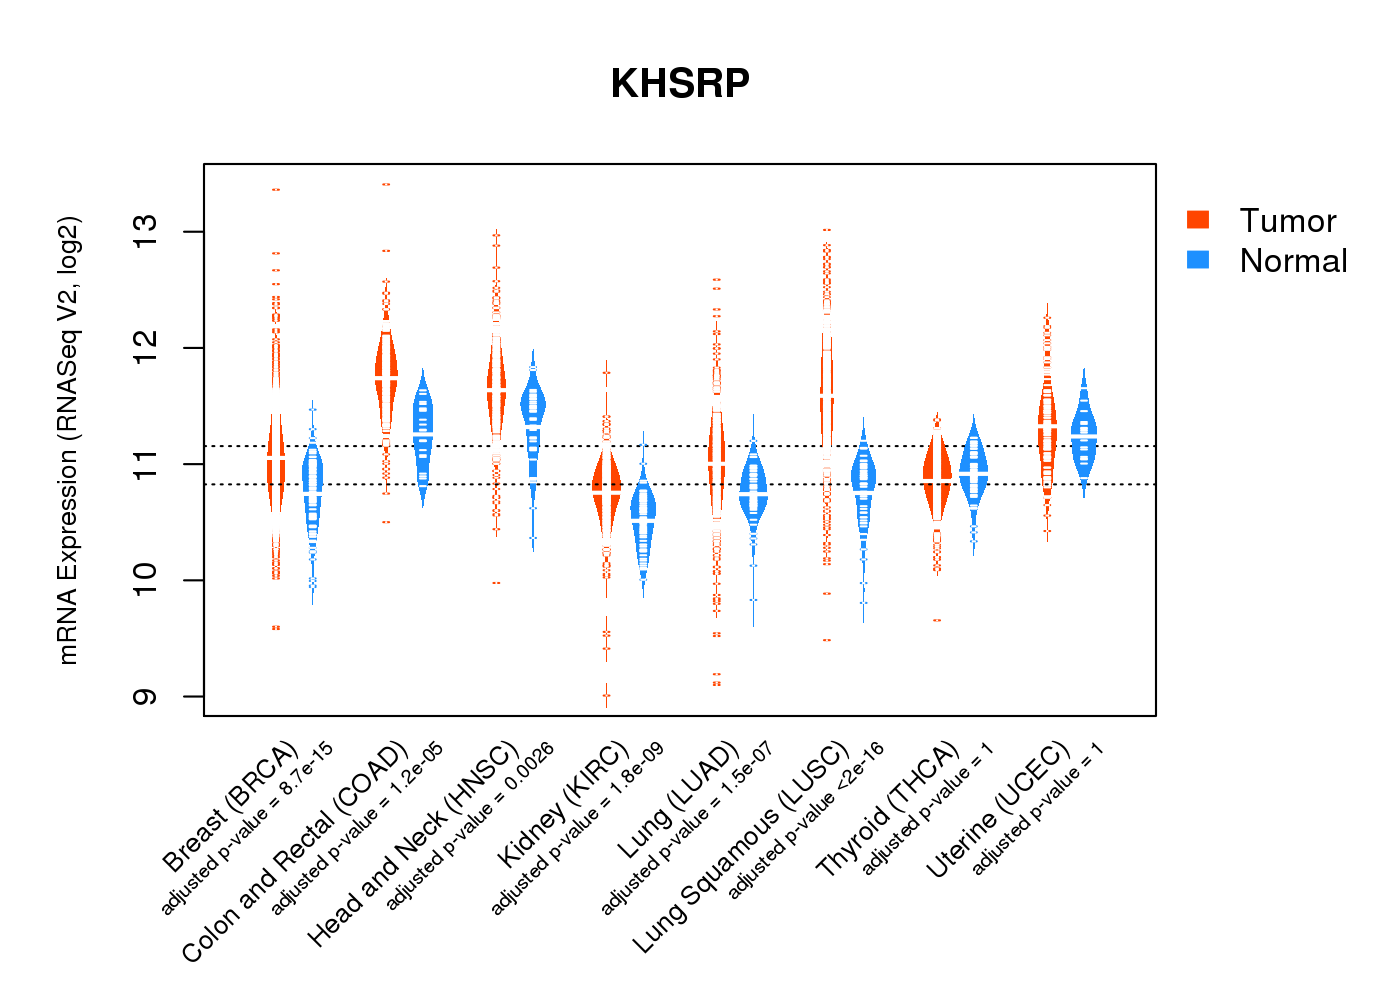
| * Normalized gene expression data of RNASeqV2 was extracted from TCGA using R package TCGA-Assembler. The URLs of all public data files on TCGA DCC data server were gathered at Jan-05-2015. Only eight cancer types have enough normal control samples for differential expression analysis. (t test, adjusted p<0.05 (using Benjamini-Hochberg FDR)) |
 |
| Top |
| * This plots show the correlation between CNV and gene expression. |
: Open all plots for all cancer types
 |
|
 |
|

| Top |
| Gene-Gene Network Information |
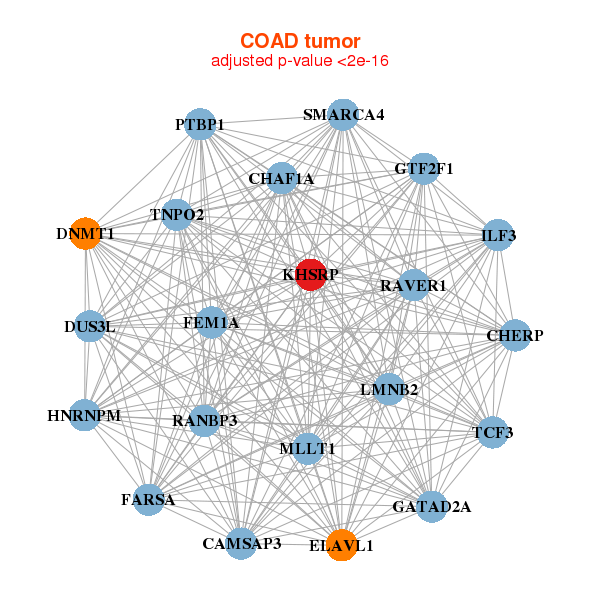
| * Co-Expression network figures were drawn using R package igraph. Only the top 20 genes with the highest correlations were shown. Red circle: input gene, orange circle: cell metabolism gene, sky circle: other gene |
: Open all plots for all cancer types
 |
|
| AURKB,CAD,CDCA7,CHAF1A,DNMT1,DUS3L,ELAVL1, FAM64A,GATAD2A,ILF3,INCENP,KHSRP,KIF18B,LMNB2, MCM7,MLLT1,ORC1,RAD54L,SMARCA4,SPC24,UHRF1 | AARS2,PRRC2A,DHX37,EHMT1,ILF3,KDM5C,KHSRP, PPP1R26,MYBBP1A,NCOR2,PACSIN2,PHRF1,PRR12,SAFB2, SETD1A,SMARCA4,SURF6,TNRC18,UBE2O,ZC3H18,ZNF512B |
 |
|
| CHAF1A,CHERP,DNMT1,DUS3L,ELAVL1,FARSA,FEM1A, GATAD2A,GTF2F1,HNRNPM,ILF3,KHSRP,CAMSAP3,LMNB2, MLLT1,PTBP1,RANBP3,RAVER1,SMARCA4,TCF3,TNPO2 | BMS1,NOP9,DIS3L2,EIF3B,EIF4G1,ELAVL1,GCN1L1, HNRNPM,ILF3,KHSRP,NUP188,PFAS,PRKDC,PRPF8, SAFB,SF3B3,SMPD4,THADA,TMEM201,VARS,ZC3H18 |
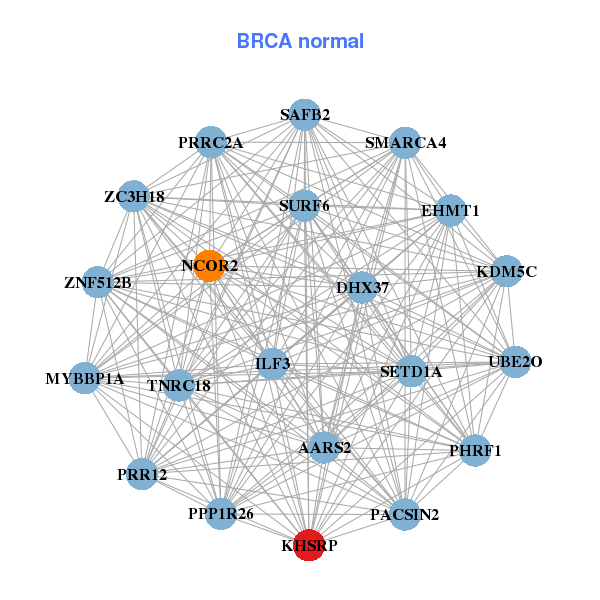

| * Co-Expression network figures were drawn using R package igraph. Only the top 20 genes with the highest correlations were shown. Red circle: input gene, orange circle: cell metabolism gene, sky circle: other gene |
: Open all plots for all cancer types
| Top |
: Open all interacting genes' information including KEGG pathway for all interacting genes from DAVID
| Top |
| Pharmacological Information for KHSRP |
| There's no related Drug. |
| Top |
| Cross referenced IDs for KHSRP |
| * We obtained these cross-references from Uniprot database. It covers 150 different DBs, 18 categories. http://www.uniprot.org/help/cross_references_section |
: Open all cross reference information
|
Copyright © 2016-Present - The Univsersity of Texas Health Science Center at Houston @ |