|
|||||||||||||||||||||||||||||||||||||||||||||||||||||||||||||||||||||||||||||||||||||||||||||||||||||||||||||||||||||||||||||||||||||||||||||||||||||||||||||||||||||||||||||||||||||||||||||||||||||||||||||||||||||||||||||||||||||||||||||||||||||||||||||||||||||||||||||||||||||||||||||||||||||||||||||||||||||||||||||||||||||||||||||
| |
| Phenotypic Information (metabolism pathway, cancer, disease, phenome) |
| |
| |
| Gene-Gene Network Information: Co-Expression Network, Interacting Genes & KEGG |
| |
|


| Gene Summary for SLC25A12 |
| Basic gene info. | Gene symbol | SLC25A12 |
| Gene name | solute carrier family 25 (aspartate/glutamate carrier), member 12 | |
| Synonyms | AGC1|ARALAR | |
| Cytomap | UCSC genome browser: 2q24 | |
| Genomic location | chr2 :172639914-172750816 | |
| Type of gene | protein-coding | |
| RefGenes | NM_003705.4, NR_047549.1, | |
| Ensembl id | ENSG00000115840 | |
| Description | araceli hiperlargacalcium binding mitochondrial carrier superfamily member Aralar1calcium-binding mitochondrial carrier protein Aralar1mitochondrial aspartate glutamate carrier 1solute carrier family 25 (mitochondrial carrier, Aralar), member 12 | |
| Modification date | 20141207 | |
| dbXrefs | MIM : 603667 | |
| HGNC : HGNC | ||
| Ensembl : ENSG00000115840 | ||
| HPRD : 04719 | ||
| Vega : OTTHUMG00000134290 | ||
| Protein | UniProt: go to UniProt's Cross Reference DB Table | |
| Expression | CleanEX: HS_SLC25A12 | |
| BioGPS: 8604 | ||
| Gene Expression Atlas: ENSG00000115840 | ||
| The Human Protein Atlas: ENSG00000115840 | ||
| Pathway | NCI Pathway Interaction Database: SLC25A12 | |
| KEGG: SLC25A12 | ||
| REACTOME: SLC25A12 | ||
| ConsensusPathDB | ||
| Pathway Commons: SLC25A12 | ||
| Metabolism | MetaCyc: SLC25A12 | |
| HUMANCyc: SLC25A12 | ||
| Regulation | Ensembl's Regulation: ENSG00000115840 | |
| miRBase: chr2 :172,639,914-172,750,816 | ||
| TargetScan: NM_003705 | ||
| cisRED: ENSG00000115840 | ||
| Context | iHOP: SLC25A12 | |
| cancer metabolism search in PubMed: SLC25A12 | ||
| UCL Cancer Institute: SLC25A12 | ||
| Assigned class in ccmGDB | C | |
| Top |
| Phenotypic Information for SLC25A12(metabolism pathway, cancer, disease, phenome) |
| Cancer | CGAP: SLC25A12 |
| Familial Cancer Database: SLC25A12 | |
| * This gene is included in those cancer gene databases. |
|
|
|
|
|
|
| |||||||||||||||||||||||||||||||||||||||||||||||||||||||||||||||||||||||||||||||||||||||||||||||||||||||||||||||||||||||||||||||||||||||||||||||||||||||||||||||||||||||||||||||||||||||||||||||||||||||||||||||||||||||||||||||||||||||||||||||||||||||||||||||||||||||||||||||||||||||||||||||||||||||||||||||||||||||||||||||||||||||
Oncogene 1 | Significant driver gene in | ||||||||||||||||||||||||||||||||||||||||||||||||||||||||||||||||||||||||||||||||||||||||||||||||||||||||||||||||||||||||||||||||||||||||||||||||||||||||||||||||||||||||||||||||||||||||||||||||||||||||||||||||||||||||||||||||||||||||||||||||||||||||||||||||||||||||||||||||||||||||||||||||||||||||||||||||||||||||||||||||||||||||||||
| cf) number; DB name 1 Oncogene; http://nar.oxfordjournals.org/content/35/suppl_1/D721.long, 2 Tumor Suppressor gene; https://bioinfo.uth.edu/TSGene/, 3 Cancer Gene Census; http://www.nature.com/nrc/journal/v4/n3/abs/nrc1299.html, 4 CancerGenes; http://nar.oxfordjournals.org/content/35/suppl_1/D721.long, 5 Network of Cancer Gene; http://ncg.kcl.ac.uk/index.php, 1Therapeutic Vulnerabilities in Cancer; http://cbio.mskcc.org/cancergenomics/statius/ |
| REACTOME_METABOLISM_OF_PROTEINS REACTOME_METABOLISM_OF_CARBOHYDRATES REACTOME_GLUCOSE_METABOLISM | |
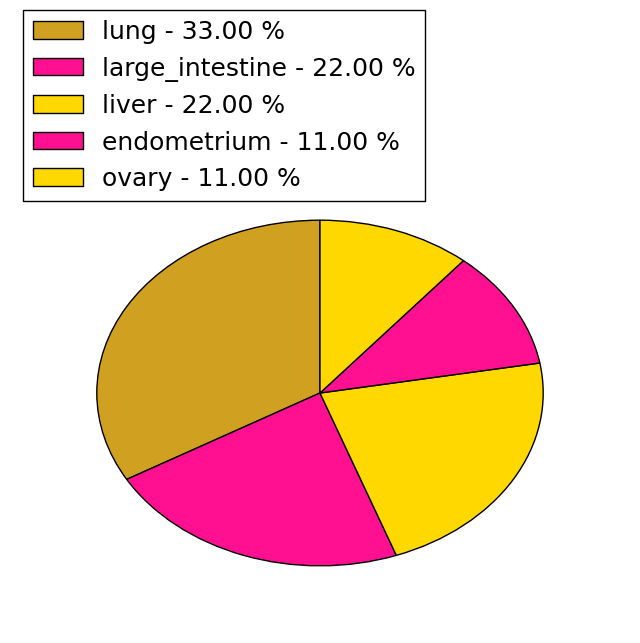
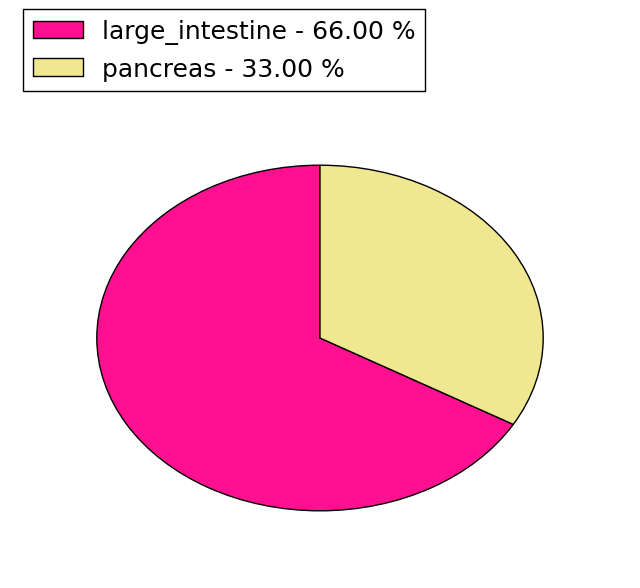
| Mutations for SLC25A12 |
| * Under tables are showing count per each tissue to give us broad intuition about tissue specific mutation patterns.You can go to the detailed page for each mutation database's web site. |
| - Statistics for Tissue and Mutation type | Top |
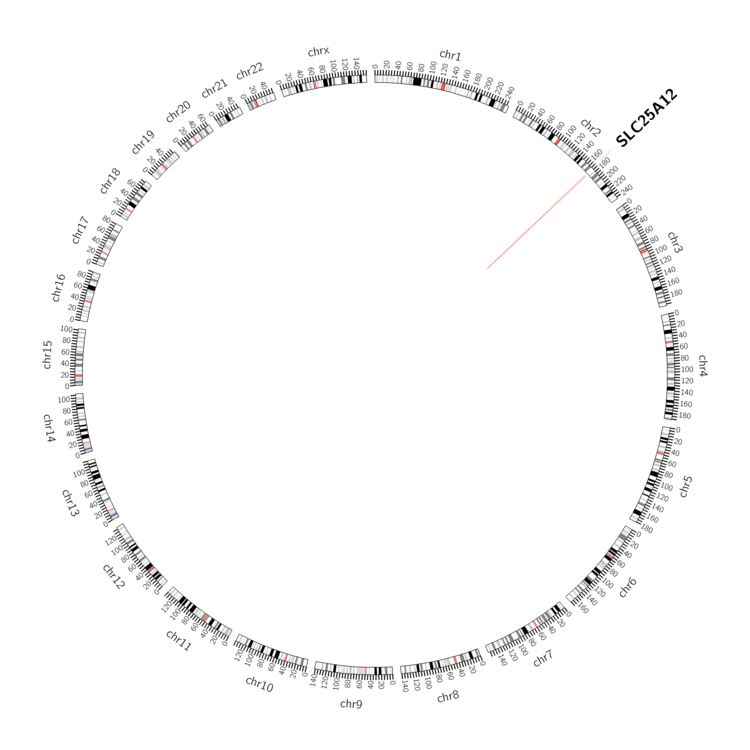 |
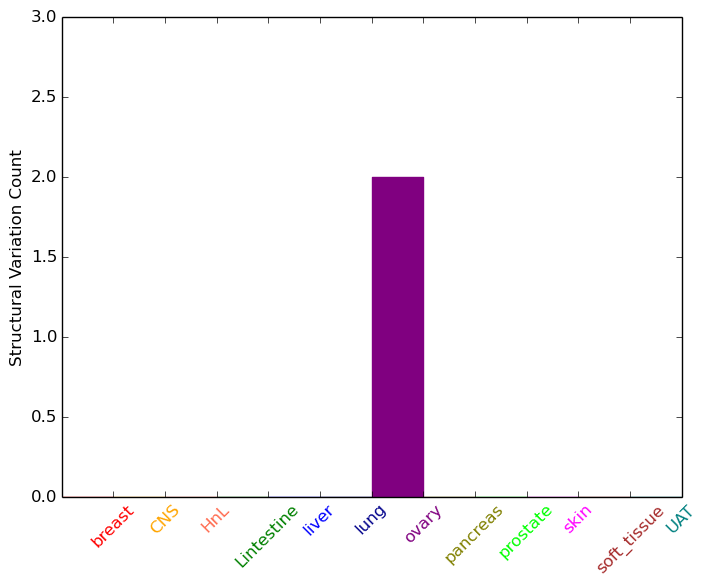
| - For Inter-chromosomal Variations |
| There's no inter-chromosomal structural variation. |
| - For Intra-chromosomal Variations |
| * Intra-chromosomal variantions includes 'intrachromosomal amplicon to amplicon', 'intrachromosomal amplicon to non-amplified dna', 'intrachromosomal deletion', 'intrachromosomal fold-back inversion', 'intrachromosomal inversion', 'intrachromosomal tandem duplication', 'Intrachromosomal unknown type', 'intrachromosomal with inverted orientation', 'intrachromosomal with non-inverted orientation'. |
 |
| Sample | Symbol_a | Chr_a | Start_a | End_a | Symbol_b | Chr_b | Start_b | End_b |
| ovary | SLC25A12 | chr2 | 172748795 | 172748815 | chr2 | 174838757 | 174838777 | |
| ovary | SLC25A12 | chr2 | 172748802 | 172748822 | chr2 | 174838764 | 174838784 |
| cf) Tissue number; Tissue name (1;Breast, 2;Central_nervous_system, 3;Haematopoietic_and_lymphoid_tissue, 4;Large_intestine, 5;Liver, 6;Lung, 7;Ovary, 8;Pancreas, 9;Prostate, 10;Skin, 11;Soft_tissue, 12;Upper_aerodigestive_tract) |
| * From mRNA Sanger sequences, Chitars2.0 arranged chimeric transcripts. This table shows SLC25A12 related fusion information. |
| ID | Head Gene | Tail Gene | Accession | Gene_a | qStart_a | qEnd_a | Chromosome_a | tStart_a | tEnd_a | Gene_a | qStart_a | qEnd_a | Chromosome_a | tStart_a | tEnd_a |
| BF947427 | SPATS1 | 34 | 374 | 6 | 44276602 | 44276941 | SLC25A12 | 368 | 660 | 2 | 172650608 | 172650899 | |
| AW845689 | SLC25A12 | 1 | 89 | 2 | 172675216 | 172675307 | SLC25A12 | 84 | 556 | 2 | 172678638 | 172679110 | |
| Top |
| Mutation type/ Tissue ID | brca | cns | cerv | endome | haematopo | kidn | Lintest | liver | lung | ns | ovary | pancre | prost | skin | stoma | thyro | urina | |||
| Total # sample | 1 | |||||||||||||||||||
| GAIN (# sample) | 1 | |||||||||||||||||||
| LOSS (# sample) |
| cf) Tissue ID; Tissue type (1; Breast, 2; Central_nervous_system, 3; Cervix, 4; Endometrium, 5; Haematopoietic_and_lymphoid_tissue, 6; Kidney, 7; Large_intestine, 8; Liver, 9; Lung, 10; NS, 11; Ovary, 12; Pancreas, 13; Prostate, 14; Skin, 15; Stomach, 16; Thyroid, 17; Urinary_tract) |
| Top |
|
 |
| Top |
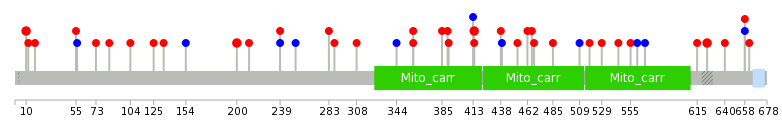
| Stat. for Non-Synonymous SNVs (# total SNVs=51) | (# total SNVs=9) |
 |  |
(# total SNVs=3) | (# total SNVs=0) |
 |
| Top |
| * When you move the cursor on each content, you can see more deailed mutation information on the Tooltip. Those are primary_site,primary_histology,mutation(aa),pubmedID. |
| GRCh37 position | Mutation(aa) | Unique sampleID count |
| chr2:172648071-172648071 | p.I492S | 4 |
| chr2:172641950-172641950 | p.R624H | 3 |
| chr2:172701007-172701007 | p.E113* | 2 |
| chr2:172712358-172712358 | p.G104A | 2 |
| chr2:172749752-172749752 | p.R10Q | 2 |
| chr2:172666787-172666787 | p.? | 2 |
| chr2:172712428-172712428 | p.E81K | 2 |
| chr2:172641848-172641848 | p.P658Q | 2 |
| chr2:172641902-172641902 | p.R640K | 2 |
| chr2:172690472-172690472 | p.? | 2 |
| Top |
|
 |
| Point Mutation/ Tissue ID | 1 | 2 | 3 | 4 | 5 | 6 | 7 | 8 | 9 | 10 | 11 | 12 | 13 | 14 | 15 | 16 | 17 | 18 | 19 | 20 |
| # sample | 3 | 1 | 14 | 1 | 1 | 1 | 7 | 3 | 1 | 5 | 6 | 1 | 8 | |||||||
| # mutation | 3 | 1 | 13 | 1 | 1 | 1 | 7 | 3 | 1 | 5 | 6 | 1 | 8 | |||||||
| nonsynonymous SNV | 3 | 11 | 1 | 1 | 1 | 6 | 2 | 1 | 1 | 5 | 1 | 7 | ||||||||
| synonymous SNV | 1 | 2 | 1 | 1 | 4 | 1 | 1 |
| cf) Tissue ID; Tissue type (1; BLCA[Bladder Urothelial Carcinoma], 2; BRCA[Breast invasive carcinoma], 3; CESC[Cervical squamous cell carcinoma and endocervical adenocarcinoma], 4; COAD[Colon adenocarcinoma], 5; GBM[Glioblastoma multiforme], 6; Glioma Low Grade, 7; HNSC[Head and Neck squamous cell carcinoma], 8; KICH[Kidney Chromophobe], 9; KIRC[Kidney renal clear cell carcinoma], 10; KIRP[Kidney renal papillary cell carcinoma], 11; LAML[Acute Myeloid Leukemia], 12; LUAD[Lung adenocarcinoma], 13; LUSC[Lung squamous cell carcinoma], 14; OV[Ovarian serous cystadenocarcinoma ], 15; PAAD[Pancreatic adenocarcinoma], 16; PRAD[Prostate adenocarcinoma], 17; SKCM[Skin Cutaneous Melanoma], 18:STAD[Stomach adenocarcinoma], 19:THCA[Thyroid carcinoma], 20:UCEC[Uterine Corpus Endometrial Carcinoma]) |
| Top |
| * We represented just top 10 SNVs. When you move the cursor on each content, you can see more deailed mutation information on the Tooltip. Those are primary_site, primary_histology, mutation(aa), pubmedID. |
| Genomic Position | Mutation(aa) | Unique sampleID count |
| chr2:172666181 | p.R10Q | 2 |
| chr2:172693643 | p.E200D | 2 |
| chr2:172641950 | p.R624H | 2 |
| chr2:172749752 | p.R414W | 2 |
| chr2:172683376 | p.L509L | 1 |
| chr2:172712415 | p.V344V | 1 |
| chr2:172644412 | p.K55N | 1 |
| chr2:172666180 | p.K485T | 1 |
| chr2:172683390 | p.Q308R | 1 |
| chr2:172712451 | p.N18T | 1 |
| * Copy number data were extracted from TCGA using R package TCGA-Assembler. The URLs of all public data files on TCGA DCC data server were gathered on Jan-05-2015. Function ProcessCNAData in TCGA-Assembler package was used to obtain gene-level copy number value which is calculated as the average copy number of the genomic region of a gene. |
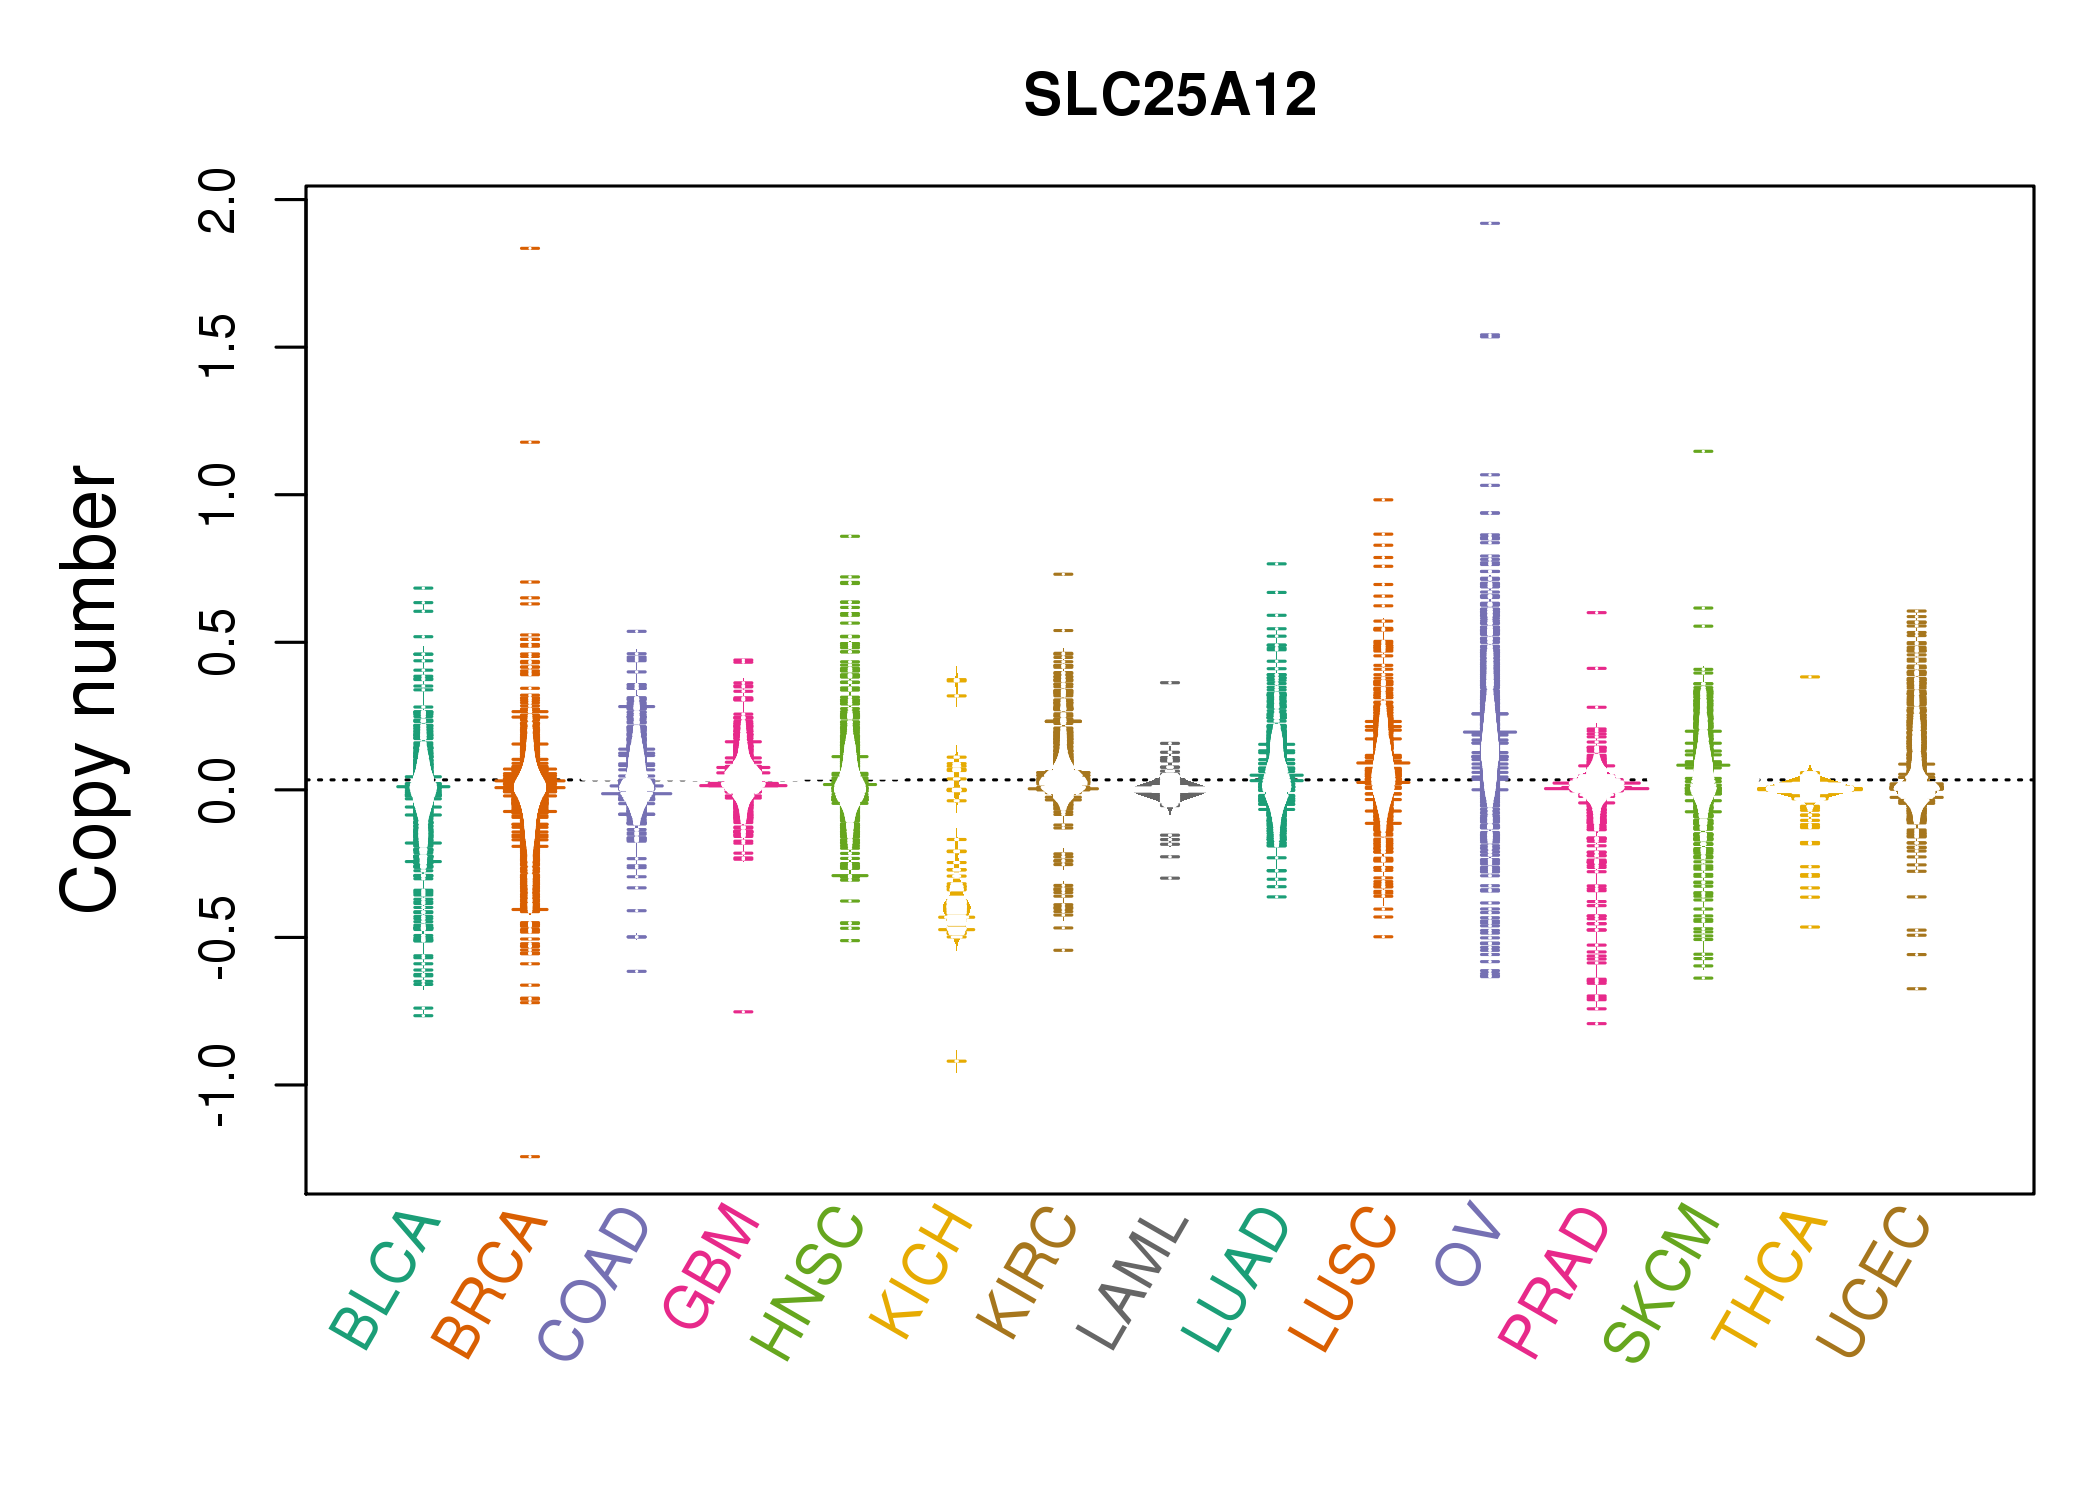 |
| cf) Tissue ID[Tissue type]: BLCA[Bladder Urothelial Carcinoma], BRCA[Breast invasive carcinoma], CESC[Cervical squamous cell carcinoma and endocervical adenocarcinoma], COAD[Colon adenocarcinoma], GBM[Glioblastoma multiforme], Glioma Low Grade, HNSC[Head and Neck squamous cell carcinoma], KICH[Kidney Chromophobe], KIRC[Kidney renal clear cell carcinoma], KIRP[Kidney renal papillary cell carcinoma], LAML[Acute Myeloid Leukemia], LUAD[Lung adenocarcinoma], LUSC[Lung squamous cell carcinoma], OV[Ovarian serous cystadenocarcinoma ], PAAD[Pancreatic adenocarcinoma], PRAD[Prostate adenocarcinoma], SKCM[Skin Cutaneous Melanoma], STAD[Stomach adenocarcinoma], THCA[Thyroid carcinoma], UCEC[Uterine Corpus Endometrial Carcinoma] |
| Top |
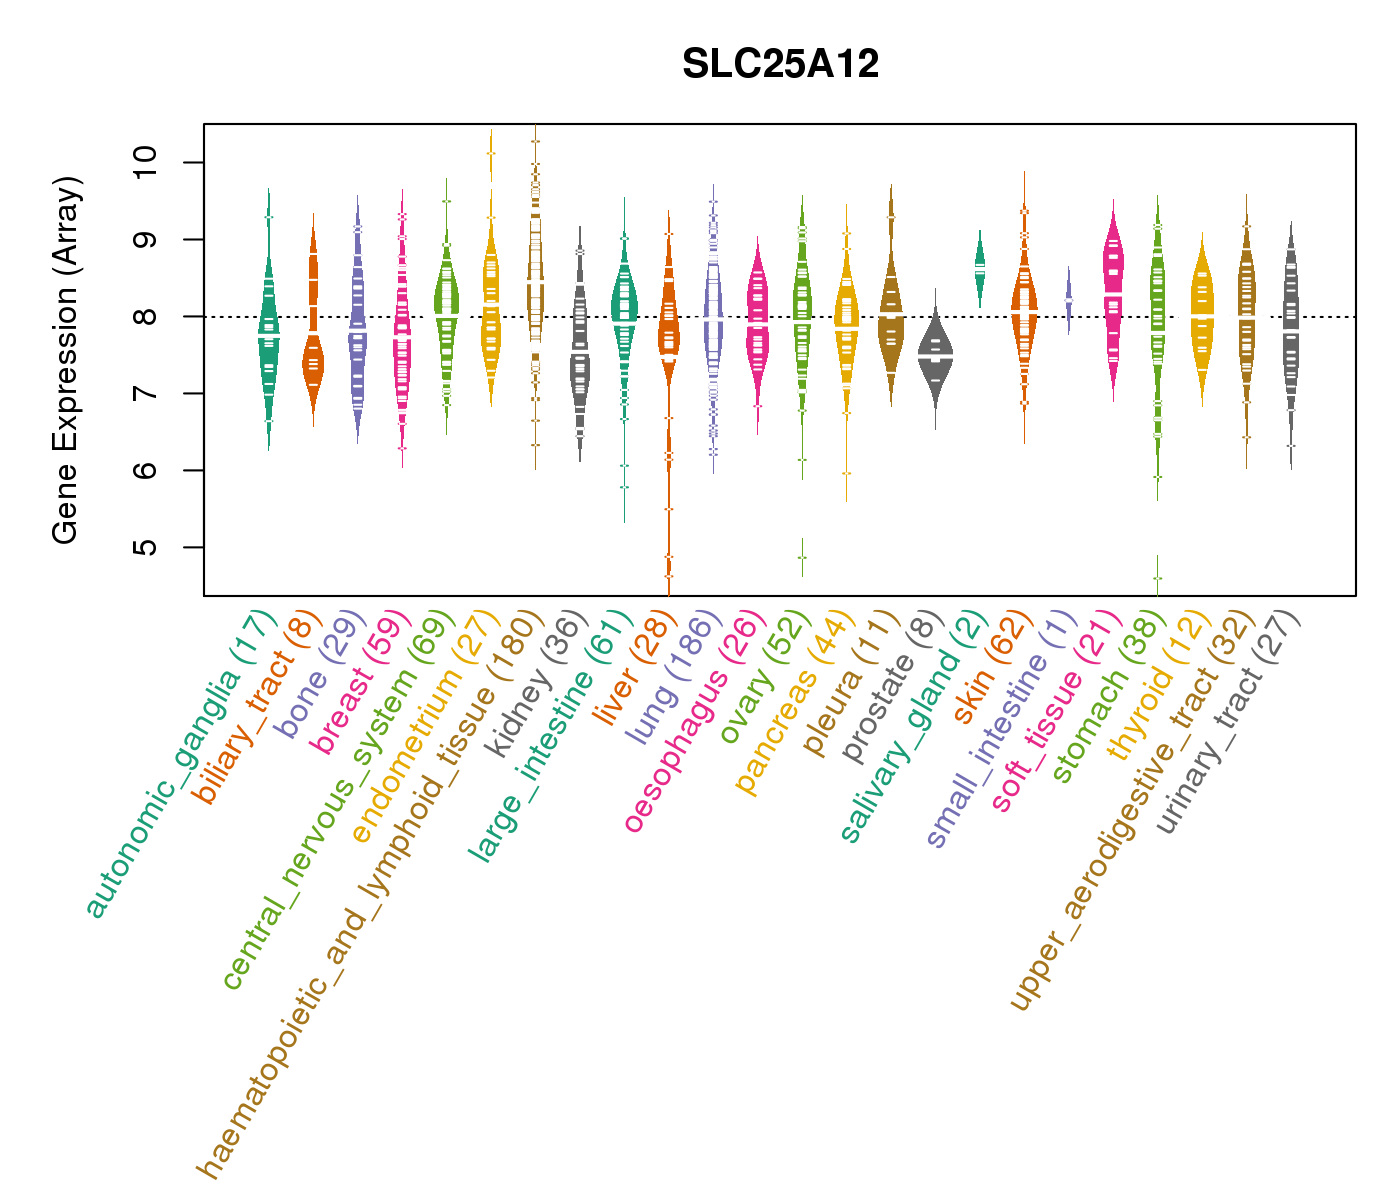
| Gene Expression for SLC25A12 |
| * CCLE gene expression data were extracted from CCLE_Expression_Entrez_2012-10-18.res: Gene-centric RMA-normalized mRNA expression data. |
 |
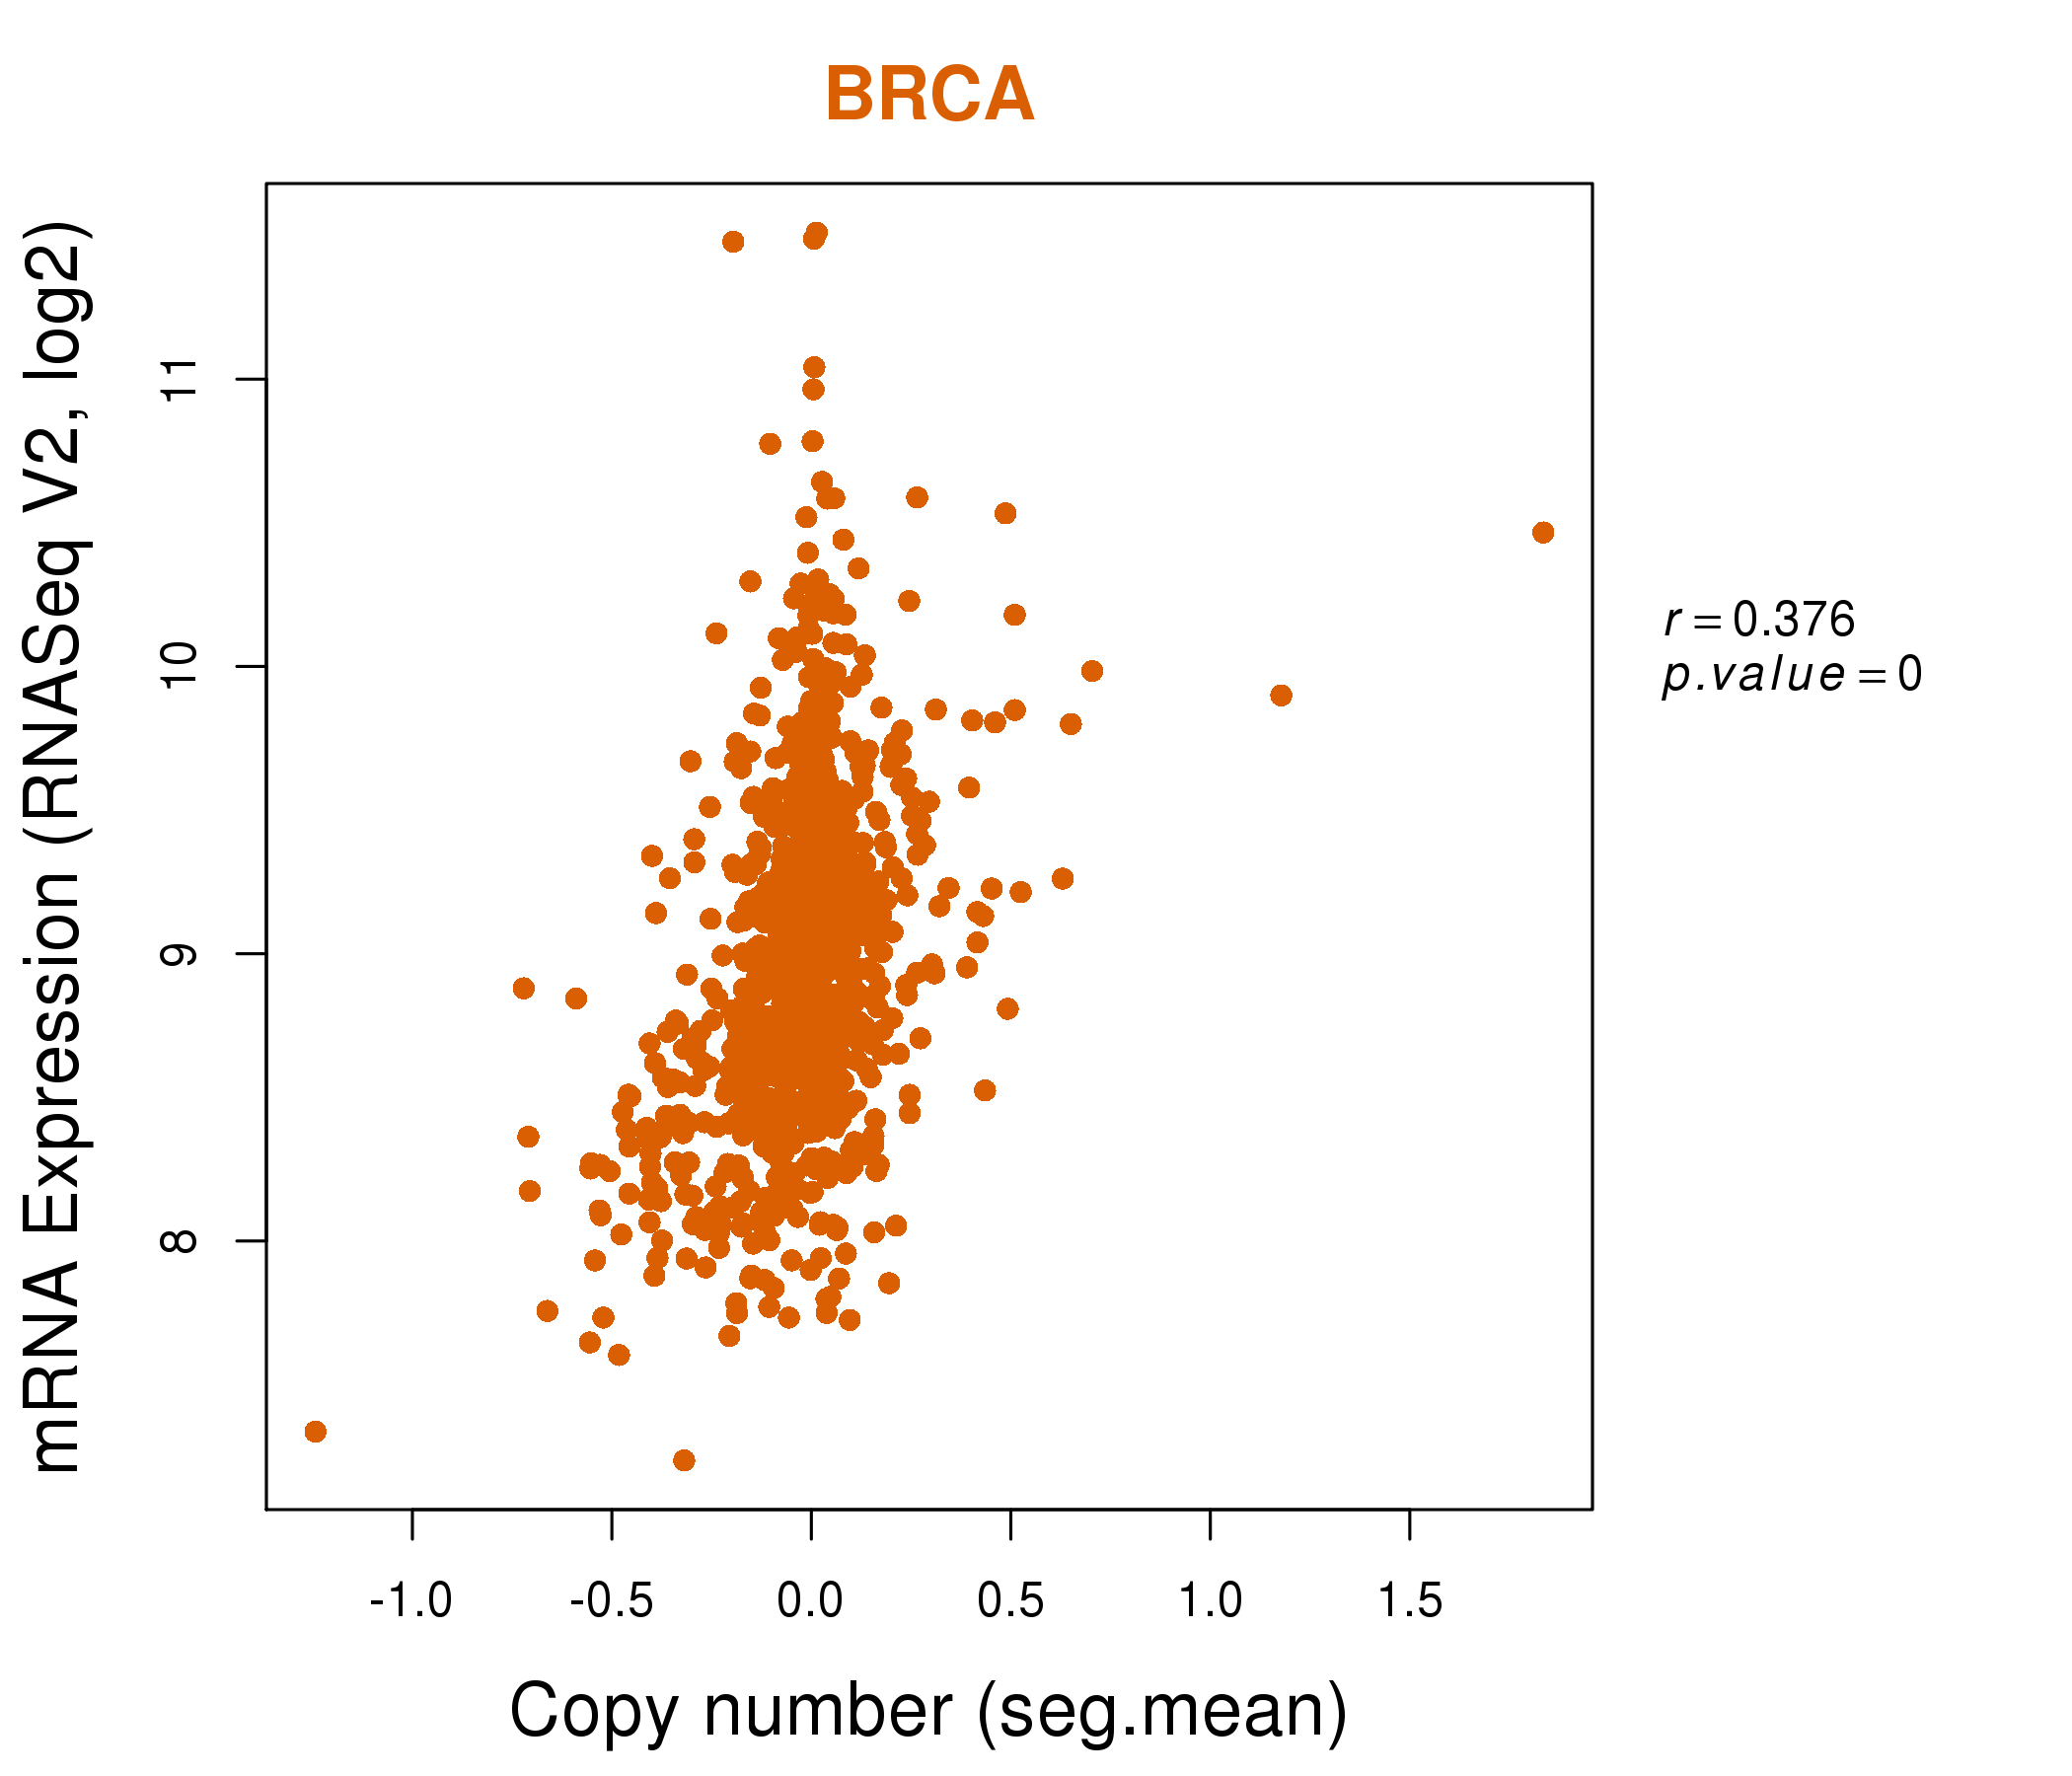
| * Normalized gene expression data of RNASeqV2 was extracted from TCGA using R package TCGA-Assembler. The URLs of all public data files on TCGA DCC data server were gathered at Jan-05-2015. Only eight cancer types have enough normal control samples for differential expression analysis. (t test, adjusted p<0.05 (using Benjamini-Hochberg FDR)) |
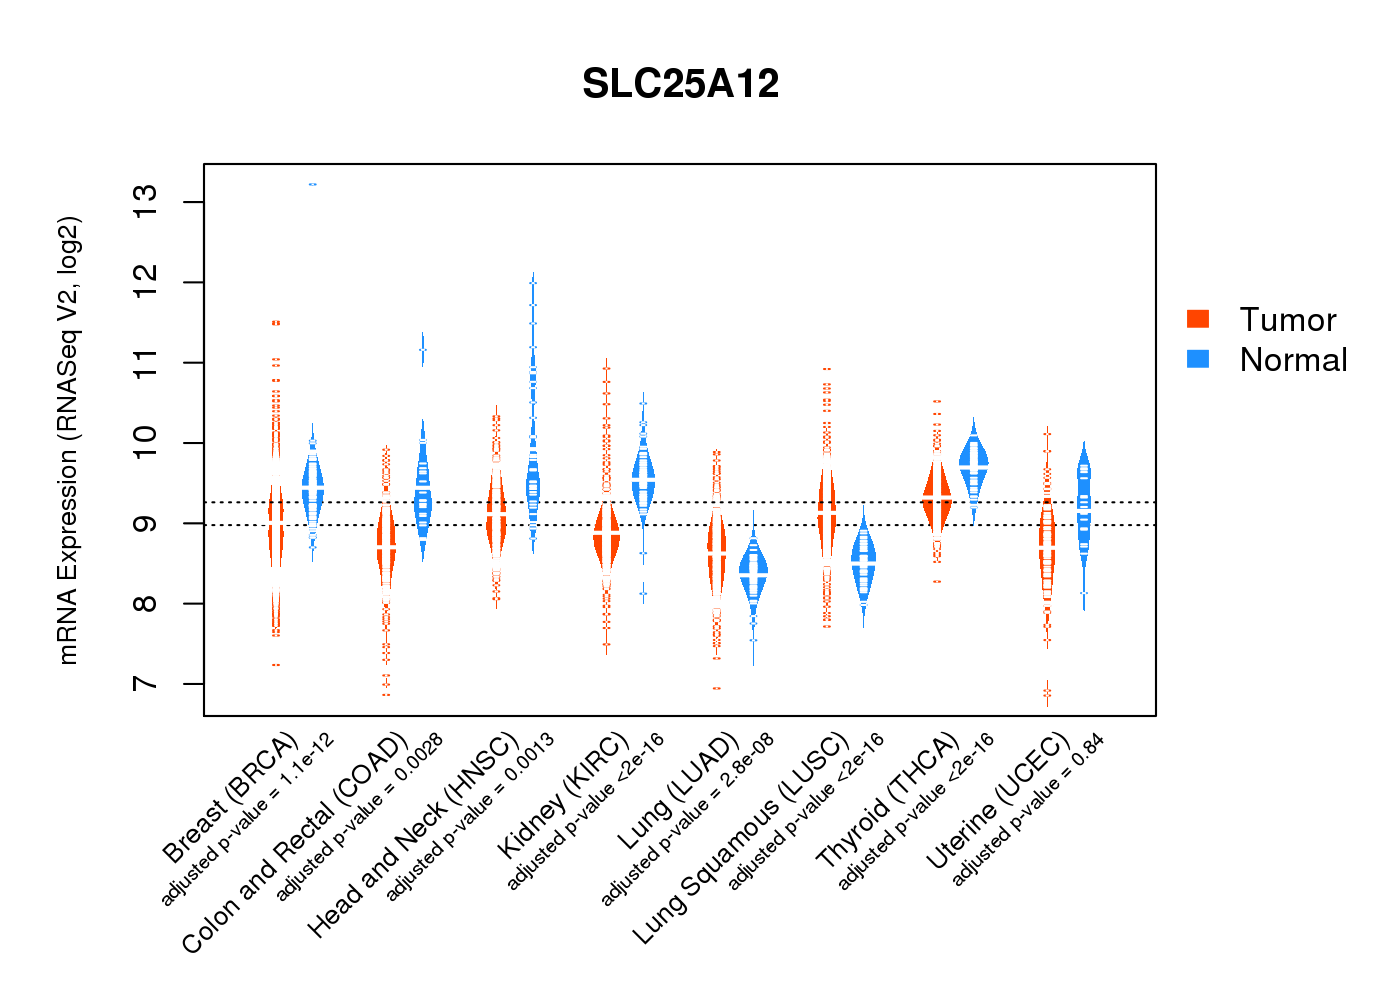 |
| Top |
| * This plots show the correlation between CNV and gene expression. |
: Open all plots for all cancer types
 |
|
 |
|

| Top |
| Gene-Gene Network Information |
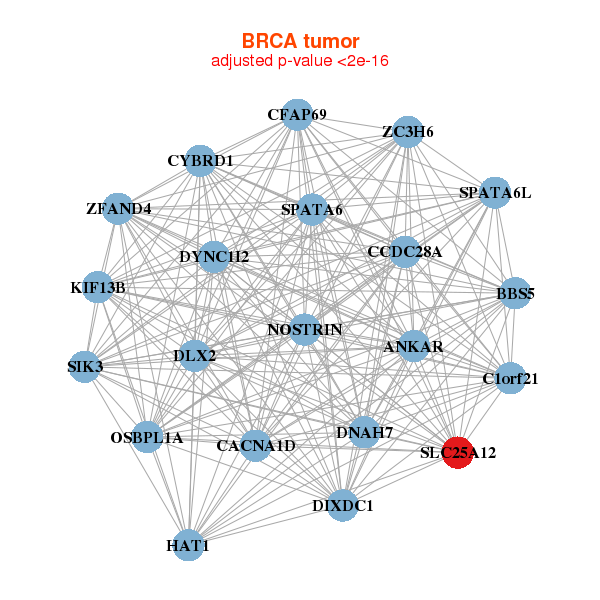
| * Co-Expression network figures were drawn using R package igraph. Only the top 20 genes with the highest correlations were shown. Red circle: input gene, orange circle: cell metabolism gene, sky circle: other gene |
: Open all plots for all cancer types
 |
| ||||
| ANKAR,ZFAND4,BBS5,C1orf21,CFAP69,SPATA6L,CACNA1D, CCDC28A,CYBRD1,DIXDC1,DLX2,DNAH7,DYNC1I2,HAT1, KIF13B,NOSTRIN,OSBPL1A,SIK3,SLC25A12,SPATA6,ZC3H6 | AMPD1,ASB12,ASB14,ASB4,CA14,CAPN3,CMYA5, CTXN3,FLJ41941,IDI2,JPH1,KCNQ5,MYLK3,MYLK4, MYOM3,OBSCN,PKIA,PRKCQ,SLC25A12,TXLNB,MSS51 | ||||
 |
| ||||
| C1orf95,C3orf18,CEP68,DNAJC27,EPC2,EXTL2,FASTKD1, GTDC1,LYRM7,MARCH7,METTL8,PLEKHA3,PRKCE,RBM43, RCOR3,SCRN3,SLC25A12,SRGAP3,TFCP2L1,TOR1AIP1,ZC3H8 | BVES,CALD1,CSRP1,CTXN1,DES,DNAJB5,HSPB8, ILK,LMO3,MYL9,MYLK,PDLIM7,PNCK,SLC25A12, SMTN,TAGLN,THBS4,TPM1,TPM2,TSPAN2,TUBA1A |

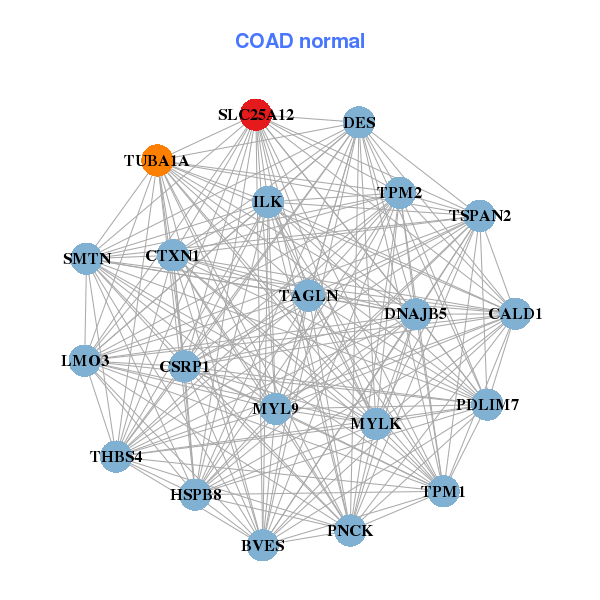
| * Co-Expression network figures were drawn using R package igraph. Only the top 20 genes with the highest correlations were shown. Red circle: input gene, orange circle: cell metabolism gene, sky circle: other gene |
: Open all plots for all cancer types
| Top |
: Open all interacting genes' information including KEGG pathway for all interacting genes from DAVID
| Top |
| Pharmacological Information for SLC25A12 |
| DB Category | DB Name | DB's ID and Url link |
| * Gene Centered Interaction Network. |
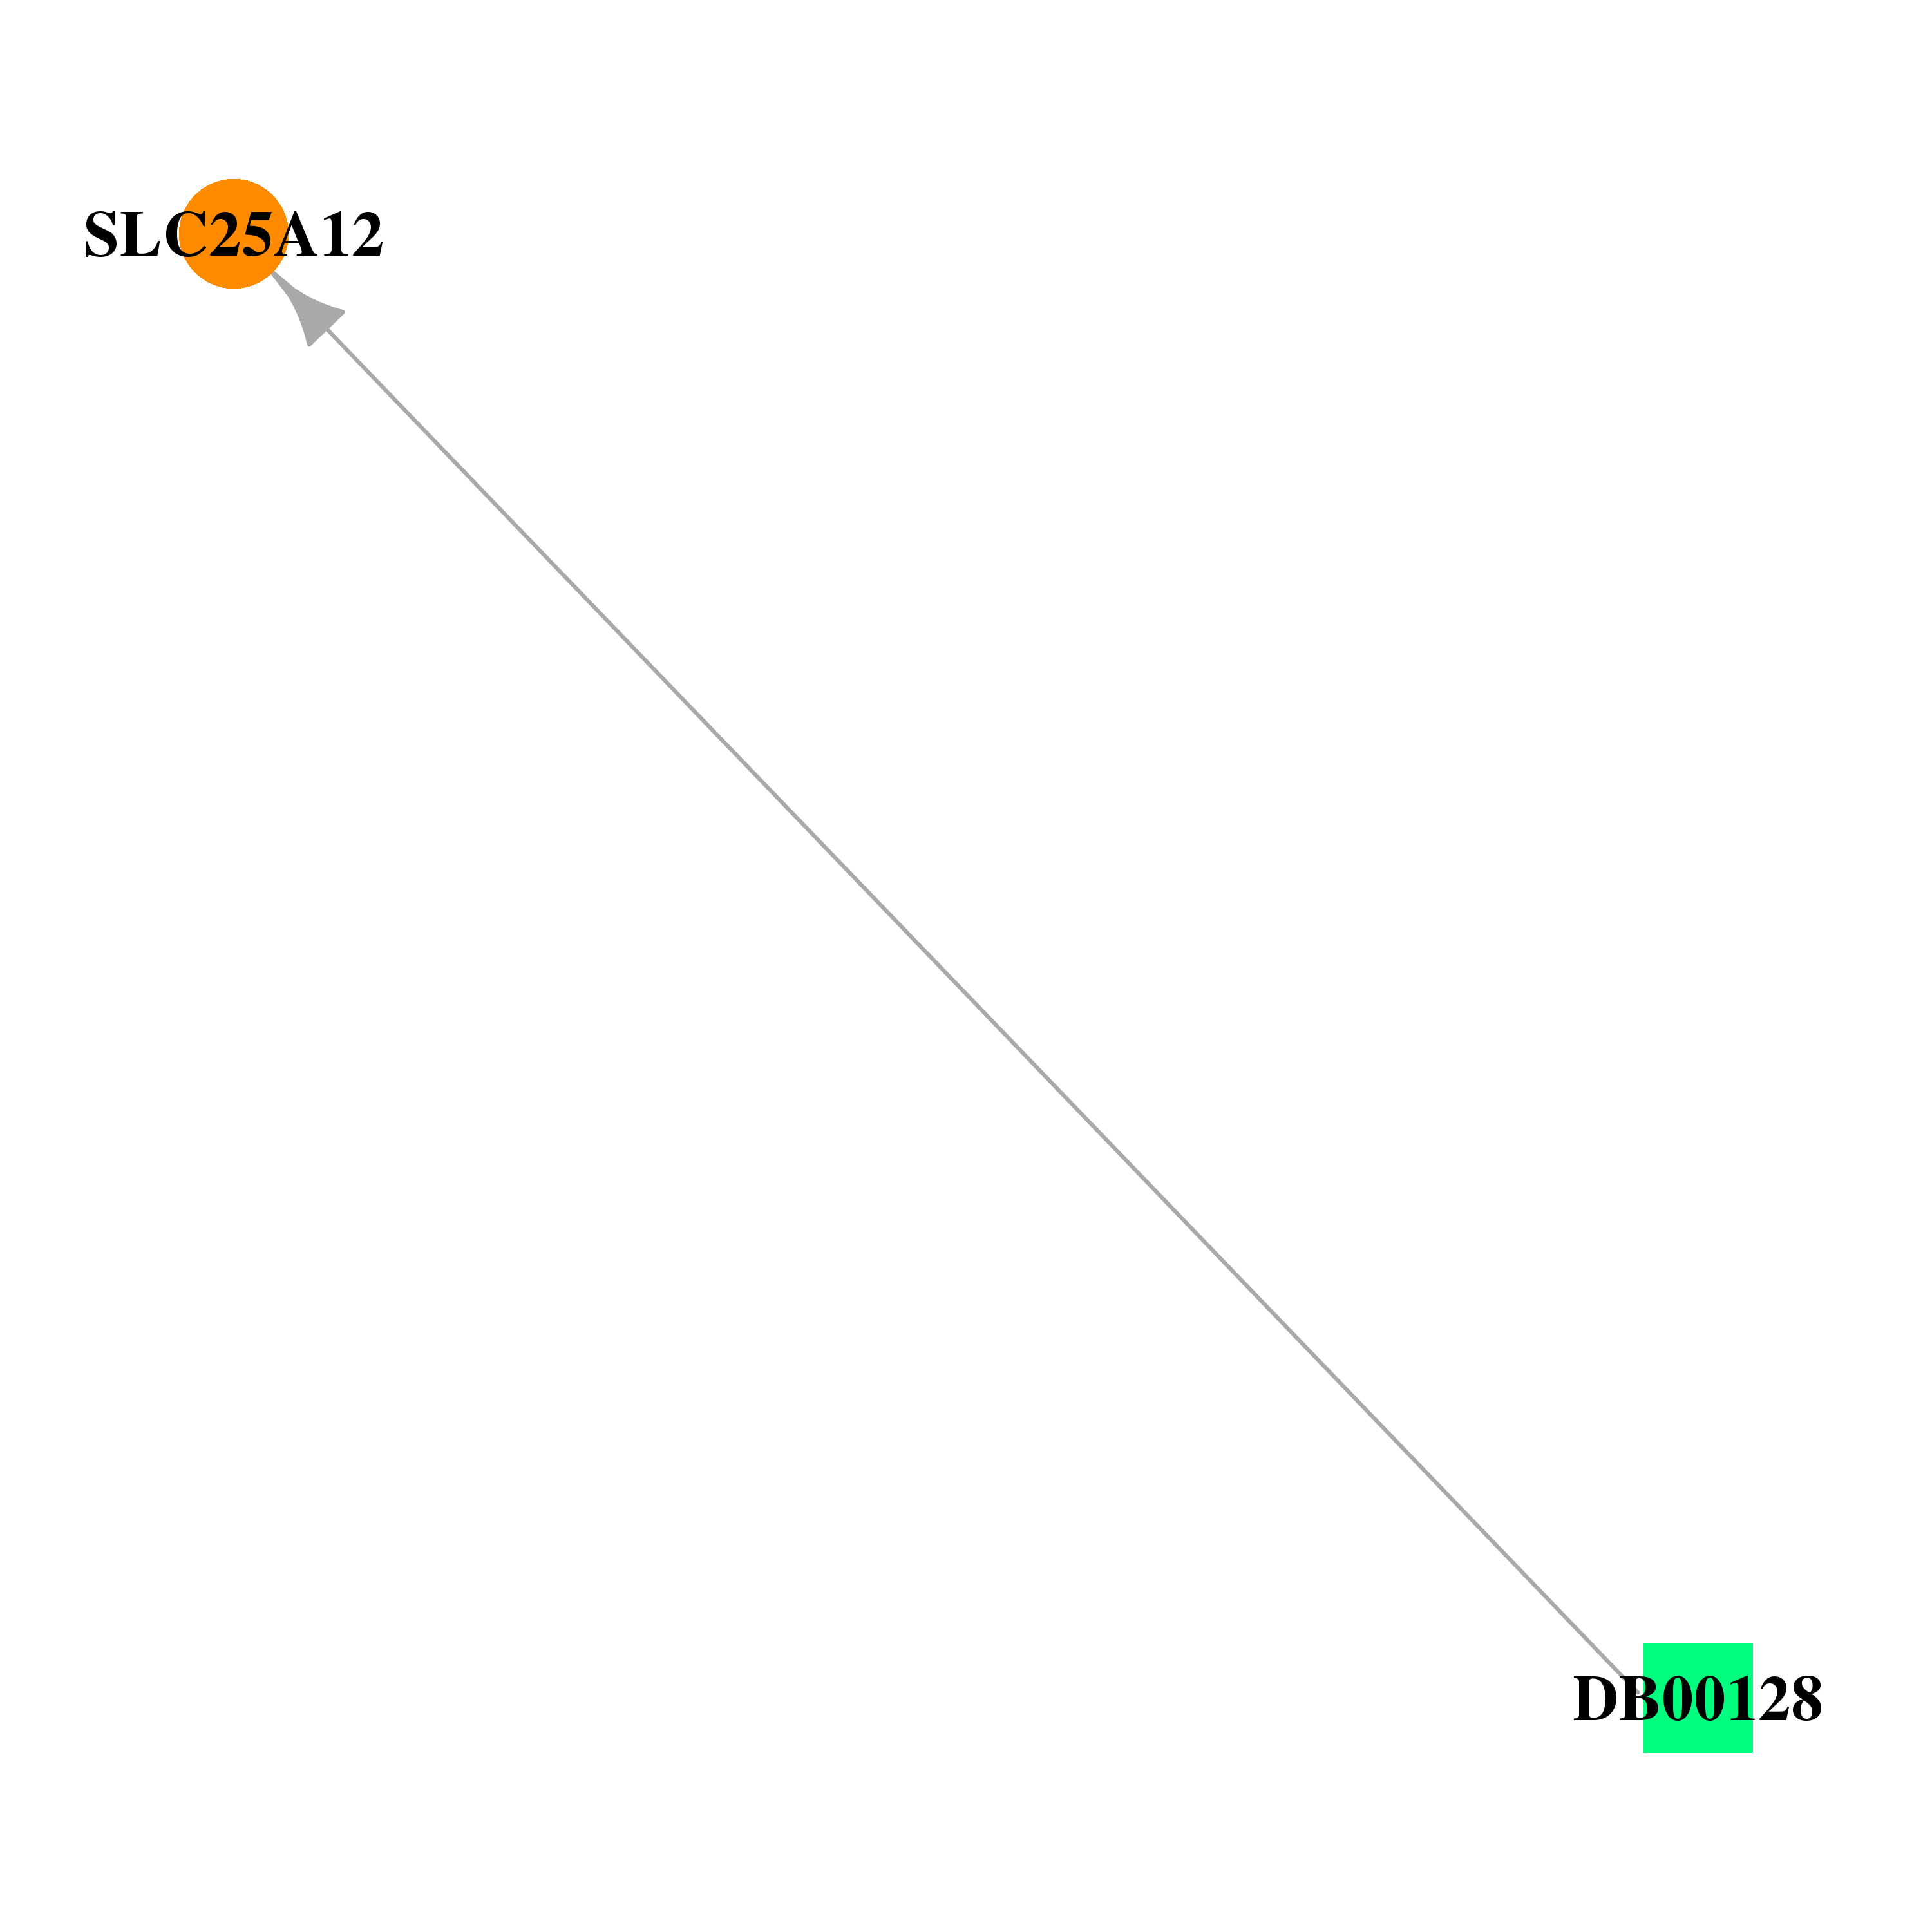 |
| * Drug Centered Interaction Network. |
| DrugBank ID | Target Name | Drug Groups | Generic Name | Drug Centered Network | Drug Structure |
| DB00128 | solute carrier family 25 (aspartate/glutamate carrier), member 12 | approved; nutraceutical | L-Aspartic Acid | 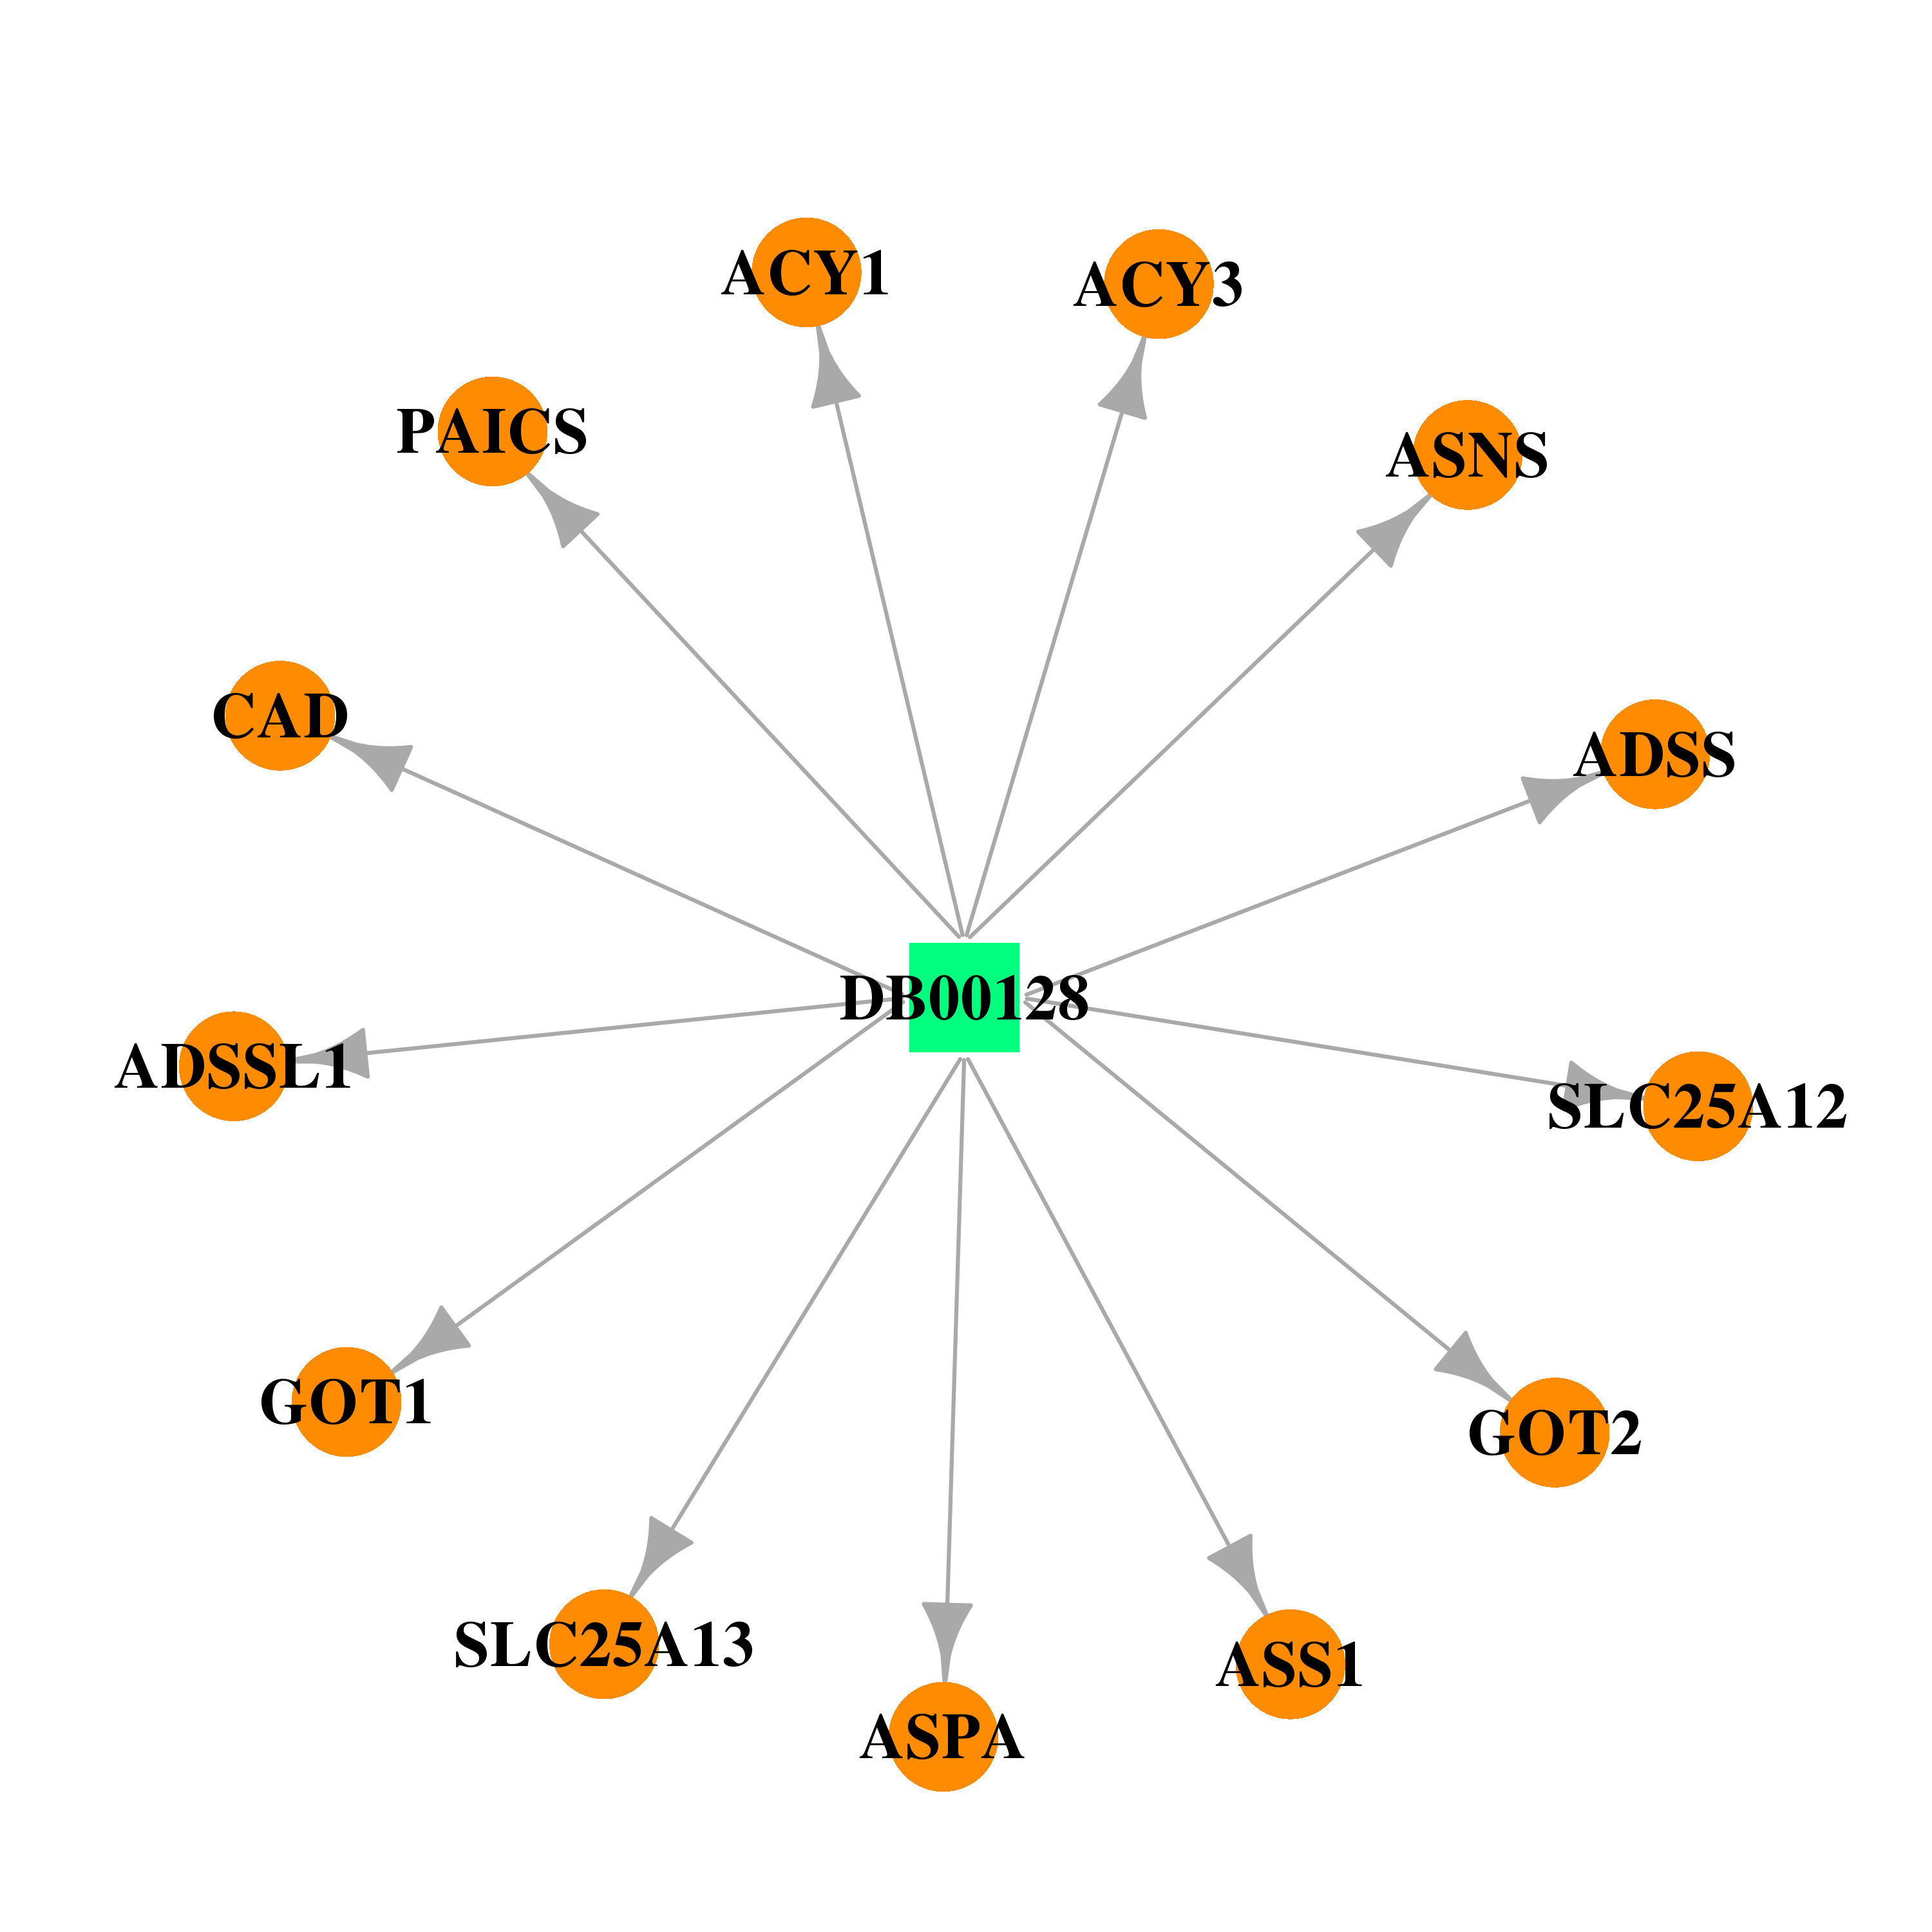 | 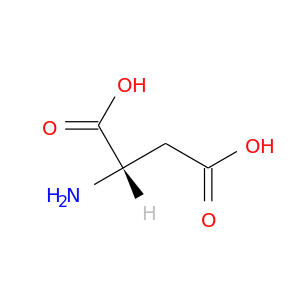 |
| Top |
| Cross referenced IDs for SLC25A12 |
| * We obtained these cross-references from Uniprot database. It covers 150 different DBs, 18 categories. http://www.uniprot.org/help/cross_references_section |
: Open all cross reference information
|
Copyright © 2016-Present - The Univsersity of Texas Health Science Center at Houston @ |