|
||||||||||||||||||||||||||||||||||||||||||||||||||||||||||||||||||||||||||||||||||||||||||||||||||||||||||||||||||||||||||||||||||||||||||||||||||||||||||||||||||||||||||||||||||||||||||||||||||||||||||||||||||||||||||||||||||||||||||||||||||||||||||||||||||||||||||||||||||||||||||||||||||||||||||||||||||||||||||
| |
| Phenotypic Information (metabolism pathway, cancer, disease, phenome) |
| |
| |
| Gene-Gene Network Information: Co-Expression Network, Interacting Genes & KEGG |
| |
|


| Gene Summary for EIF3D |
| Basic gene info. | Gene symbol | EIF3D |
| Gene name | eukaryotic translation initiation factor 3, subunit D | |
| Synonyms | EIF3S7|eIF3-p66|eIF3-zeta | |
| Cytomap | UCSC genome browser: 22q13.1 | |
| Genomic location | chr22 :36906896-36925277 | |
| Type of gene | protein-coding | |
| RefGenes | NM_003753.3, | |
| Ensembl id | ENSG00000100353 | |
| Description | eIF3 p66eukaryotic translation initiation factor 3 subunit Deukaryotic translation initiation factor 3, subunit 7 zeta, 66/67kDatranslation initiation factor eIF3 p66 subunit | |
| Modification date | 20141207 | |
| dbXrefs | MIM : 603915 | |
| HGNC : HGNC | ||
| Ensembl : ENSG00000100353 | ||
| HPRD : 04888 | ||
| Vega : OTTHUMG00000150599 | ||
| Protein | UniProt: go to UniProt's Cross Reference DB Table | |
| Expression | CleanEX: HS_EIF3D | |
| BioGPS: 8664 | ||
| Gene Expression Atlas: ENSG00000100353 | ||
| The Human Protein Atlas: ENSG00000100353 | ||
| Pathway | NCI Pathway Interaction Database: EIF3D | |
| KEGG: EIF3D | ||
| REACTOME: EIF3D | ||
| ConsensusPathDB | ||
| Pathway Commons: EIF3D | ||
| Metabolism | MetaCyc: EIF3D | |
| HUMANCyc: EIF3D | ||
| Regulation | Ensembl's Regulation: ENSG00000100353 | |
| miRBase: chr22 :36,906,896-36,925,277 | ||
| TargetScan: NM_003753 | ||
| cisRED: ENSG00000100353 | ||
| Context | iHOP: EIF3D | |
| cancer metabolism search in PubMed: EIF3D | ||
| UCL Cancer Institute: EIF3D | ||
| Assigned class in ccmGDB | C | |
| Top |
| Phenotypic Information for EIF3D(metabolism pathway, cancer, disease, phenome) |
| Cancer | CGAP: EIF3D |
| Familial Cancer Database: EIF3D | |
| * This gene is included in those cancer gene databases. |
|
|
|
|
|
| . | ||||||||||||||||||||||||||||||||||||||||||||||||||||||||||||||||||||||||||||||||||||||||||||||||||||||||||||||||||||||||||||||||||||||||||||||||||||||||||||||||||||||||||||||||||||||||||||||||||||||||||||||||||||||||||||||||||||||||||||||||||||||||||||||||||||||||||||||||||||||||||||||||||||||||||||||||||||
Oncogene 1 | Significant driver gene in | |||||||||||||||||||||||||||||||||||||||||||||||||||||||||||||||||||||||||||||||||||||||||||||||||||||||||||||||||||||||||||||||||||||||||||||||||||||||||||||||||||||||||||||||||||||||||||||||||||||||||||||||||||||||||||||||||||||||||||||||||||||||||||||||||||||||||||||||||||||||||||||||||||||||||||||||||||||||||
| cf) number; DB name 1 Oncogene; http://nar.oxfordjournals.org/content/35/suppl_1/D721.long, 2 Tumor Suppressor gene; https://bioinfo.uth.edu/TSGene/, 3 Cancer Gene Census; http://www.nature.com/nrc/journal/v4/n3/abs/nrc1299.html, 4 CancerGenes; http://nar.oxfordjournals.org/content/35/suppl_1/D721.long, 5 Network of Cancer Gene; http://ncg.kcl.ac.uk/index.php, 1Therapeutic Vulnerabilities in Cancer; http://cbio.mskcc.org/cancergenomics/statius/ |
| REACTOME_METABOLISM_OF_PROTEINS | |
| OMIM | |
| Orphanet | |
| Disease | KEGG Disease: EIF3D |
| MedGen: EIF3D (Human Medical Genetics with Condition) | |
| ClinVar: EIF3D | |
| Phenotype | MGI: EIF3D (International Mouse Phenotyping Consortium) |
| PhenomicDB: EIF3D | |
| Mutations for EIF3D |
| * Under tables are showing count per each tissue to give us broad intuition about tissue specific mutation patterns.You can go to the detailed page for each mutation database's web site. |
| There's no structural variation information in COSMIC data for this gene. |
| * From mRNA Sanger sequences, Chitars2.0 arranged chimeric transcripts. This table shows EIF3D related fusion information. |
| ID | Head Gene | Tail Gene | Accession | Gene_a | qStart_a | qEnd_a | Chromosome_a | tStart_a | tEnd_a | Gene_a | qStart_a | qEnd_a | Chromosome_a | tStart_a | tEnd_a |
| BE122841 | S100A2 | 8 | 291 | 1 | 153533821 | 153536246 | EIF3D | 289 | 453 | 22 | 36908615 | 36912655 | |
| BE260321 | EIF3D | 1 | 337 | 22 | 36920681 | 36925170 | UCP2 | 333 | 633 | 11 | 73689426 | 73693808 | |
| BM974825 | EIF3D | 19 | 122 | 22 | 36906904 | 36907007 | TNRC18 | 116 | 642 | 7 | 5347525 | 5348795 | |
| AA463841 | EIF3D | 1 | 211 | 22 | 36906993 | 36907705 | EIF3D | 207 | 300 | 22 | 36907717 | 36907809 | |
| CD688331 | EIF3D | 32 | 261 | 22 | 36907748 | 36908650 | EIF3D | 254 | 558 | 22 | 36919942 | 36922081 | |
| BM910722 | PEG10 | 1 | 84 | 7 | 94298837 | 94298920 | EIF3D | 81 | 470 | 22 | 36920643 | 36925196 | |
| AI028447 | EIF3D | 7 | 259 | 22 | 36906902 | 36907656 | EIF3D | 256 | 369 | 22 | 36912525 | 36912638 | |
| BF768948 | EIF3D | 2 | 312 | 22 | 36914891 | 36916733 | PSMD13 | 303 | 404 | 11 | 252820 | 252921 | |
| BE122809 | EIF3D | 4 | 163 | 22 | 36908615 | 36912655 | S100A2 | 161 | 444 | 1 | 153533821 | 153536246 | |
| BG991794 | EIF3D | 14 | 363 | 22 | 36919942 | 36922128 | FAM111A | 357 | 457 | 11 | 58919381 | 58919481 | |
| Top |
| Mutation type/ Tissue ID | brca | cns | cerv | endome | haematopo | kidn | Lintest | liver | lung | ns | ovary | pancre | prost | skin | stoma | thyro | urina | |||
| Total # sample | 1 | |||||||||||||||||||
| GAIN (# sample) | ||||||||||||||||||||
| LOSS (# sample) | 1 |
| cf) Tissue ID; Tissue type (1; Breast, 2; Central_nervous_system, 3; Cervix, 4; Endometrium, 5; Haematopoietic_and_lymphoid_tissue, 6; Kidney, 7; Large_intestine, 8; Liver, 9; Lung, 10; NS, 11; Ovary, 12; Pancreas, 13; Prostate, 14; Skin, 15; Stomach, 16; Thyroid, 17; Urinary_tract) |
| Top |
|
 |
| Top |
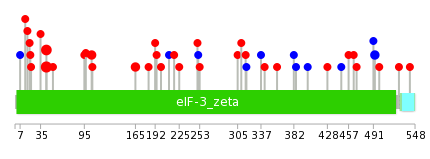
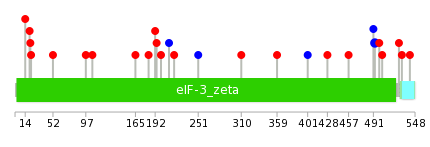
| Stat. for Non-Synonymous SNVs (# total SNVs=36) | (# total SNVs=8) |
 |  |
(# total SNVs=0) | (# total SNVs=0) |
| Top |
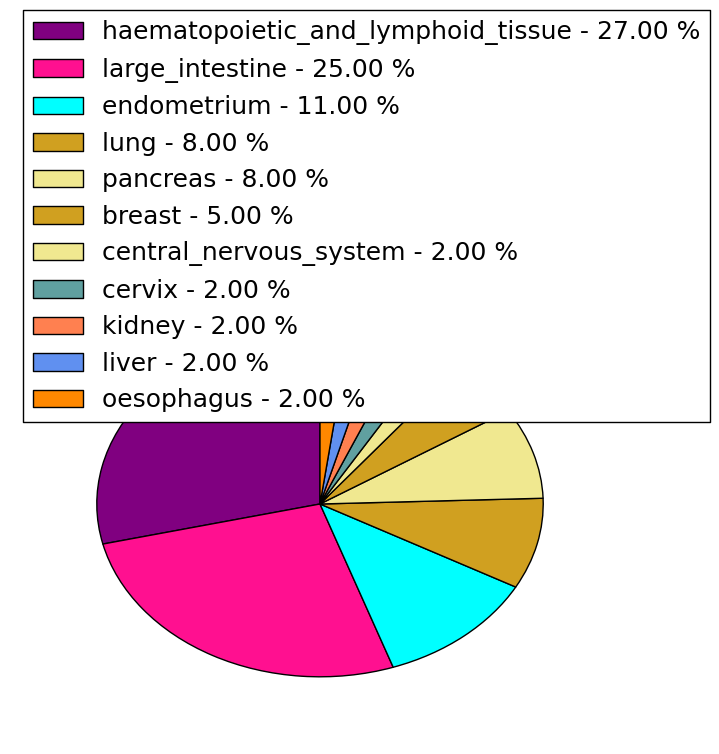
| * When you move the cursor on each content, you can see more deailed mutation information on the Tooltip. Those are primary_site,primary_histology,mutation(aa),pubmedID. |
| GRCh37 position | Mutation(aa) | Unique sampleID count |
| chr22:36921753-36921753 | p.A43T | 9 |
| chr22:36916708-36916708 | p.R165C | 2 |
| chr22:36919318-36919318 | p.R135* | 2 |
| chr22:36907704-36907704 | p.C493C | 2 |
| chr22:36920021-36920021 | p.L105F | 2 |
| chr22:36912745-36912745 | p.? | 2 |
| chr22:36913410-36913410 | p.R310C | 1 |
| chr22:36916653-36916653 | p.R183H | 1 |
| chr22:36912528-36912528 | p.S401S | 1 |
| chr22:36922104-36922104 | p.P22L | 1 |
| Top |
|
 |
| Point Mutation/ Tissue ID | 1 | 2 | 3 | 4 | 5 | 6 | 7 | 8 | 9 | 10 | 11 | 12 | 13 | 14 | 15 | 16 | 17 | 18 | 19 | 20 |
| # sample | 2 | 1 | 7 | 1 | 3 | 1 | 4 | 2 | 1 | 5 | ||||||||||
| # mutation | 2 | 1 | 7 | 1 | 3 | 1 | 4 | 2 | 1 | 5 | ||||||||||
| nonsynonymous SNV | 1 | 1 | 5 | 1 | 3 | 3 | 2 | 1 | 4 | |||||||||||
| synonymous SNV | 1 | 2 | 1 | 1 | 1 |
| cf) Tissue ID; Tissue type (1; BLCA[Bladder Urothelial Carcinoma], 2; BRCA[Breast invasive carcinoma], 3; CESC[Cervical squamous cell carcinoma and endocervical adenocarcinoma], 4; COAD[Colon adenocarcinoma], 5; GBM[Glioblastoma multiforme], 6; Glioma Low Grade, 7; HNSC[Head and Neck squamous cell carcinoma], 8; KICH[Kidney Chromophobe], 9; KIRC[Kidney renal clear cell carcinoma], 10; KIRP[Kidney renal papillary cell carcinoma], 11; LAML[Acute Myeloid Leukemia], 12; LUAD[Lung adenocarcinoma], 13; LUSC[Lung squamous cell carcinoma], 14; OV[Ovarian serous cystadenocarcinoma ], 15; PAAD[Pancreatic adenocarcinoma], 16; PRAD[Prostate adenocarcinoma], 17; SKCM[Skin Cutaneous Melanoma], 18:STAD[Stomach adenocarcinoma], 19:THCA[Thyroid carcinoma], 20:UCEC[Uterine Corpus Endometrial Carcinoma]) |
| Top |
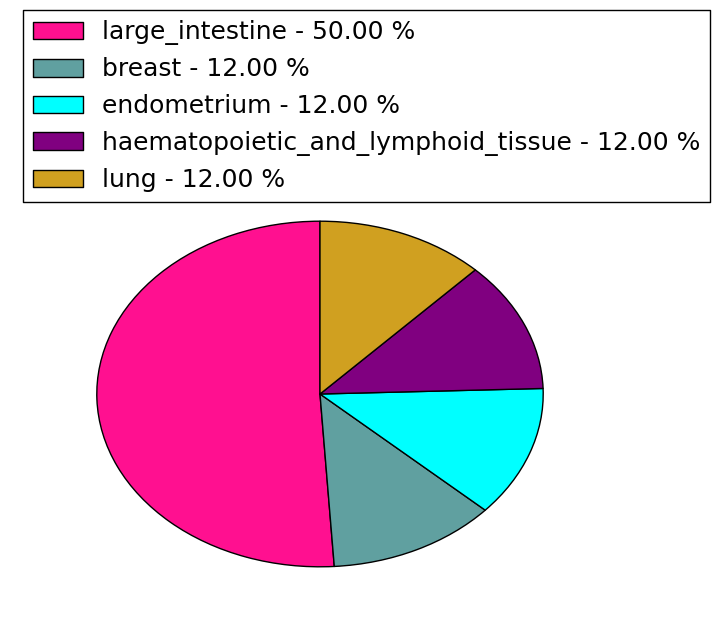
| * We represented just top 10 SNVs. When you move the cursor on each content, you can see more deailed mutation information on the Tooltip. Those are primary_site, primary_histology, mutation(aa), pubmedID. |
| Genomic Position | Mutation(aa) | Unique sampleID count |
| chr22:36907704 | p.C493C | 2 |
| chr22:36912753 | p.D530E | 1 |
| chr22:36920659 | p.D192G | 1 |
| chr22:36907562 | p.T526I | 1 |
| chr22:36913410 | p.R183C | 1 |
| chr22:36921726 | p.E503D | 1 |
| chr22:36907593 | p.R165C | 1 |
| chr22:36914916 | p.M499V | 1 |
| chr22:36922104 | p.R106H | 1 |
| chr22:36907606 | p.R97Q | 1 |
| * Copy number data were extracted from TCGA using R package TCGA-Assembler. The URLs of all public data files on TCGA DCC data server were gathered on Jan-05-2015. Function ProcessCNAData in TCGA-Assembler package was used to obtain gene-level copy number value which is calculated as the average copy number of the genomic region of a gene. |
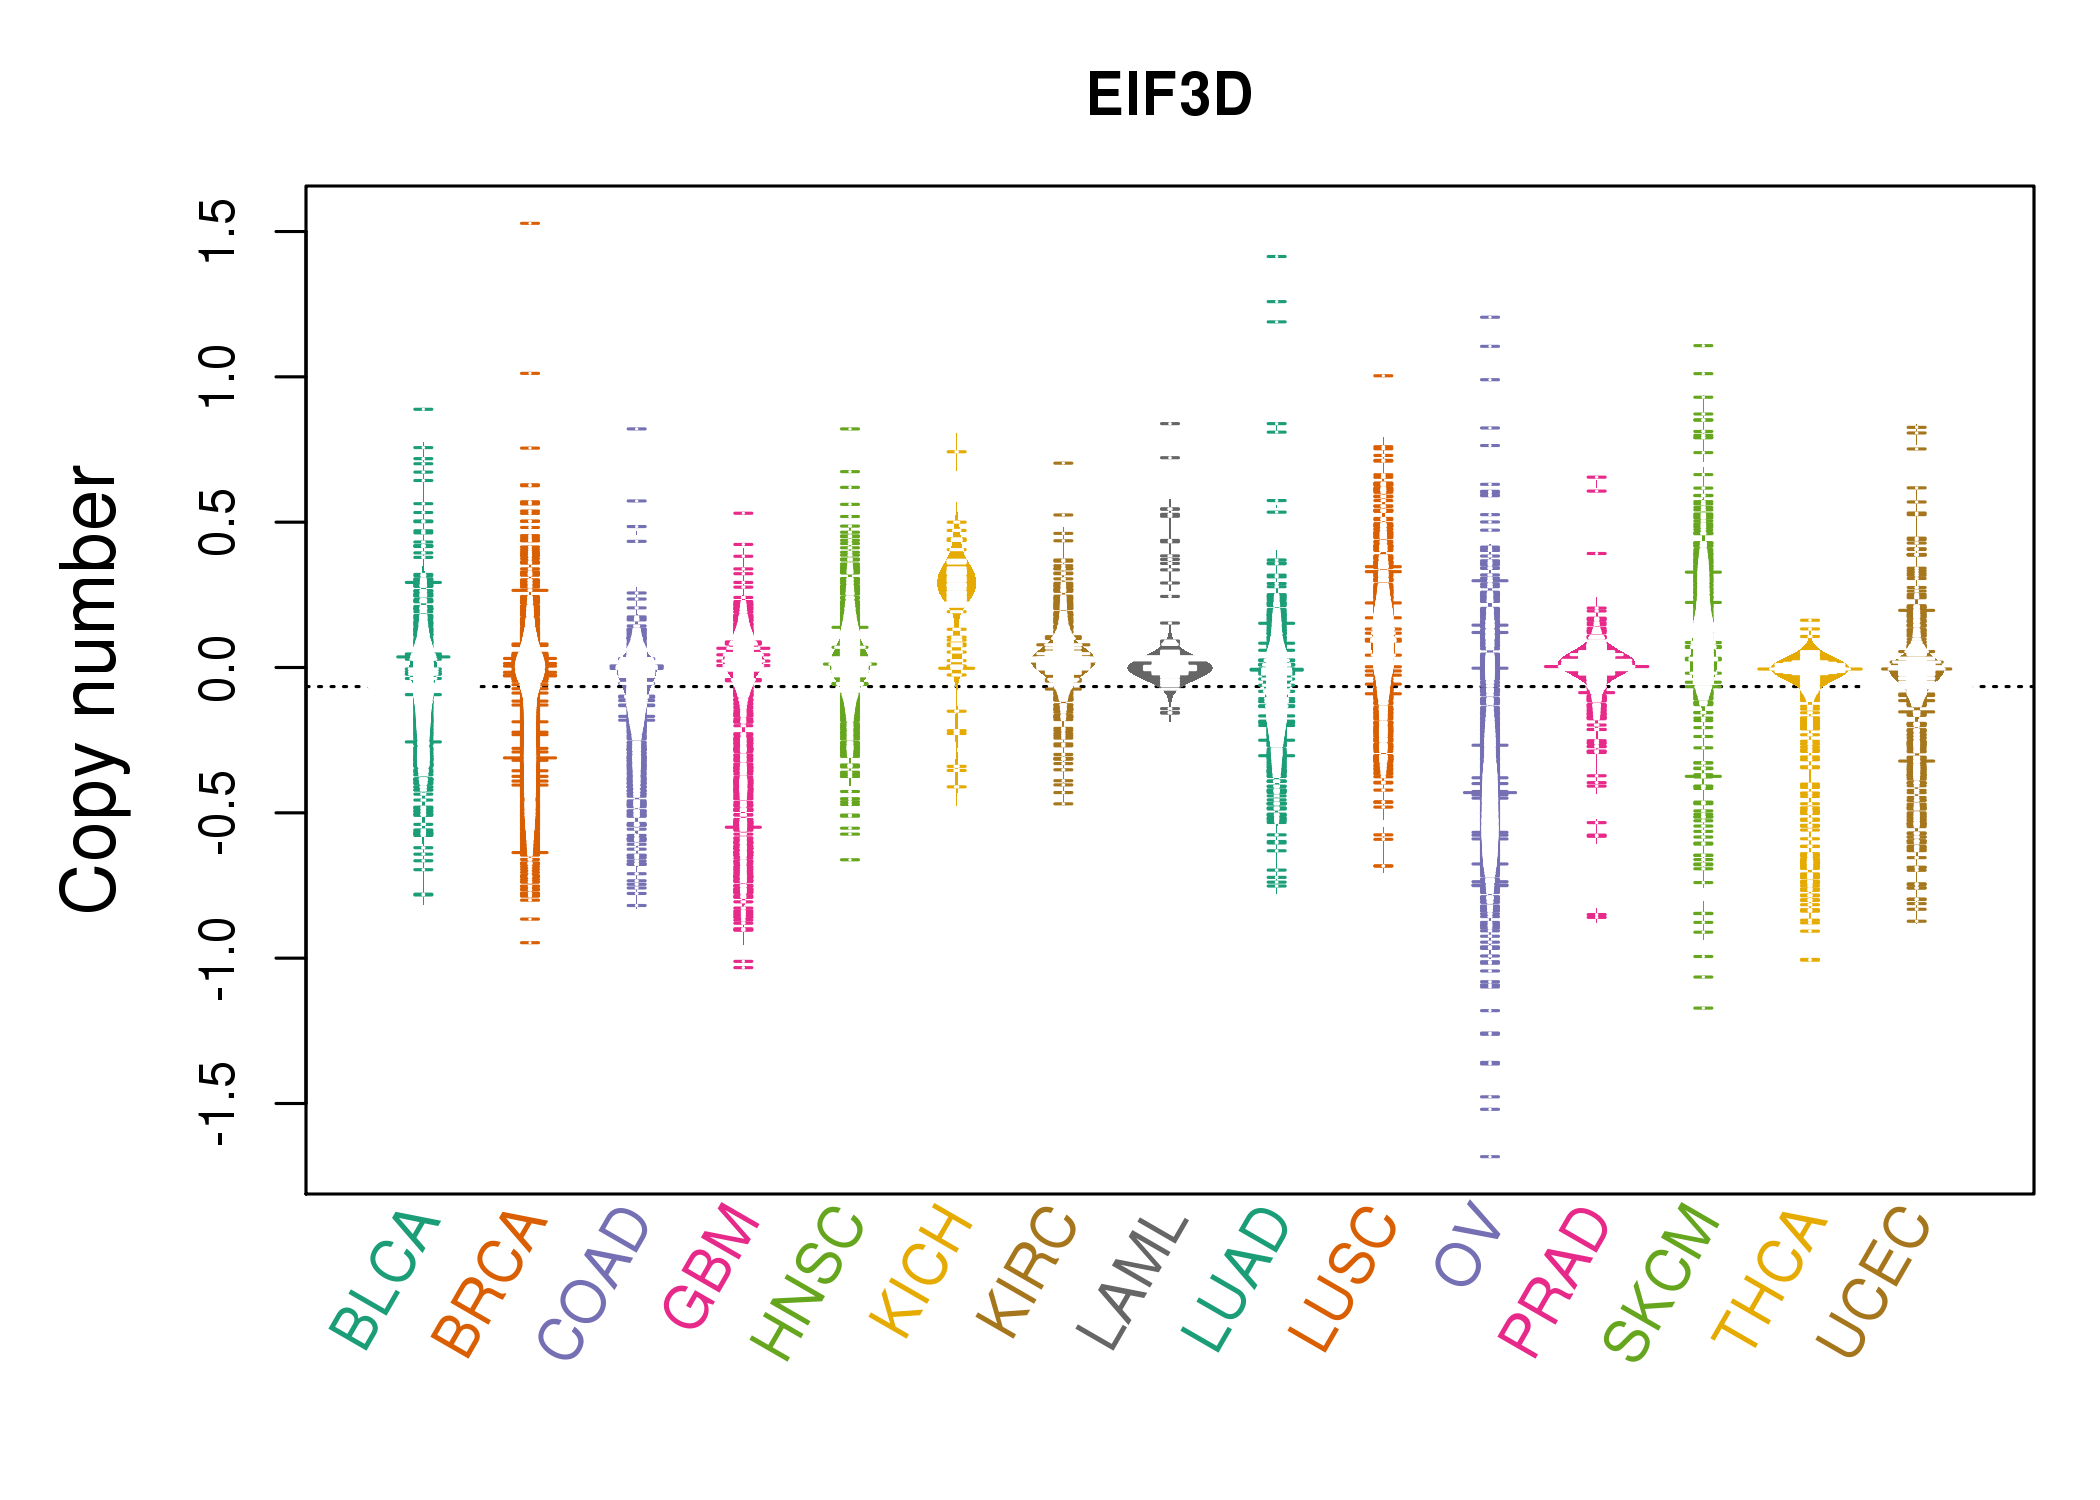 |
| cf) Tissue ID[Tissue type]: BLCA[Bladder Urothelial Carcinoma], BRCA[Breast invasive carcinoma], CESC[Cervical squamous cell carcinoma and endocervical adenocarcinoma], COAD[Colon adenocarcinoma], GBM[Glioblastoma multiforme], Glioma Low Grade, HNSC[Head and Neck squamous cell carcinoma], KICH[Kidney Chromophobe], KIRC[Kidney renal clear cell carcinoma], KIRP[Kidney renal papillary cell carcinoma], LAML[Acute Myeloid Leukemia], LUAD[Lung adenocarcinoma], LUSC[Lung squamous cell carcinoma], OV[Ovarian serous cystadenocarcinoma ], PAAD[Pancreatic adenocarcinoma], PRAD[Prostate adenocarcinoma], SKCM[Skin Cutaneous Melanoma], STAD[Stomach adenocarcinoma], THCA[Thyroid carcinoma], UCEC[Uterine Corpus Endometrial Carcinoma] |
| Top |
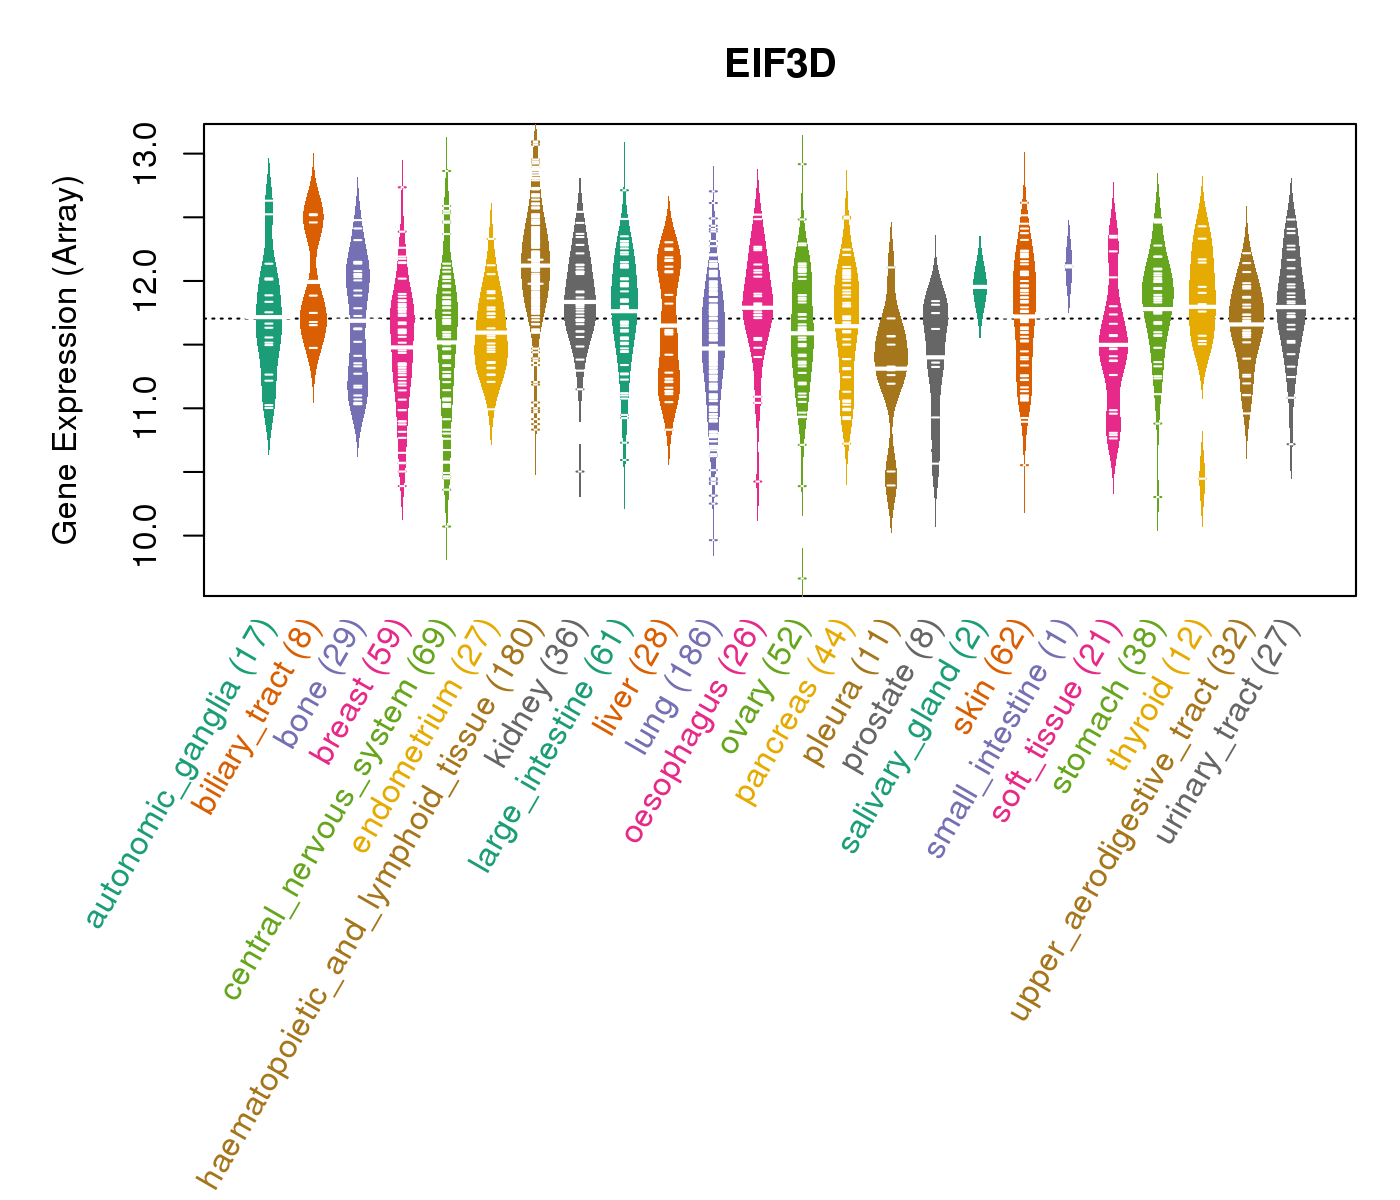
| Gene Expression for EIF3D |
| * CCLE gene expression data were extracted from CCLE_Expression_Entrez_2012-10-18.res: Gene-centric RMA-normalized mRNA expression data. |
 |
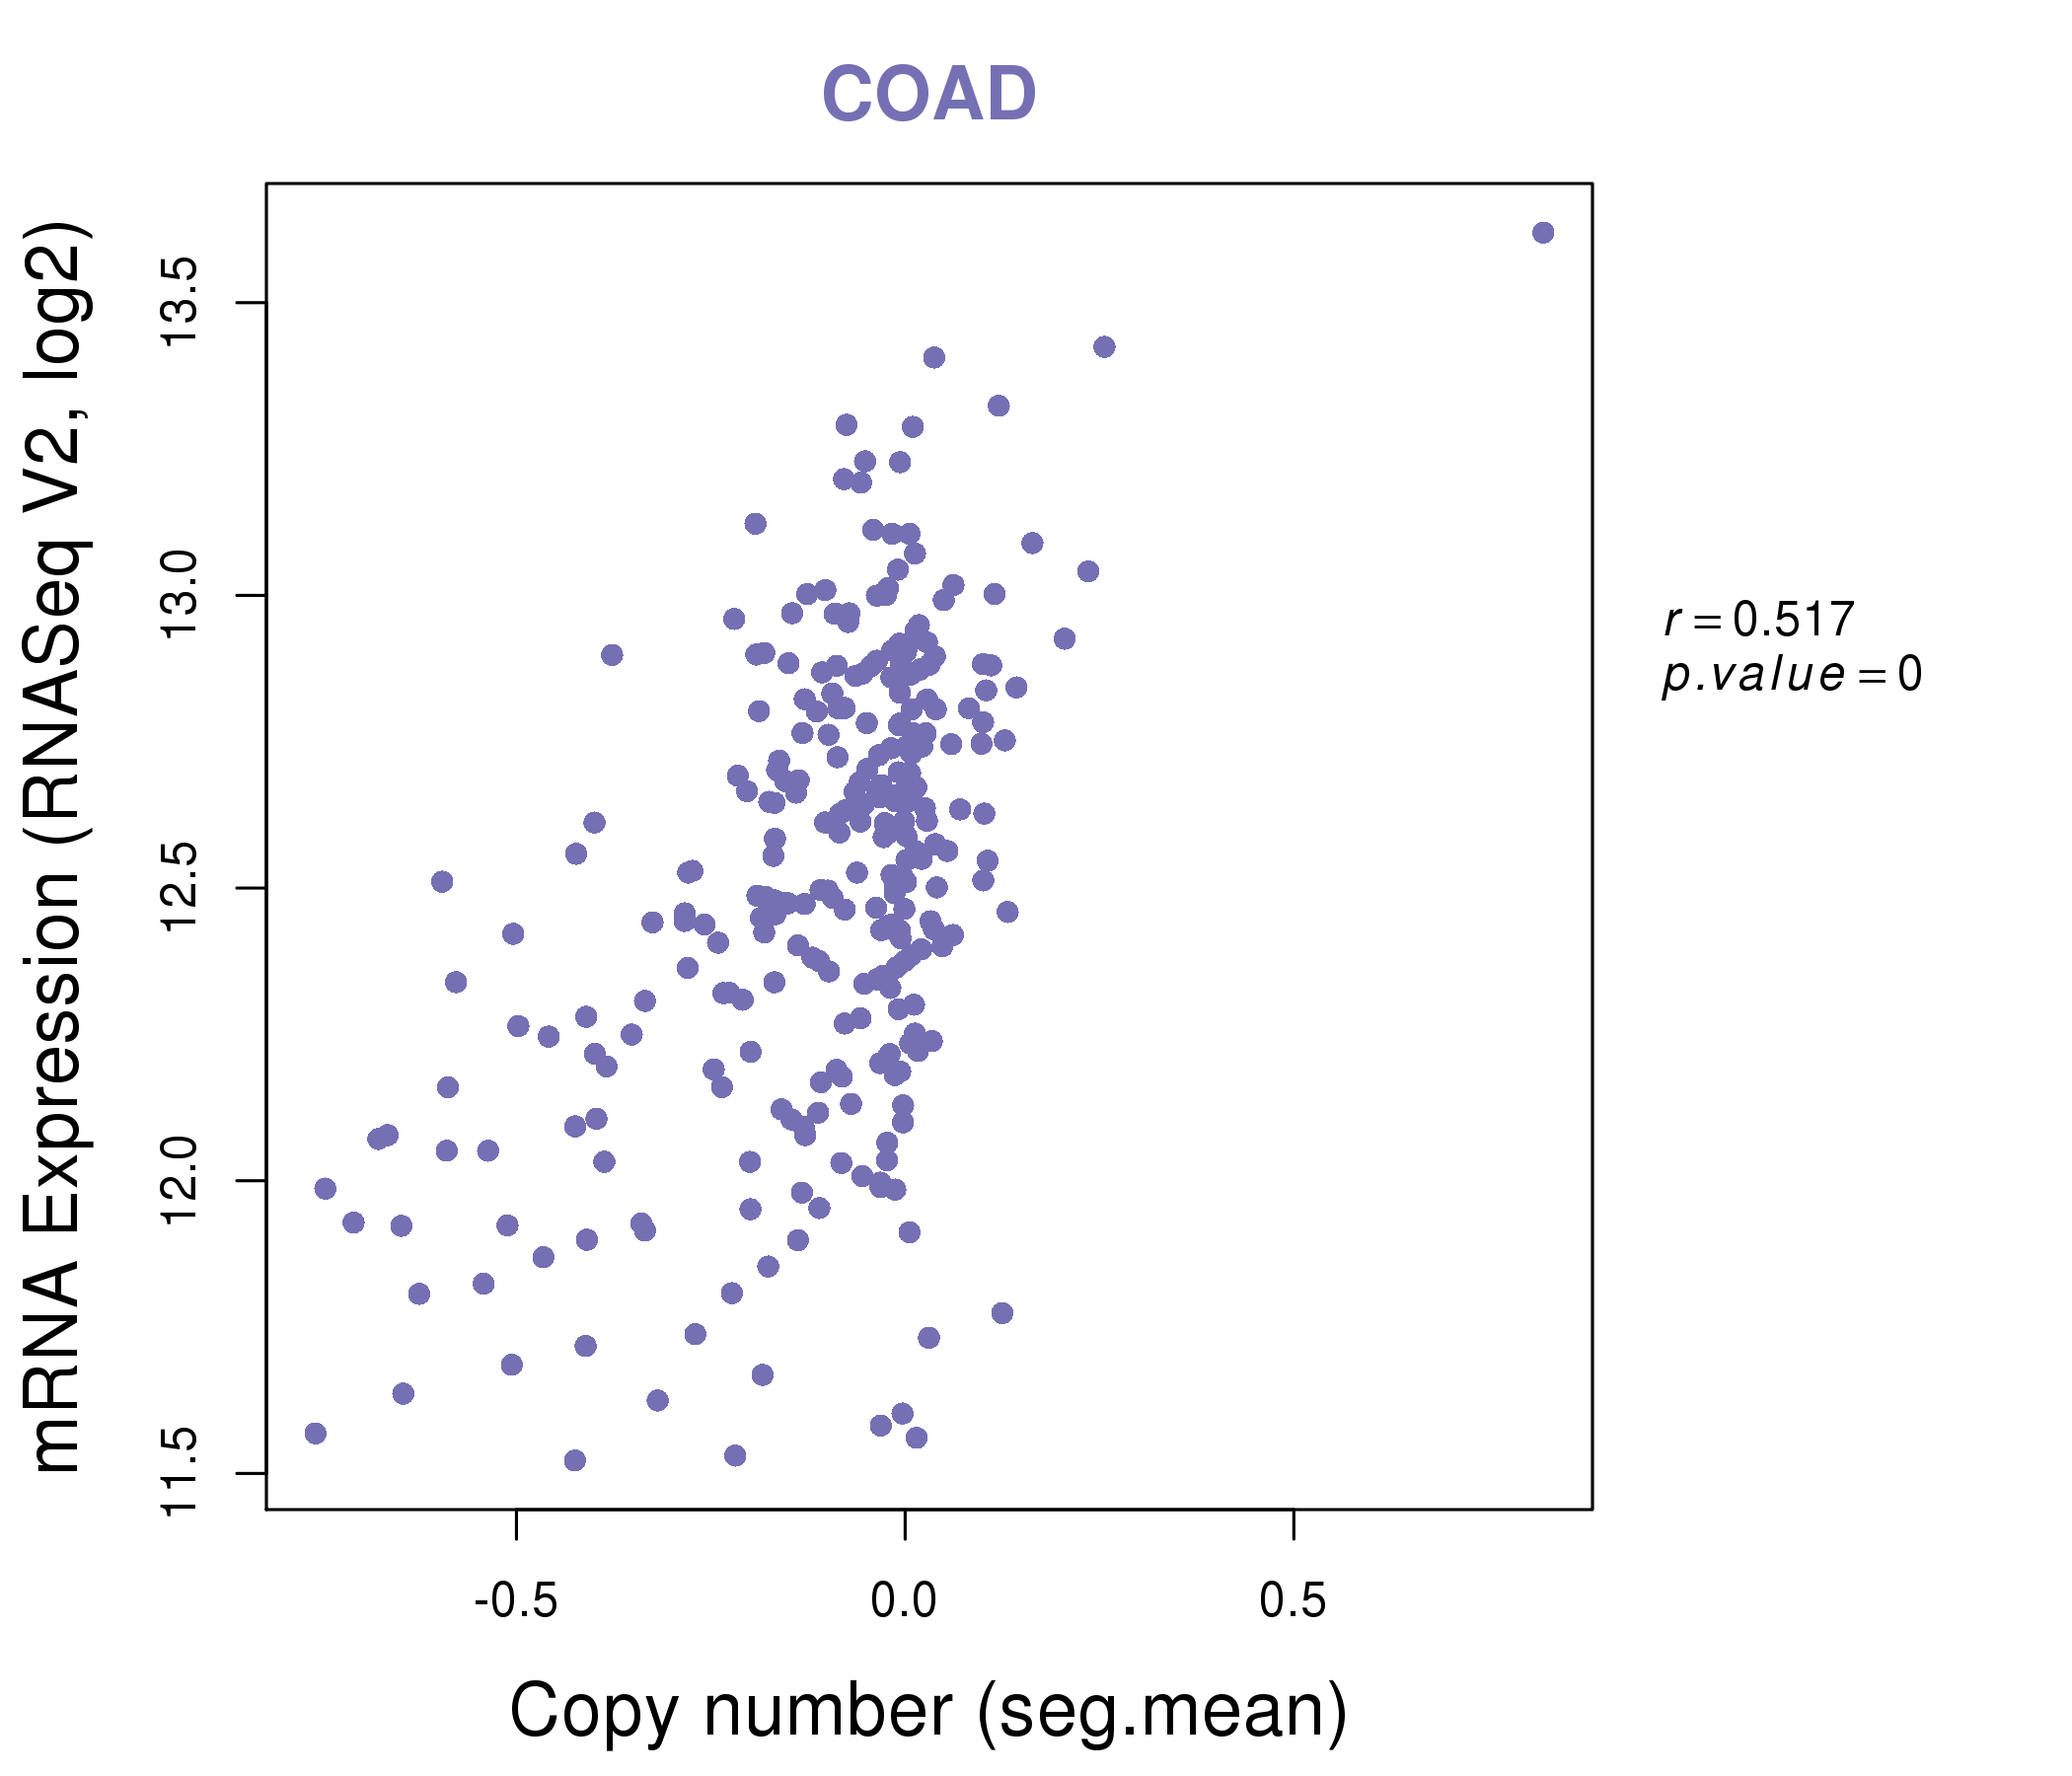
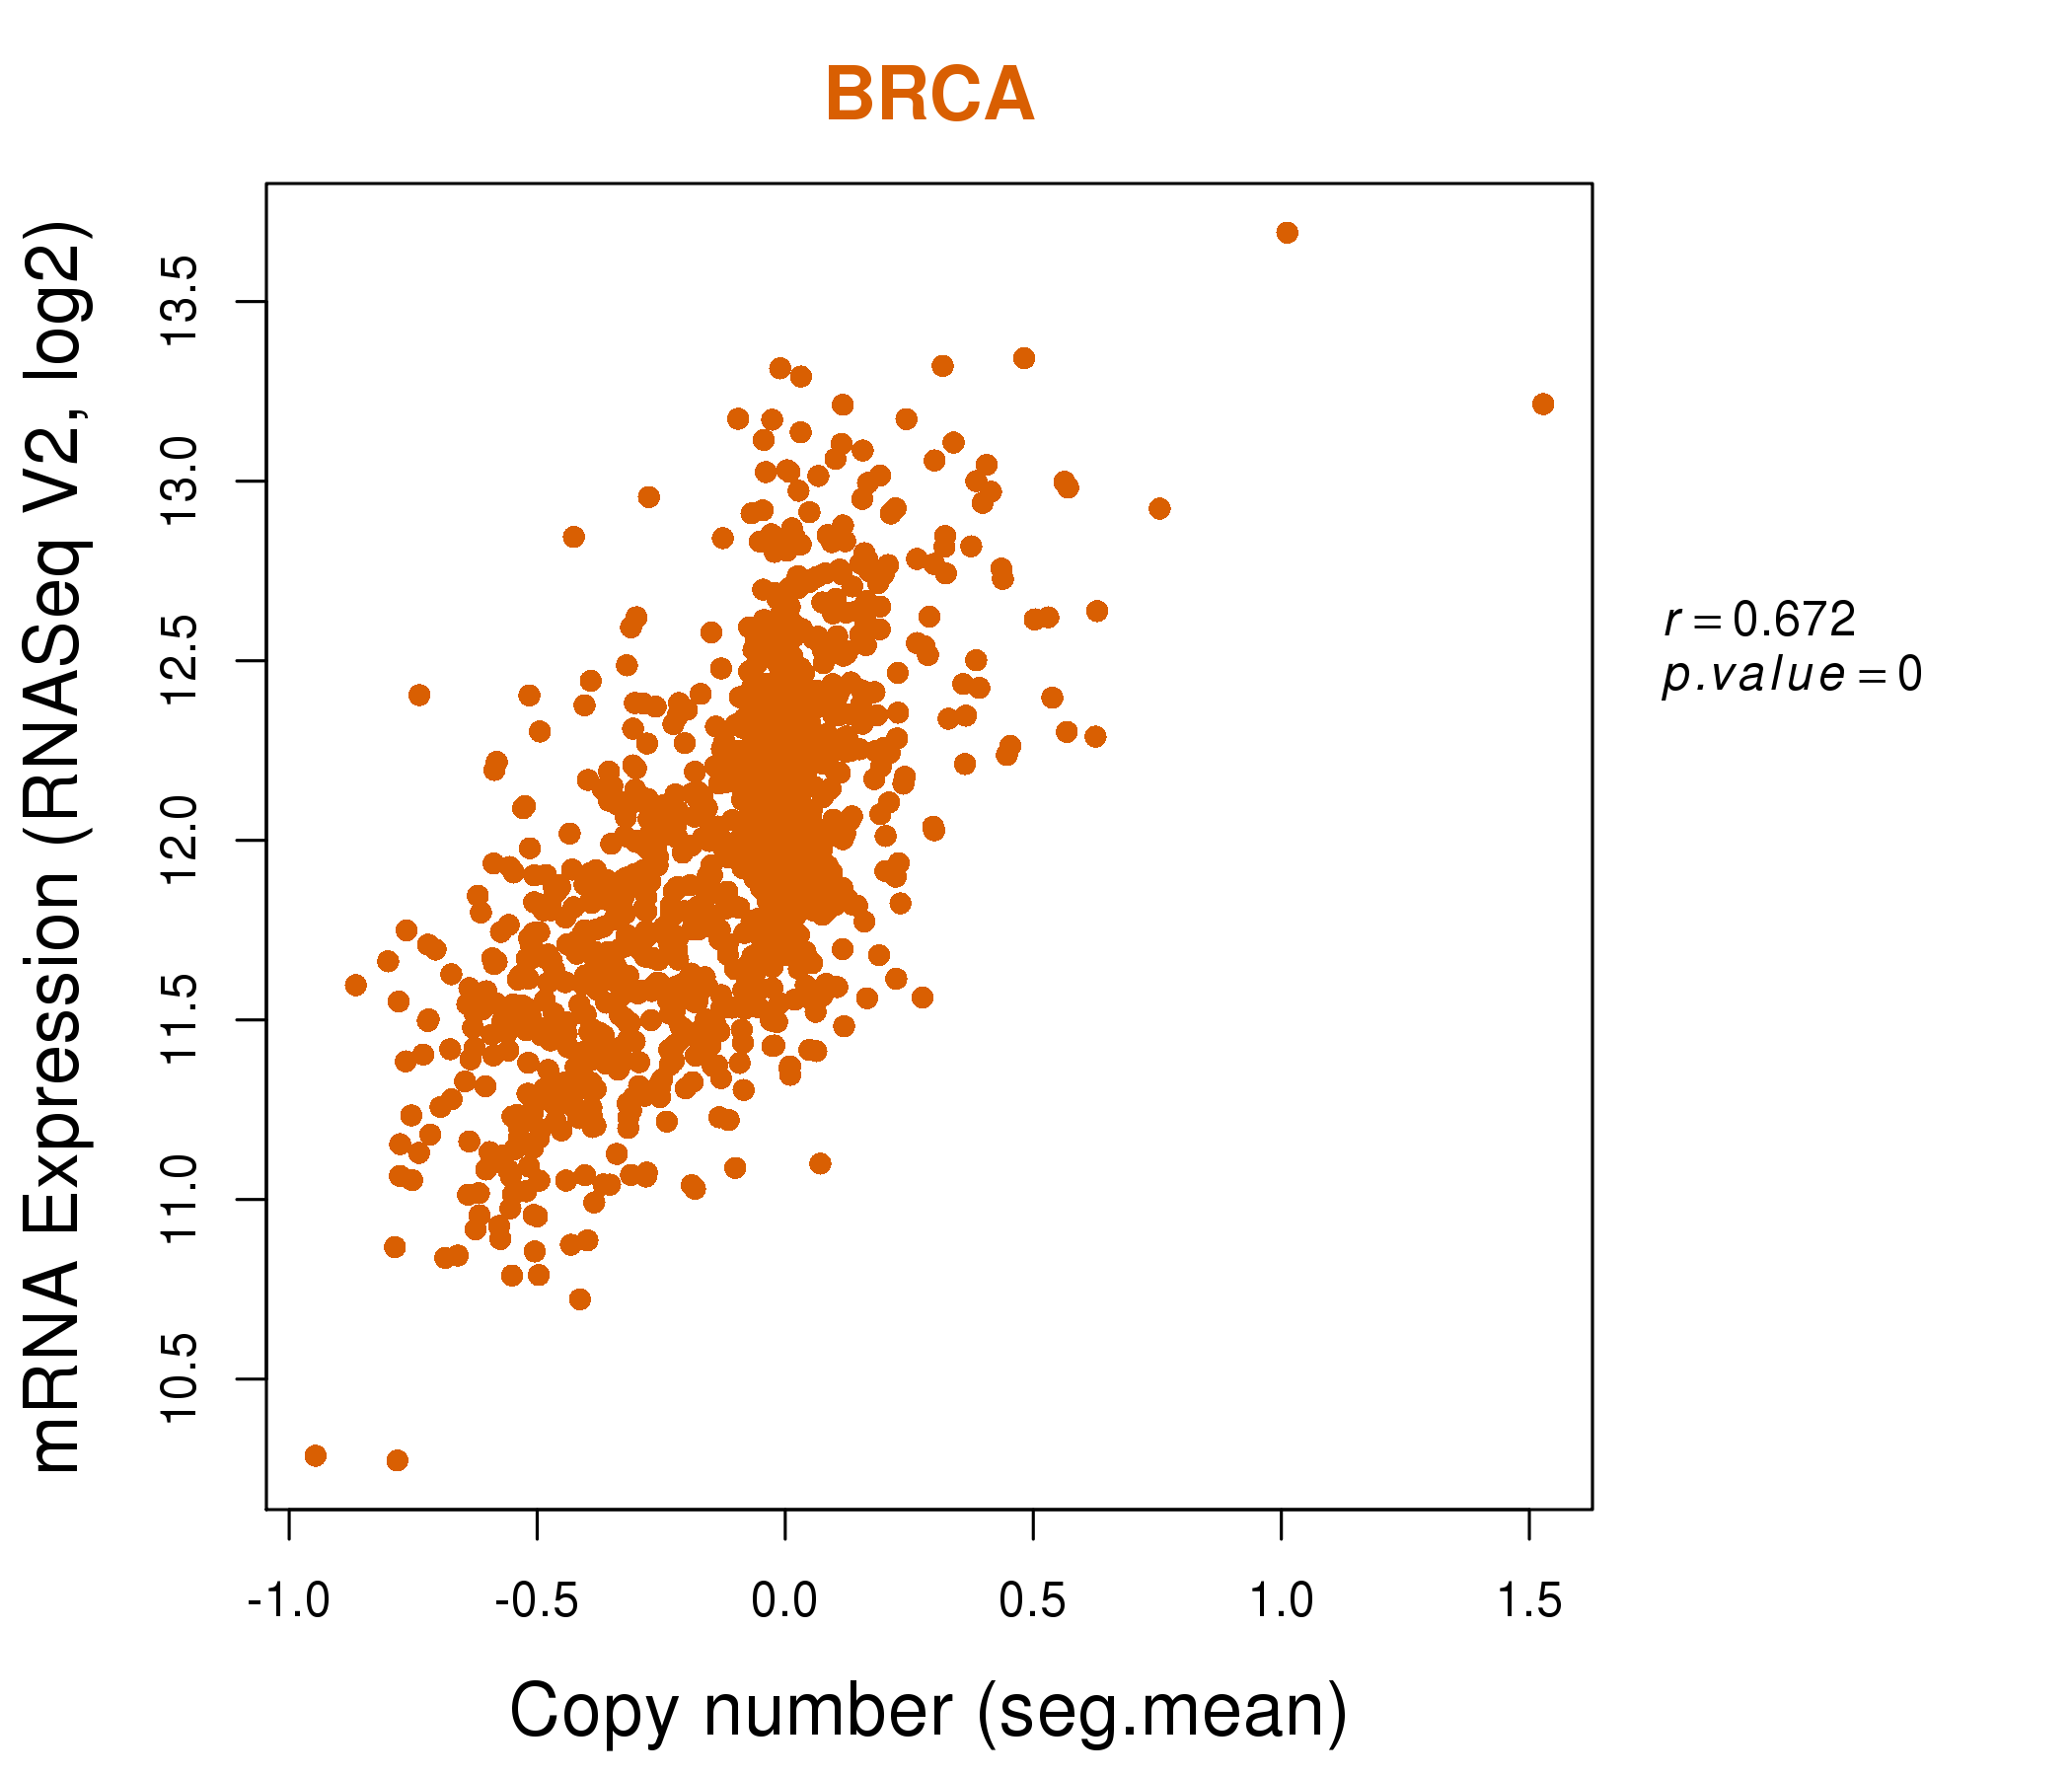
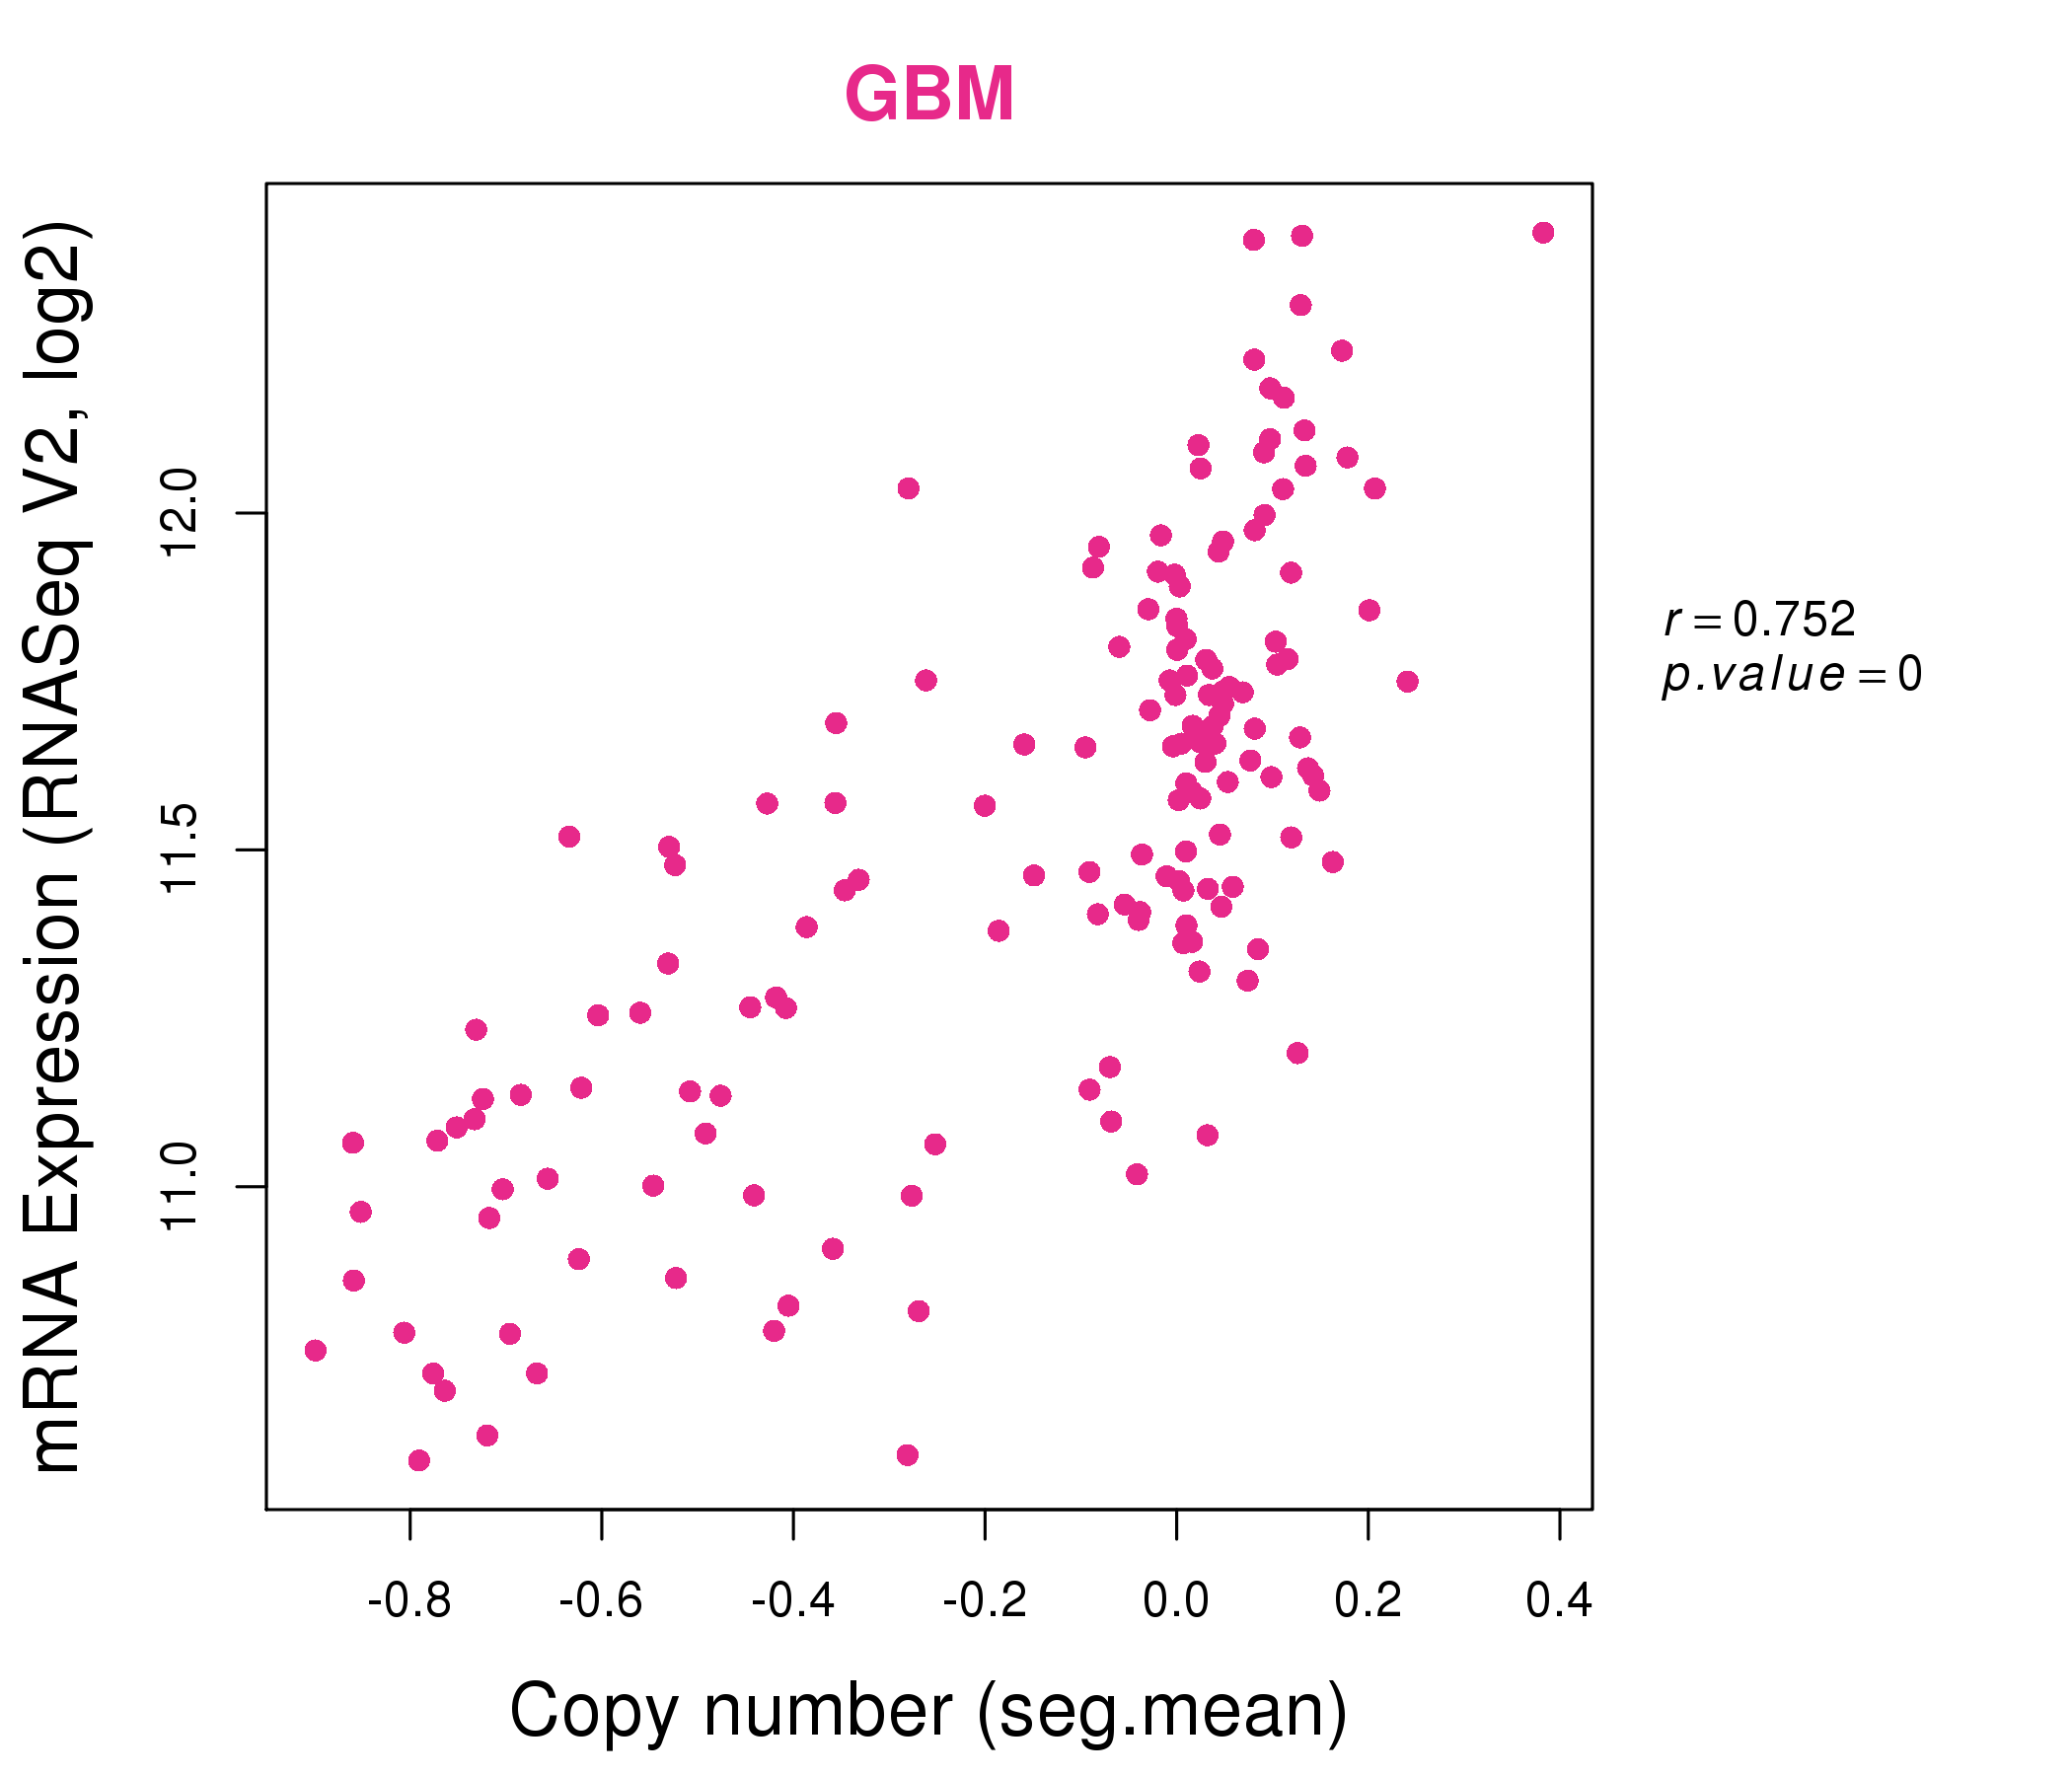
| * Normalized gene expression data of RNASeqV2 was extracted from TCGA using R package TCGA-Assembler. The URLs of all public data files on TCGA DCC data server were gathered at Jan-05-2015. Only eight cancer types have enough normal control samples for differential expression analysis. (t test, adjusted p<0.05 (using Benjamini-Hochberg FDR)) |
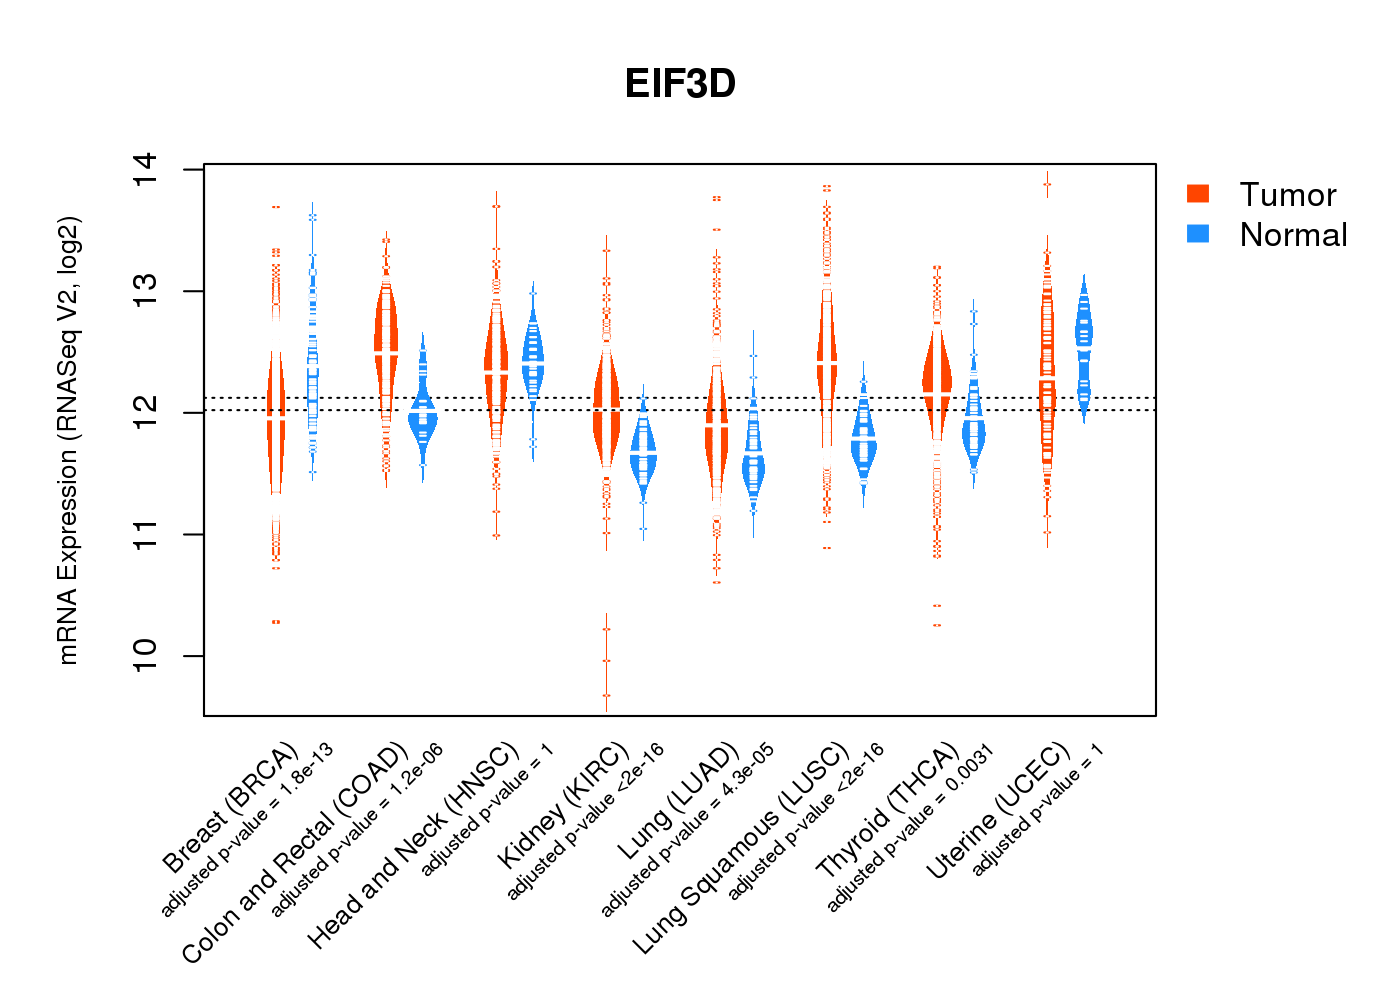 |
| Top |
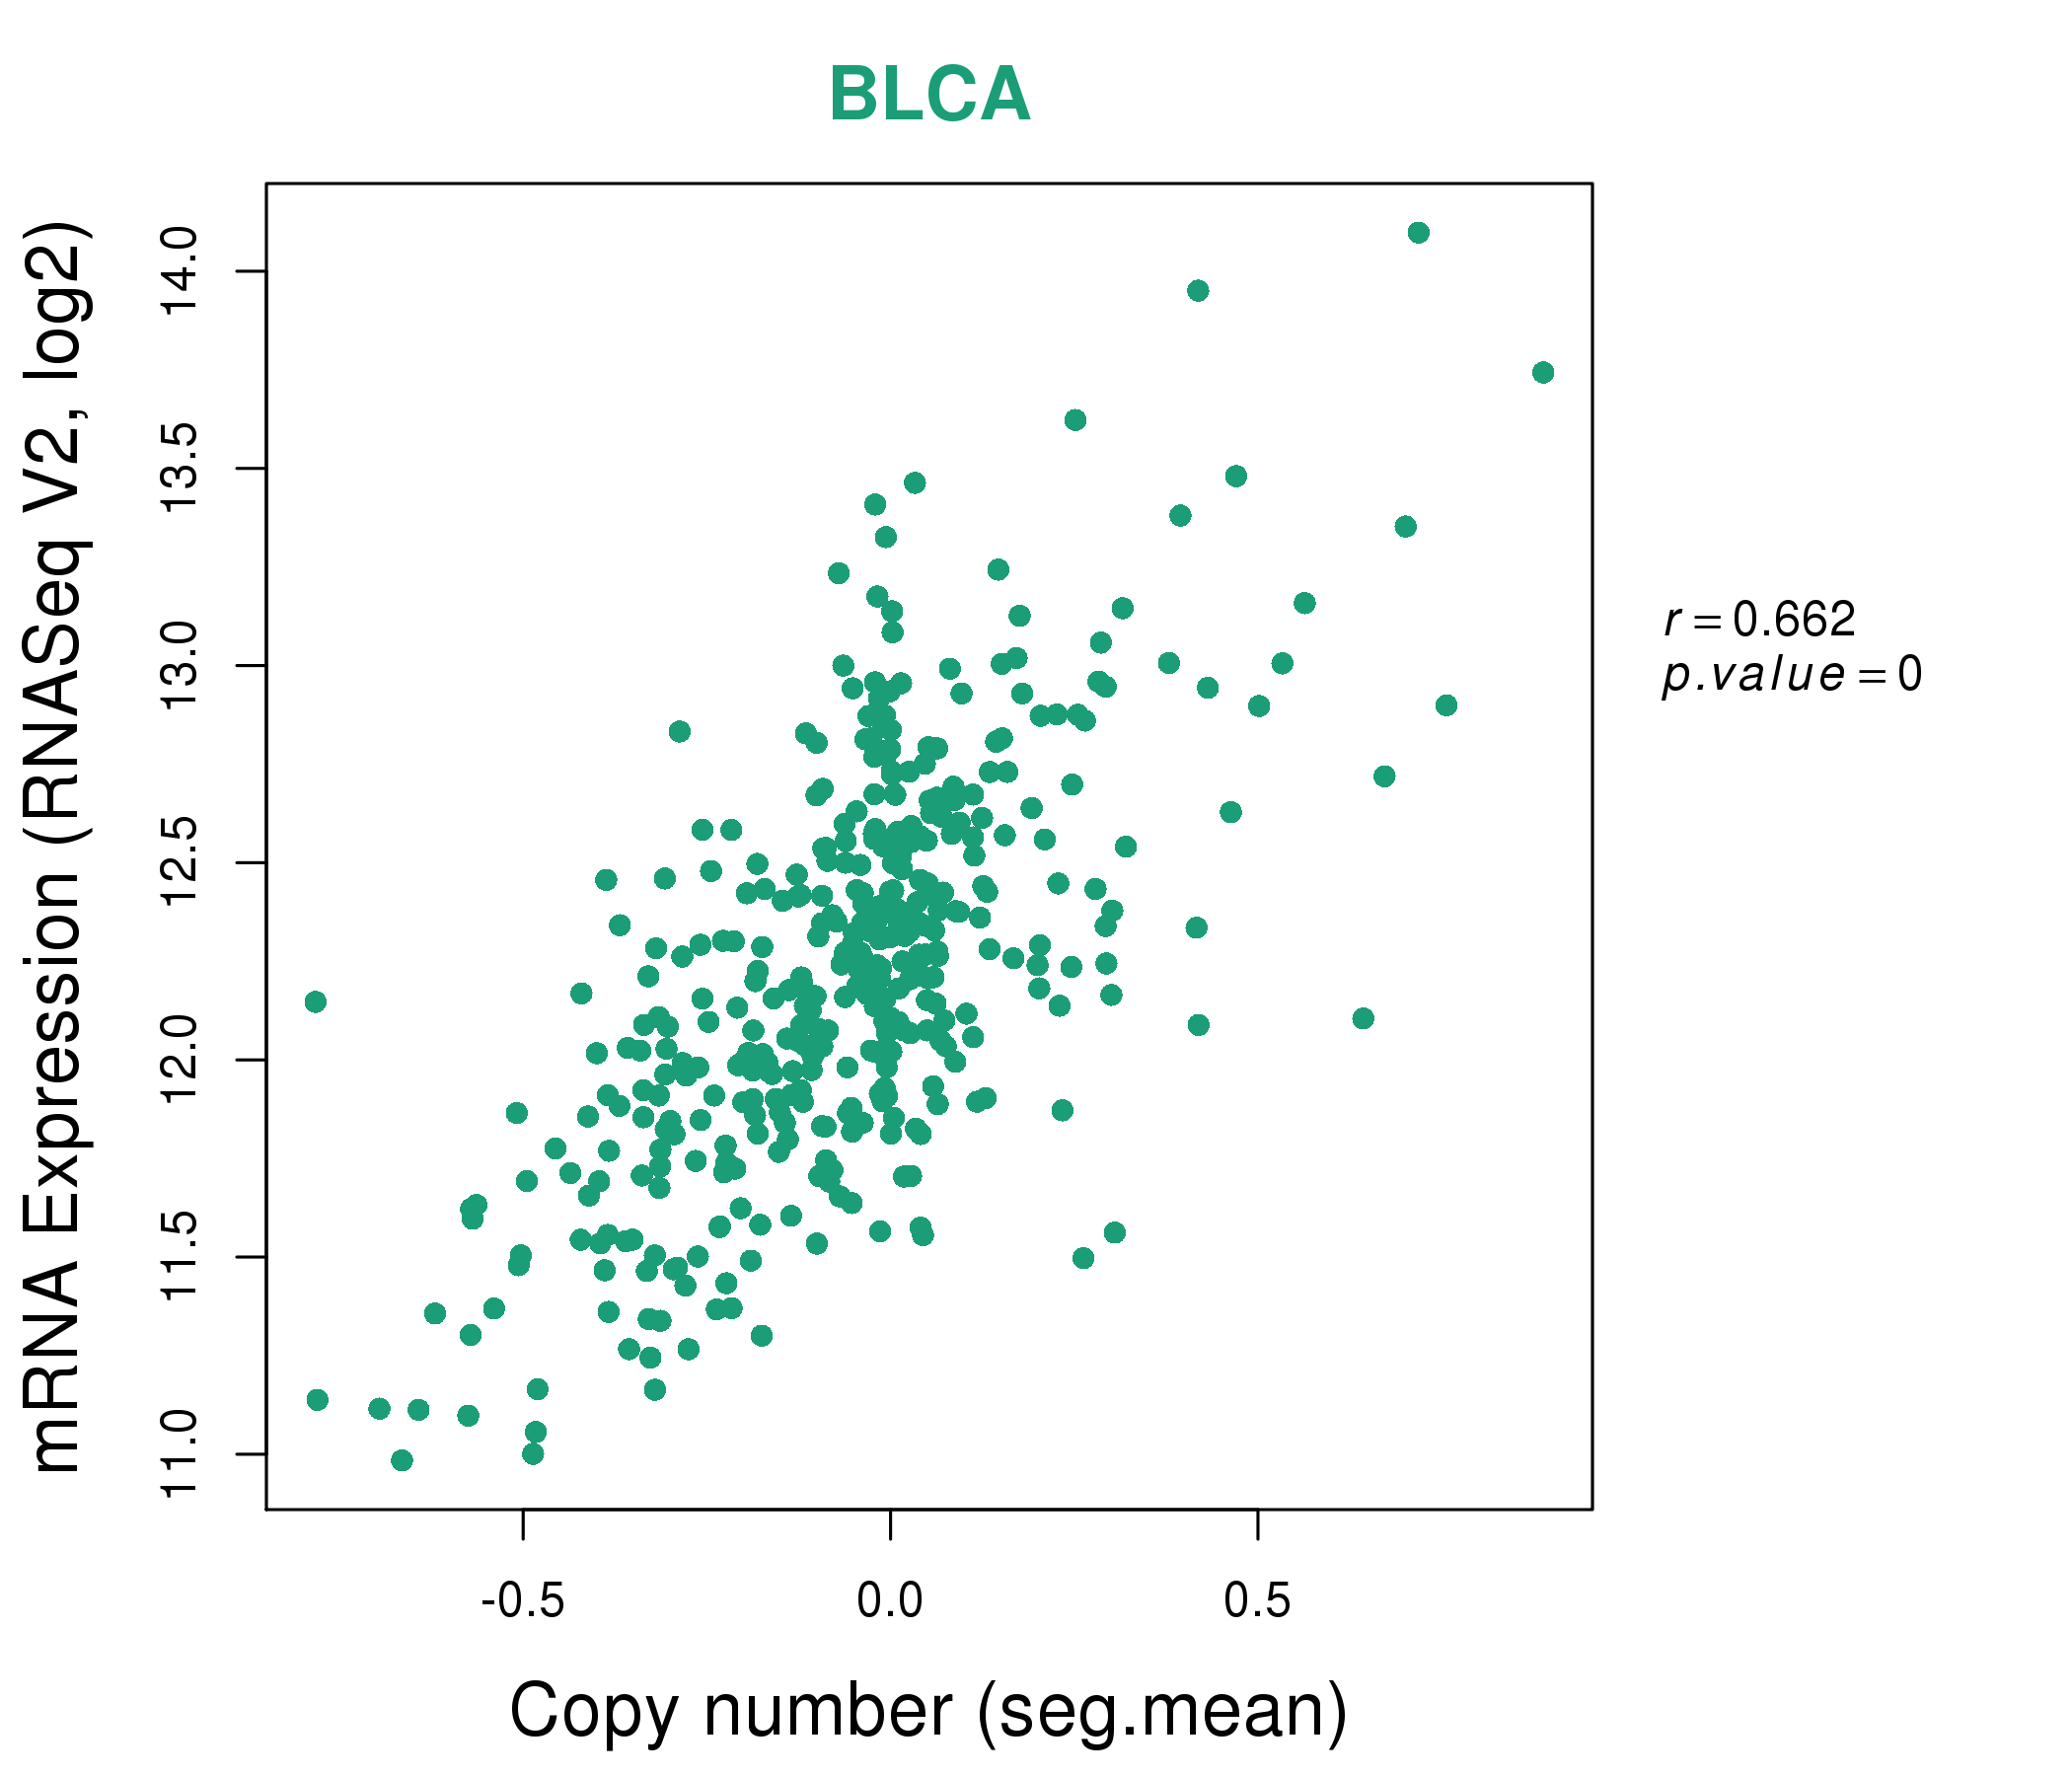
| * This plots show the correlation between CNV and gene expression. |
: Open all plots for all cancer types
 |
|
 |
|
| Top |
| Gene-Gene Network Information |
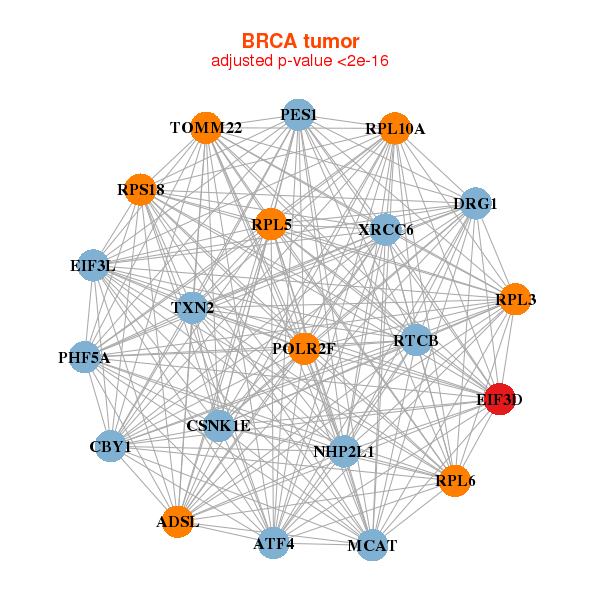
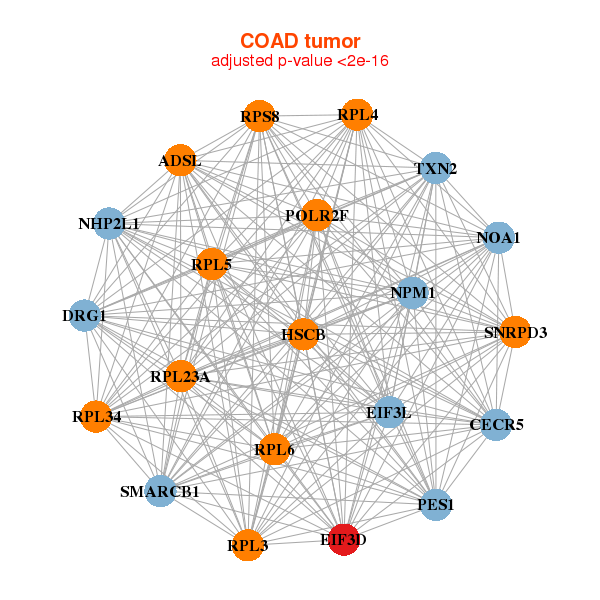
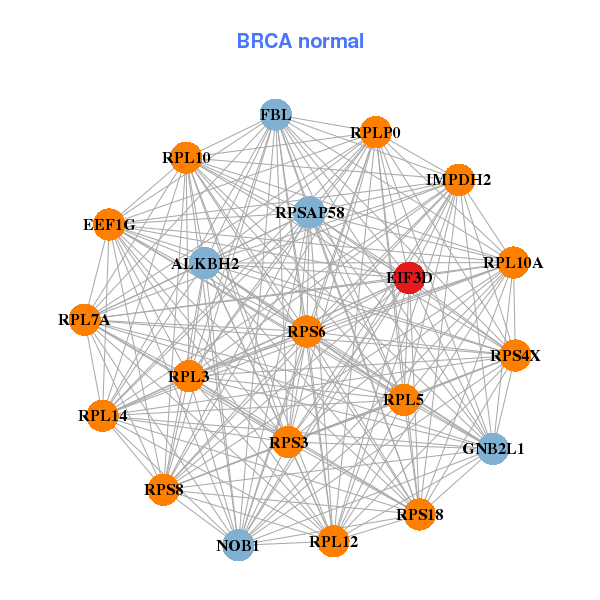
| * Co-Expression network figures were drawn using R package igraph. Only the top 20 genes with the highest correlations were shown. Red circle: input gene, orange circle: cell metabolism gene, sky circle: other gene |
: Open all plots for all cancer types
 |
|
| ADSL,ATF4,RTCB,CBY1,CSNK1E,DRG1,EIF3D, EIF3L,MCAT,NHP2L1,PES1,PHF5A,POLR2F,RPL10A, RPL3,RPL5,RPL6,RPS18,TOMM22,TXN2,XRCC6 | ALKBH2,EEF1G,EIF3D,FBL,GNB2L1,IMPDH2,NOB1, RPL10,RPL10A,RPL12,RPL14,RPL3,RPL5,RPL7A, RPLP0,RPS18,RPS3,RPS4X,RPS6,RPS8,RPSAP58 |
 |
|
| ADSL,NOA1,CECR5,DRG1,EIF3D,EIF3L,HSCB, NHP2L1,NPM1,PES1,POLR2F,RPL23A,RPL34,RPL3, RPL4,RPL5,RPL6,RPS8,SMARCB1,SNRPD3,TXN2 | NOA1,C6orf48,EEF1G,EIF3D,EIF3F,EIF3H,EIF3L, GLTSCR2,GNB2L1,NLE1,NOB1,QARS,RPL13,RPL18, RPL3,RPS15,RPS2,SLC25A6,THG1L,TMEM101,TSEN34 |
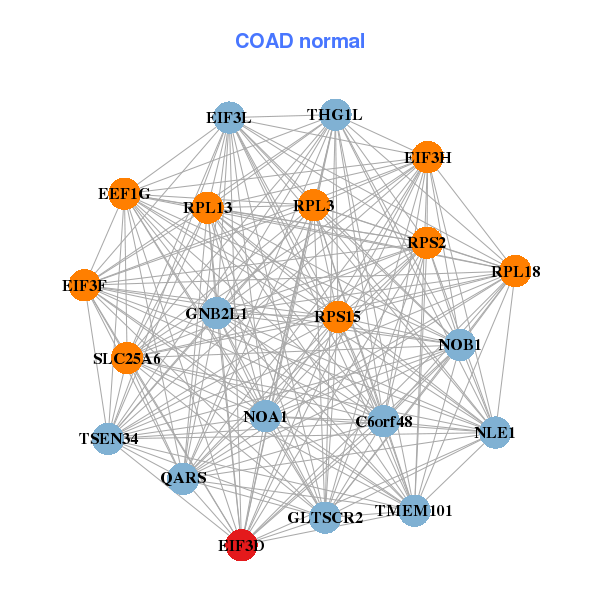
| * Co-Expression network figures were drawn using R package igraph. Only the top 20 genes with the highest correlations were shown. Red circle: input gene, orange circle: cell metabolism gene, sky circle: other gene |
: Open all plots for all cancer types
| Top |
: Open all interacting genes' information including KEGG pathway for all interacting genes from DAVID
| Top |
| Pharmacological Information for EIF3D |
| There's no related Drug. |
| Top |
| Cross referenced IDs for EIF3D |
| * We obtained these cross-references from Uniprot database. It covers 150 different DBs, 18 categories. http://www.uniprot.org/help/cross_references_section |
: Open all cross reference information
|
Copyright © 2016-Present - The Univsersity of Texas Health Science Center at Houston @ |