|
||||||||||||||||||||
| |
| Phenotypic Information (metabolism pathway, cancer, disease, phenome) |
| |
| |
| Gene-Gene Network Information: Co-Expression Network, Interacting Genes & KEGG |
| |
|


| Gene Summary for EIF3I |
| Basic gene info. | Gene symbol | EIF3I |
| Gene name | eukaryotic translation initiation factor 3, subunit I | |
| Synonyms | EIF3S2|PRO2242|TRIP-1|TRIP1|eIF3-beta|eIF3-p36 | |
| Cytomap | UCSC genome browser: 1p34.1 | |
| Genomic location | chr1 :32687970-32697205 | |
| Type of gene | protein-coding | |
| RefGenes | NM_003757.2, | |
| Ensembl id | ENSG00000084623 | |
| Description | TGF-beta receptor-interacting protein 1TGFbeta receptor-interacting protein 1eIF-3-betaeIF3 p36eukaryotic translation initiation factor 3 subunit 2eukaryotic translation initiation factor 3 subunit Ieukaryotic translation initiation factor 3, subuni | |
| Modification date | 20141207 | |
| dbXrefs | MIM : 603911 | |
| HGNC : HGNC | ||
| Ensembl : ENSG00000084623 | ||
| HPRD : 04884 | ||
| Vega : OTTHUMG00000007364 | ||
| Protein | UniProt: Q13347 go to UniProt's Cross Reference DB Table | |
| Expression | CleanEX: HS_EIF3I | |
| BioGPS: 8668 | ||
| Gene Expression Atlas: ENSG00000084623 | ||
| The Human Protein Atlas: ENSG00000084623 | ||
| Pathway | NCI Pathway Interaction Database: EIF3I | |
| KEGG: EIF3I | ||
| REACTOME: EIF3I | ||
| ConsensusPathDB | ||
| Pathway Commons: EIF3I | ||
| Metabolism | MetaCyc: EIF3I | |
| HUMANCyc: EIF3I | ||
| Regulation | Ensembl's Regulation: ENSG00000084623 | |
| miRBase: chr1 :32,687,970-32,697,205 | ||
| TargetScan: NM_003757 | ||
| cisRED: ENSG00000084623 | ||
| Context | iHOP: EIF3I | |
| cancer metabolism search in PubMed: EIF3I | ||
| UCL Cancer Institute: EIF3I | ||
| Assigned class in ccmGDB | A - This gene has a literature evidence and it belongs to cancer gene. | |
| References showing role of EIF3I in cancer cell metabolism | 1. Perez RE, Navarro A, Rezaiekhaligh MH, Mabry SM, Ekekezie, II (2011) TRIP-1 regulates TGF-beta1-induced epithelial-mesenchymal transition of human lung epithelial cell line A549. Am J Physiol Lung Cell Mol Physiol 300: L799-807. doi: 10.1152/ajplung.00350.2010. go to article 2. Ahlemann M, Zeidler R, Lang S, Mack B, Munz M, et al. (2006) Carcinoma-associated eIF3i overexpression facilitates mTOR-dependent growth transformation. Mol Carcinog 45: 957-967. doi: 10.1002/mc.20269. go to article 3. Yuan Y, Zhang Y, Yao S, Shi H, Huang X, et al. (2014) The translation initiation factor eIF3i up-regulates vascular endothelial growth factor A, accelerates cell proliferation, and promotes angiogenesis in embryonic development and tumorigenesis. J Biol Chem 289: 28310-28323. doi: 10.1074/jbc.M114.571356. pmid: 4192485. go to article 4. Qi J, Dong Z, Liu J, Zhang JT (2014) EIF3i promotes colon oncogenesis by regulating COX-2 protein synthesis and beta-catenin activation. Oncogene 33: 4156-4163. doi: 10.1038/onc.2013.397. pmid: 3962800. go to article | |
| Top |
| Phenotypic Information for EIF3I(metabolism pathway, cancer, disease, phenome) |
| Cancer | CGAP: EIF3I |
| Familial Cancer Database: EIF3I | |
| * This gene is included in those cancer gene databases. |
|
|
|
|
|
| . | ||||||||||||||
Oncogene 1 | Significant driver gene in | |||||||||||||||||||
| cf) number; DB name 1 Oncogene; http://nar.oxfordjournals.org/content/35/suppl_1/D721.long, 2 Tumor Suppressor gene; https://bioinfo.uth.edu/TSGene/, 3 Cancer Gene Census; http://www.nature.com/nrc/journal/v4/n3/abs/nrc1299.html, 4 CancerGenes; http://nar.oxfordjournals.org/content/35/suppl_1/D721.long, 5 Network of Cancer Gene; http://ncg.kcl.ac.uk/index.php, 1Therapeutic Vulnerabilities in Cancer; http://cbio.mskcc.org/cancergenomics/statius/ |
| REACTOME_METABOLISM_OF_PROTEINS | |
| OMIM | 603911; gene. |
| Orphanet | |
| Disease | KEGG Disease: EIF3I |
| MedGen: EIF3I (Human Medical Genetics with Condition) | |
| ClinVar: EIF3I | |
| Phenotype | MGI: EIF3I (International Mouse Phenotyping Consortium) |
| PhenomicDB: EIF3I | |
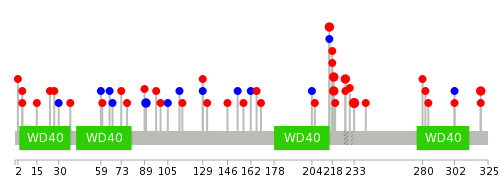
| Mutations for EIF3I |
| * Under tables are showing count per each tissue to give us broad intuition about tissue specific mutation patterns.You can go to the detailed page for each mutation database's web site. |
| There's no structural variation information in COSMIC data for this gene. |
| * From mRNA Sanger sequences, Chitars2.0 arranged chimeric transcripts. This table shows EIF3I related fusion information. |
| ID | Head Gene | Tail Gene | Accession | Gene_a | qStart_a | qEnd_a | Chromosome_a | tStart_a | tEnd_a | Gene_a | qStart_a | qEnd_a | Chromosome_a | tStart_a | tEnd_a |
| BG566325 | EIF3I | 2 | 631 | 1 | 32688014 | 32694172 | ST5 | 627 | 674 | 11 | 8813443 | 8813490 | |
| AA032022 | LRRC47 | 2 | 412 | 1 | 3697481 | 3697891 | EIF3I | 405 | 494 | 1 | 32697002 | 32697091 | |
| AI682532 | EIF3I | 27 | 137 | 1 | 32697093 | 32697203 | HDAC1 | 123 | 216 | 1 | 32786061 | 32786517 | |
| AU123912 | SNRPA | 9 | 218 | 19 | 41263236 | 41265371 | EIF3I | 218 | 772 | 1 | 32688010 | 32692123 | |
| BC015407 | MTMR9LP | 1 | 925 | 1 | 32697345 | 32705863 | EIF3I | 924 | 1781 | 1 | 32694098 | 32697203 | |
| Top |
| There's no copy number variation information in COSMIC data for this gene. |
| Top |
|
 |
| Top |
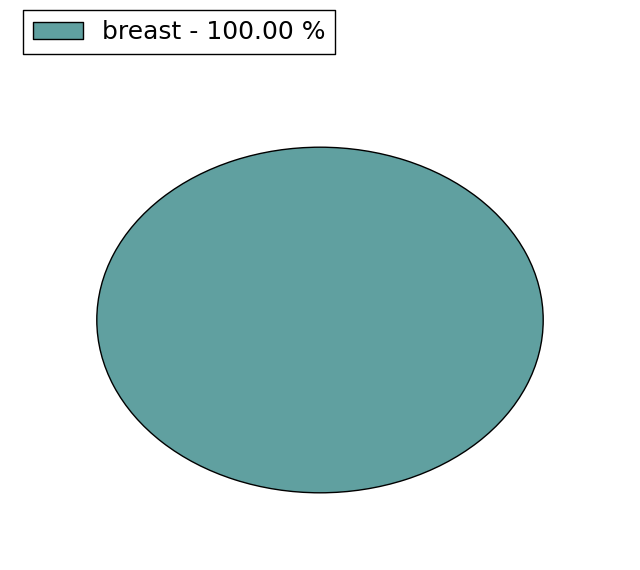
| Stat. for Non-Synonymous SNVs (# total SNVs=32) | (# total SNVs=11) |
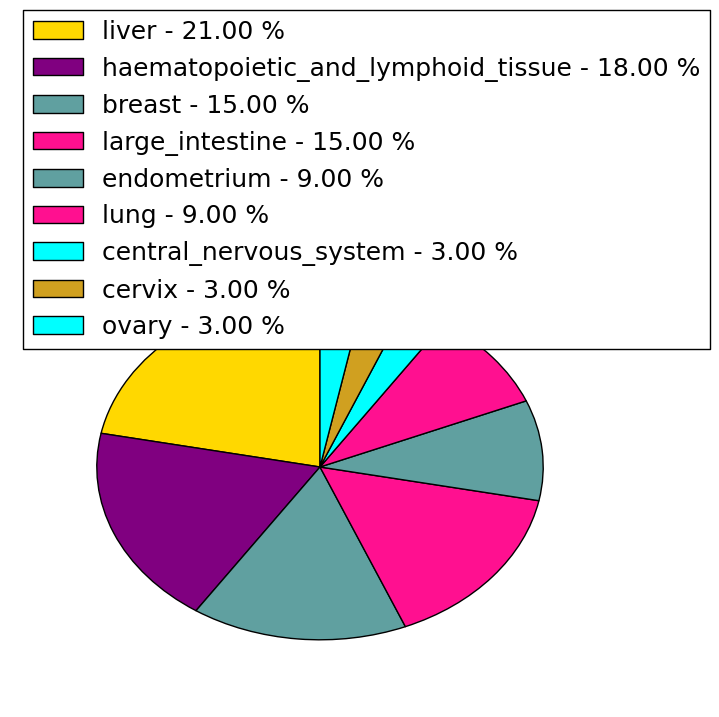 | 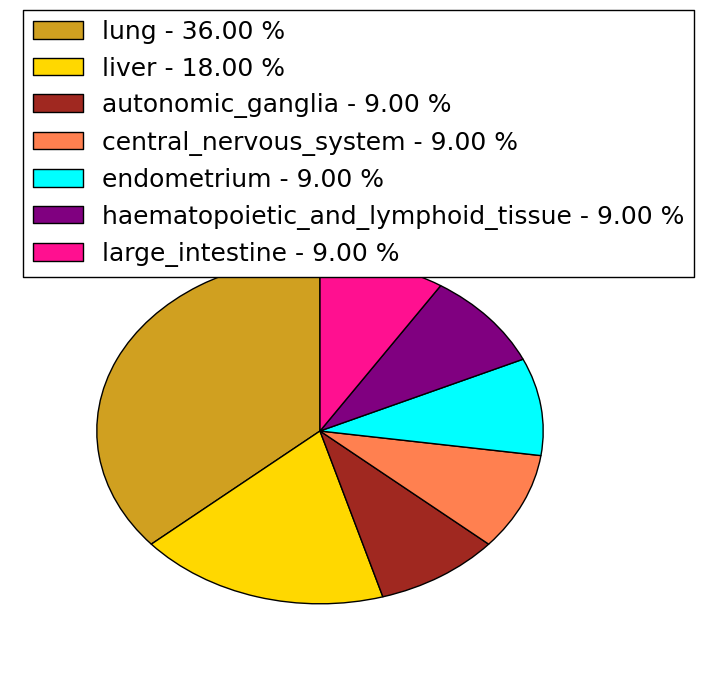 |
(# total SNVs=1) | (# total SNVs=0) |
 |
| Top |
| * When you move the cursor on each content, you can see more deailed mutation information on the Tooltip. Those are primary_site,primary_histology,mutation(aa),pubmedID. |
| GRCh37 position | Mutation(aa) | Unique sampleID count |
| chr1:32694343-32694343 | p.T219A | 4 |
| chr1:32694386-32694386 | p.N233S | 3 |
| chr1:32696779-32696779 | p.E320D | 2 |
| chr1:32694334-32694334 | p.D216Y | 2 |
| chr1:32691791-32691791 | p.L90L | 2 |
| chr1:32694367-32694367 | p.R227W | 2 |
| chr1:32691906-32691906 | p.D129N | 1 |
| chr1:32696725-32696725 | p.S302S | 1 |
| chr1:32688148-32688148 | p.L5V | 1 |
| chr1:32694326-32694326 | p.? | 1 |
| Top |
|
 |
| Point Mutation/ Tissue ID | 1 | 2 | 3 | 4 | 5 | 6 | 7 | 8 | 9 | 10 | 11 | 12 | 13 | 14 | 15 | 16 | 17 | 18 | 19 | 20 |
| # sample | 3 | 4 | 1 | 6 | 2 | 3 | 1 | 1 | 2 | 6 | 3 | |||||||||
| # mutation | 4 | 4 | 1 | 6 | 2 | 3 | 1 | 1 | 2 | 6 | 3 | |||||||||
| nonsynonymous SNV | 4 | 4 | 1 | 5 | 2 | 2 | 1 | 2 | 5 | 2 | ||||||||||
| synonymous SNV | 1 | 1 | 1 | 1 | 1 |
| cf) Tissue ID; Tissue type (1; BLCA[Bladder Urothelial Carcinoma], 2; BRCA[Breast invasive carcinoma], 3; CESC[Cervical squamous cell carcinoma and endocervical adenocarcinoma], 4; COAD[Colon adenocarcinoma], 5; GBM[Glioblastoma multiforme], 6; Glioma Low Grade, 7; HNSC[Head and Neck squamous cell carcinoma], 8; KICH[Kidney Chromophobe], 9; KIRC[Kidney renal clear cell carcinoma], 10; KIRP[Kidney renal papillary cell carcinoma], 11; LAML[Acute Myeloid Leukemia], 12; LUAD[Lung adenocarcinoma], 13; LUSC[Lung squamous cell carcinoma], 14; OV[Ovarian serous cystadenocarcinoma ], 15; PAAD[Pancreatic adenocarcinoma], 16; PRAD[Prostate adenocarcinoma], 17; SKCM[Skin Cutaneous Melanoma], 18:STAD[Stomach adenocarcinoma], 19:THCA[Thyroid carcinoma], 20:UCEC[Uterine Corpus Endometrial Carcinoma]) |
| Top |
| * We represented just top 10 SNVs. When you move the cursor on each content, you can see more deailed mutation information on the Tooltip. Those are primary_site, primary_histology, mutation(aa), pubmedID. |
| Genomic Position | Mutation(aa) | Unique sampleID count |
| chr1:32694367 | p.R227W | 2 |
| chr1:32694368 | p.L5V | 1 |
| chr1:32688149 | p.E169Q | 1 |
| chr1:32691860 | p.E322K | 1 |
| chr1:32694376 | p.L5P | 1 |
| chr1:32688180 | p.A206V | 1 |
| chr1:32691906 | p.Q15H | 1 |
| chr1:32694410 | p.D216D | 1 |
| chr1:32688215 | p.T27I | 1 |
| chr1:32691917 | p.T218A | 1 |
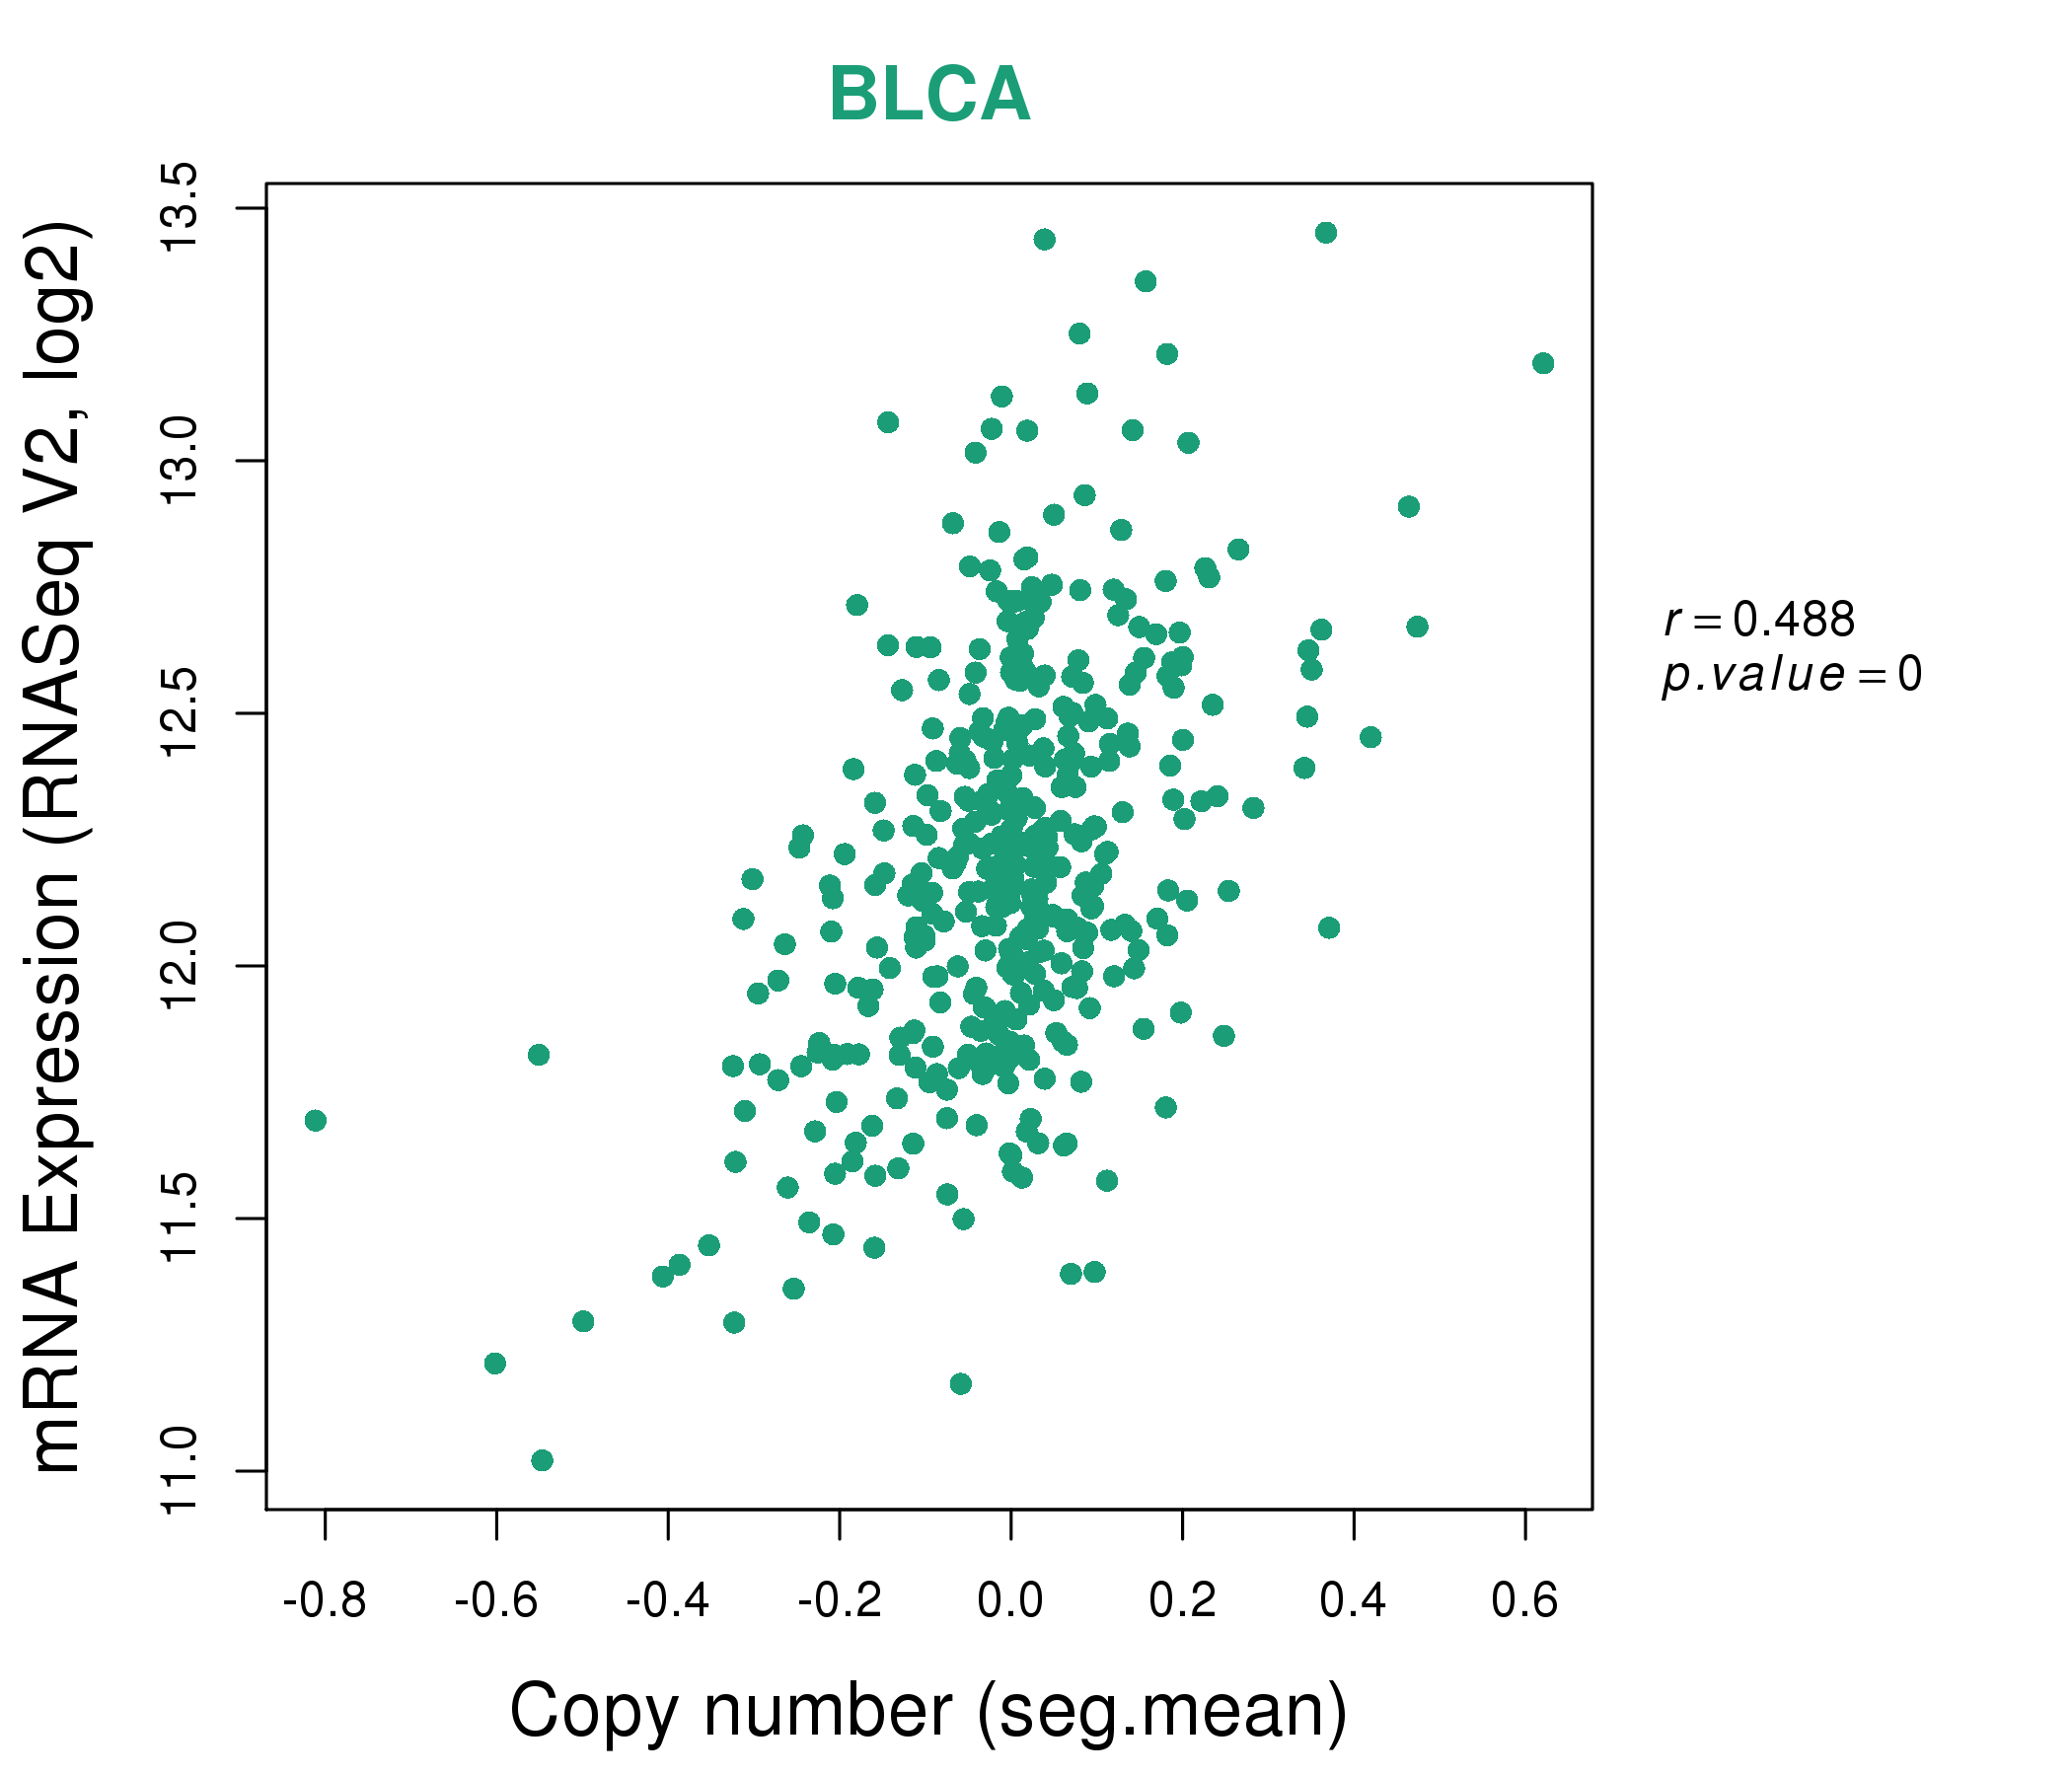
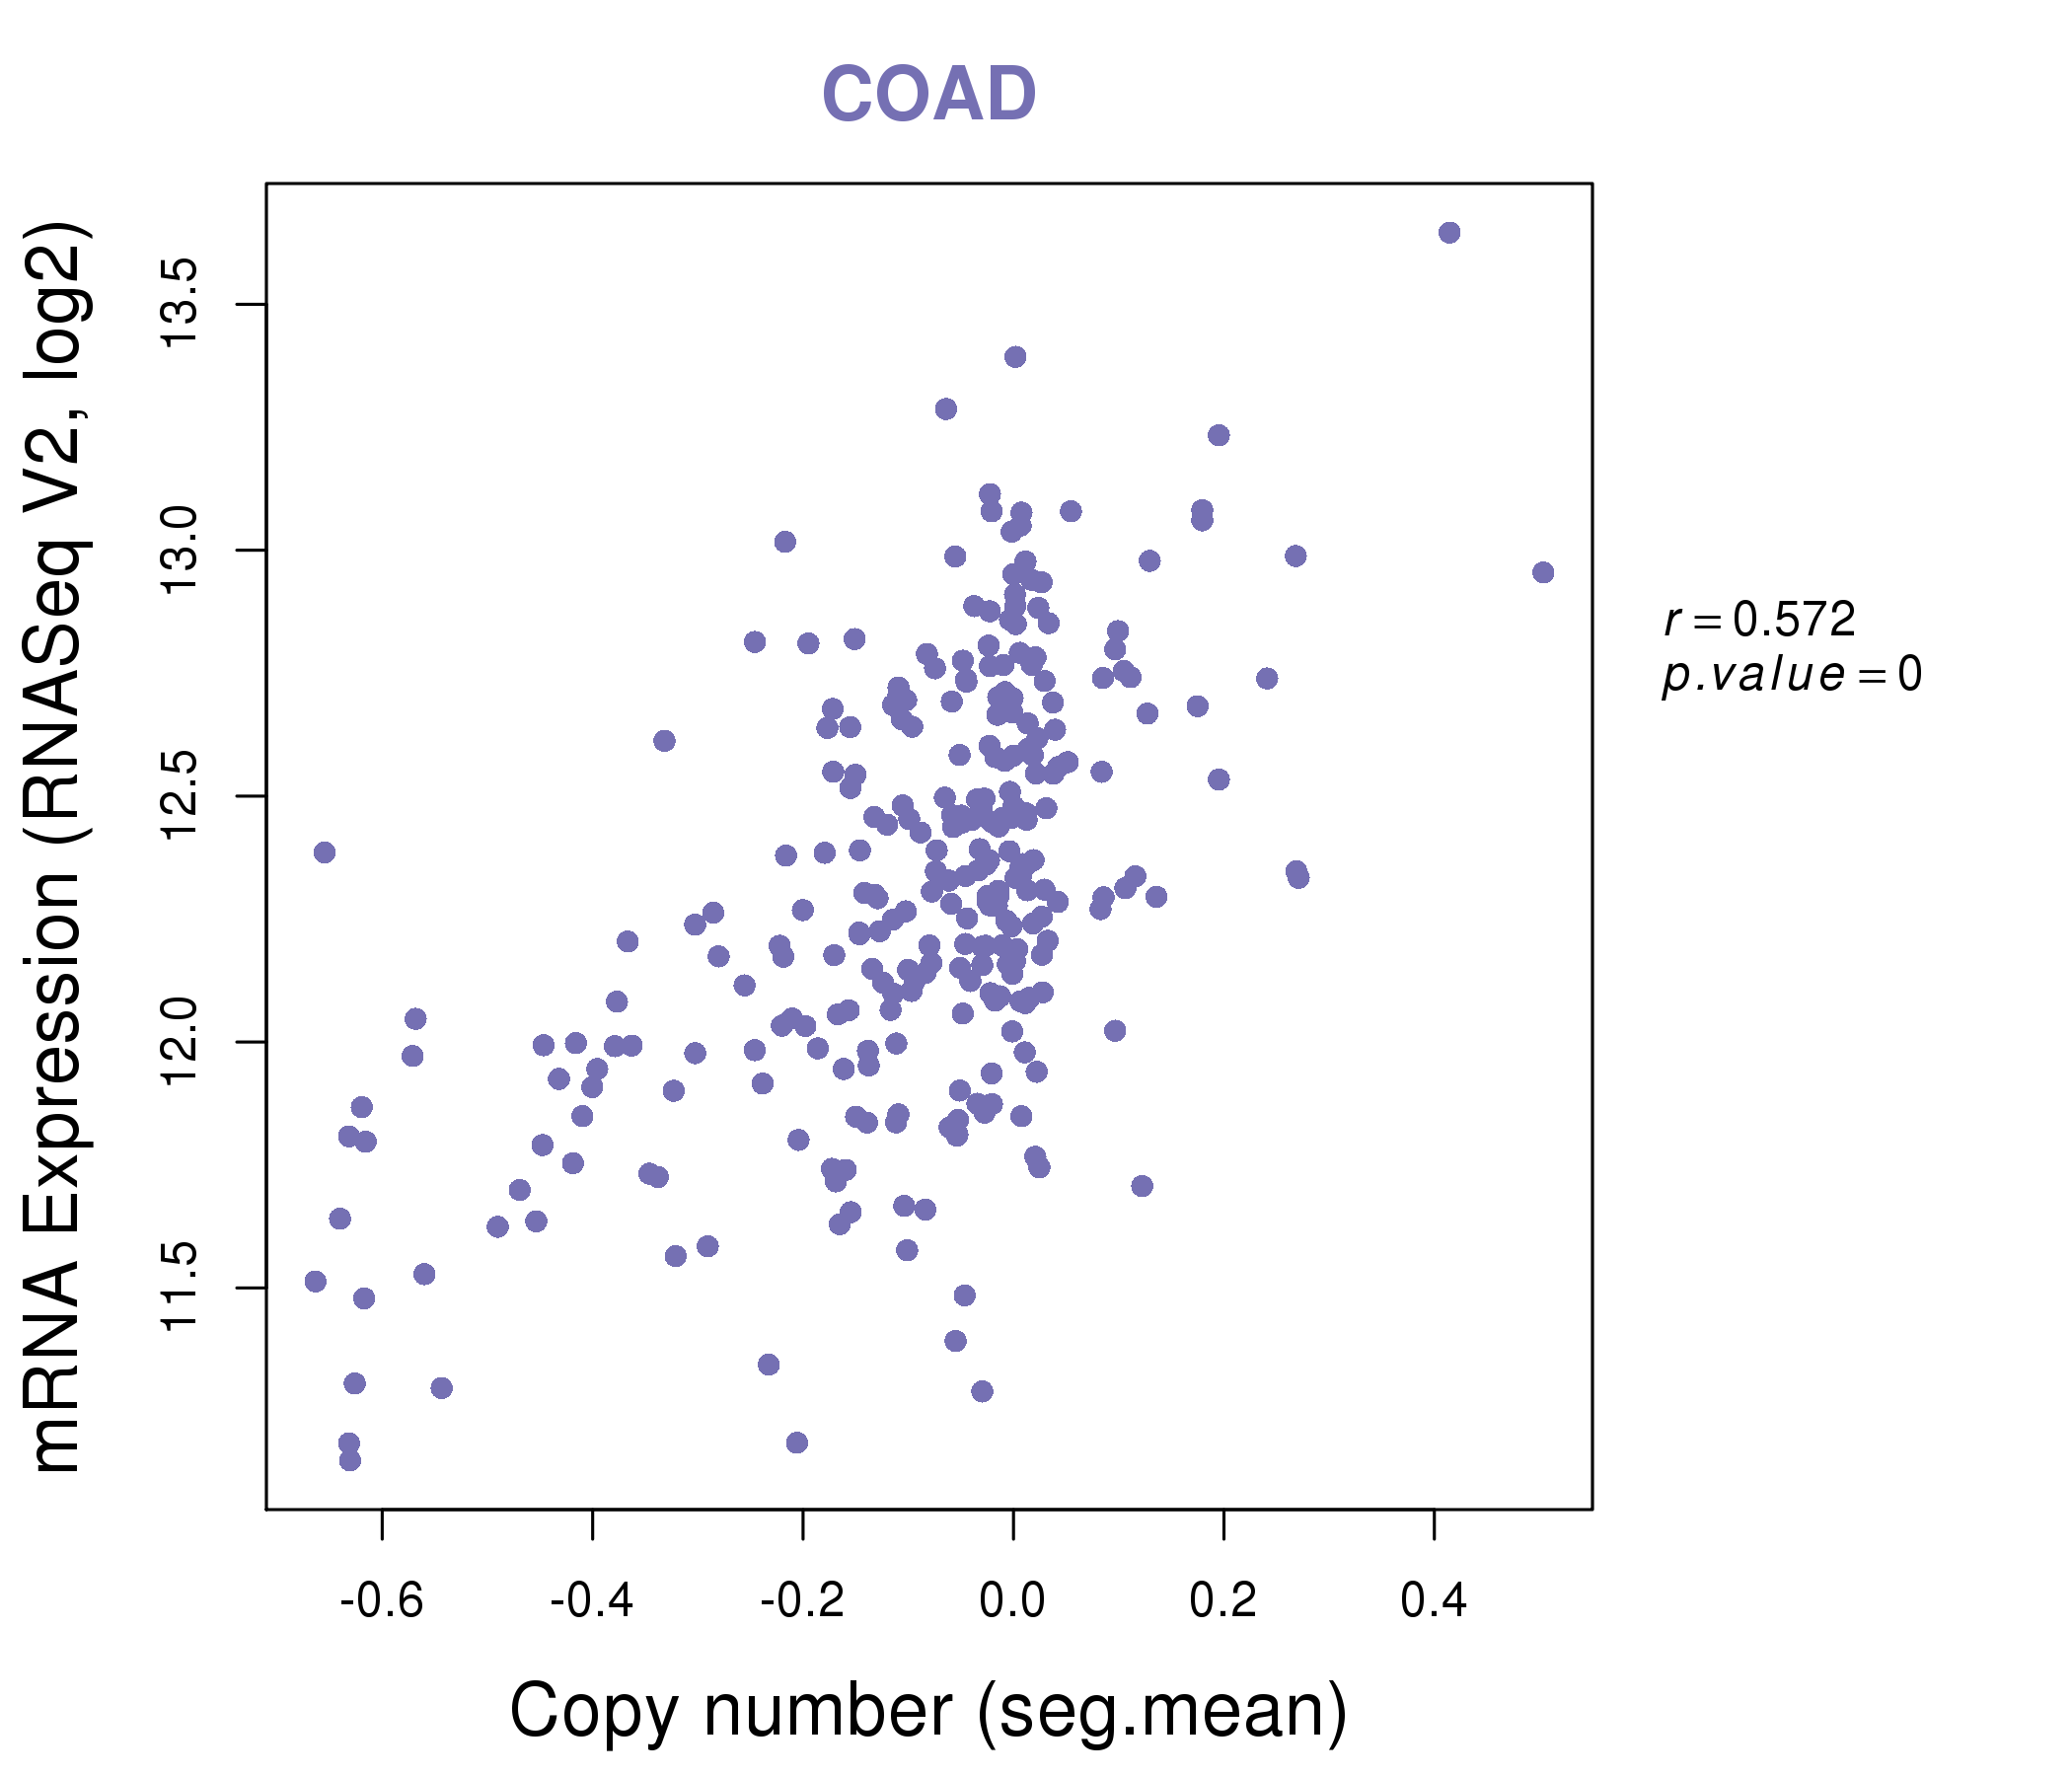
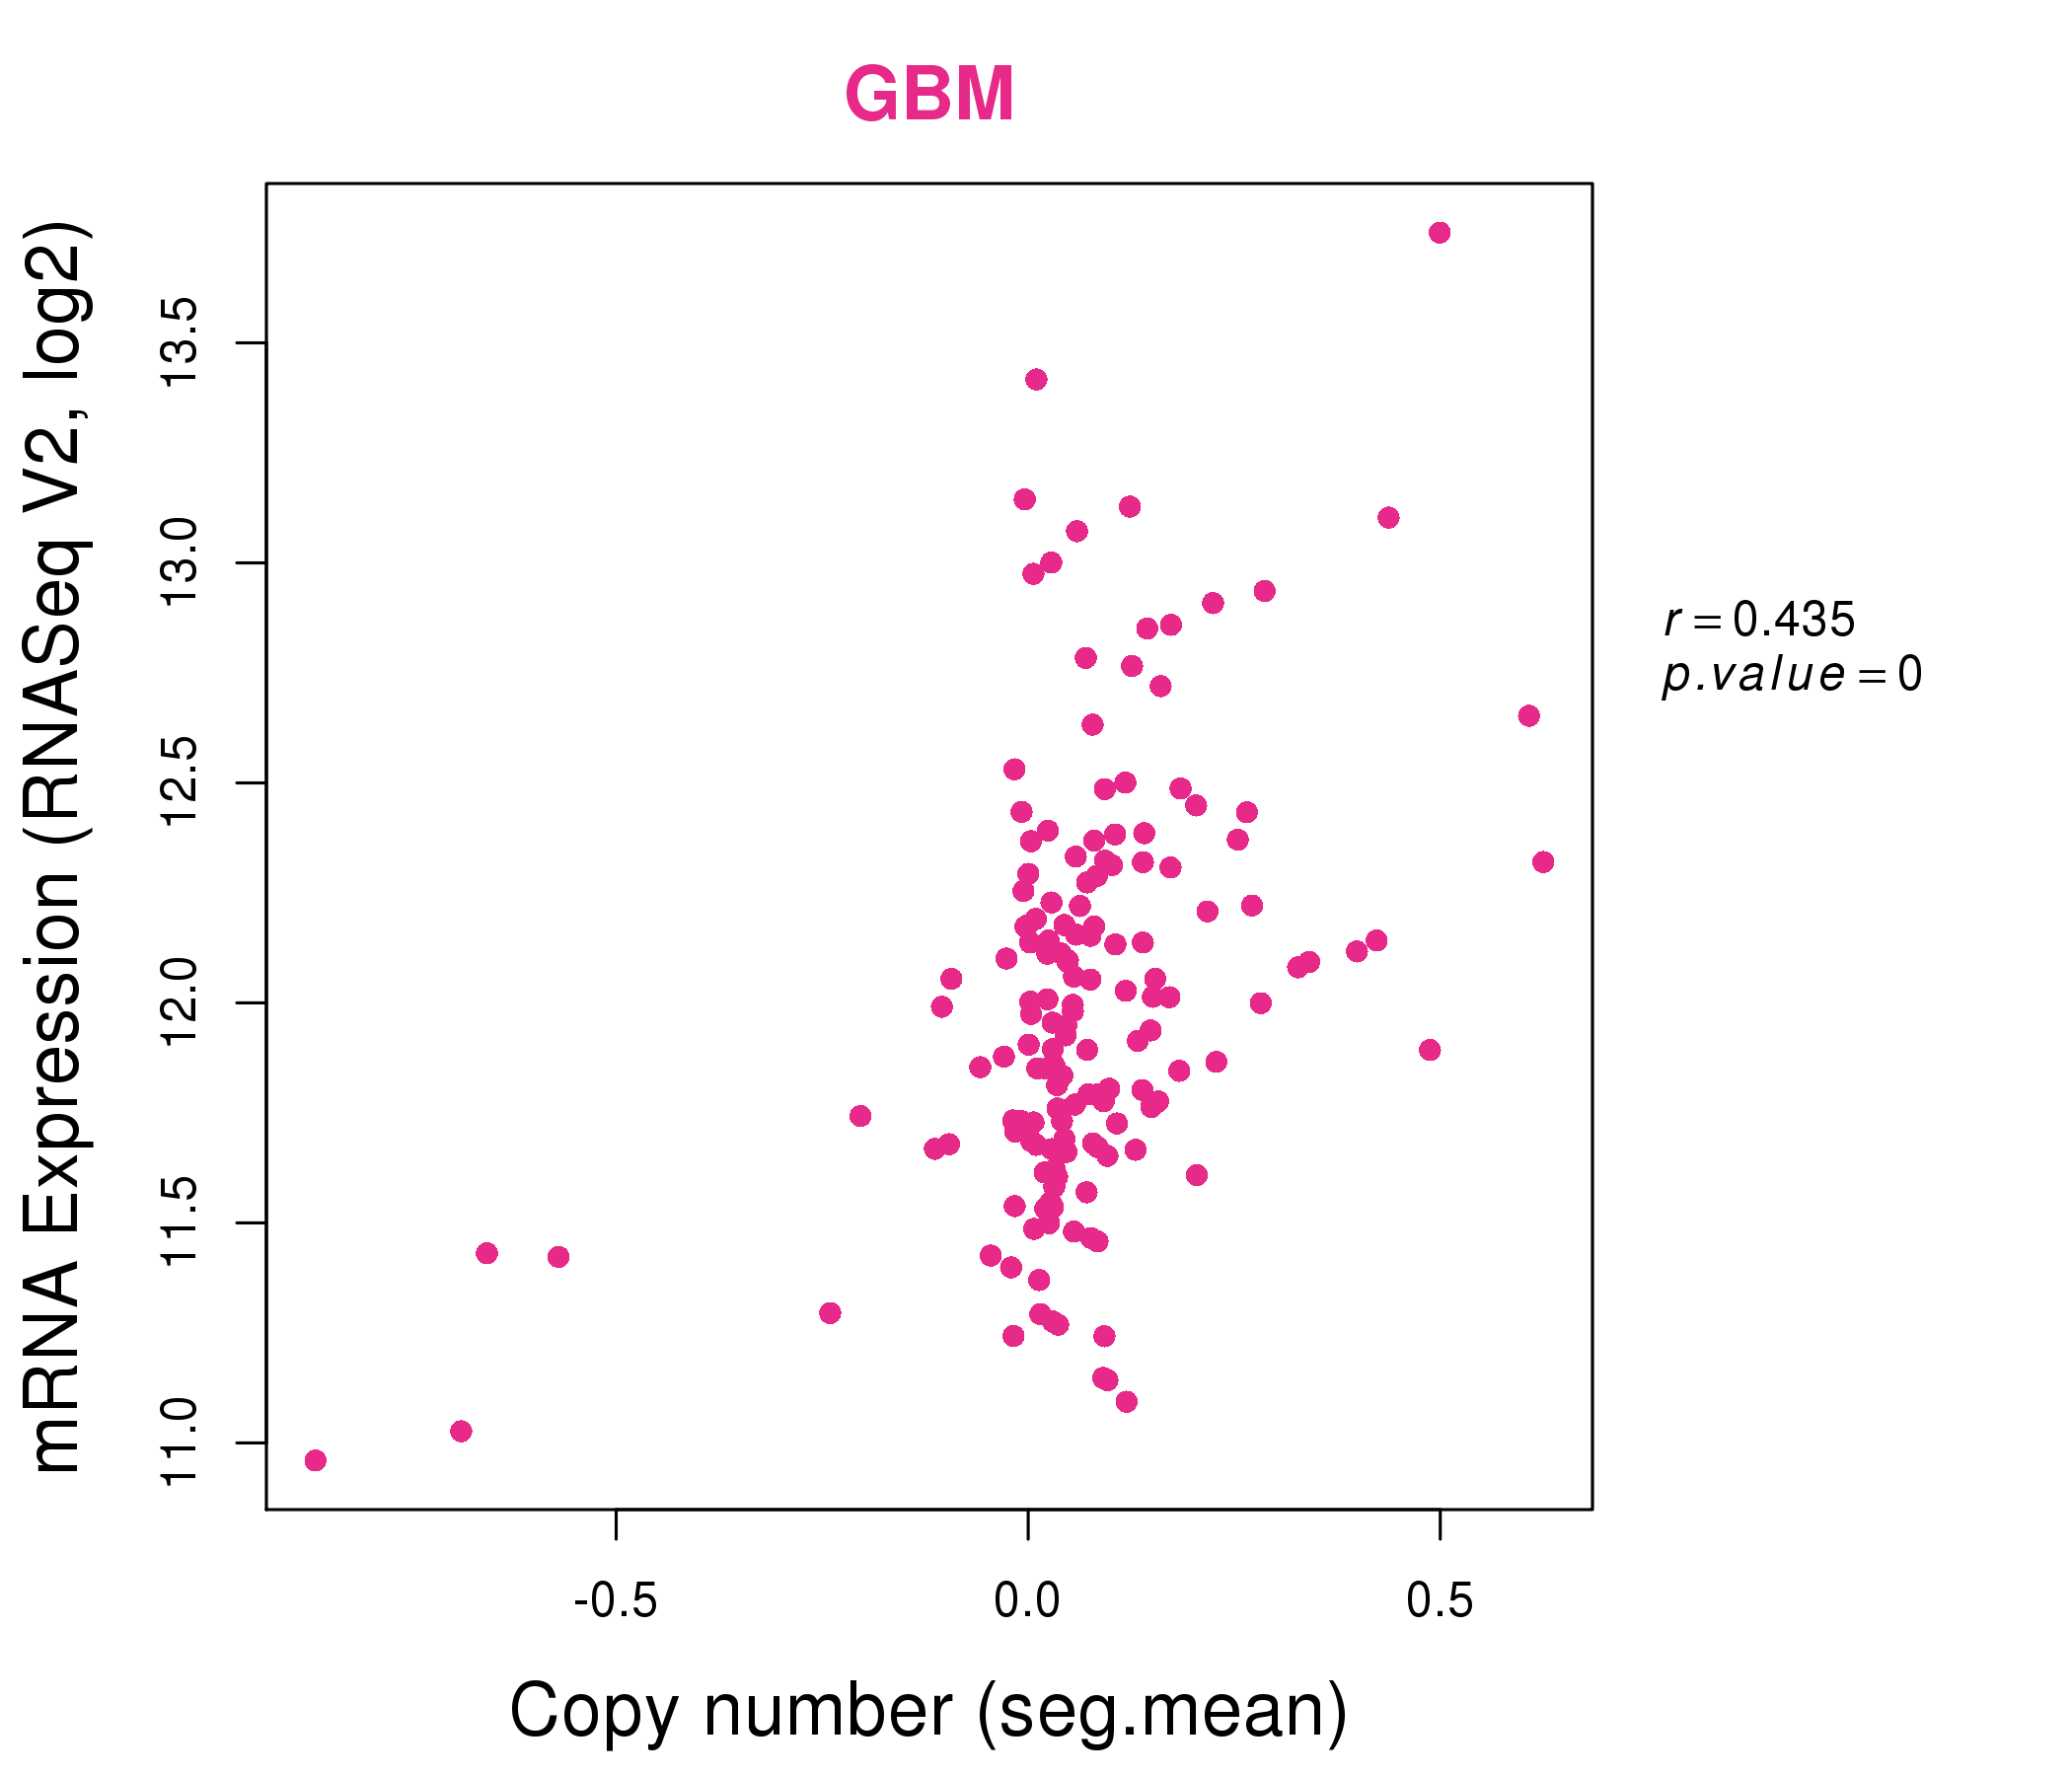
| * Copy number data were extracted from TCGA using R package TCGA-Assembler. The URLs of all public data files on TCGA DCC data server were gathered on Jan-05-2015. Function ProcessCNAData in TCGA-Assembler package was used to obtain gene-level copy number value which is calculated as the average copy number of the genomic region of a gene. |
 |
| cf) Tissue ID[Tissue type]: BLCA[Bladder Urothelial Carcinoma], BRCA[Breast invasive carcinoma], CESC[Cervical squamous cell carcinoma and endocervical adenocarcinoma], COAD[Colon adenocarcinoma], GBM[Glioblastoma multiforme], Glioma Low Grade, HNSC[Head and Neck squamous cell carcinoma], KICH[Kidney Chromophobe], KIRC[Kidney renal clear cell carcinoma], KIRP[Kidney renal papillary cell carcinoma], LAML[Acute Myeloid Leukemia], LUAD[Lung adenocarcinoma], LUSC[Lung squamous cell carcinoma], OV[Ovarian serous cystadenocarcinoma ], PAAD[Pancreatic adenocarcinoma], PRAD[Prostate adenocarcinoma], SKCM[Skin Cutaneous Melanoma], STAD[Stomach adenocarcinoma], THCA[Thyroid carcinoma], UCEC[Uterine Corpus Endometrial Carcinoma] |
| Top |
| Gene Expression for EIF3I |
| * CCLE gene expression data were extracted from CCLE_Expression_Entrez_2012-10-18.res: Gene-centric RMA-normalized mRNA expression data. |
 |
| * Normalized gene expression data of RNASeqV2 was extracted from TCGA using R package TCGA-Assembler. The URLs of all public data files on TCGA DCC data server were gathered at Jan-05-2015. Only eight cancer types have enough normal control samples for differential expression analysis. (t test, adjusted p<0.05 (using Benjamini-Hochberg FDR)) |
 |
| Top |
| * This plots show the correlation between CNV and gene expression. |
: Open all plots for all cancer types
 |
|
 |
|

| Top |
| Gene-Gene Network Information |
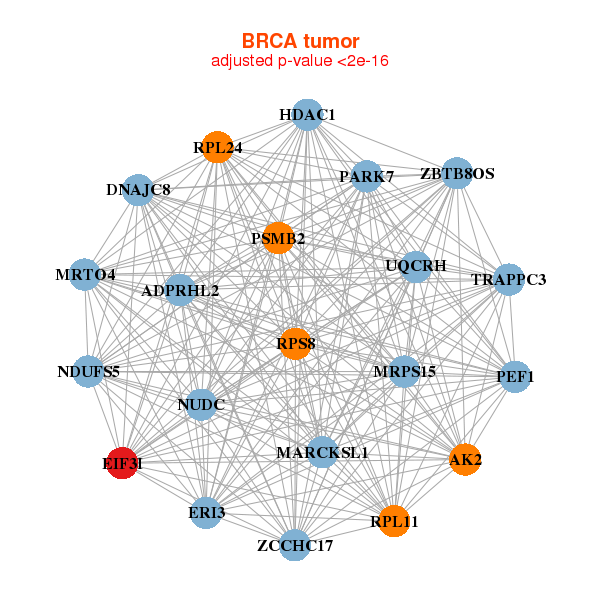
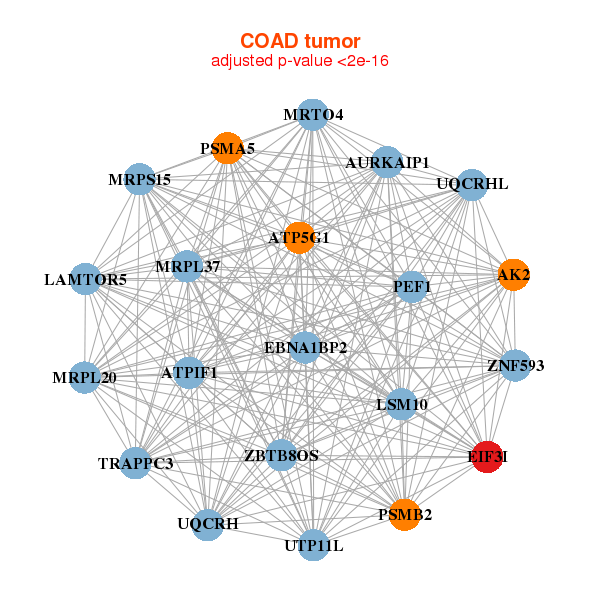
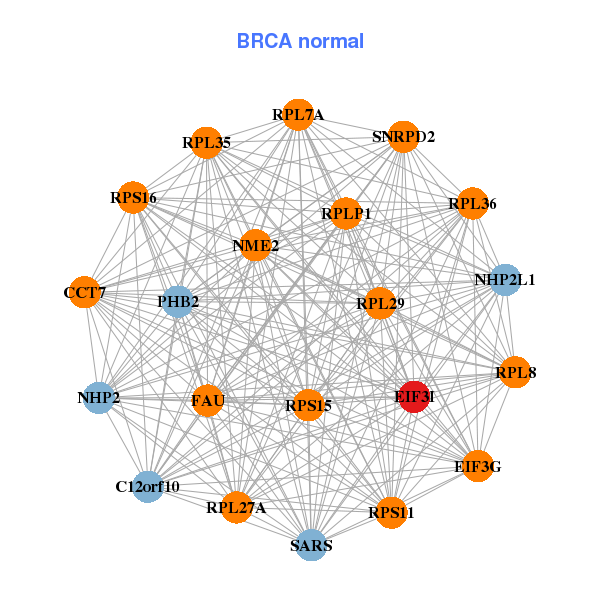
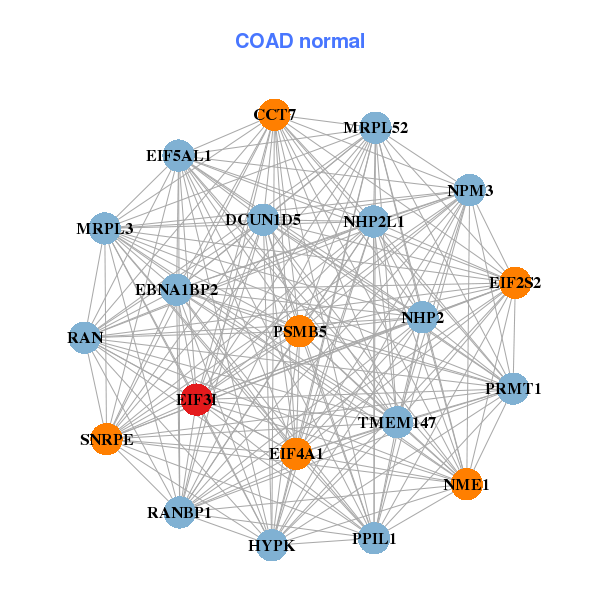
| * Co-Expression network figures were drawn using R package igraph. Only the top 20 genes with the highest correlations were shown. Red circle: input gene, orange circle: cell metabolism gene, sky circle: other gene |
: Open all plots for all cancer types
 |
|
| ADPRHL2,AK2,DNAJC8,EIF3I,ERI3,HDAC1,MARCKSL1, MRPS15,MRTO4,NDUFS5,NUDC,PARK7,PEF1,PSMB2, RPL11,RPL24,RPS8,TRAPPC3,UQCRH,ZBTB8OS,ZCCHC17 | C12orf10,CCT7,EIF3G,EIF3I,FAU,NHP2,NHP2L1, NME2,PHB2,RPL27A,RPL29,RPL35,RPL36,RPL7A, RPL8,RPLP1,RPS11,RPS15,RPS16,SARS,SNRPD2 |
 |
|
| AK2,ATP5G1,ATPIF1,AURKAIP1,EBNA1BP2,EIF3I,LAMTOR5, LSM10,MRPL20,MRPL37,MRPS15,MRTO4,PEF1,PSMA5, PSMB2,TRAPPC3,UQCRH,UQCRHL,UTP11L,ZBTB8OS,ZNF593 | HYPK,CCT7,DCUN1D5,EBNA1BP2,EIF2S2,EIF3I,EIF4A1, EIF5AL1,MRPL3,MRPL52,NHP2,NHP2L1,NME1,NPM3, PPIL1,PRMT1,PSMB5,RAN,RANBP1,SNRPE,TMEM147 |
| * Co-Expression network figures were drawn using R package igraph. Only the top 20 genes with the highest correlations were shown. Red circle: input gene, orange circle: cell metabolism gene, sky circle: other gene |
: Open all plots for all cancer types
| Top |
: Open all interacting genes' information including KEGG pathway for all interacting genes from DAVID
| Top |
| Pharmacological Information for EIF3I |
| There's no related Drug. |
| Top |
| Cross referenced IDs for EIF3I |
| * We obtained these cross-references from Uniprot database. It covers 150 different DBs, 18 categories. http://www.uniprot.org/help/cross_references_section |
: Open all cross reference information
|
Copyright © 2016-Present - The Univsersity of Texas Health Science Center at Houston @ |