|
||||||||||||||||||||
| |
| Phenotypic Information (metabolism pathway, cancer, disease, phenome) |
| |
| |
| Gene-Gene Network Information: Co-Expression Network, Interacting Genes & KEGG |
| |
|


| Gene Summary for HYAL2 |
| Top |
| Phenotypic Information for HYAL2(metabolism pathway, cancer, disease, phenome) |
| Cancer | CGAP: HYAL2 |
| Familial Cancer Database: HYAL2 | |
| * This gene is included in those cancer gene databases. |
|
|
|
|
|
|
| ||||||||||||||
Oncogene 1 | Significant driver gene in | |||||||||||||||||||
| cf) number; DB name 1 Oncogene; http://nar.oxfordjournals.org/content/35/suppl_1/D721.long, 2 Tumor Suppressor gene; https://bioinfo.uth.edu/TSGene/, 3 Cancer Gene Census; http://www.nature.com/nrc/journal/v4/n3/abs/nrc1299.html, 4 CancerGenes; http://nar.oxfordjournals.org/content/35/suppl_1/D721.long, 5 Network of Cancer Gene; http://ncg.kcl.ac.uk/index.php, 1Therapeutic Vulnerabilities in Cancer; http://cbio.mskcc.org/cancergenomics/statius/ |
| REACTOME_HYALURONAN_METABOLISM REACTOME_METABOLISM_OF_CARBOHYDRATES | |
| OMIM | |
| Orphanet | |
| Disease | KEGG Disease: HYAL2 |
| MedGen: HYAL2 (Human Medical Genetics with Condition) | |
| ClinVar: HYAL2 | |
| Phenotype | MGI: HYAL2 (International Mouse Phenotyping Consortium) |
| PhenomicDB: HYAL2 | |
| Mutations for HYAL2 |
| * Under tables are showing count per each tissue to give us broad intuition about tissue specific mutation patterns.You can go to the detailed page for each mutation database's web site. |
| There's no structural variation information in COSMIC data for this gene. |
| * From mRNA Sanger sequences, Chitars2.0 arranged chimeric transcripts. This table shows HYAL2 related fusion information. |
| ID | Head Gene | Tail Gene | Accession | Gene_a | qStart_a | qEnd_a | Chromosome_a | tStart_a | tEnd_a | Gene_a | qStart_a | qEnd_a | Chromosome_a | tStart_a | tEnd_a |
| CF131370 | HYAL2 | 1 | 119 | 3 | 50357153 | 50357271 | HYAL2 | 114 | 807 | 3 | 50357558 | 50358599 | |
| BF853827 | IGFBP7 | 9 | 234 | 4 | 57939403 | 57939632 | HYAL2 | 218 | 603 | 3 | 50355278 | 50355662 | |
| Top |
| There's no copy number variation information in COSMIC data for this gene. |
| Top |
|
 |
| Top |
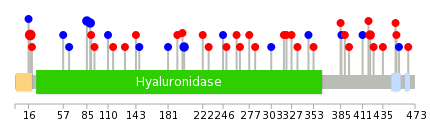
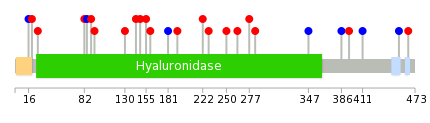
| Stat. for Non-Synonymous SNVs (# total SNVs=24) | (# total SNVs=12) |
 |  |
(# total SNVs=0) | (# total SNVs=2) |
 |
| Top |
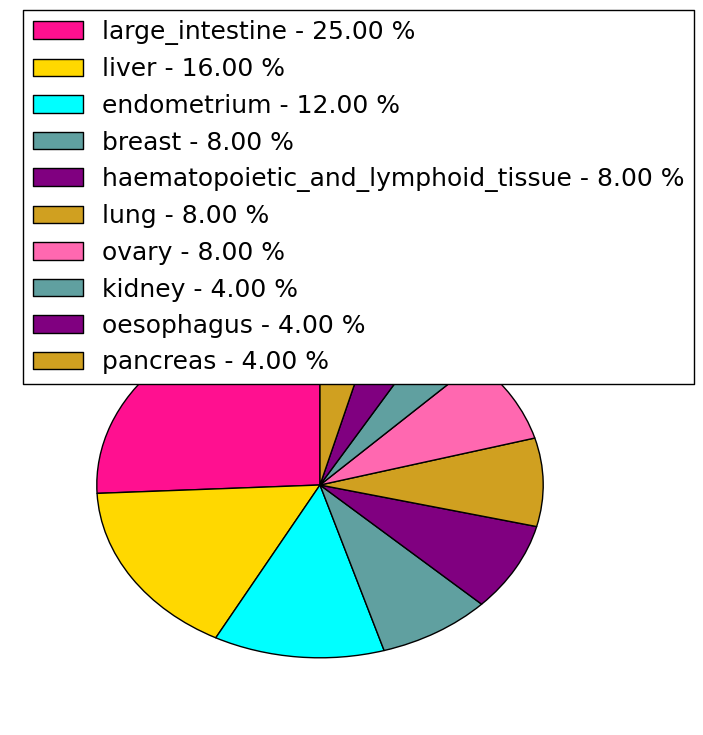
| * When you move the cursor on each content, you can see more deailed mutation information on the Tooltip. Those are primary_site,primary_histology,mutation(aa),pubmedID. |
| GRCh37 position | Mutation(aa) | Unique sampleID count |
| chr3:50357869-50357869 | p.S18A | 4 |
| chr3:50355723-50355723 | p.H420R | 2 |
| chr3:50357321-50357321 | p.R200R | 2 |
| chr3:50357654-50357654 | p.F89F | 2 |
| chr3:50357666-50357666 | p.L85L | 2 |
| chr3:50355924-50355924 | p.P353L | 1 |
| chr3:50357862-50357862 | p.A20V | 1 |
| chr3:50357173-50357173 | p.P250S | 1 |
| chr3:50355678-50355678 | p.G435D | 1 |
| chr3:50357533-50357533 | p.A130T | 1 |
| Top |
|
 |
| Point Mutation/ Tissue ID | 1 | 2 | 3 | 4 | 5 | 6 | 7 | 8 | 9 | 10 | 11 | 12 | 13 | 14 | 15 | 16 | 17 | 18 | 19 | 20 |
| # sample | 2 | 2 | 3 | 1 | 1 | 1 | 1 | 2 | 6 | 4 | ||||||||||
| # mutation | 2 | 2 | 4 | 1 | 1 | 1 | 1 | 3 | 7 | 4 | ||||||||||
| nonsynonymous SNV | 2 | 2 | 2 | 1 | 1 | 1 | 1 | 6 | 3 | |||||||||||
| synonymous SNV | 2 | 1 | 2 | 1 | 1 |
| cf) Tissue ID; Tissue type (1; BLCA[Bladder Urothelial Carcinoma], 2; BRCA[Breast invasive carcinoma], 3; CESC[Cervical squamous cell carcinoma and endocervical adenocarcinoma], 4; COAD[Colon adenocarcinoma], 5; GBM[Glioblastoma multiforme], 6; Glioma Low Grade, 7; HNSC[Head and Neck squamous cell carcinoma], 8; KICH[Kidney Chromophobe], 9; KIRC[Kidney renal clear cell carcinoma], 10; KIRP[Kidney renal papillary cell carcinoma], 11; LAML[Acute Myeloid Leukemia], 12; LUAD[Lung adenocarcinoma], 13; LUSC[Lung squamous cell carcinoma], 14; OV[Ovarian serous cystadenocarcinoma ], 15; PAAD[Pancreatic adenocarcinoma], 16; PRAD[Prostate adenocarcinoma], 17; SKCM[Skin Cutaneous Melanoma], 18:STAD[Stomach adenocarcinoma], 19:THCA[Thyroid carcinoma], 20:UCEC[Uterine Corpus Endometrial Carcinoma]) |
| Top |
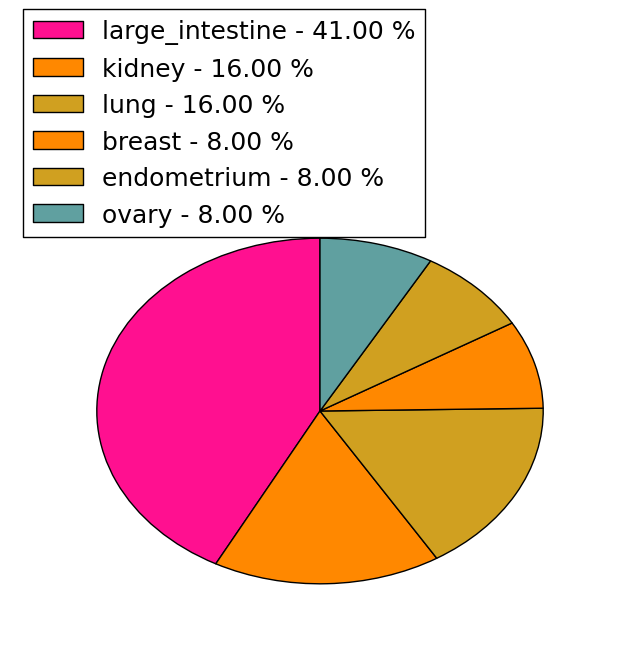
| * We represented just top 10 SNVs. When you move the cursor on each content, you can see more deailed mutation information on the Tooltip. Those are primary_site, primary_histology, mutation(aa), pubmedID. |
| Genomic Position | Mutation(aa) | Unique sampleID count |
| chr3:50357443 | p.A284G,HYAL2 | 1 |
| chr3:50357873 | p.R82H,HYAL2 | 1 |
| chr3:50355824 | p.R277C,HYAL2 | 1 |
| chr3:50357457 | p.A27T,HYAL2 | 1 |
| chr3:50355943 | p.H263D,HYAL2 | 1 |
| chr3:50357479 | p.A20V,HYAL2 | 1 |
| chr3:50357070 | p.P250T,HYAL2 | 1 |
| chr3:50357493 | p.A16A,HYAL2 | 1 |
| chr3:50357092 | p.D229N,HYAL2 | 1 |
| chr3:50357533 | p.S222I,HYAL2 | 1 |
| * Copy number data were extracted from TCGA using R package TCGA-Assembler. The URLs of all public data files on TCGA DCC data server were gathered on Jan-05-2015. Function ProcessCNAData in TCGA-Assembler package was used to obtain gene-level copy number value which is calculated as the average copy number of the genomic region of a gene. |
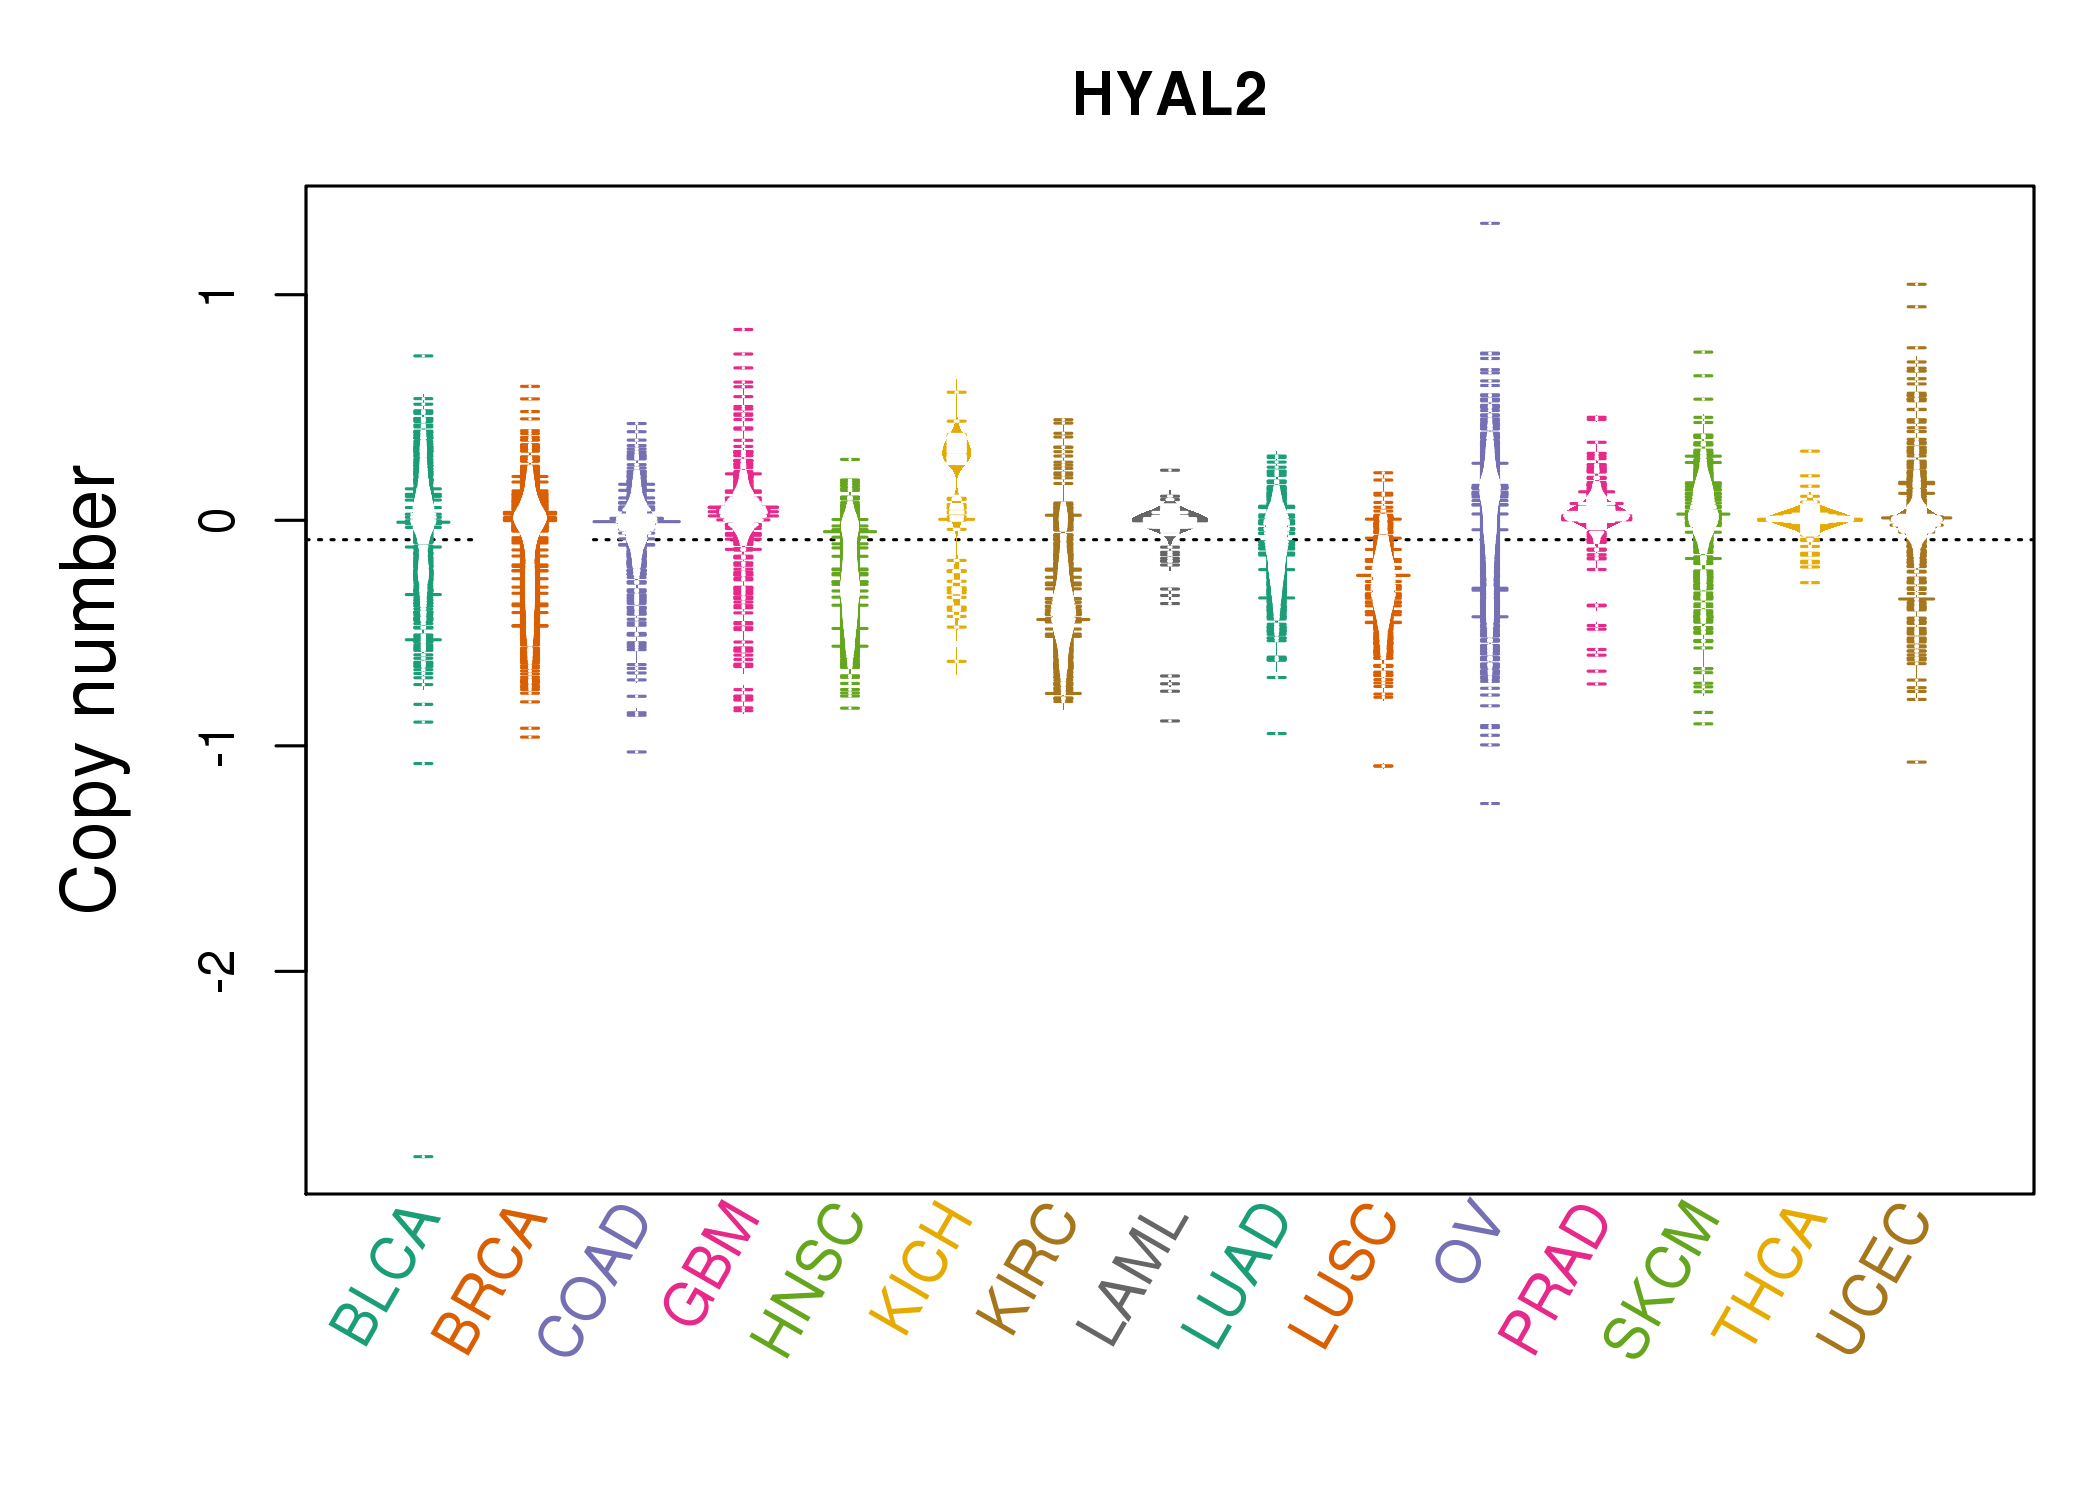 |
| cf) Tissue ID[Tissue type]: BLCA[Bladder Urothelial Carcinoma], BRCA[Breast invasive carcinoma], CESC[Cervical squamous cell carcinoma and endocervical adenocarcinoma], COAD[Colon adenocarcinoma], GBM[Glioblastoma multiforme], Glioma Low Grade, HNSC[Head and Neck squamous cell carcinoma], KICH[Kidney Chromophobe], KIRC[Kidney renal clear cell carcinoma], KIRP[Kidney renal papillary cell carcinoma], LAML[Acute Myeloid Leukemia], LUAD[Lung adenocarcinoma], LUSC[Lung squamous cell carcinoma], OV[Ovarian serous cystadenocarcinoma ], PAAD[Pancreatic adenocarcinoma], PRAD[Prostate adenocarcinoma], SKCM[Skin Cutaneous Melanoma], STAD[Stomach adenocarcinoma], THCA[Thyroid carcinoma], UCEC[Uterine Corpus Endometrial Carcinoma] |
| Top |
| Gene Expression for HYAL2 |
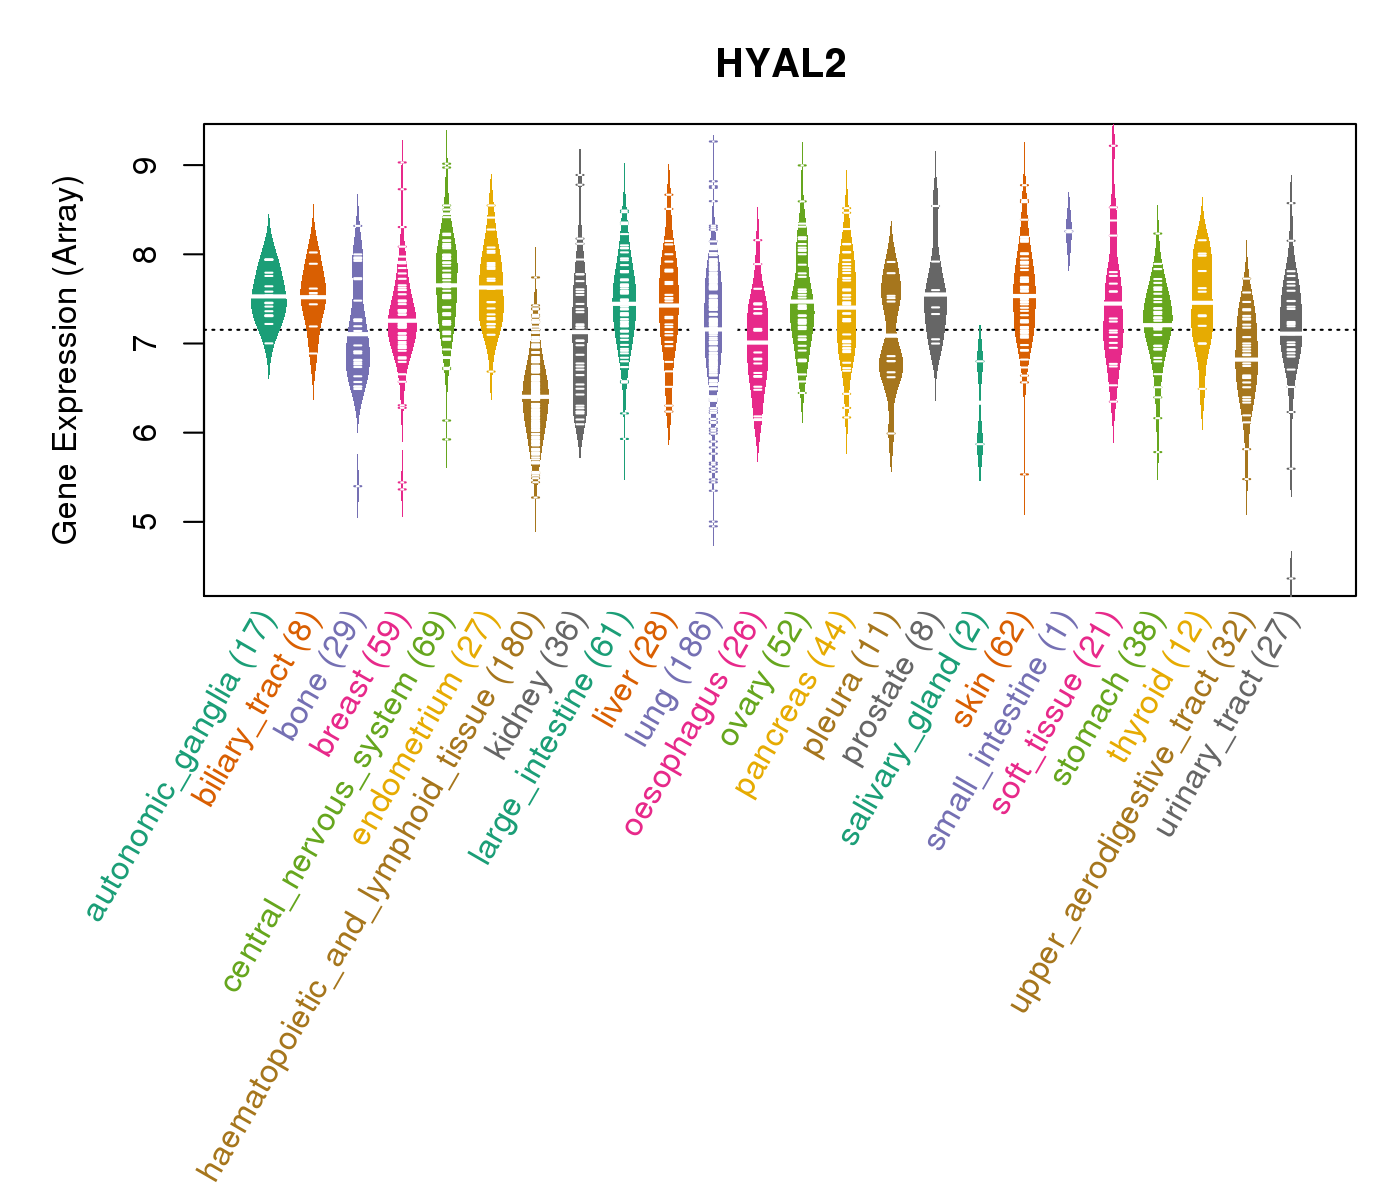
| * CCLE gene expression data were extracted from CCLE_Expression_Entrez_2012-10-18.res: Gene-centric RMA-normalized mRNA expression data. |
 |
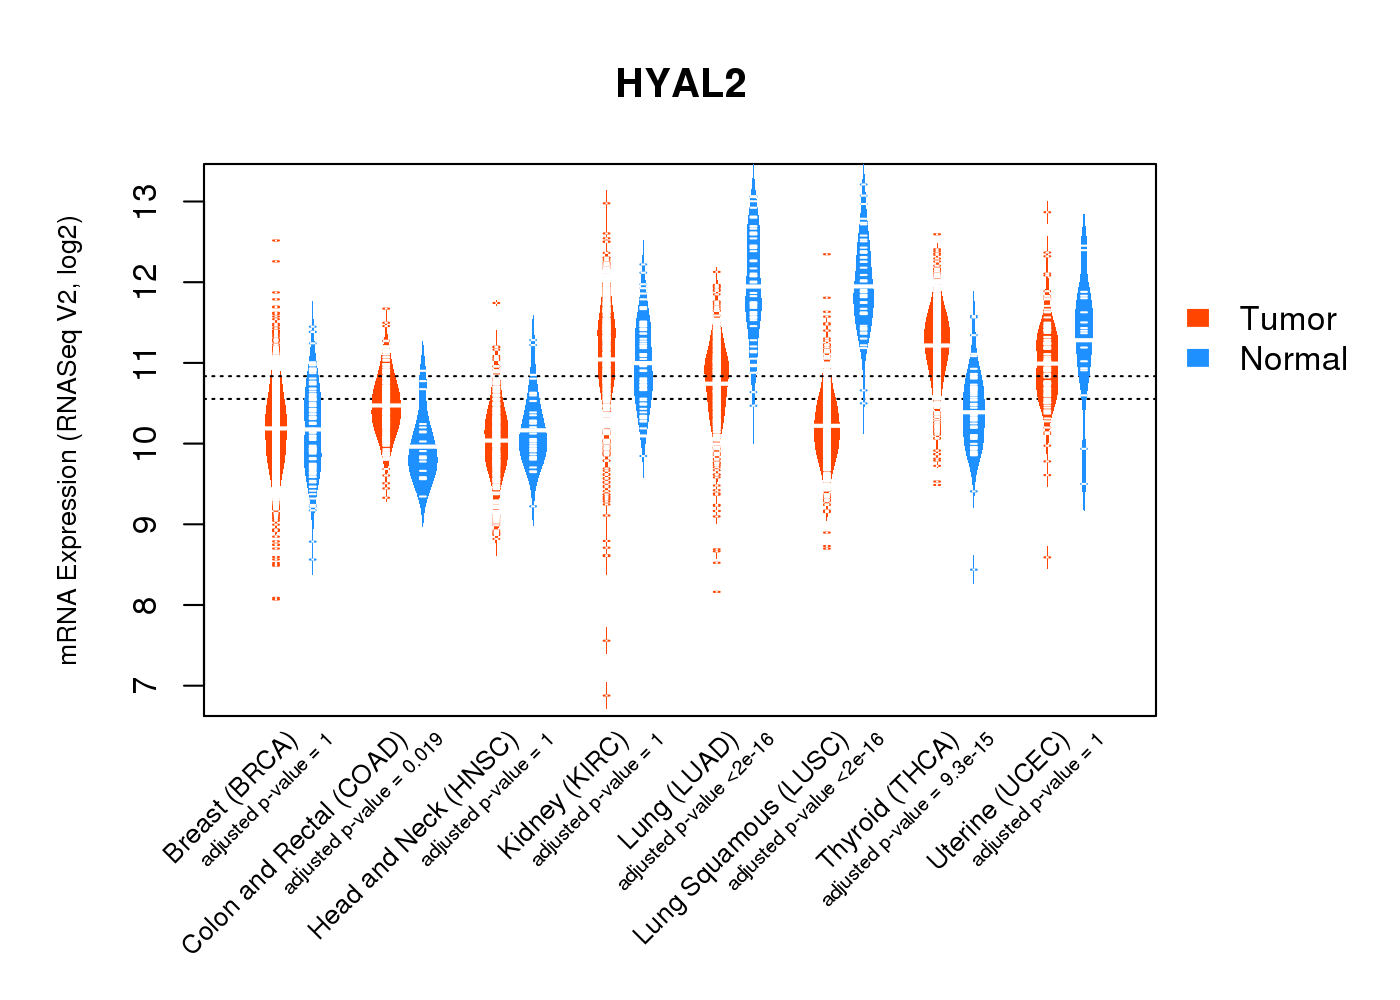
| * Normalized gene expression data of RNASeqV2 was extracted from TCGA using R package TCGA-Assembler. The URLs of all public data files on TCGA DCC data server were gathered at Jan-05-2015. Only eight cancer types have enough normal control samples for differential expression analysis. (t test, adjusted p<0.05 (using Benjamini-Hochberg FDR)) |
 |
| Top |
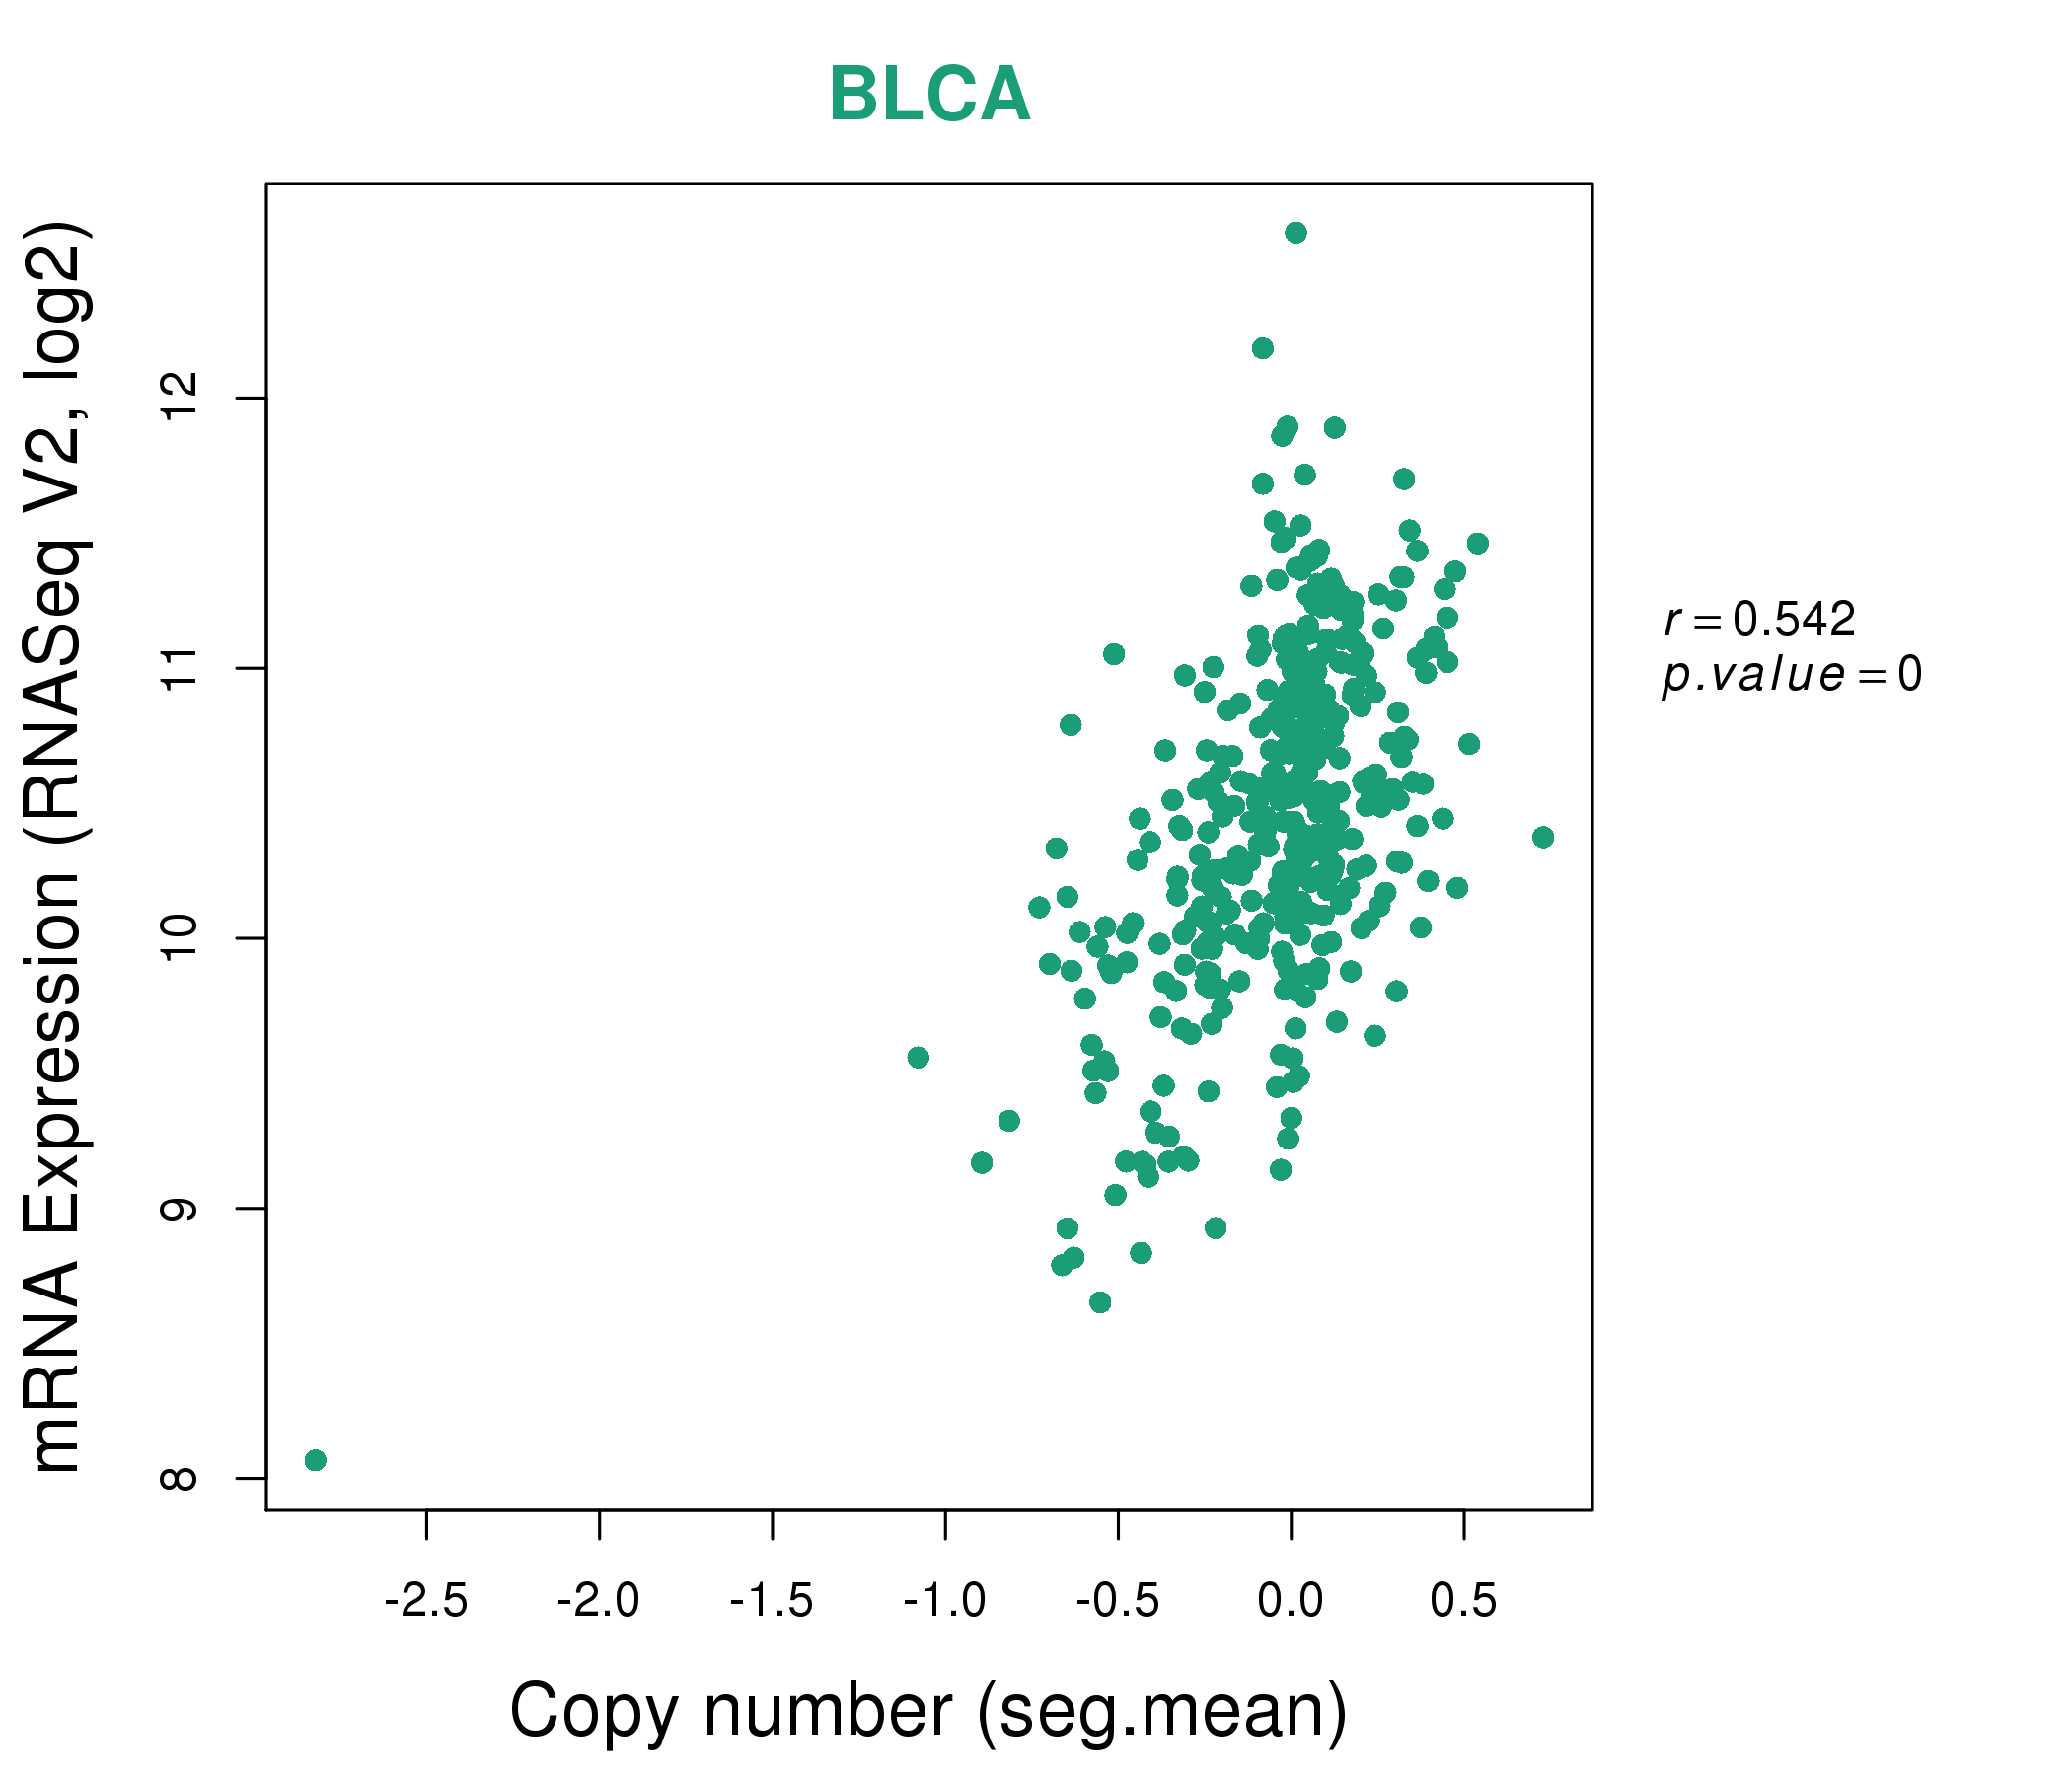
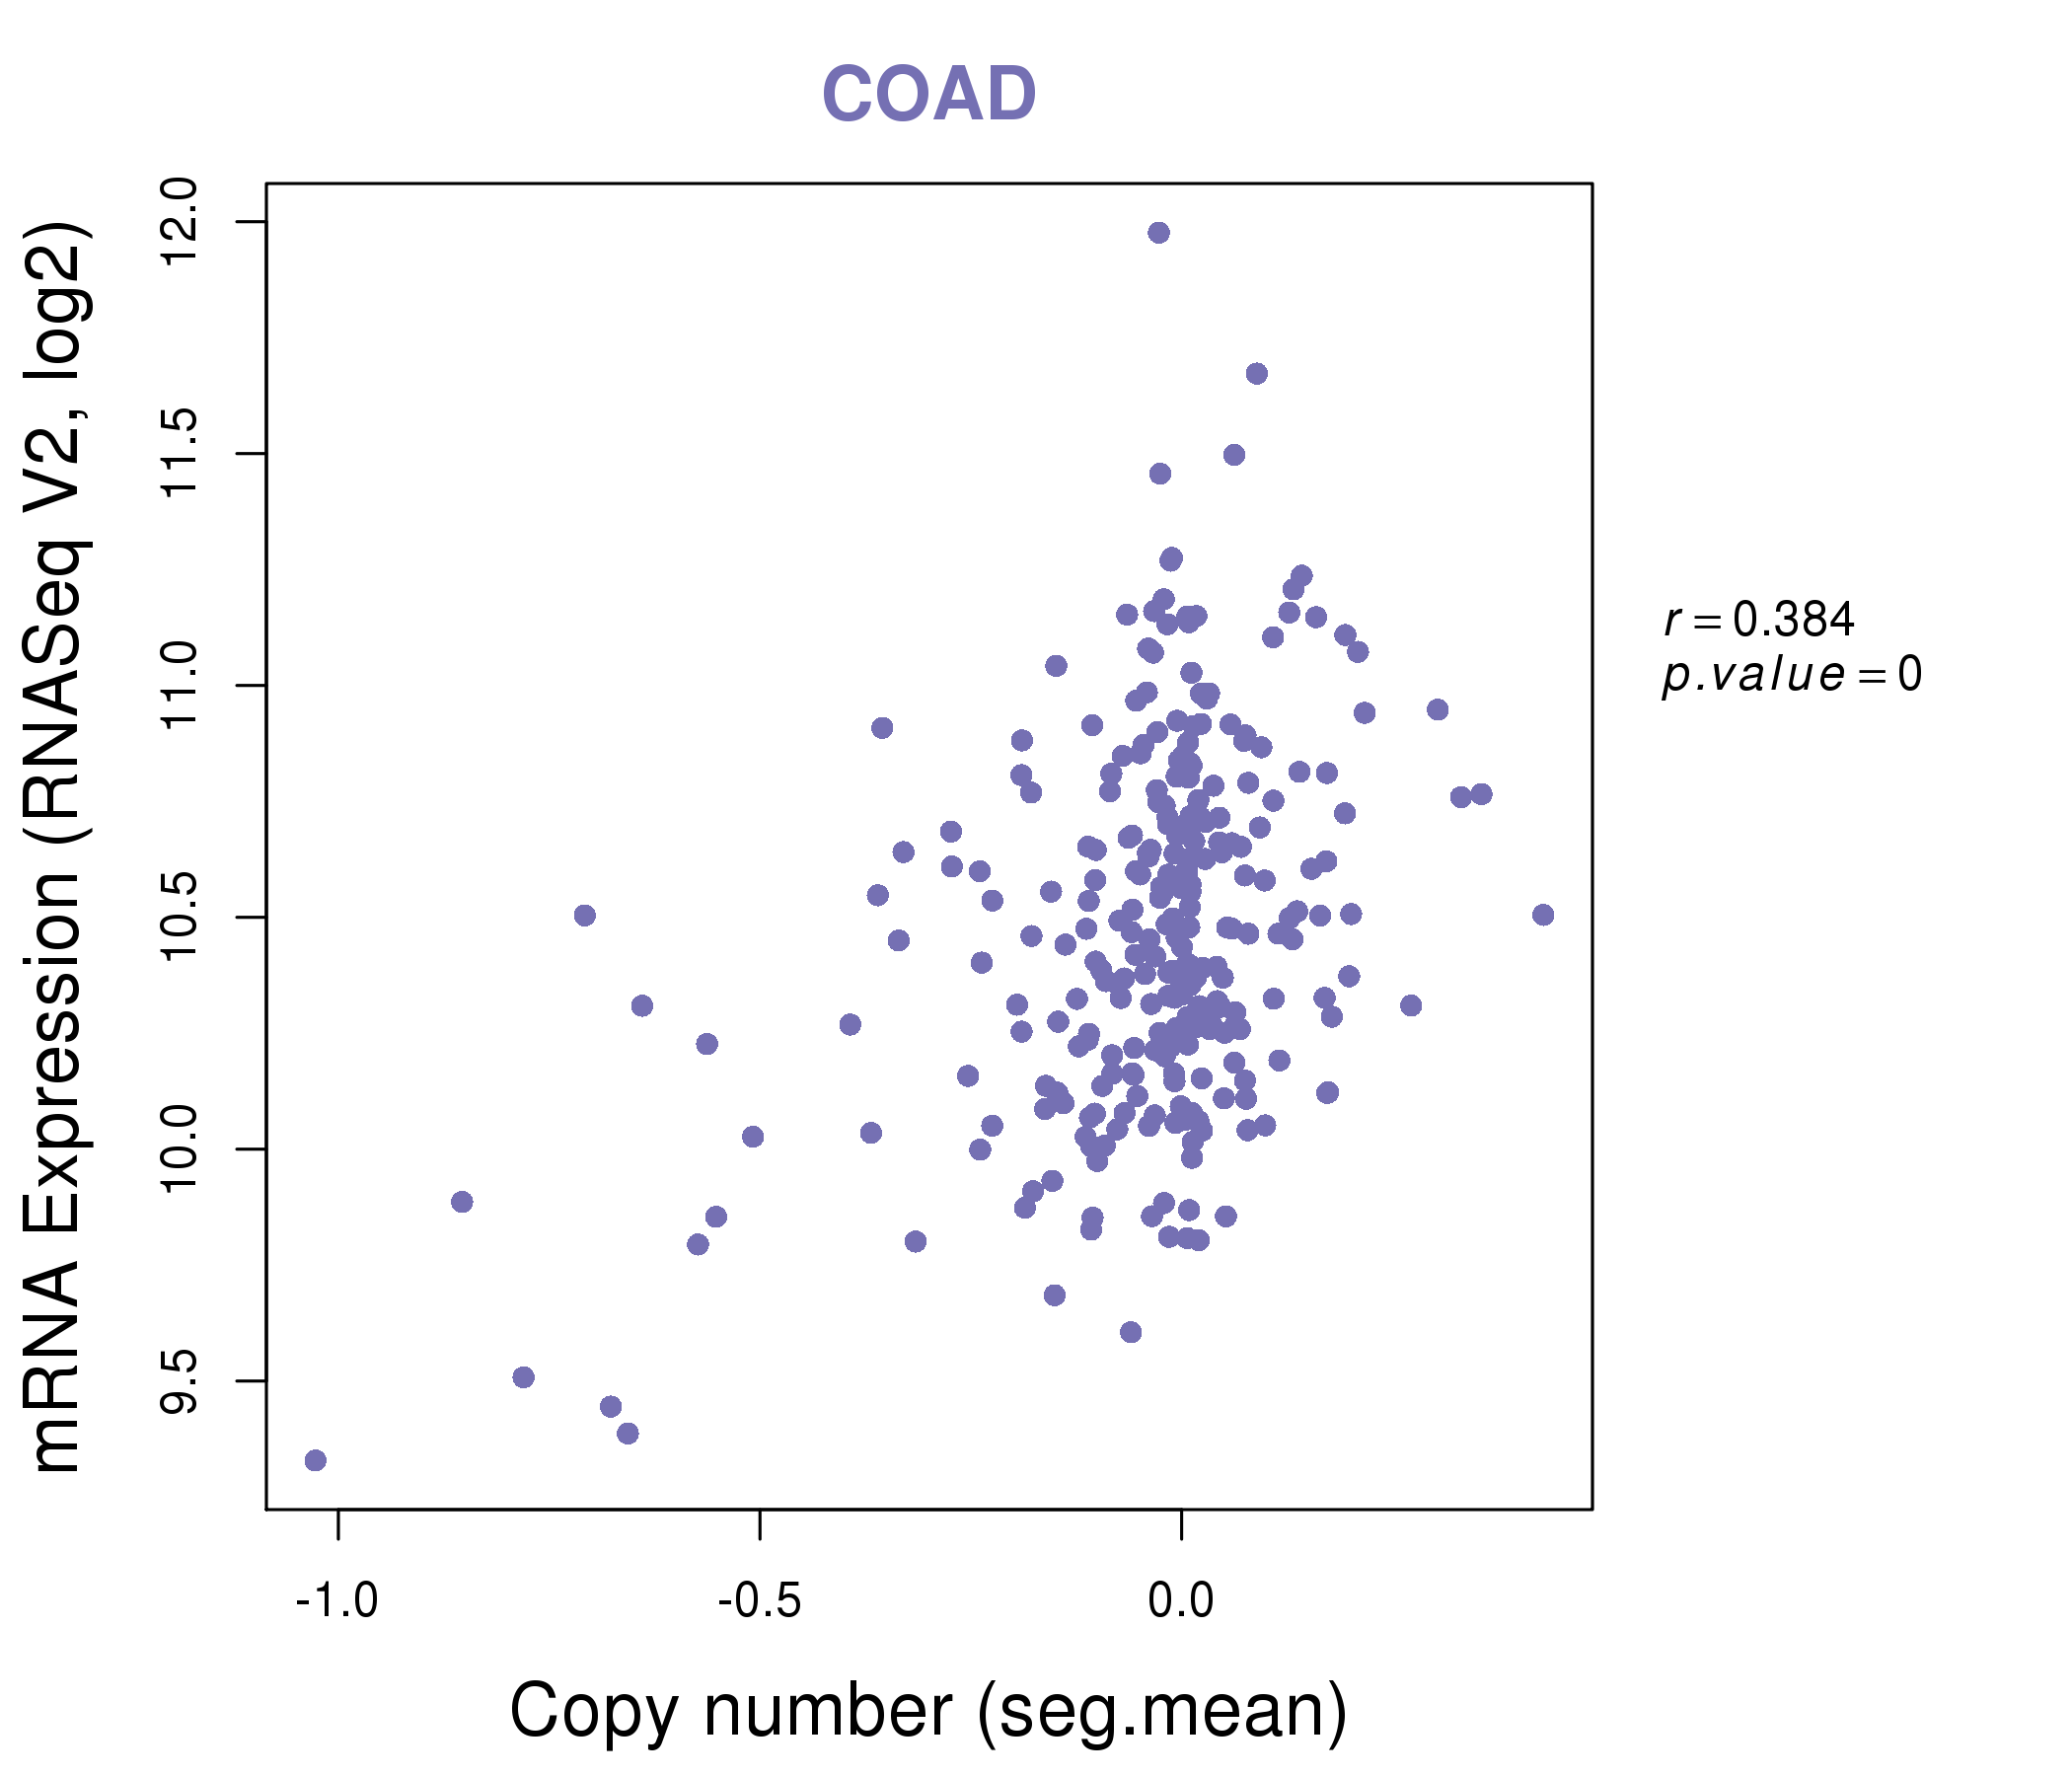
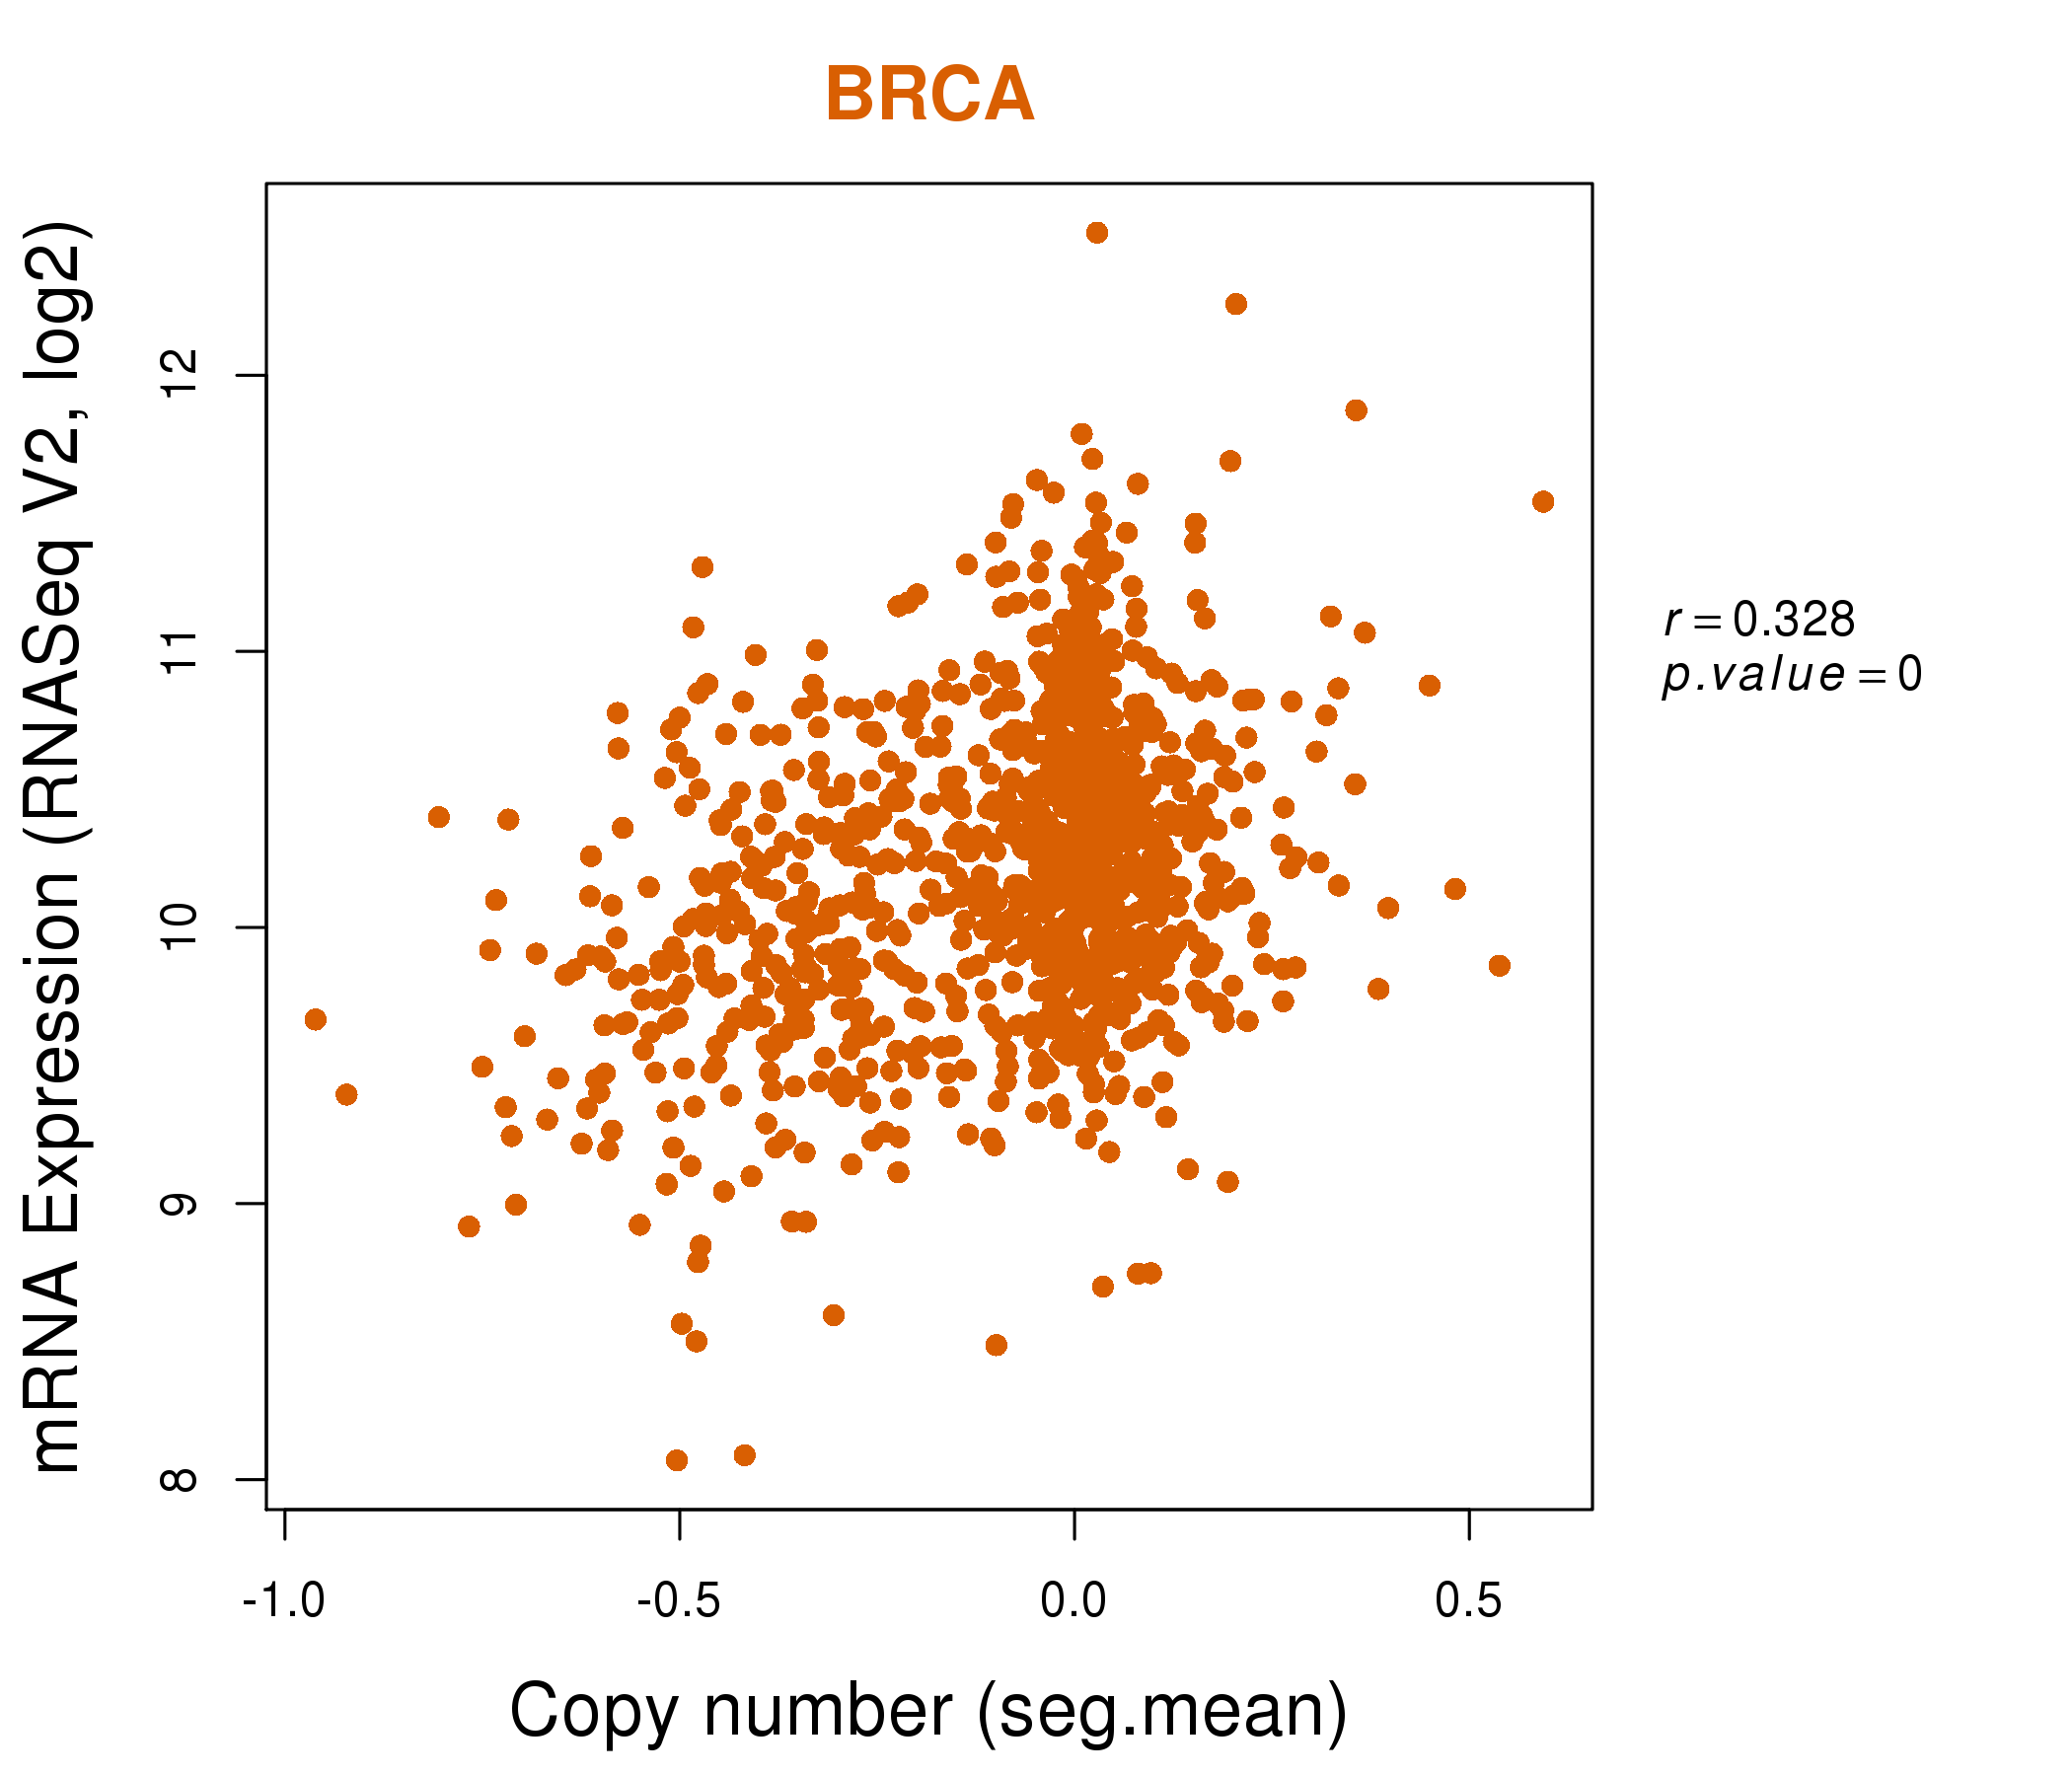
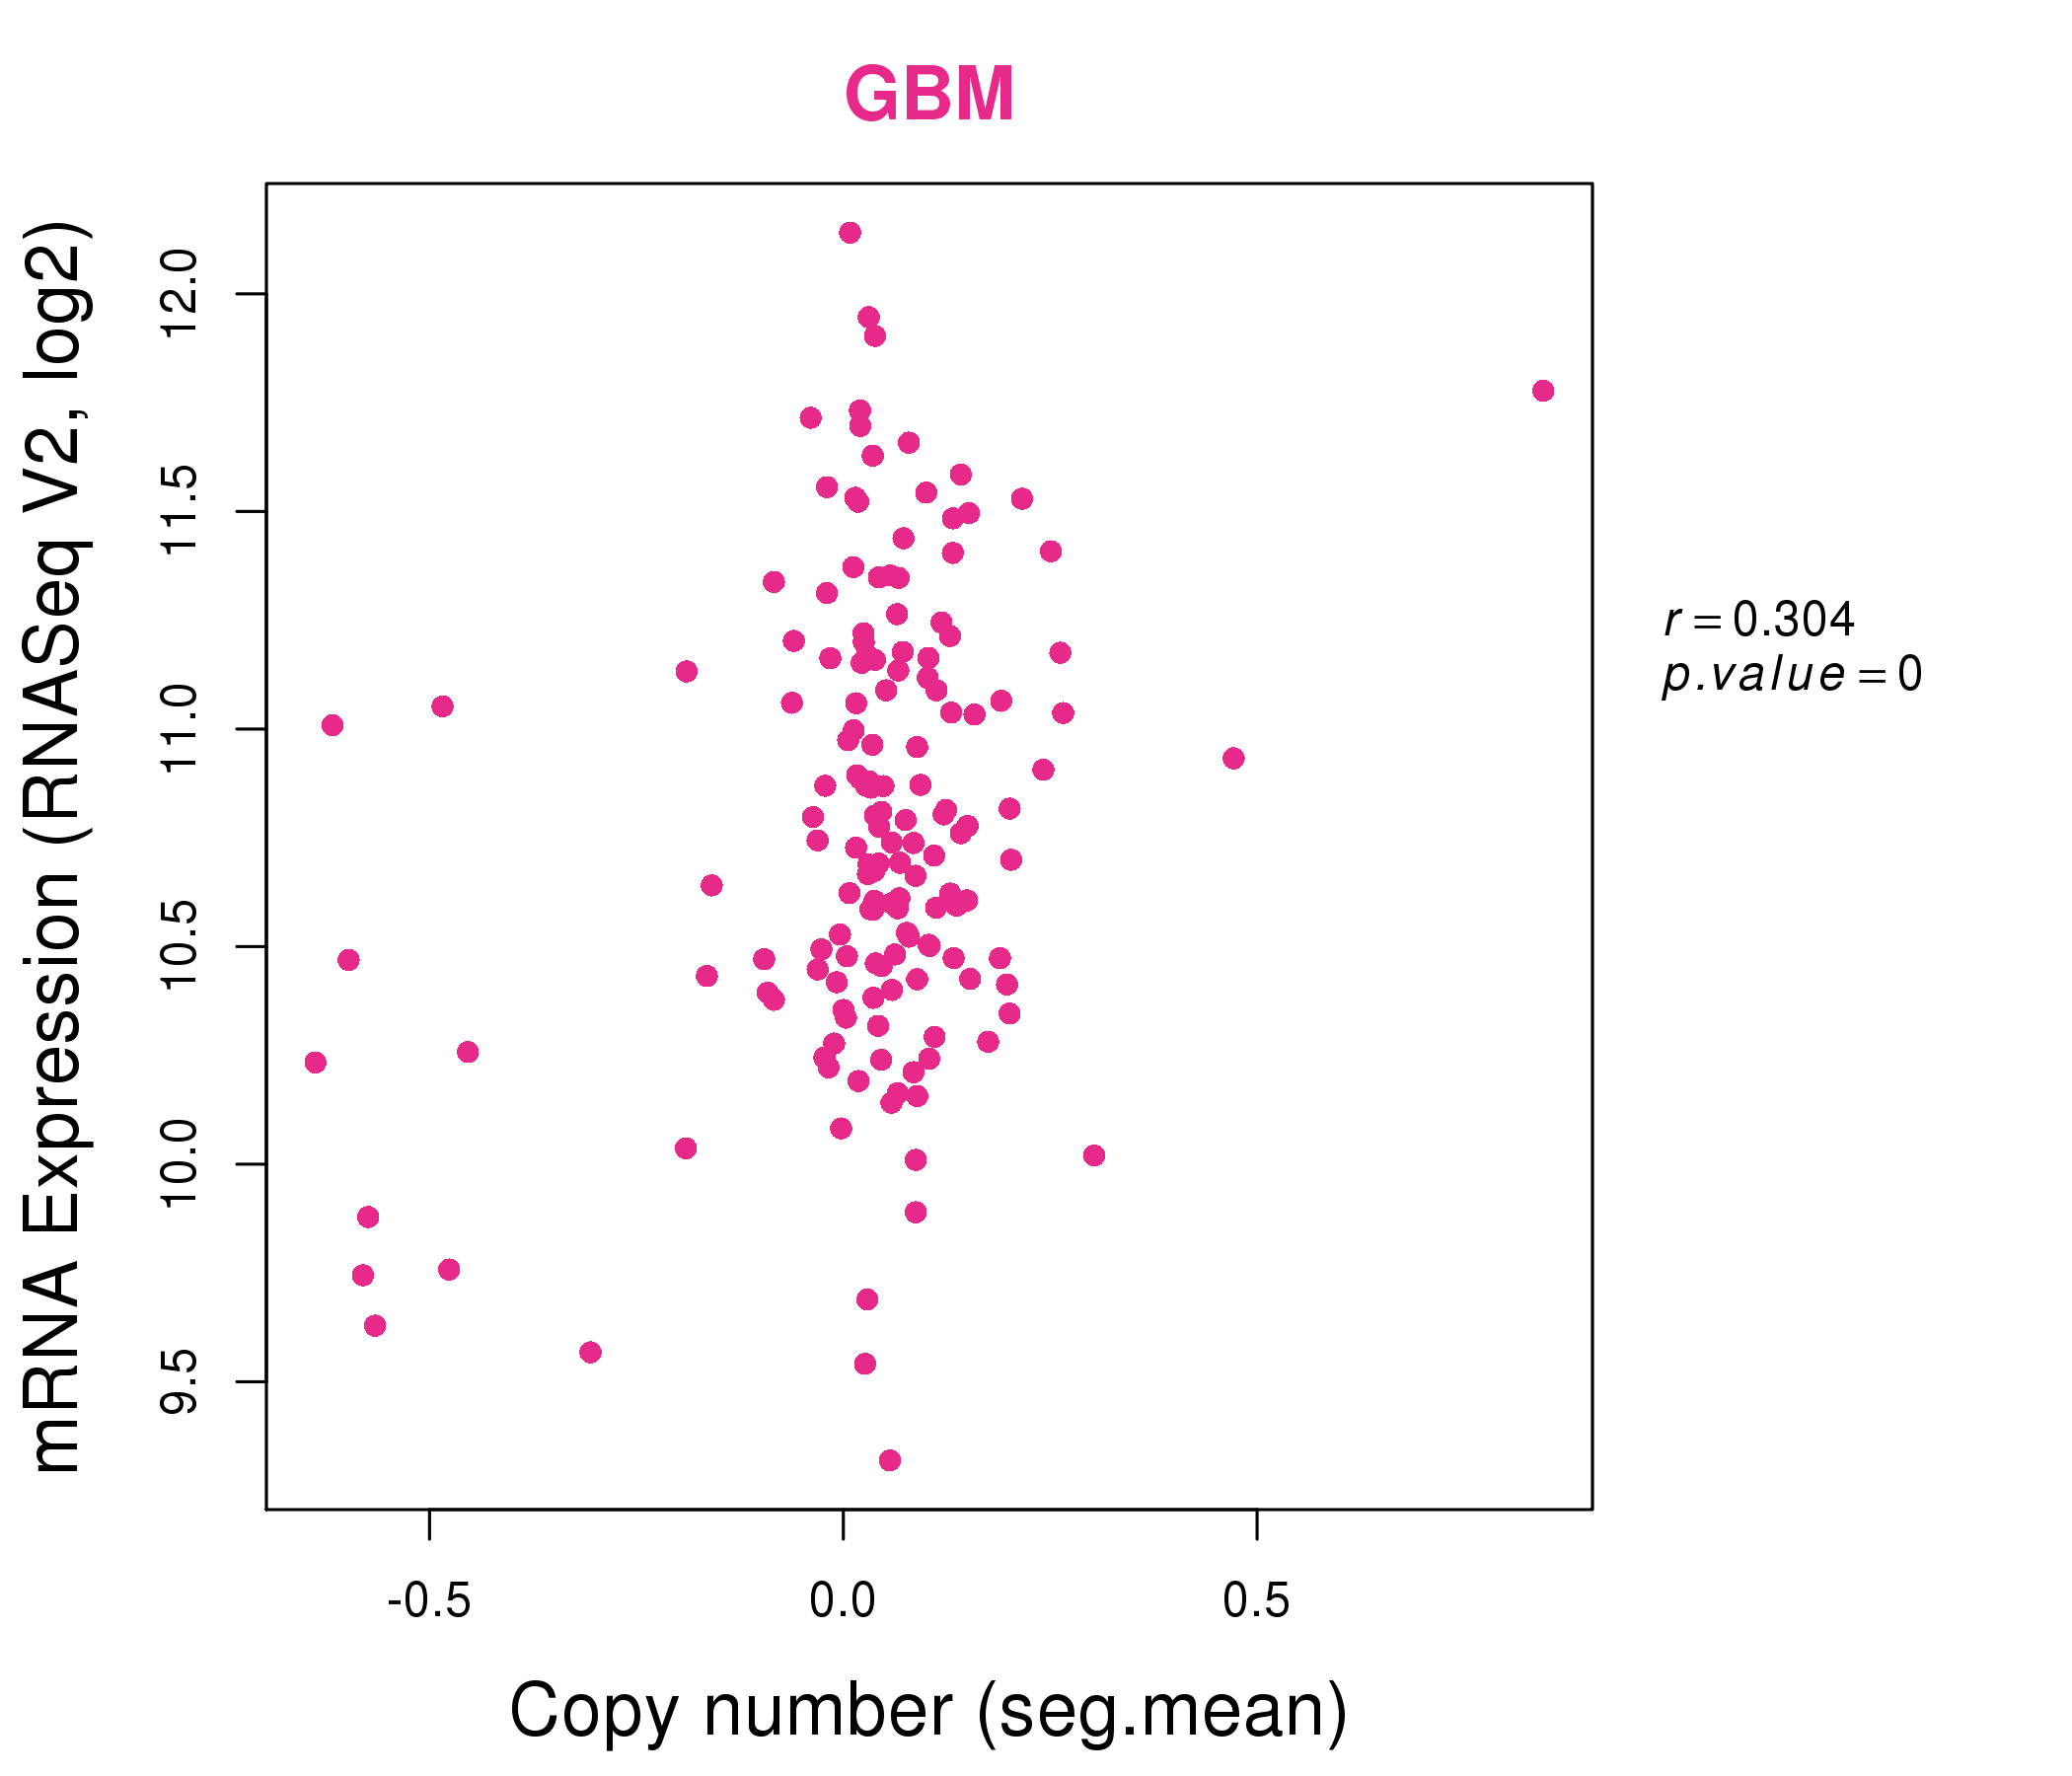
| * This plots show the correlation between CNV and gene expression. |
: Open all plots for all cancer types
 |
|
 |
|
| Top |
| Gene-Gene Network Information |
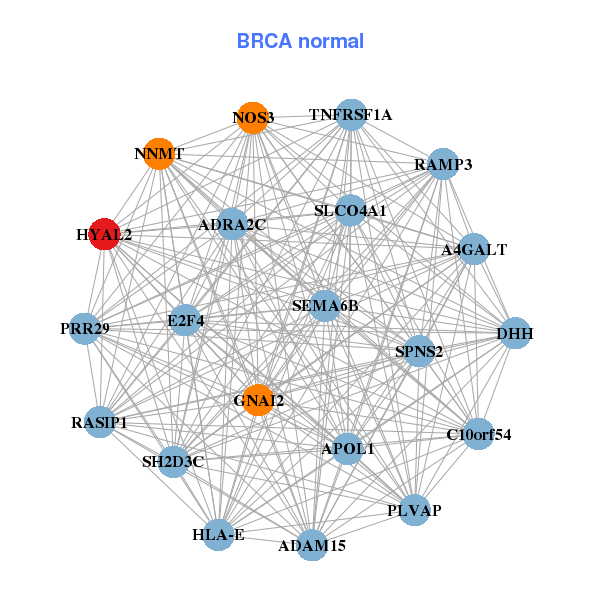
| * Co-Expression network figures were drawn using R package igraph. Only the top 20 genes with the highest correlations were shown. Red circle: input gene, orange circle: cell metabolism gene, sky circle: other gene |
: Open all plots for all cancer types
 |
|
| ACVRL1,ADCY4,CLDN5,CLEC14A,ENG,ESAM,EXOC3L1, EXOC3L2,TMEM255B,GJA4,GNAI2,GRASP,HYAL2,KANK3, NOVA2,PLVAP,ROBO4,SCARF1,TIE1,TMEM88,USHBP1 | A4GALT,ADAM15,ADRA2C,APOL1,C10orf54,PRR29,DHH, E2F4,GNAI2,HLA-E,HYAL2,NNMT,NOS3,PLVAP, RAMP3,RASIP1,SEMA6B,SH2D3C,SLCO4A1,SPNS2,TNFRSF1A |
 |
|
| CALCRL,CLEC14A,CNRIP1,CXorf36,ECSCR,ELTD1,GJA4, GJA5,GNG11,GPX7,HYAL2,IGFBP7,LGALS1,MCAM, PCDH12,RAMP2,RASIP1,RHOJ,S1PR1,TIE1,TMEM204 | AEN,ARID5A,EVA1C,CCDC86,DDX21,GNL2,GTPBP4, HYAL2,LTV1,MAK16,METTL1,NNMT,NOP16,ODC1, PNO1,PUS1,PYCRL,SLC25A32,TRMT6,ZPR1,ZNF593 |

| * Co-Expression network figures were drawn using R package igraph. Only the top 20 genes with the highest correlations were shown. Red circle: input gene, orange circle: cell metabolism gene, sky circle: other gene |
: Open all plots for all cancer types
| Top |
: Open all interacting genes' information including KEGG pathway for all interacting genes from DAVID
| Top |
| Pharmacological Information for HYAL2 |
| There's no related Drug. |
| Top |
| Cross referenced IDs for HYAL2 |
| * We obtained these cross-references from Uniprot database. It covers 150 different DBs, 18 categories. http://www.uniprot.org/help/cross_references_section |
: Open all cross reference information
|
Copyright © 2016-Present - The Univsersity of Texas Health Science Center at Houston @ |