|
|||||||||||||||||||||||||||||||||||||||||||||||||||||||||||||||||||||||||||||||||||||||||||||||||||||||||||||||||||||||||||||||||||||||||||||||||||||||||||||||||||||||||||||||||||||||||||||||||||||||||||||||||||||||||||||||||||||||||||||||||||||||||||||||||||||||||||||||||||||||||||||||||||||||||||||||||||||||||||||||||||||||||||||
| |
| Phenotypic Information (metabolism pathway, cancer, disease, phenome) |
| |
| |
| Gene-Gene Network Information: Co-Expression Network, Interacting Genes & KEGG |
| |
|


| Gene Summary for B4GALT2 |
| Basic gene info. | Gene symbol | B4GALT2 |
| Gene name | UDP-Gal:betaGlcNAc beta 1,4- galactosyltransferase, polypeptide 2 | |
| Synonyms | B4Gal-T2|B4Gal-T3|beta4Gal-T2 | |
| Cytomap | UCSC genome browser: 1p34-p33 | |
| Genomic location | chr1 :44445607-44456843 | |
| Type of gene | protein-coding | |
| RefGenes | NM_001005417.2, NM_003780.4,NM_030587.2, | |
| Ensembl id | ENSG00000117411 | |
| Description | UDP-Gal:beta-GlcNAc beta-1,4-galactosyltransferase 2UDP-Gal:betaGlcNAc beta 1,4- galactosyltransferase 2UDP-Gal:betaGlcNAc beta 1,4-galactosyltransferase, polypeptide 2UDP-galactose:beta-N-acetylglucosamine beta-1,4-galactosyltransferase 2beta-1,4-Gal | |
| Modification date | 20141207 | |
| dbXrefs | MIM : 604013 | |
| HGNC : HGNC | ||
| Ensembl : ENSG00000117411 | ||
| HPRD : 04928 | ||
| Vega : OTTHUMG00000008296 | ||
| Protein | UniProt: go to UniProt's Cross Reference DB Table | |
| Expression | CleanEX: HS_B4GALT2 | |
| BioGPS: 8704 | ||
| Gene Expression Atlas: ENSG00000117411 | ||
| The Human Protein Atlas: ENSG00000117411 | ||
| Pathway | NCI Pathway Interaction Database: B4GALT2 | |
| KEGG: B4GALT2 | ||
| REACTOME: B4GALT2 | ||
| ConsensusPathDB | ||
| Pathway Commons: B4GALT2 | ||
| Metabolism | MetaCyc: B4GALT2 | |
| HUMANCyc: B4GALT2 | ||
| Regulation | Ensembl's Regulation: ENSG00000117411 | |
| miRBase: chr1 :44,445,607-44,456,843 | ||
| TargetScan: NM_001005417 | ||
| cisRED: ENSG00000117411 | ||
| Context | iHOP: B4GALT2 | |
| cancer metabolism search in PubMed: B4GALT2 | ||
| UCL Cancer Institute: B4GALT2 | ||
| Assigned class in ccmGDB | C | |
| Top |
| Phenotypic Information for B4GALT2(metabolism pathway, cancer, disease, phenome) |
| Cancer | CGAP: B4GALT2 |
| Familial Cancer Database: B4GALT2 | |
| * This gene is included in those cancer gene databases. |
|
|
|
|
|
|
| |||||||||||||||||||||||||||||||||||||||||||||||||||||||||||||||||||||||||||||||||||||||||||||||||||||||||||||||||||||||||||||||||||||||||||||||||||||||||||||||||||||||||||||||||||||||||||||||||||||||||||||||||||||||||||||||||||||||||||||||||||||||||||||||||||||||||||||||||||||||||||||||||||||||||||||||||||||||||||||||||||||||
Oncogene 1 | Significant driver gene in | ||||||||||||||||||||||||||||||||||||||||||||||||||||||||||||||||||||||||||||||||||||||||||||||||||||||||||||||||||||||||||||||||||||||||||||||||||||||||||||||||||||||||||||||||||||||||||||||||||||||||||||||||||||||||||||||||||||||||||||||||||||||||||||||||||||||||||||||||||||||||||||||||||||||||||||||||||||||||||||||||||||||||||||
| cf) number; DB name 1 Oncogene; http://nar.oxfordjournals.org/content/35/suppl_1/D721.long, 2 Tumor Suppressor gene; https://bioinfo.uth.edu/TSGene/, 3 Cancer Gene Census; http://www.nature.com/nrc/journal/v4/n3/abs/nrc1299.html, 4 CancerGenes; http://nar.oxfordjournals.org/content/35/suppl_1/D721.long, 5 Network of Cancer Gene; http://ncg.kcl.ac.uk/index.php, 1Therapeutic Vulnerabilities in Cancer; http://cbio.mskcc.org/cancergenomics/statius/ |
| KEGG_GALACTOSE_METABOLISM REACTOME_METABOLISM_OF_PROTEINS REACTOME_METABOLISM_OF_CARBOHYDRATES | |
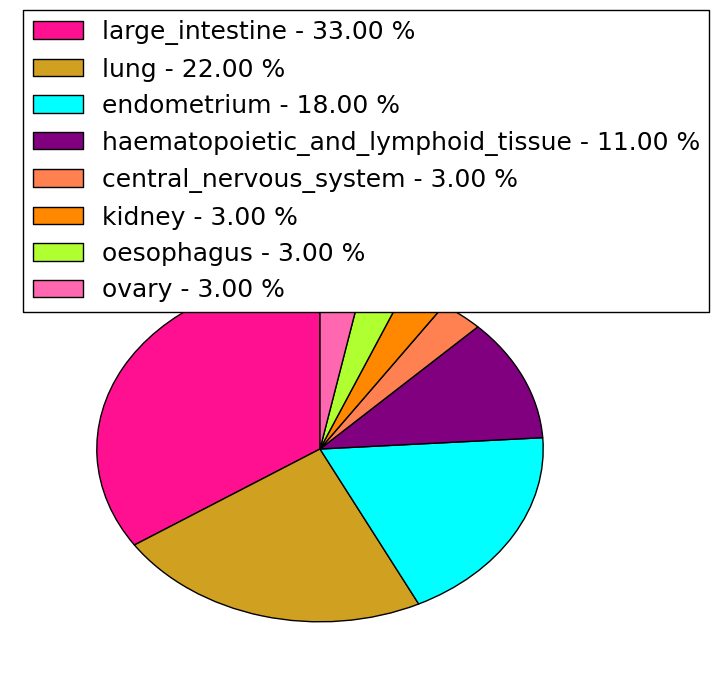
| Mutations for B4GALT2 |
| * Under tables are showing count per each tissue to give us broad intuition about tissue specific mutation patterns.You can go to the detailed page for each mutation database's web site. |
| - Statistics for Tissue and Mutation type | Top |
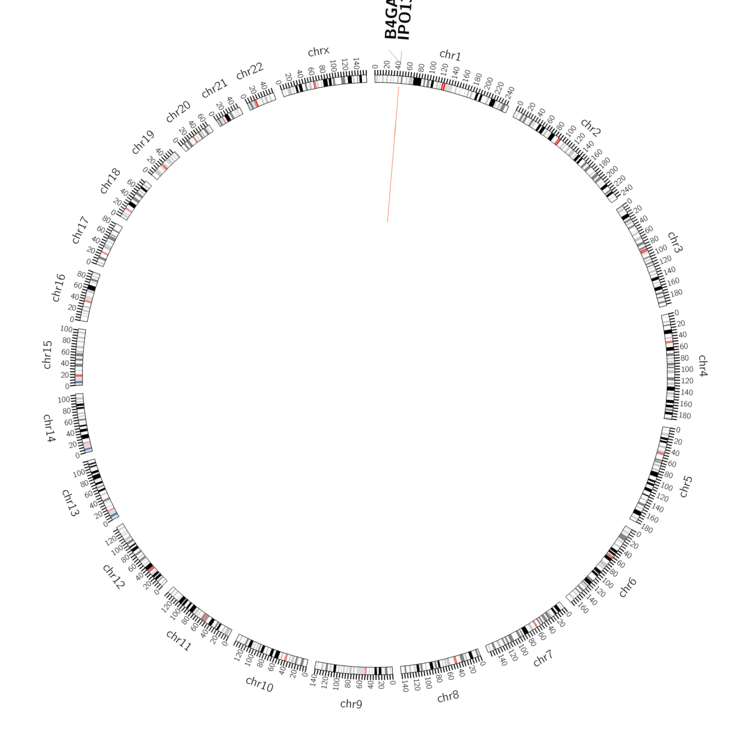 |
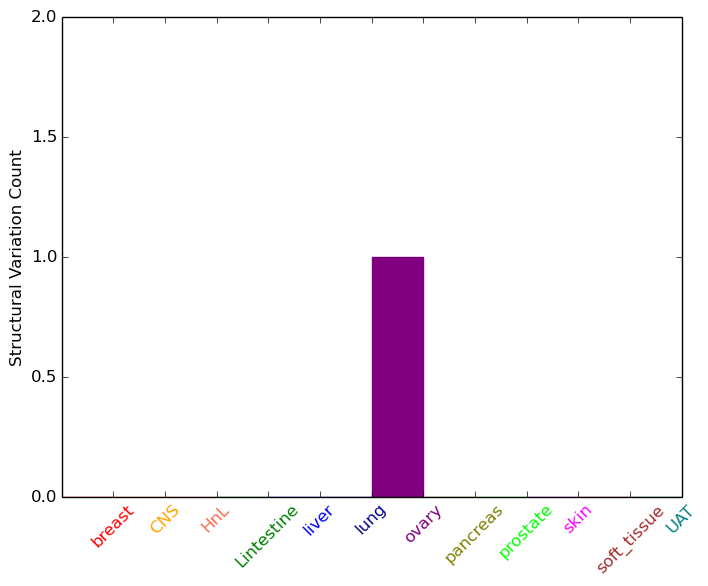
| - For Inter-chromosomal Variations |
| There's no inter-chromosomal structural variation. |
| - For Intra-chromosomal Variations |
| * Intra-chromosomal variantions includes 'intrachromosomal amplicon to amplicon', 'intrachromosomal amplicon to non-amplified dna', 'intrachromosomal deletion', 'intrachromosomal fold-back inversion', 'intrachromosomal inversion', 'intrachromosomal tandem duplication', 'Intrachromosomal unknown type', 'intrachromosomal with inverted orientation', 'intrachromosomal with non-inverted orientation'. |
 |
| Sample | Symbol_a | Chr_a | Start_a | End_a | Symbol_b | Chr_b | Start_b | End_b |
| ovary | B4GALT2 | chr1 | 44449504 | 44449524 | IPO13 | chr1 | 44414887 | 44414907 |
| cf) Tissue number; Tissue name (1;Breast, 2;Central_nervous_system, 3;Haematopoietic_and_lymphoid_tissue, 4;Large_intestine, 5;Liver, 6;Lung, 7;Ovary, 8;Pancreas, 9;Prostate, 10;Skin, 11;Soft_tissue, 12;Upper_aerodigestive_tract) |
| * From mRNA Sanger sequences, Chitars2.0 arranged chimeric transcripts. This table shows B4GALT2 related fusion information. |
| ID | Head Gene | Tail Gene | Accession | Gene_a | qStart_a | qEnd_a | Chromosome_a | tStart_a | tEnd_a | Gene_a | qStart_a | qEnd_a | Chromosome_a | tStart_a | tEnd_a |
| CA337099 | B4GALT2 | 1 | 425 | 1 | 44451263 | 44456362 | B4GALT2 | 414 | 592 | 1 | 44456659 | 44456837 | |
| M78136 | MACF1 | 63 | 153 | 1 | 39710618 | 39710708 | B4GALT2 | 153 | 329 | 1 | 44447038 | 44447428 | |
| Top |
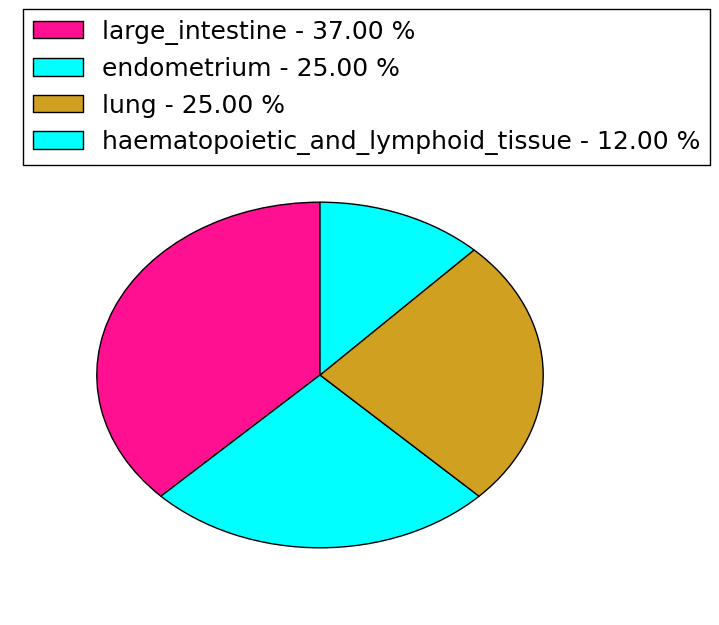
| Mutation type/ Tissue ID | brca | cns | cerv | endome | haematopo | kidn | Lintest | liver | lung | ns | ovary | pancre | prost | skin | stoma | thyro | urina | |||
| Total # sample | 1 | 1 | ||||||||||||||||||
| GAIN (# sample) | 1 | |||||||||||||||||||
| LOSS (# sample) | 1 |
| cf) Tissue ID; Tissue type (1; Breast, 2; Central_nervous_system, 3; Cervix, 4; Endometrium, 5; Haematopoietic_and_lymphoid_tissue, 6; Kidney, 7; Large_intestine, 8; Liver, 9; Lung, 10; NS, 11; Ovary, 12; Pancreas, 13; Prostate, 14; Skin, 15; Stomach, 16; Thyroid, 17; Urinary_tract) |
| Top |
|
 |
| Top |
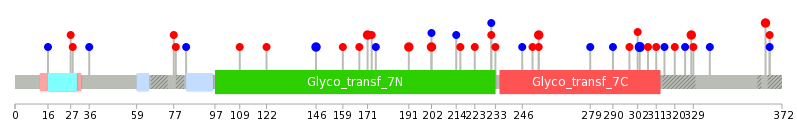
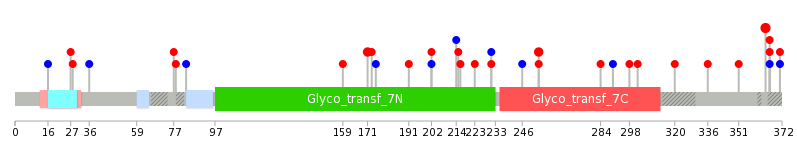
| Stat. for Non-Synonymous SNVs (# total SNVs=27) | (# total SNVs=8) |
 |  |
(# total SNVs=0) | (# total SNVs=0) |
| Top |
| * When you move the cursor on each content, you can see more deailed mutation information on the Tooltip. Those are primary_site,primary_histology,mutation(aa),pubmedID. |
| GRCh37 position | Mutation(aa) | Unique sampleID count |
| chr1:44451234-44451234 | p.I303I | 3 |
| chr1:44447558-44447558 | p.R171W | 2 |
| chr1:44450559-44450559 | p.R191Q | 2 |
| chr1:44450969-44450969 | p.F254L | 2 |
| chr1:44450592-44450592 | p.A202V | 2 |
| chr1:44455983-44455983 | p.Q328K | 2 |
| chr1:44447485-44447485 | p.A146A | 2 |
| chr1:44456091-44456091 | p.R364W | 2 |
| chr1:44456099-44456099 | p.P366P | 1 |
| chr1:44450680-44450680 | p.G231G | 1 |
| Top |
|
 |
| Point Mutation/ Tissue ID | 1 | 2 | 3 | 4 | 5 | 6 | 7 | 8 | 9 | 10 | 11 | 12 | 13 | 14 | 15 | 16 | 17 | 18 | 19 | 20 |
| # sample | 1 | 7 | 1 | 3 | 4 | 2 | 1 | 1 | 4 | 7 | 7 | |||||||||
| # mutation | 1 | 6 | 1 | 3 | 4 | 2 | 1 | 1 | 4 | 6 | 7 | |||||||||
| nonsynonymous SNV | 5 | 1 | 3 | 4 | 1 | 1 | 1 | 5 | 5 | |||||||||||
| synonymous SNV | 1 | 1 | 1 | 2 | 3 | 1 | 2 |
| cf) Tissue ID; Tissue type (1; BLCA[Bladder Urothelial Carcinoma], 2; BRCA[Breast invasive carcinoma], 3; CESC[Cervical squamous cell carcinoma and endocervical adenocarcinoma], 4; COAD[Colon adenocarcinoma], 5; GBM[Glioblastoma multiforme], 6; Glioma Low Grade, 7; HNSC[Head and Neck squamous cell carcinoma], 8; KICH[Kidney Chromophobe], 9; KIRC[Kidney renal clear cell carcinoma], 10; KIRP[Kidney renal papillary cell carcinoma], 11; LAML[Acute Myeloid Leukemia], 12; LUAD[Lung adenocarcinoma], 13; LUSC[Lung squamous cell carcinoma], 14; OV[Ovarian serous cystadenocarcinoma ], 15; PAAD[Pancreatic adenocarcinoma], 16; PRAD[Prostate adenocarcinoma], 17; SKCM[Skin Cutaneous Melanoma], 18:STAD[Stomach adenocarcinoma], 19:THCA[Thyroid carcinoma], 20:UCEC[Uterine Corpus Endometrial Carcinoma]) |
| Top |
| * We represented just top 10 SNVs. When you move the cursor on each content, you can see more deailed mutation information on the Tooltip. Those are primary_site, primary_histology, mutation(aa), pubmedID. |
| Genomic Position | Mutation(aa) | Unique sampleID count |
| chr1:44456091 | p.R364W,B4GALT2 | 3 |
| chr1:44456112 | p.F254L,B4GALT2 | 2 |
| chr1:44447558 | p.R171W,B4GALT2 | 2 |
| chr1:44450969 | p.R371W,B4GALT2 | 2 |
| chr1:44450592 | p.A36A,B4GALT2 | 1 |
| chr1:44451059 | p.G231G,B4GALT2 | 1 |
| chr1:44446914 | p.F246F,B4GALT2 | 1 |
| chr1:44450593 | p.S77P,B4GALT2 | 1 |
| chr1:44451195 | p.G78R,B4GALT2 | 1 |
| chr1:44446940 | p.F254C,B4GALT2 | 1 |
| * Copy number data were extracted from TCGA using R package TCGA-Assembler. The URLs of all public data files on TCGA DCC data server were gathered on Jan-05-2015. Function ProcessCNAData in TCGA-Assembler package was used to obtain gene-level copy number value which is calculated as the average copy number of the genomic region of a gene. |
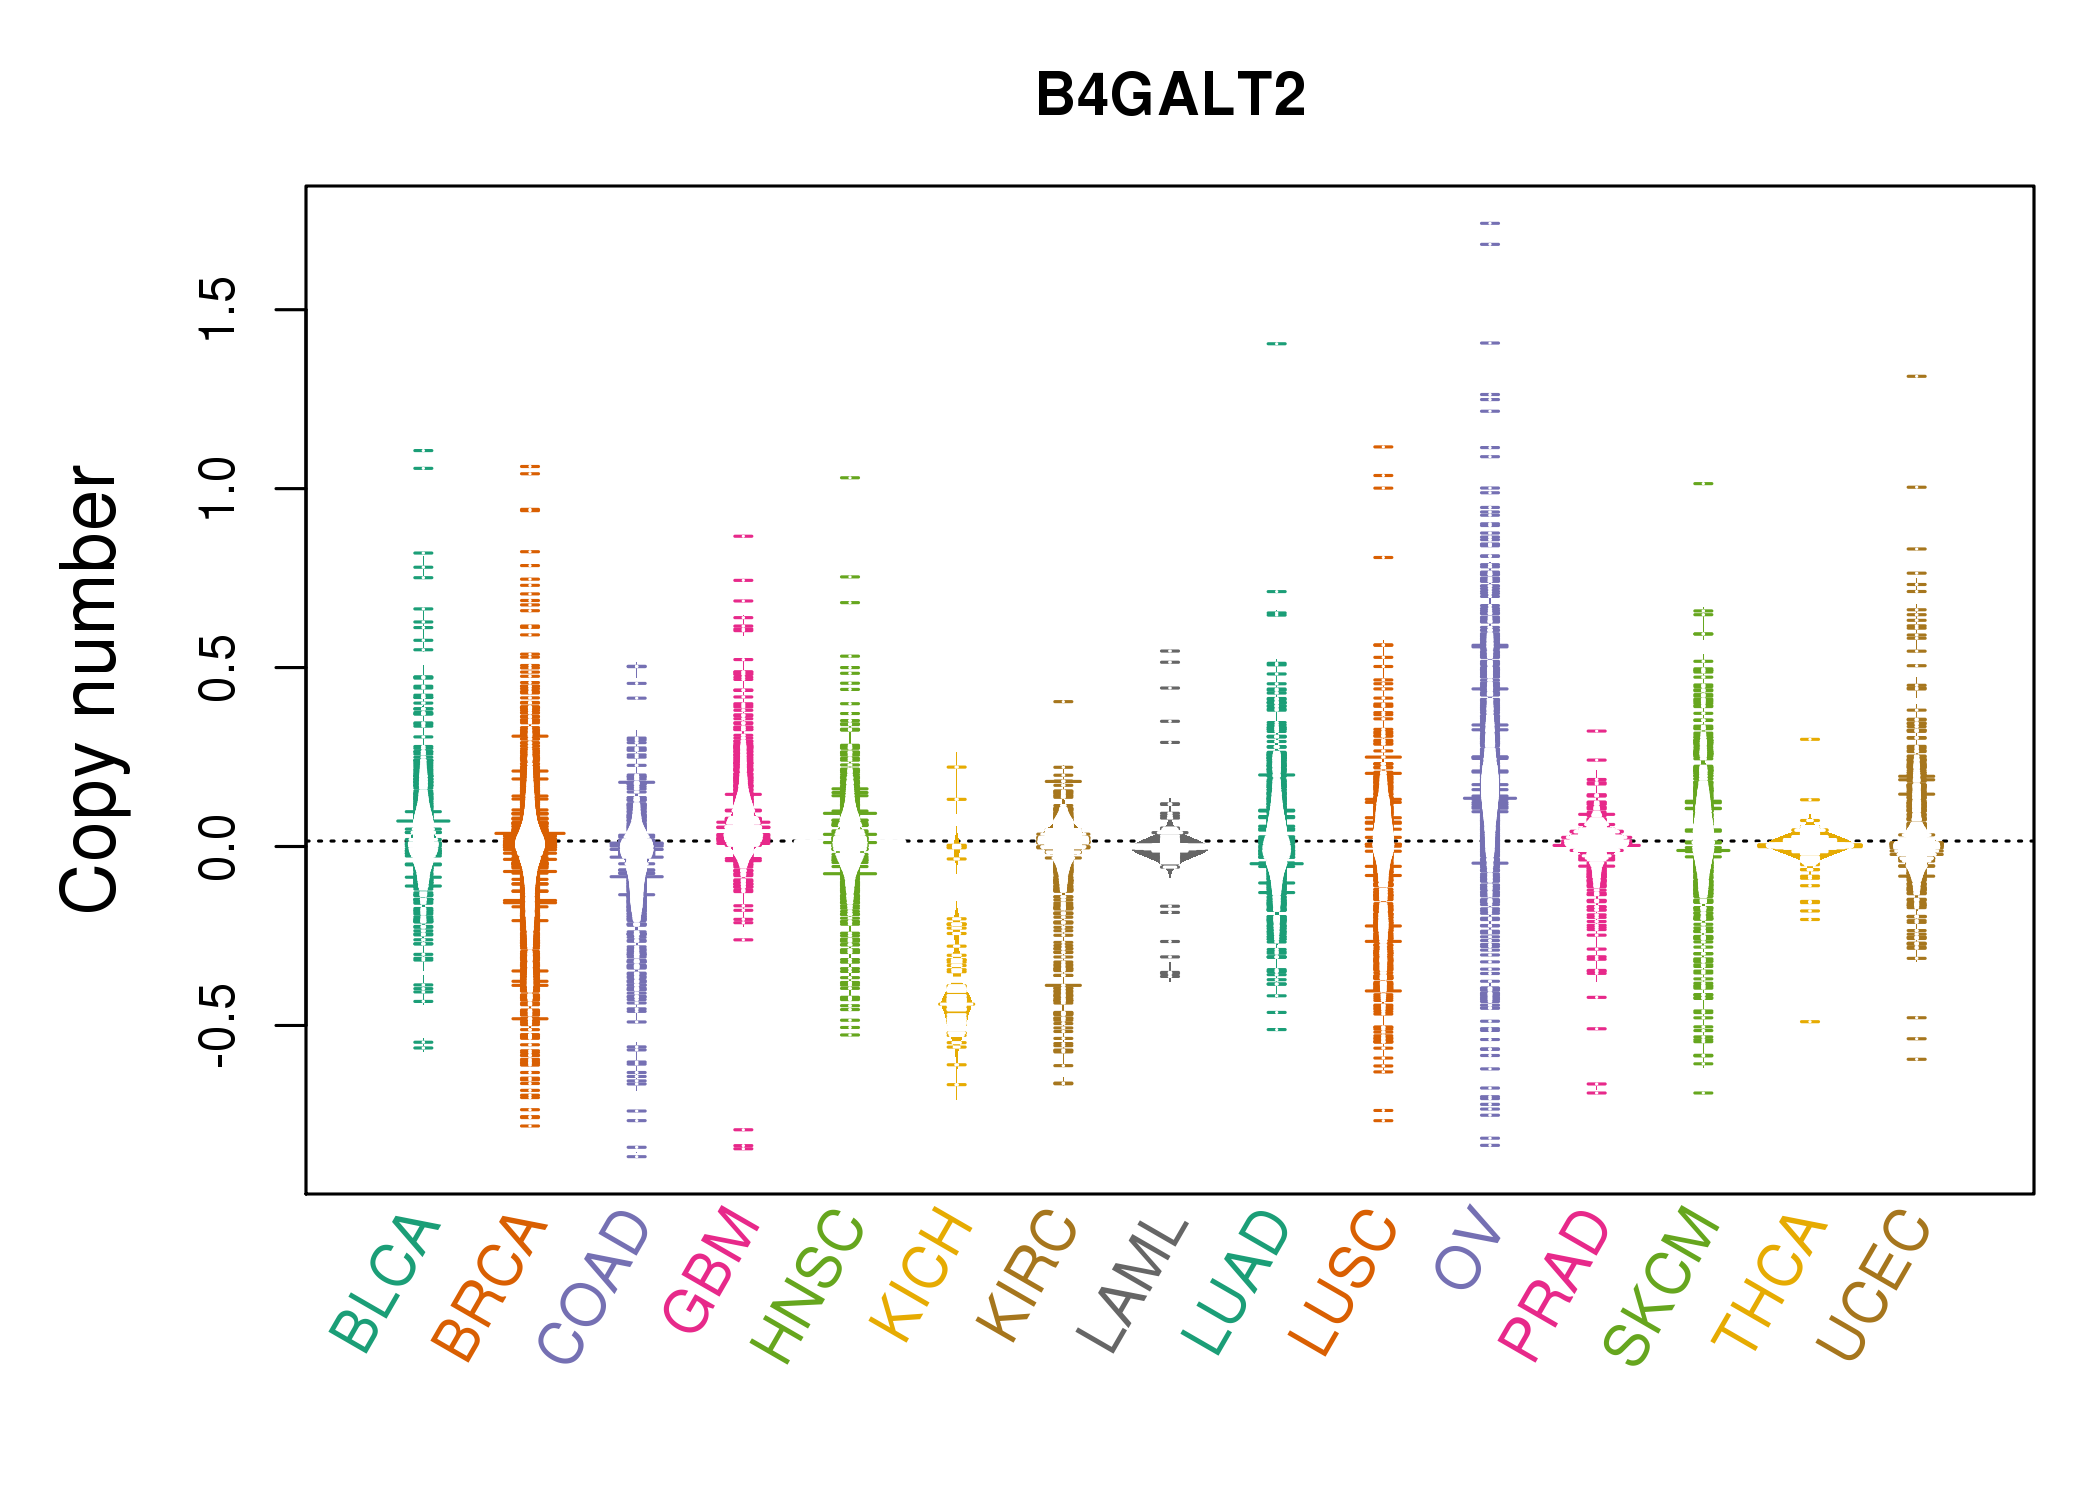 |
| cf) Tissue ID[Tissue type]: BLCA[Bladder Urothelial Carcinoma], BRCA[Breast invasive carcinoma], CESC[Cervical squamous cell carcinoma and endocervical adenocarcinoma], COAD[Colon adenocarcinoma], GBM[Glioblastoma multiforme], Glioma Low Grade, HNSC[Head and Neck squamous cell carcinoma], KICH[Kidney Chromophobe], KIRC[Kidney renal clear cell carcinoma], KIRP[Kidney renal papillary cell carcinoma], LAML[Acute Myeloid Leukemia], LUAD[Lung adenocarcinoma], LUSC[Lung squamous cell carcinoma], OV[Ovarian serous cystadenocarcinoma ], PAAD[Pancreatic adenocarcinoma], PRAD[Prostate adenocarcinoma], SKCM[Skin Cutaneous Melanoma], STAD[Stomach adenocarcinoma], THCA[Thyroid carcinoma], UCEC[Uterine Corpus Endometrial Carcinoma] |
| Top |
| Gene Expression for B4GALT2 |
| * CCLE gene expression data were extracted from CCLE_Expression_Entrez_2012-10-18.res: Gene-centric RMA-normalized mRNA expression data. |
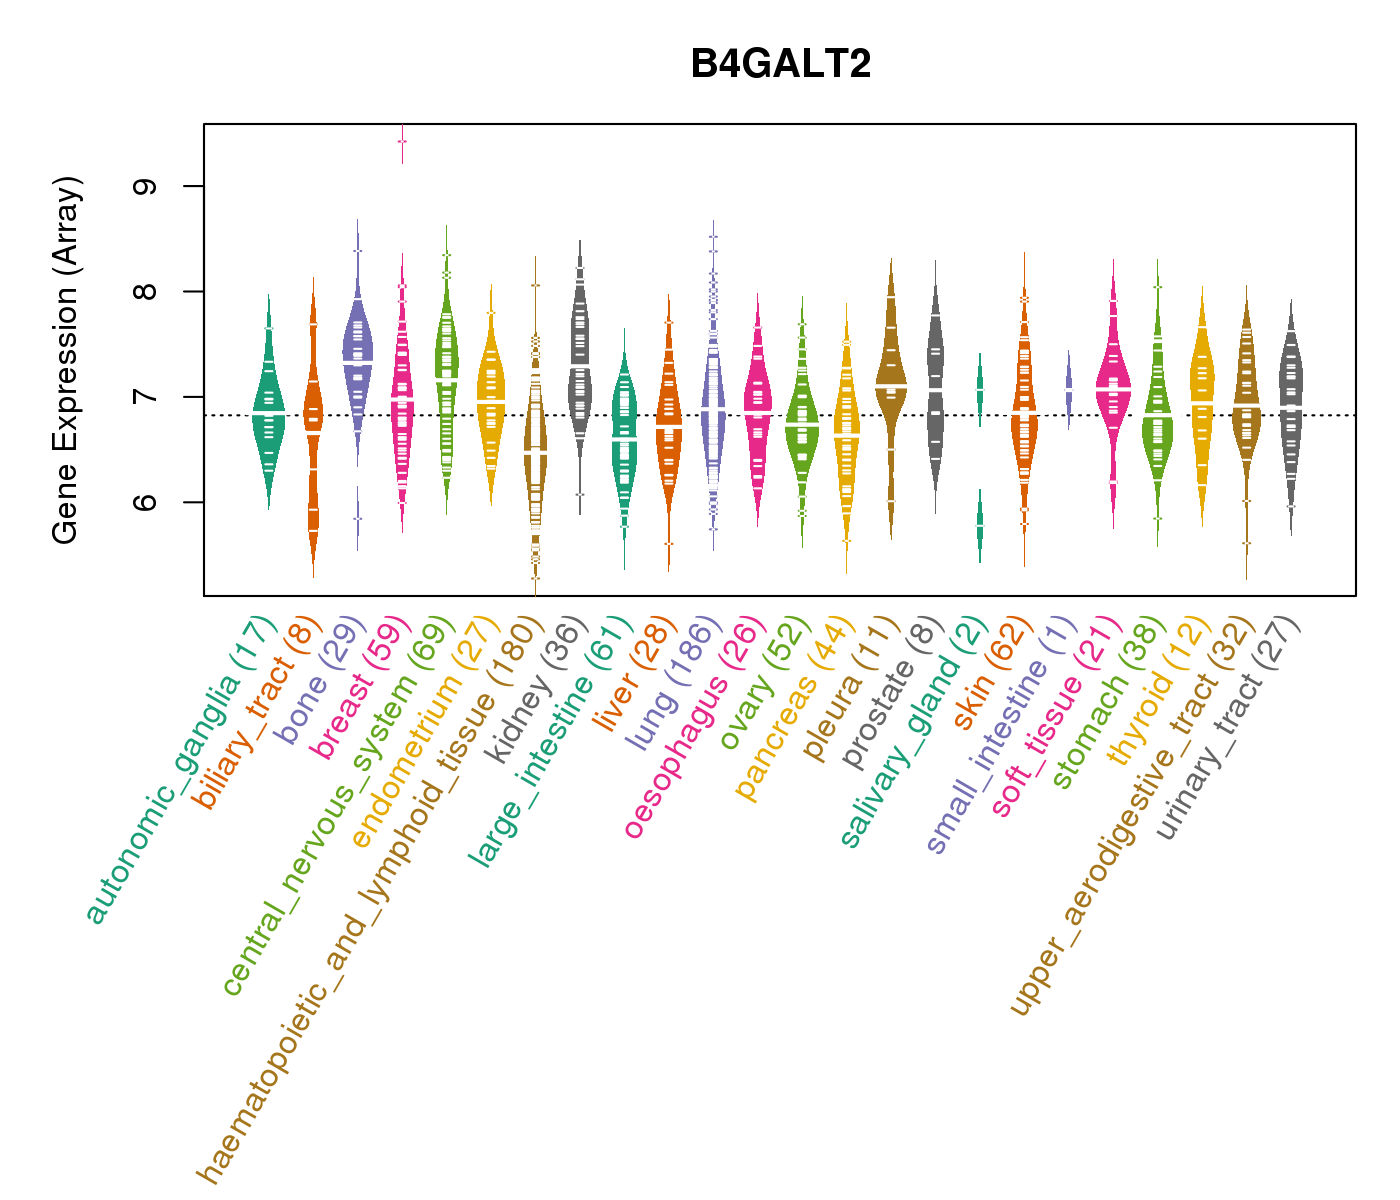 |
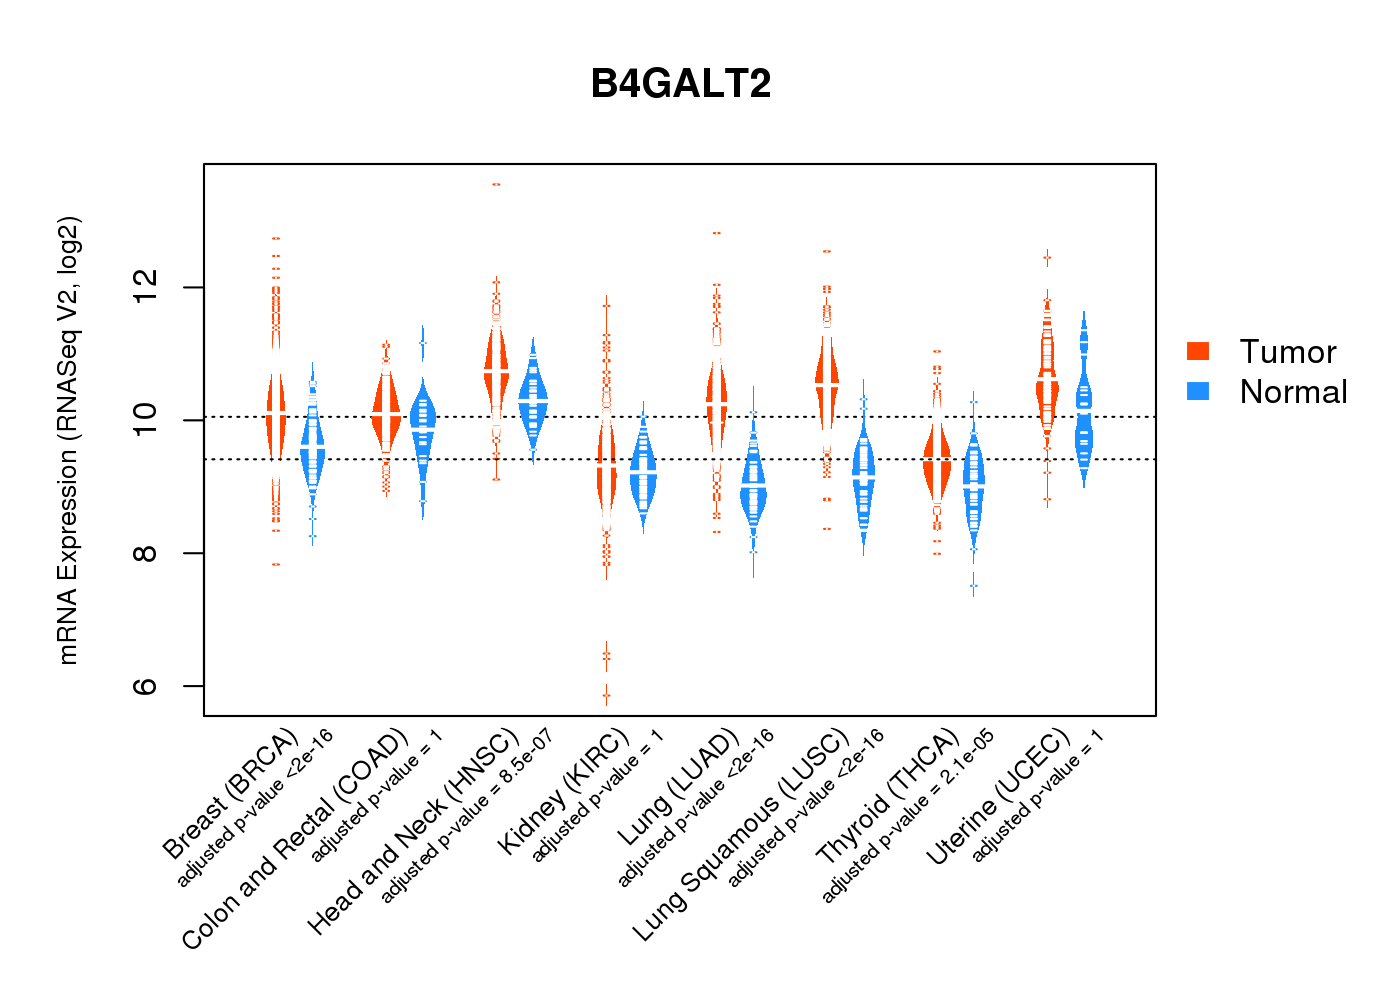
| * Normalized gene expression data of RNASeqV2 was extracted from TCGA using R package TCGA-Assembler. The URLs of all public data files on TCGA DCC data server were gathered at Jan-05-2015. Only eight cancer types have enough normal control samples for differential expression analysis. (t test, adjusted p<0.05 (using Benjamini-Hochberg FDR)) |
 |
| Top |
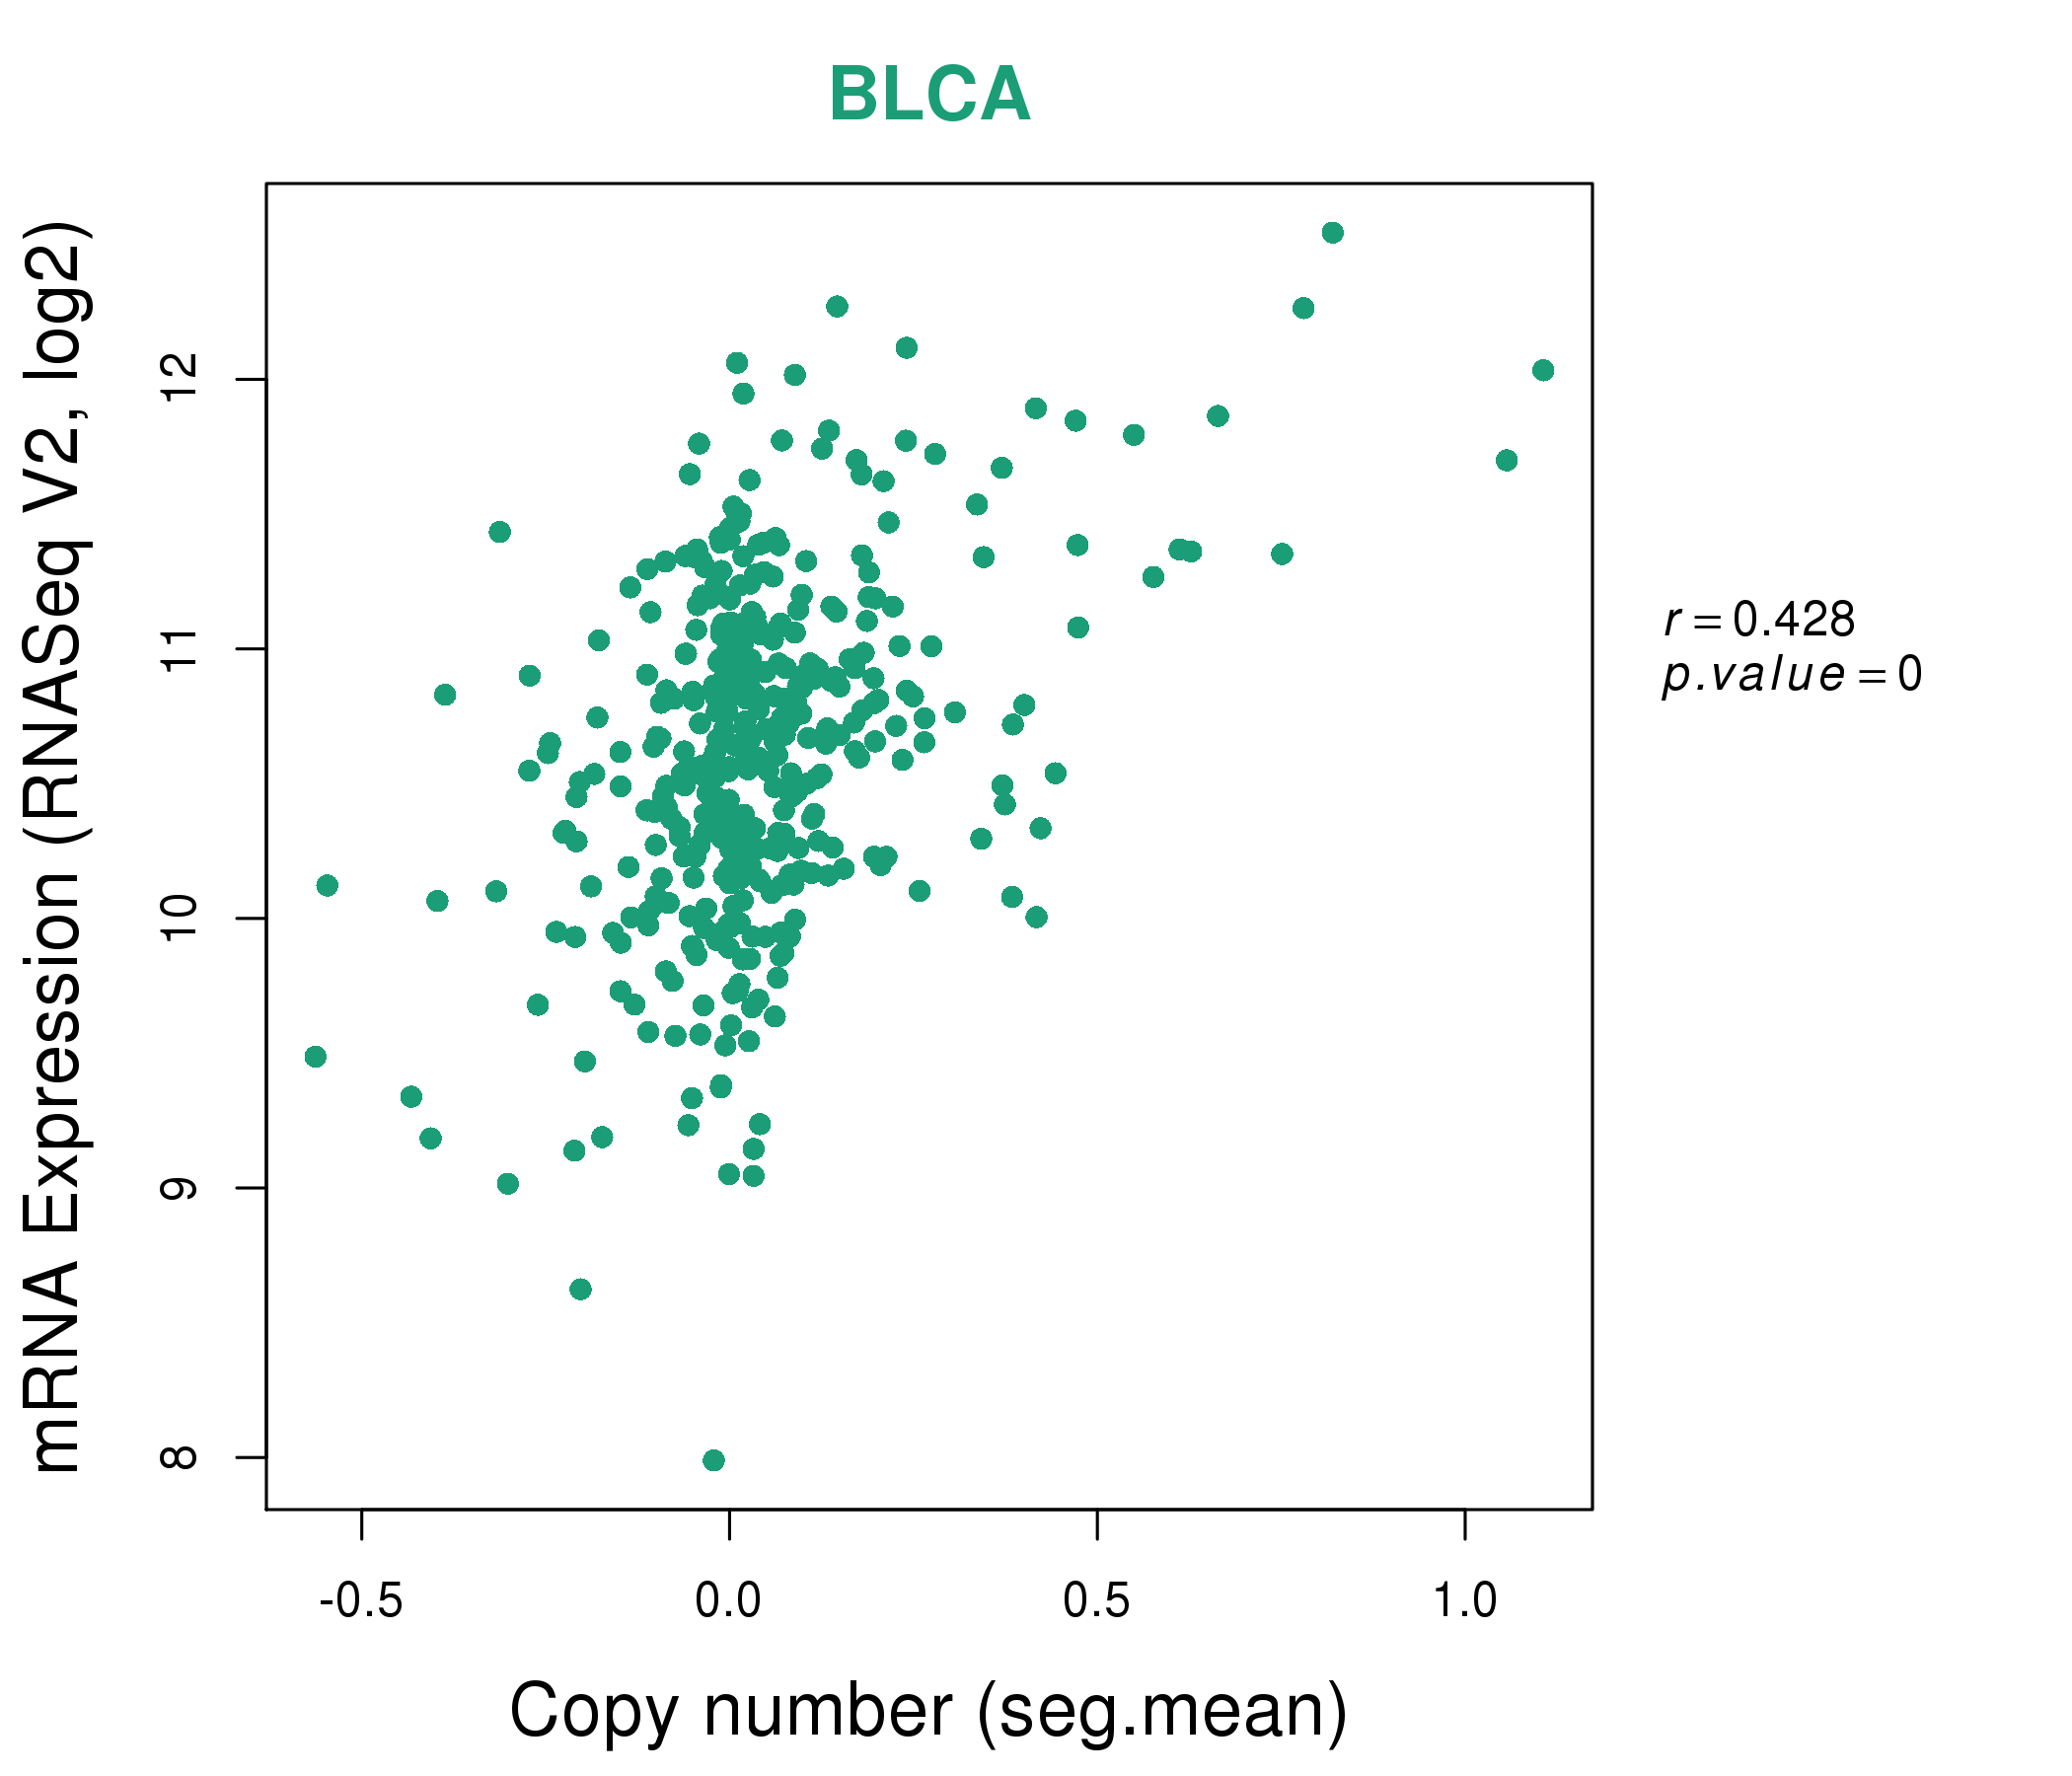
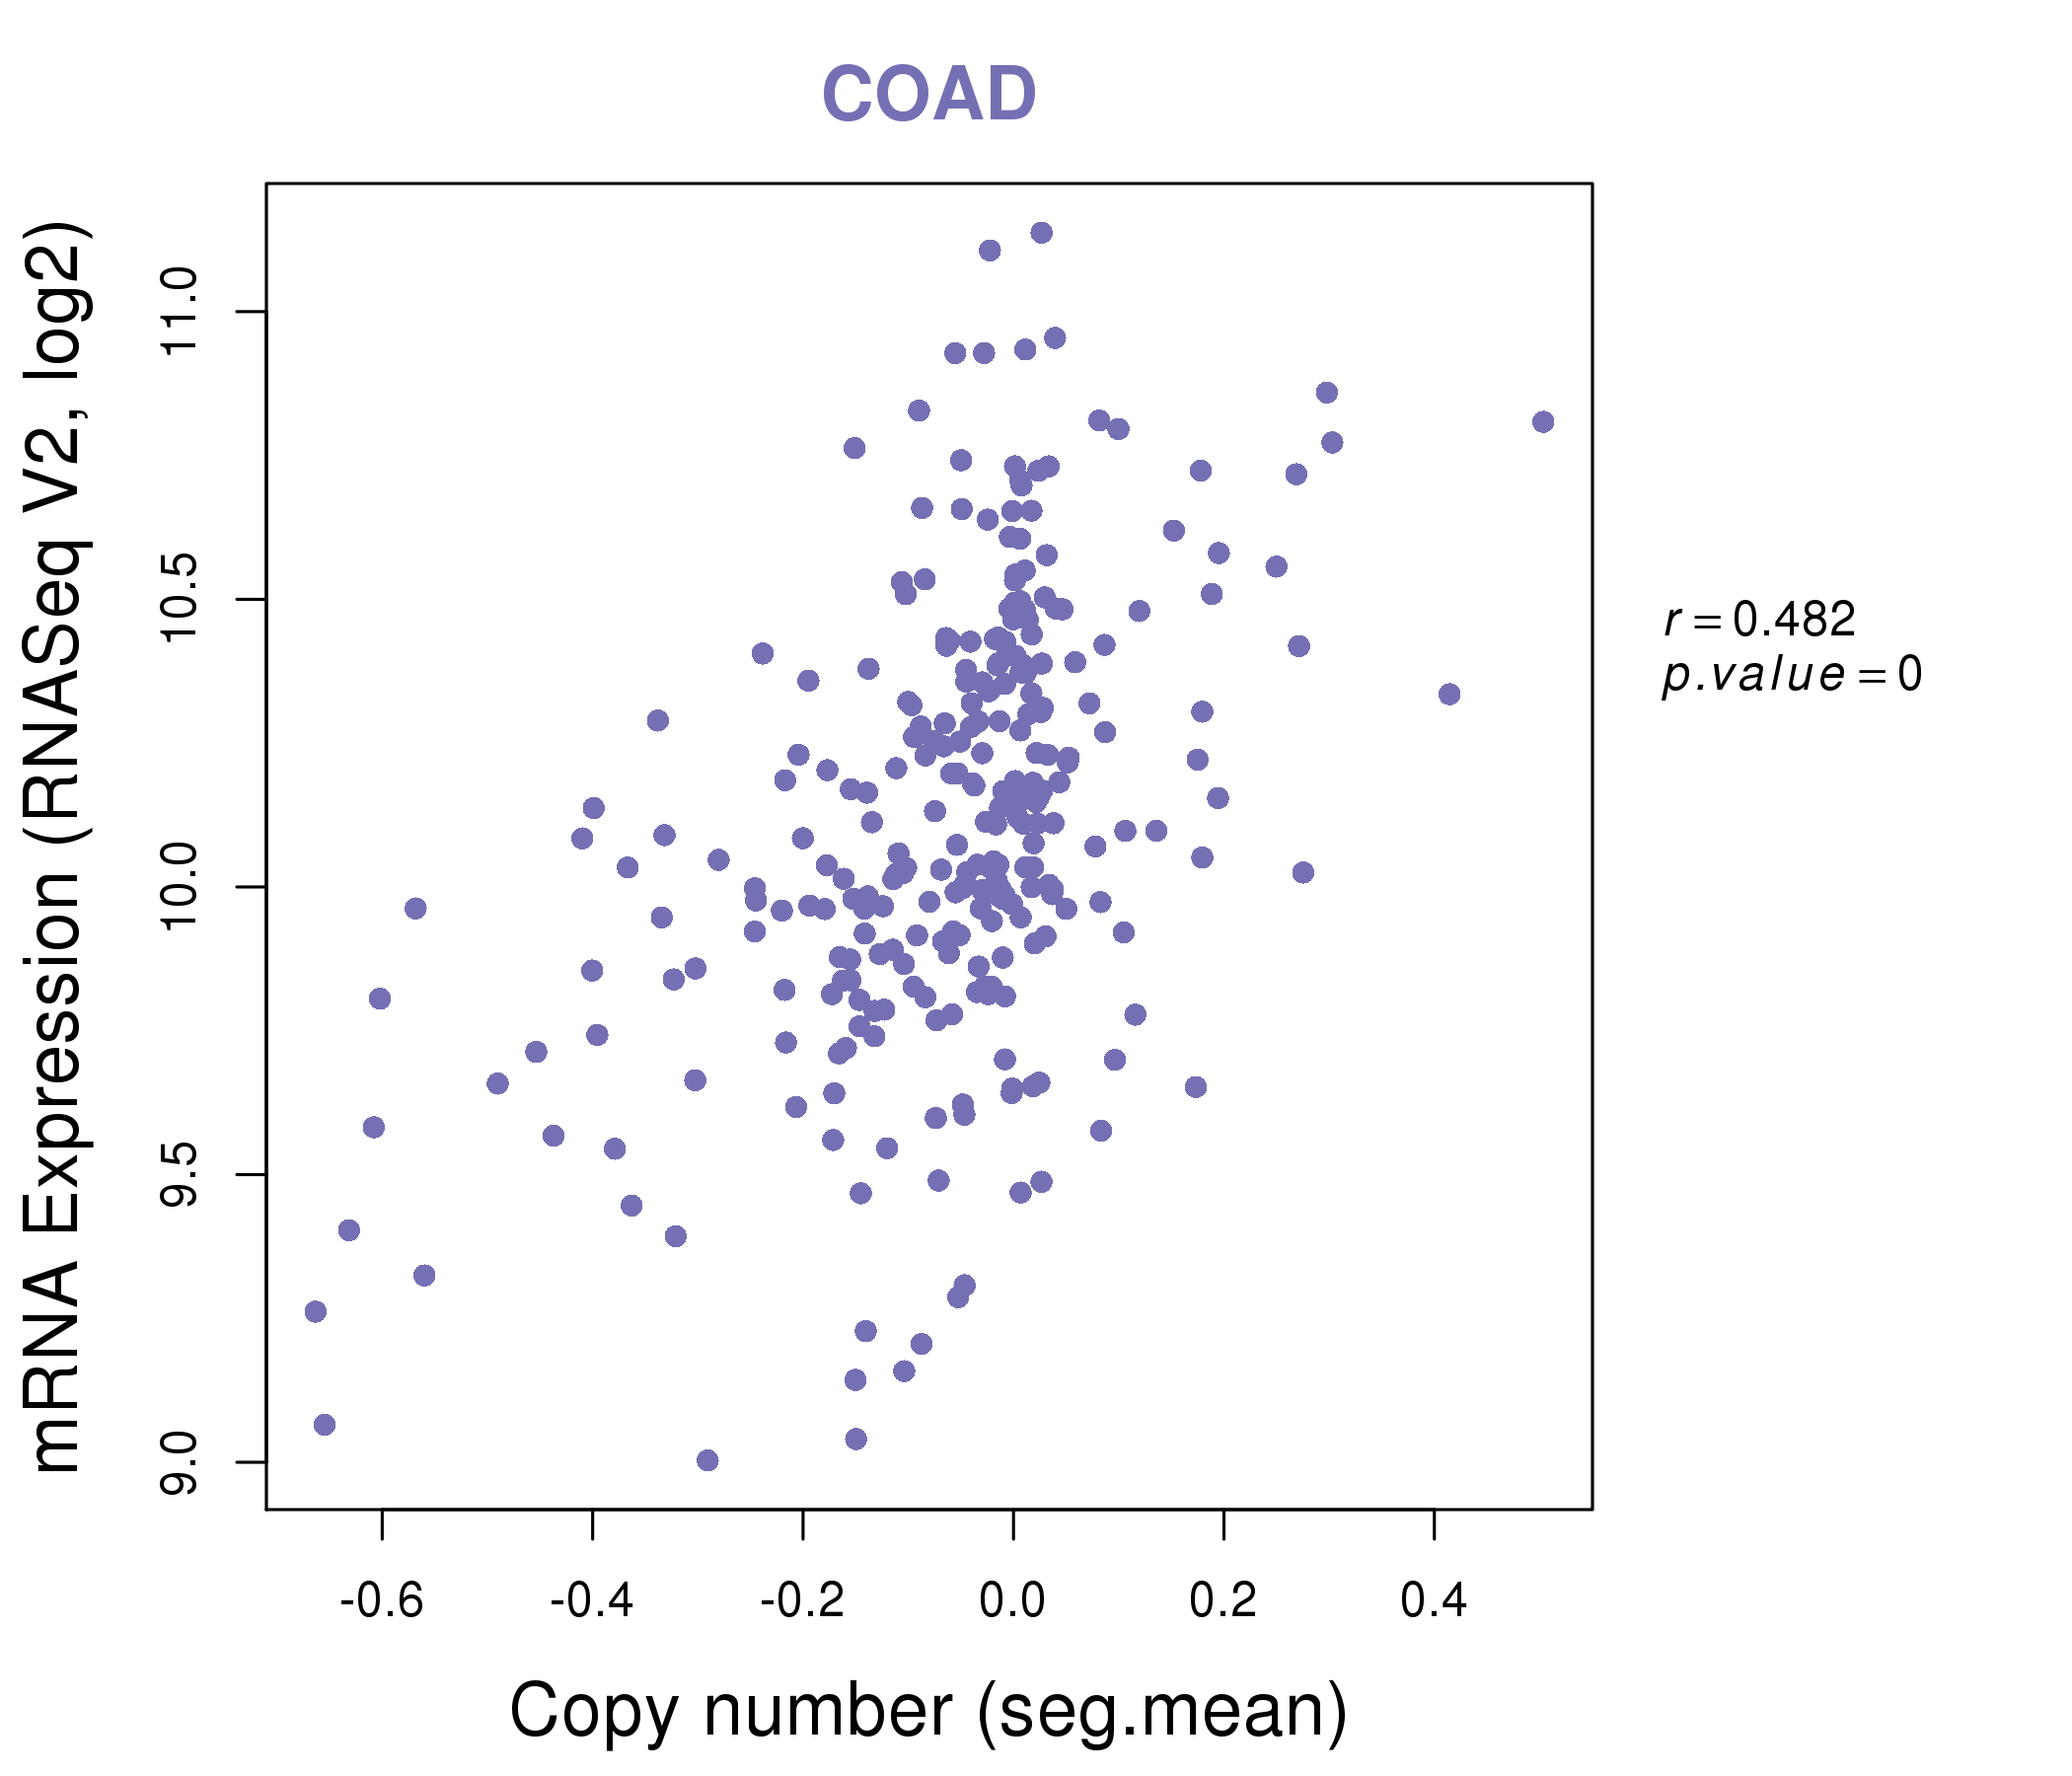
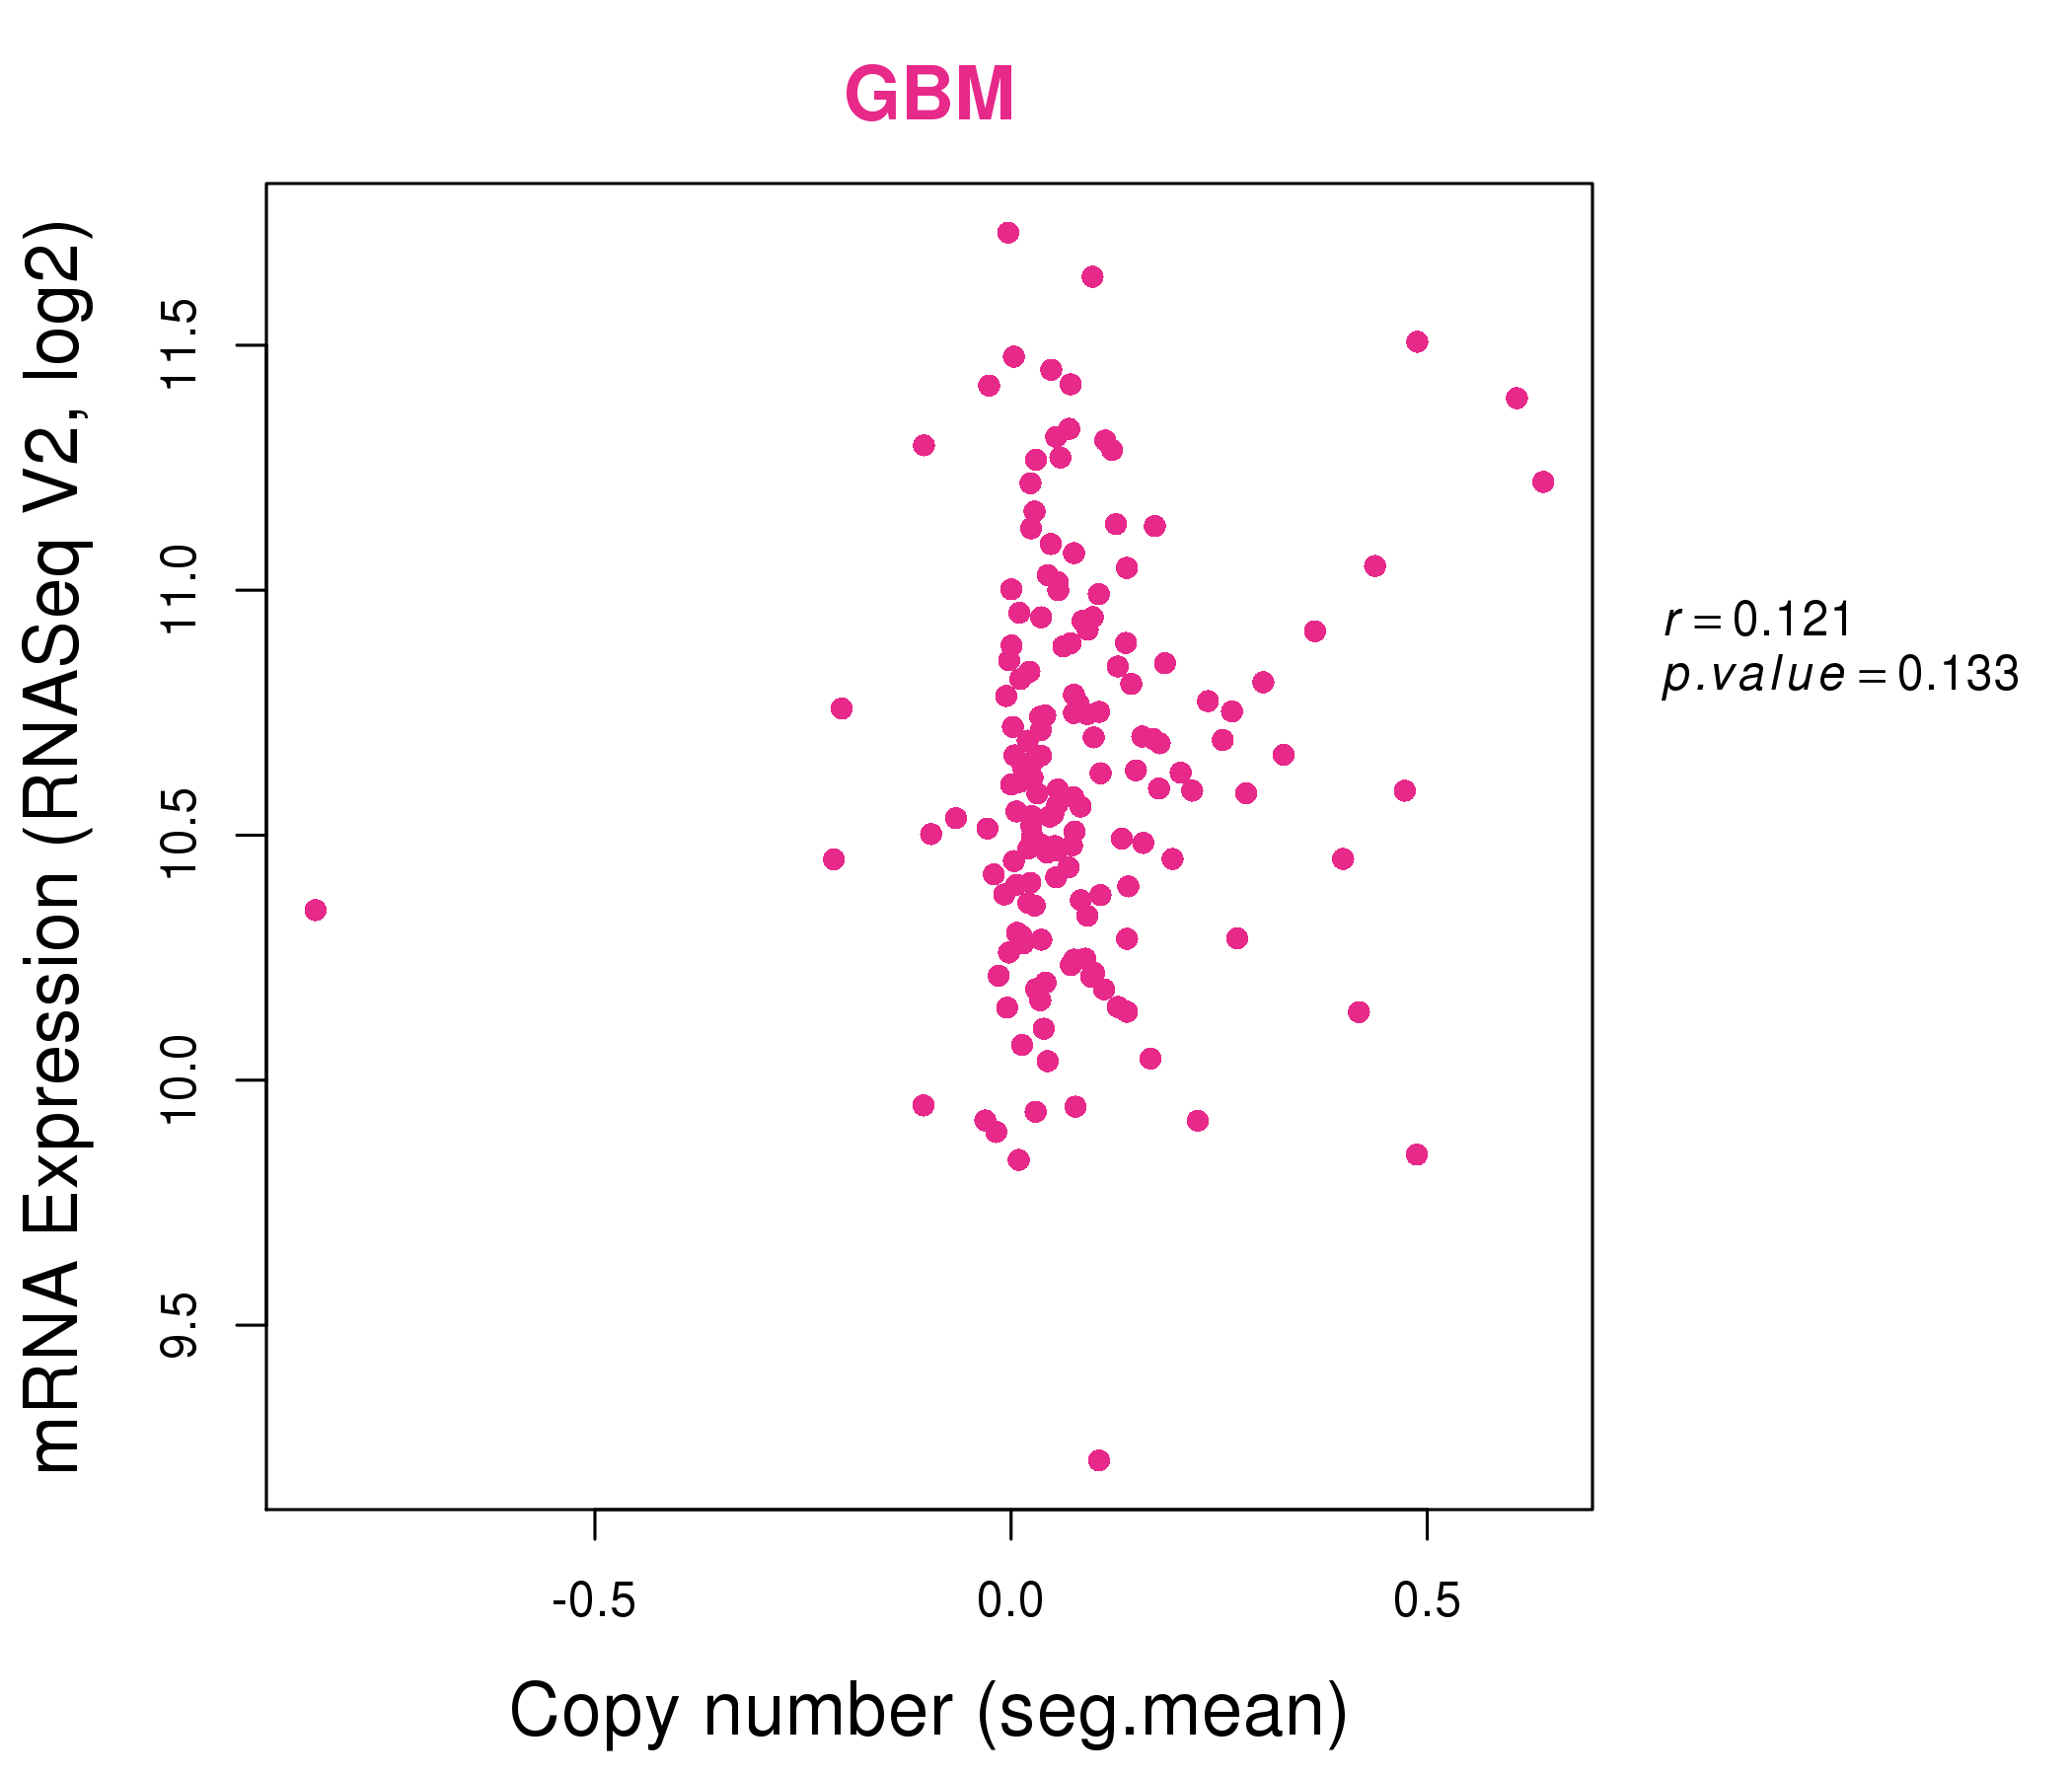
| * This plots show the correlation between CNV and gene expression. |
: Open all plots for all cancer types
 |
|
 |
|

| Top |
| Gene-Gene Network Information |
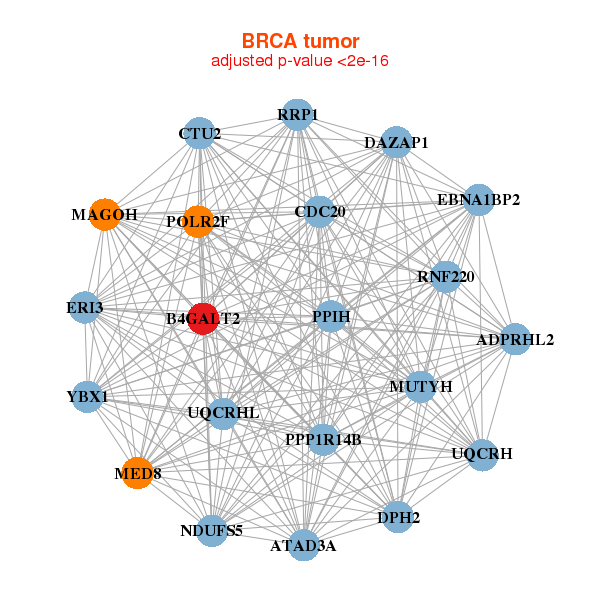
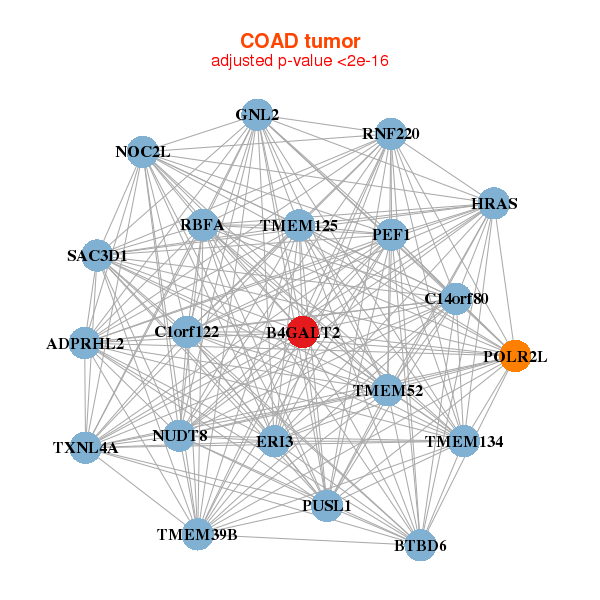
| * Co-Expression network figures were drawn using R package igraph. Only the top 20 genes with the highest correlations were shown. Red circle: input gene, orange circle: cell metabolism gene, sky circle: other gene |
: Open all plots for all cancer types
 |
| ||||
| ADPRHL2,ATAD3A,B4GALT2,CDC20,CTU2,DAZAP1,DPH2, EBNA1BP2,ERI3,MAGOH,MED8,MUTYH,NDUFS5,POLR2F, PPIH,PPP1R14B,RNF220,RRP1,UQCRH,UQCRHL,YBX1 | ANXA11,AP2M1,B4GALT2,KXD1,C1orf216,CCM2,DCTN2, EFEMP2,ISOC2,ITFG3,NAA38,MON1A,PSMB5,PSMB6, PSMC3,SEC13,STOML1,TXNL4A,UROD,USF2,YIF1A | ||||
 |
| ||||
| ADPRHL2,B4GALT2,BTBD6,C14orf80,RBFA,C1orf122,ERI3, GNL2,HRAS,NOC2L,NUDT8,PEF1,POLR2L,PUSL1, RNF220,SAC3D1,TMEM125,TMEM134,TMEM39B,TMEM52,TXNL4A | B4GALT2,CALU,CLUAP1,CUEDC1,DEGS1,KDELC1,KLHL23, LPPR2,LRRC20,LZTS2,MAGED2,NRSN2,NT5M,PEA15, PTMS,RPL23AP82,SLC39A13,SRPK3,ST3GAL3,TEAD2,TNFSF12 |
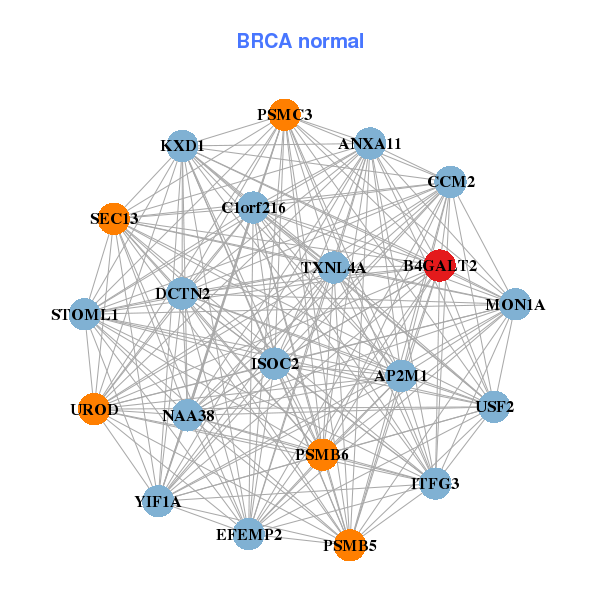
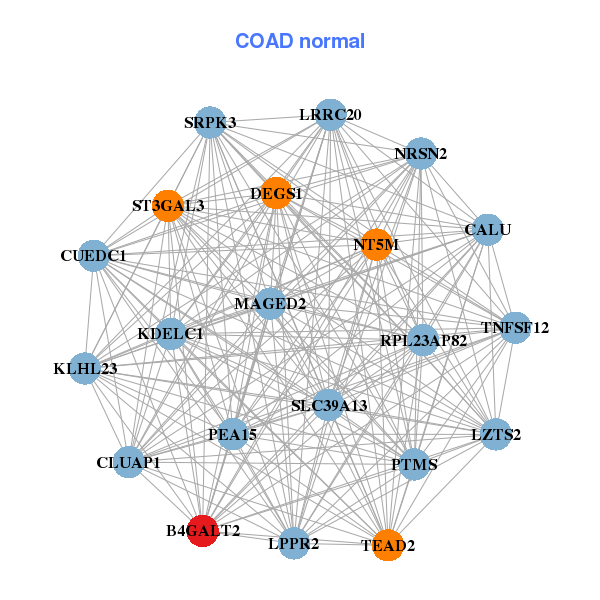
| * Co-Expression network figures were drawn using R package igraph. Only the top 20 genes with the highest correlations were shown. Red circle: input gene, orange circle: cell metabolism gene, sky circle: other gene |
: Open all plots for all cancer types
| Top |
: Open all interacting genes' information including KEGG pathway for all interacting genes from DAVID
| Top |
| Pharmacological Information for B4GALT2 |
| DB Category | DB Name | DB's ID and Url link |
| * Gene Centered Interaction Network. |
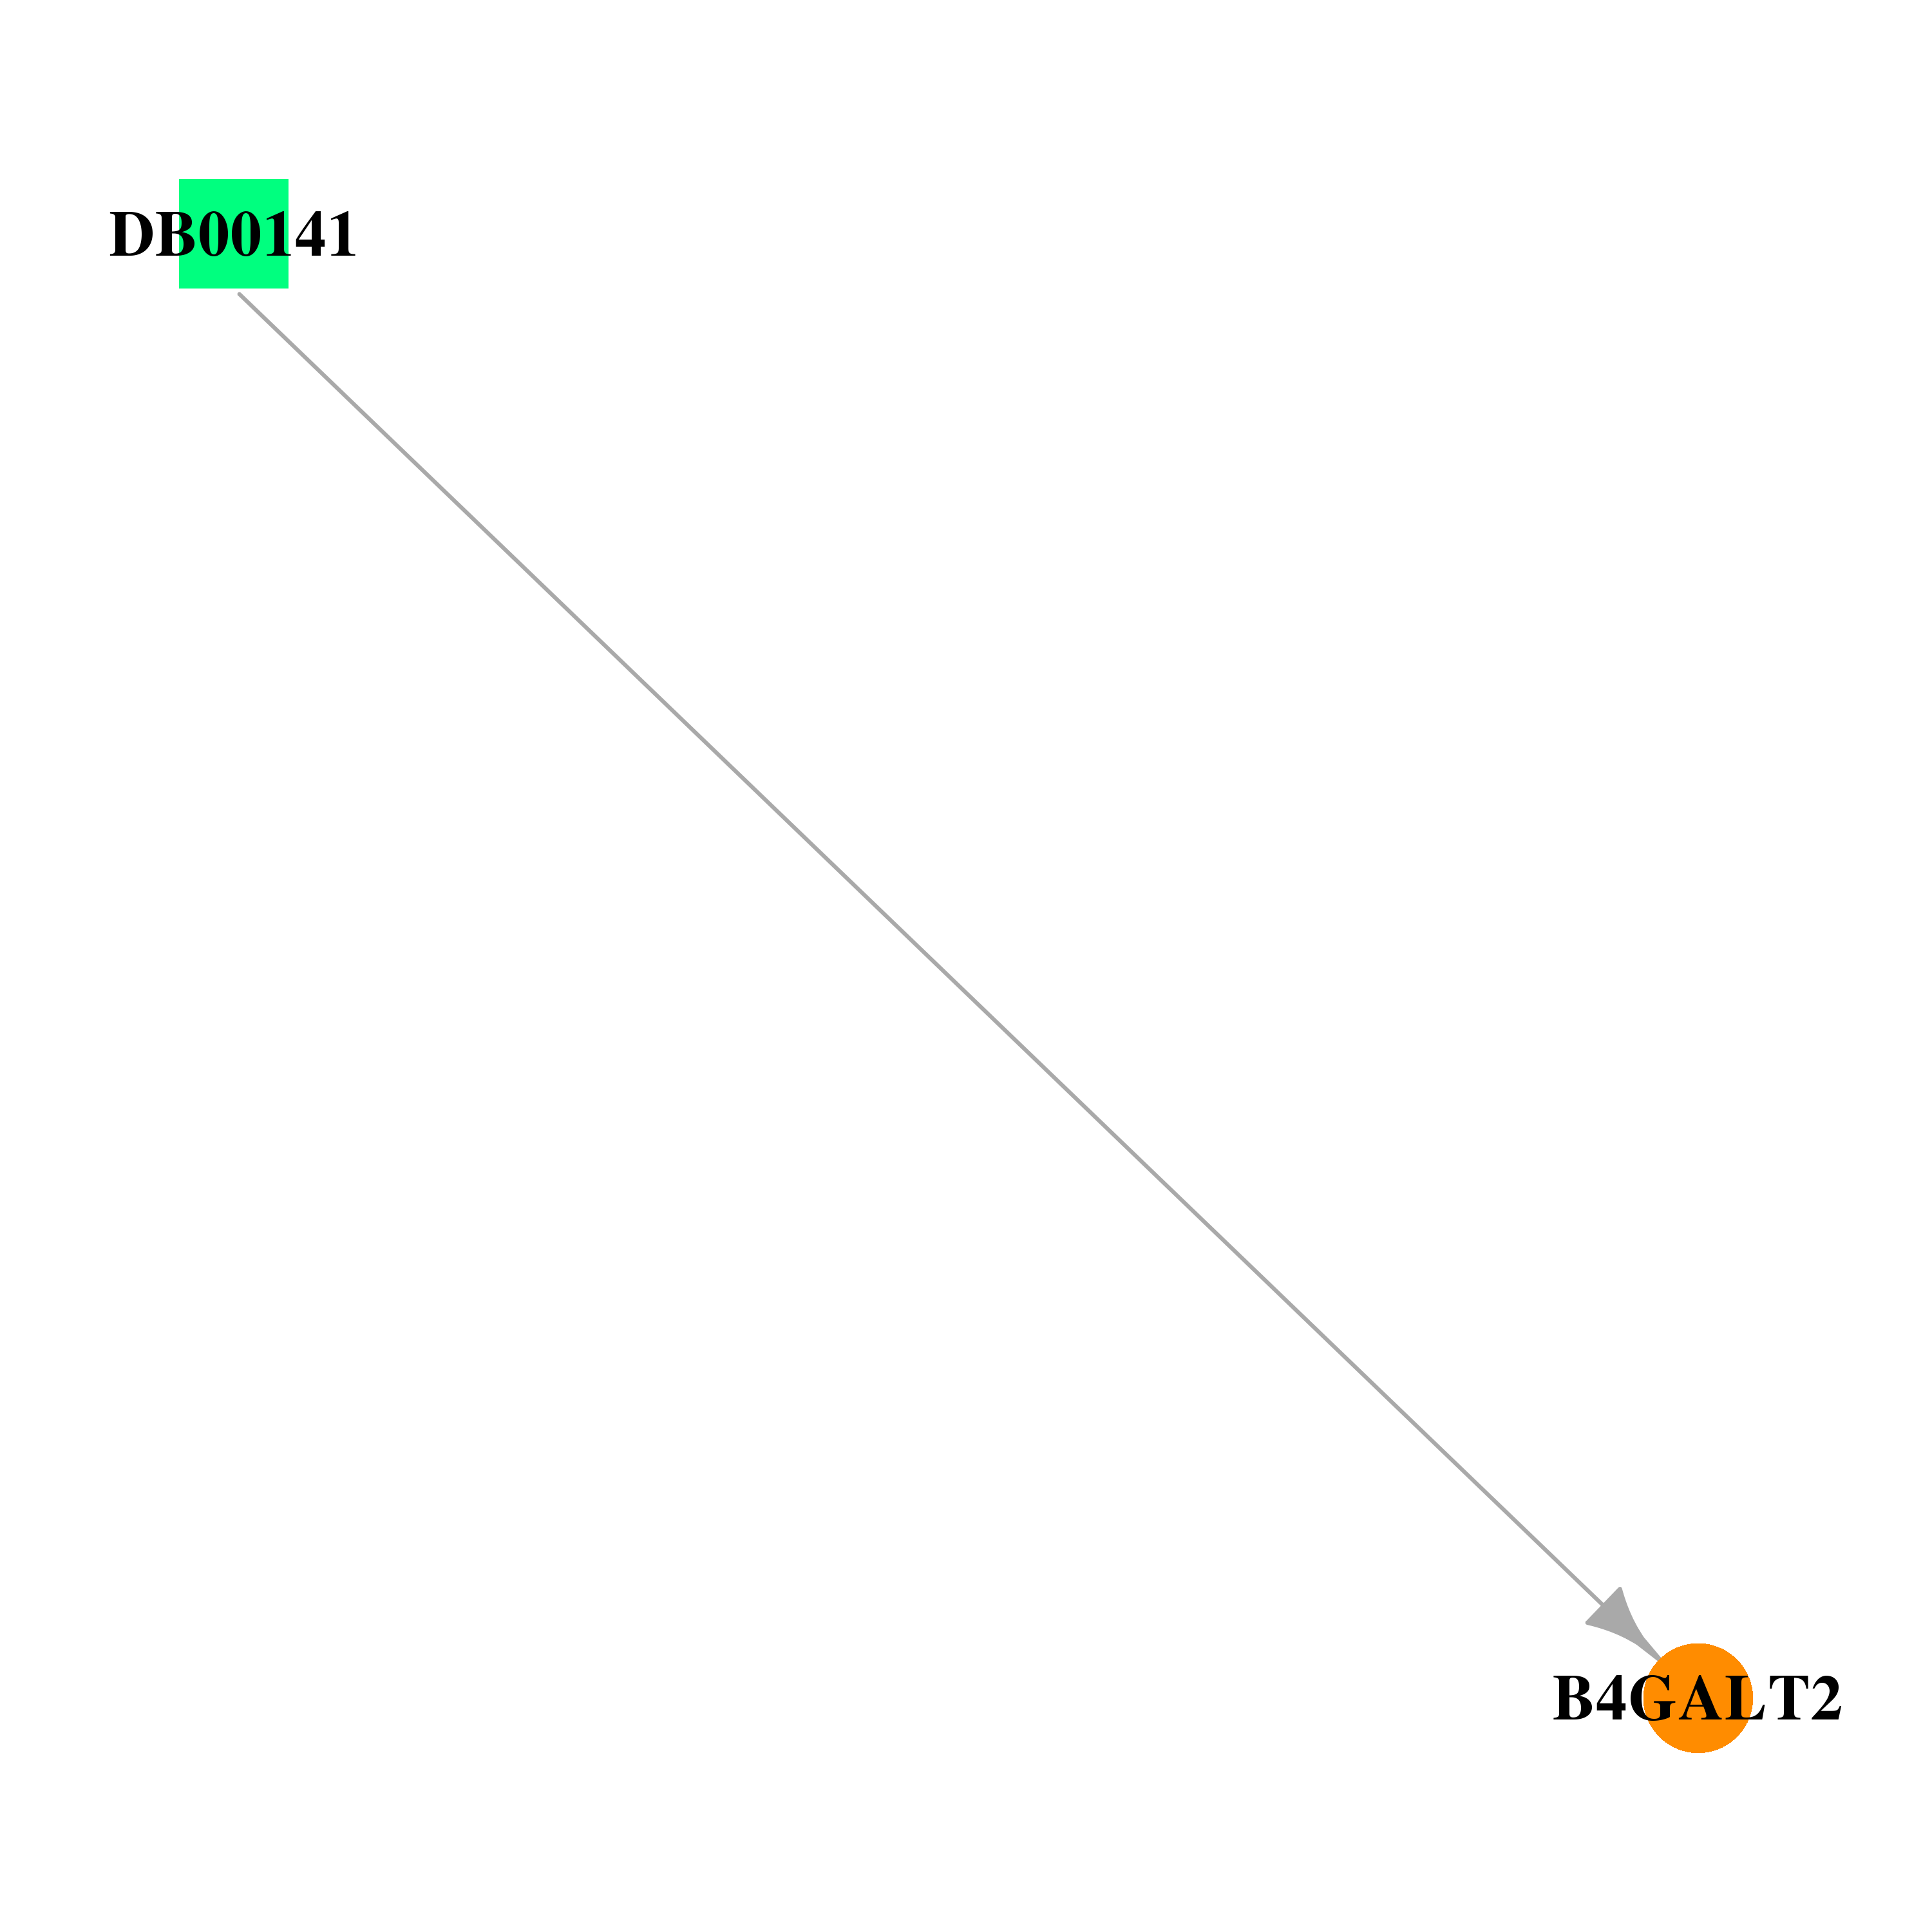 |
| * Drug Centered Interaction Network. |
| DrugBank ID | Target Name | Drug Groups | Generic Name | Drug Centered Network | Drug Structure |
| DB00141 | UDP-Gal:betaGlcNAc beta 1,4- galactosyltransferase, polypeptide 2 | approved; nutraceutical | N-Acetyl-D-glucosamine | 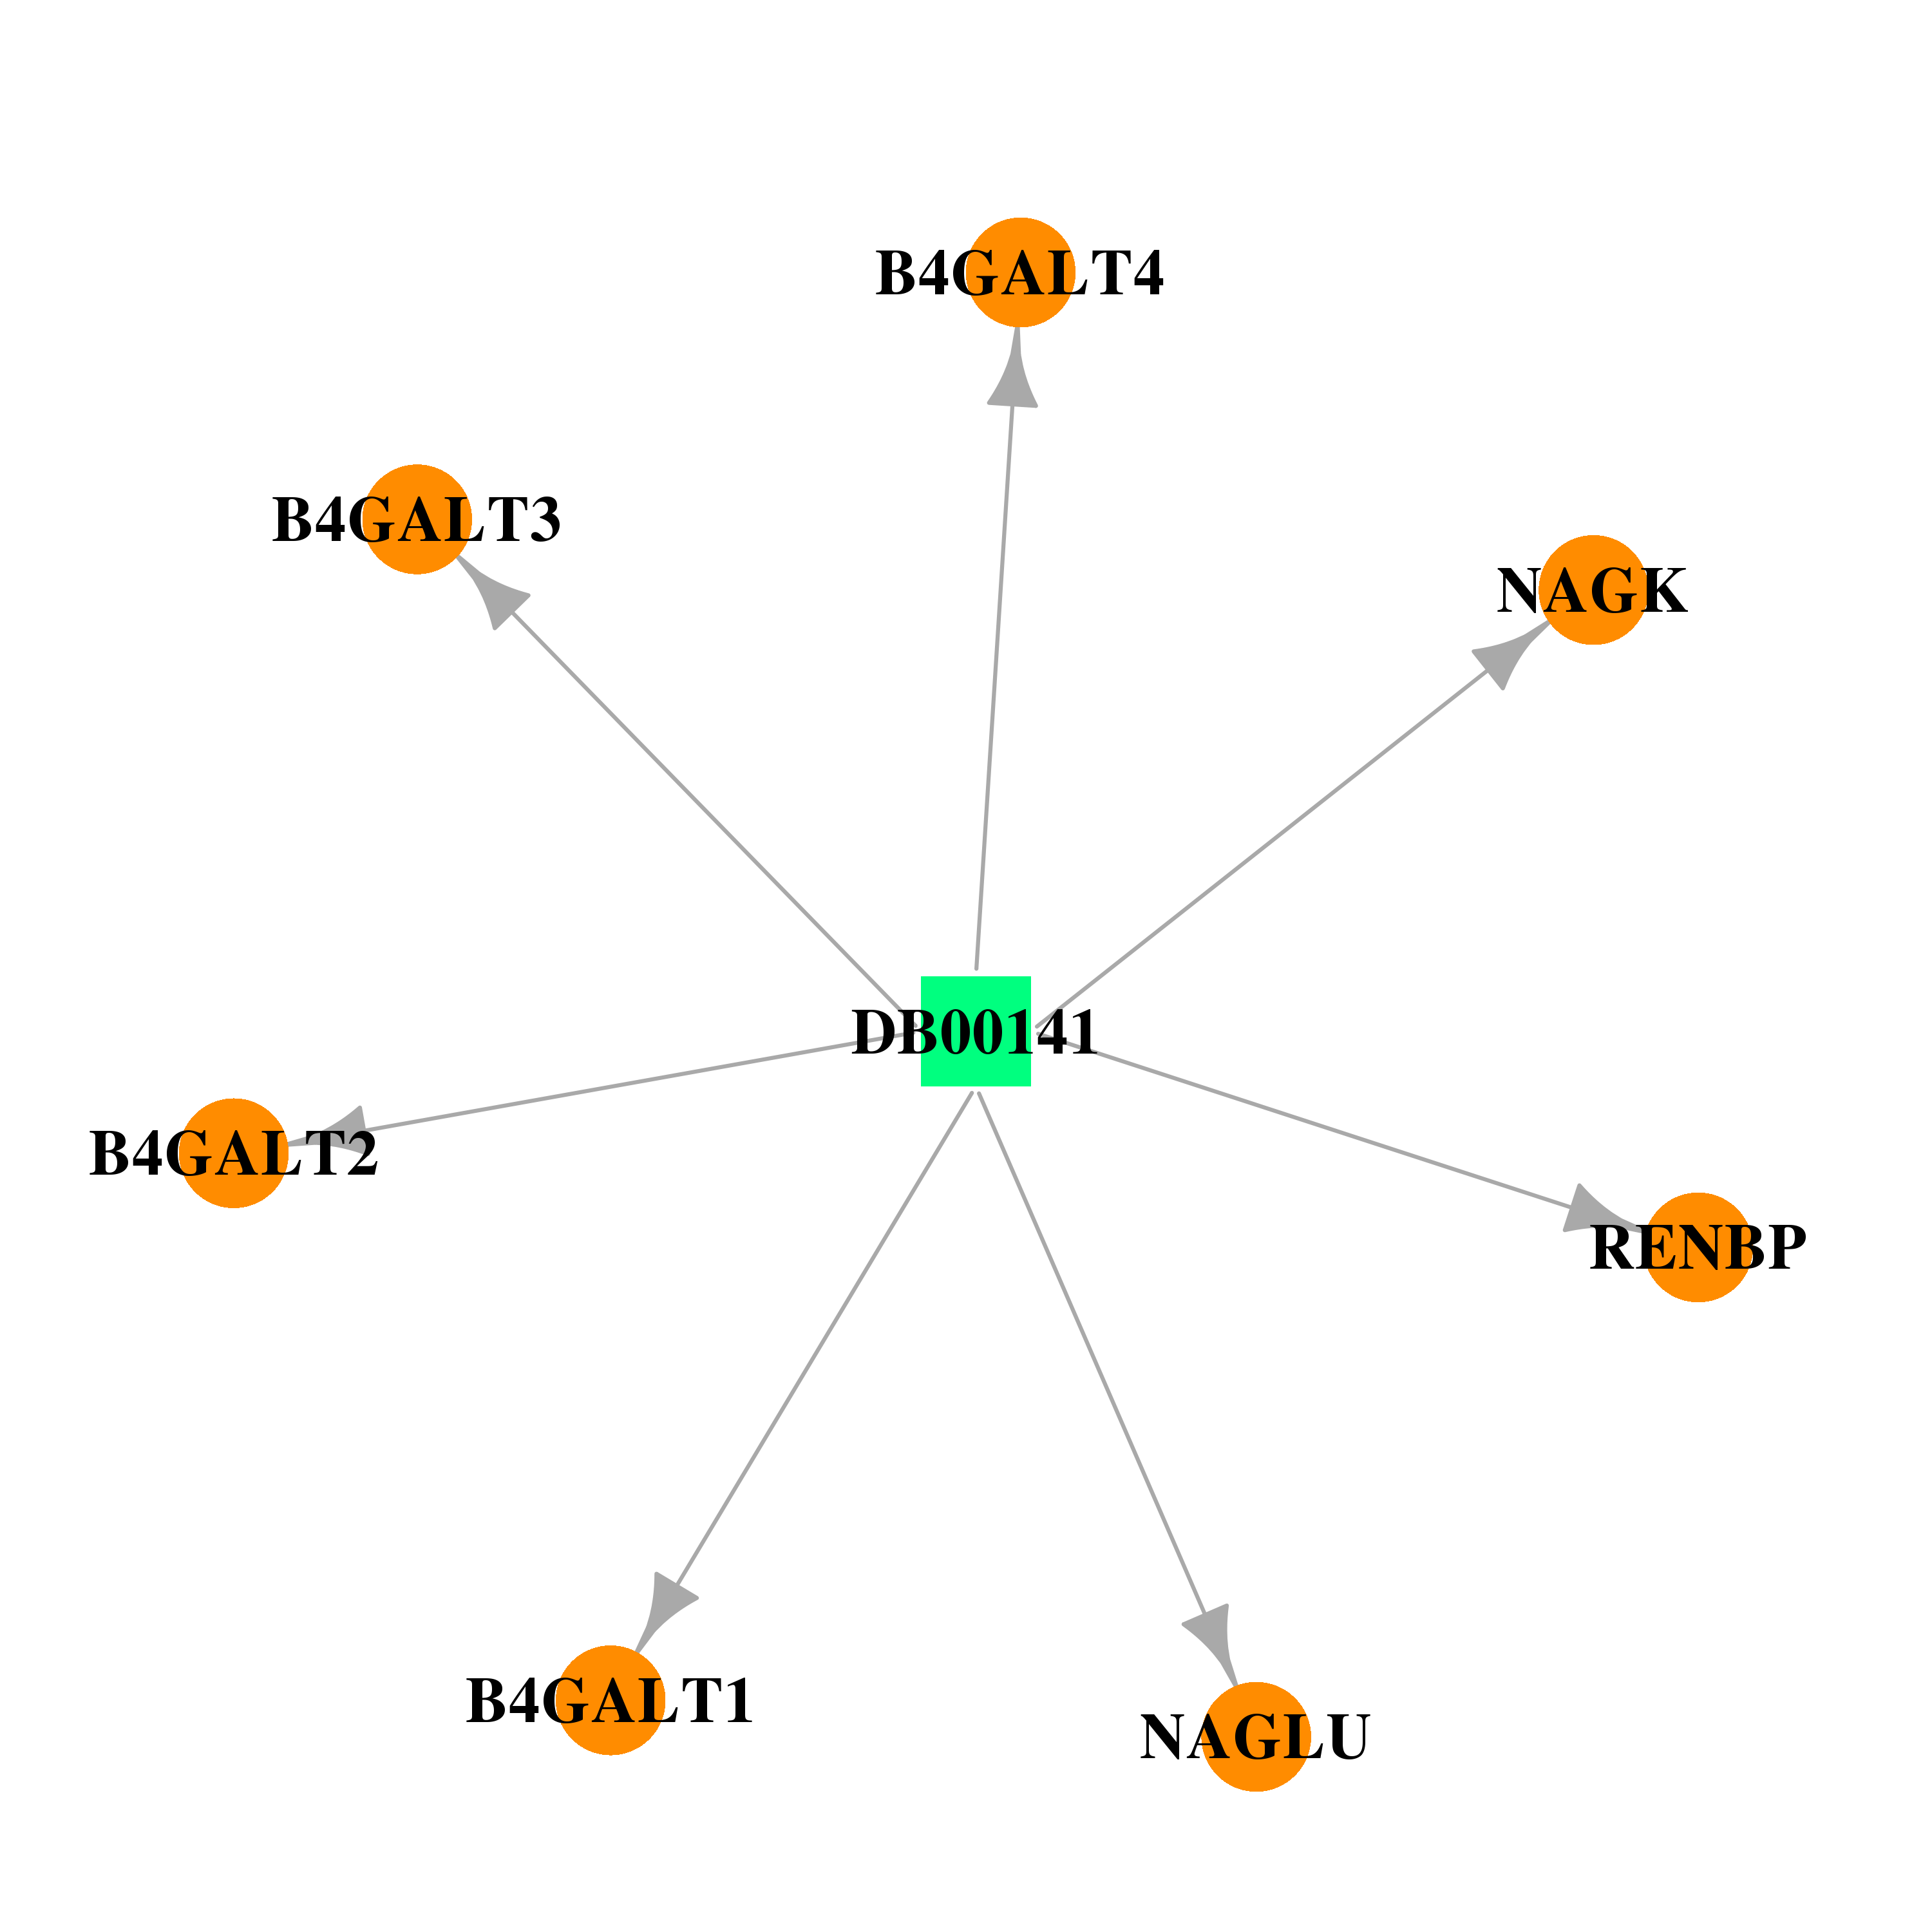 |  |
| Top |
| Cross referenced IDs for B4GALT2 |
| * We obtained these cross-references from Uniprot database. It covers 150 different DBs, 18 categories. http://www.uniprot.org/help/cross_references_section |
: Open all cross reference information
|
Copyright © 2016-Present - The Univsersity of Texas Health Science Center at Houston @ |