|
|||||||||||||||||||||||||||||||||||||||||||||||||||||||||||||||||||||||||||||||||||||||||||||||||||||||||||||||||||||||||||||||||||||||||||||||||||||||||||||||||||||||||||||||||||||||||||||||||||||||||||||||||||||||||||||||||||||||||||||||||||||||||||||||||||||||||||||||||||||||||||||||||||||||||||||||||||||||||||||||||||||||||||||||||||||||||||||||||||||||||||||||||||||||||||||||||||||||||||||||||||||||||||
| |
| Phenotypic Information (metabolism pathway, cancer, disease, phenome) |
| |
| |
| Gene-Gene Network Information: Co-Expression Network, Interacting Genes & KEGG |
| |
|


| Gene Summary for ABCC3 |
| Basic gene info. | Gene symbol | ABCC3 |
| Gene name | ATP-binding cassette, sub-family C (CFTR/MRP), member 3 | |
| Synonyms | ABC31|EST90757|MLP2|MOAT-D|MRP3|cMOAT2 | |
| Cytomap | UCSC genome browser: 17q22 | |
| Genomic location | chr17 :48712217-48769063 | |
| Type of gene | protein-coding | |
| RefGenes | NM_001144070.1, NM_003786.3,NM_020037.1,NM_020038.1, | |
| Ensembl id | ENSG00000108846 | |
| Description | ATP-binding cassette sub-family C member 3canalicular multispecific organic anion transporter 2canicular multispecific organic anion transportermulti-specific organic anion transporter Dmultidrug resistance associated proteinmultidrug resistance-asso | |
| Modification date | 20141207 | |
| dbXrefs | MIM : 604323 | |
| HGNC : HGNC | ||
| Ensembl : ENSG00000108846 | ||
| HPRD : 06826 | ||
| Vega : OTTHUMG00000162245 | ||
| Protein | UniProt: go to UniProt's Cross Reference DB Table | |
| Expression | CleanEX: HS_ABCC3 | |
| BioGPS: 8714 | ||
| Gene Expression Atlas: ENSG00000108846 | ||
| The Human Protein Atlas: ENSG00000108846 | ||
| Pathway | NCI Pathway Interaction Database: ABCC3 | |
| KEGG: ABCC3 | ||
| REACTOME: ABCC3 | ||
| ConsensusPathDB | ||
| Pathway Commons: ABCC3 | ||
| Metabolism | MetaCyc: ABCC3 | |
| HUMANCyc: ABCC3 | ||
| Regulation | Ensembl's Regulation: ENSG00000108846 | |
| miRBase: chr17 :48,712,217-48,769,063 | ||
| TargetScan: NM_001144070 | ||
| cisRED: ENSG00000108846 | ||
| Context | iHOP: ABCC3 | |
| cancer metabolism search in PubMed: ABCC3 | ||
| UCL Cancer Institute: ABCC3 | ||
| Assigned class in ccmGDB | C | |
| Top |
| Phenotypic Information for ABCC3(metabolism pathway, cancer, disease, phenome) |
| Cancer | CGAP: ABCC3 |
| Familial Cancer Database: ABCC3 | |
| * This gene is included in those cancer gene databases. |
|
|
|
|
|
| . | |||||||||||||||||||||||||||||||||||||||||||||||||||||||||||||||||||||||||||||||||||||||||||||||||||||||||||||||||||||||||||||||||||||||||||||||||||||||||||||||||||||||||||||||||||||||||||||||||||||||||||||||||||||||||||||||||||||||||||||||||||||||||||||||||||||||||||||||||||||||||||||||||||||||||||||||||||||||||||||||||||||||||||||||||||||||||||||||||||||||||||||||||||||||||||||||||||||||||||||||||||||
Oncogene 1 | Significant driver gene in | ||||||||||||||||||||||||||||||||||||||||||||||||||||||||||||||||||||||||||||||||||||||||||||||||||||||||||||||||||||||||||||||||||||||||||||||||||||||||||||||||||||||||||||||||||||||||||||||||||||||||||||||||||||||||||||||||||||||||||||||||||||||||||||||||||||||||||||||||||||||||||||||||||||||||||||||||||||||||||||||||||||||||||||||||||||||||||||||||||||||||||||||||||||||||||||||||||||||||||||||||||||||||||
| cf) number; DB name 1 Oncogene; http://nar.oxfordjournals.org/content/35/suppl_1/D721.long, 2 Tumor Suppressor gene; https://bioinfo.uth.edu/TSGene/, 3 Cancer Gene Census; http://www.nature.com/nrc/journal/v4/n3/abs/nrc1299.html, 4 CancerGenes; http://nar.oxfordjournals.org/content/35/suppl_1/D721.long, 5 Network of Cancer Gene; http://ncg.kcl.ac.uk/index.php, 1Therapeutic Vulnerabilities in Cancer; http://cbio.mskcc.org/cancergenomics/statius/ |
| REACTOME_METABOLISM_OF_LIPIDS_AND_LIPOPROTEINS | |
| OMIM | |
| Orphanet | |
| Disease | KEGG Disease: ABCC3 |
| MedGen: ABCC3 (Human Medical Genetics with Condition) | |
| ClinVar: ABCC3 | |
| Phenotype | MGI: ABCC3 (International Mouse Phenotyping Consortium) |
| PhenomicDB: ABCC3 | |
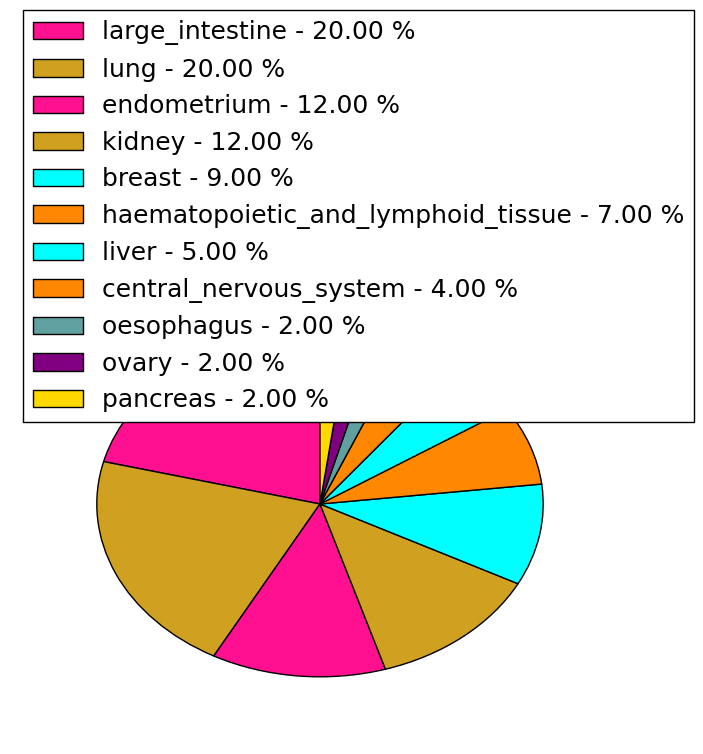
| Mutations for ABCC3 |
| * Under tables are showing count per each tissue to give us broad intuition about tissue specific mutation patterns.You can go to the detailed page for each mutation database's web site. |
| - Statistics for Tissue and Mutation type | Top |
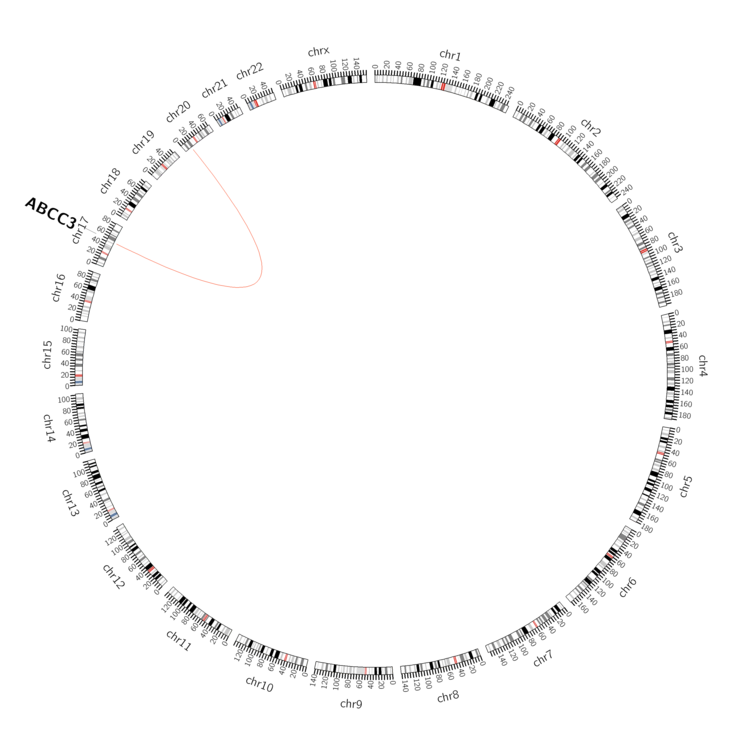 |
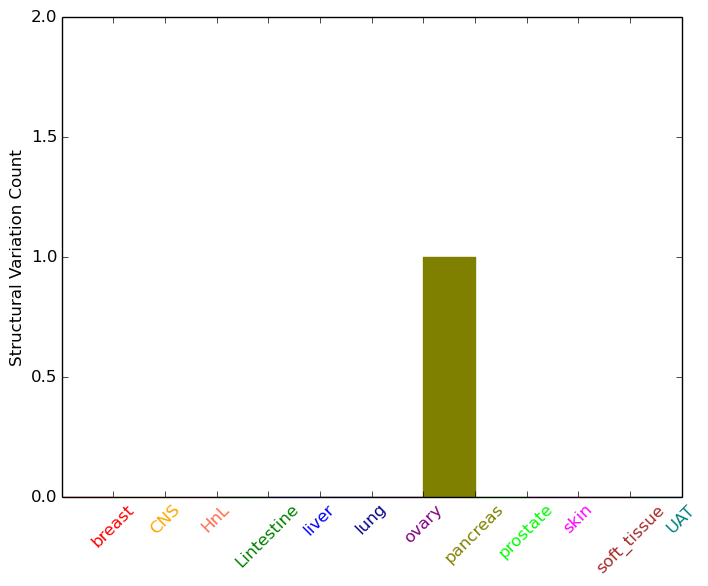
| - For Inter-chromosomal Variations |
| * Inter-chromosomal variantions includes 'interchromosomal amplicon to amplicon', 'interchromosomal amplicon to non-amplified dna', 'interchromosomal insertion', 'Interchromosomal unknown type'. |
 |
| - For Intra-chromosomal Variations |
| There's no intra-chromosomal structural variation. |
| Sample | Symbol_a | Chr_a | Start_a | End_a | Symbol_b | Chr_b | Start_b | End_b |
| pancreas | ABCC3 | chr17 | 48760454 | 48760474 | chr20 | 12935108 | 12935128 |
| cf) Tissue number; Tissue name (1;Breast, 2;Central_nervous_system, 3;Haematopoietic_and_lymphoid_tissue, 4;Large_intestine, 5;Liver, 6;Lung, 7;Ovary, 8;Pancreas, 9;Prostate, 10;Skin, 11;Soft_tissue, 12;Upper_aerodigestive_tract) |
| * From mRNA Sanger sequences, Chitars2.0 arranged chimeric transcripts. This table shows ABCC3 related fusion information. |
| ID | Head Gene | Tail Gene | Accession | Gene_a | qStart_a | qEnd_a | Chromosome_a | tStart_a | tEnd_a | Gene_a | qStart_a | qEnd_a | Chromosome_a | tStart_a | tEnd_a |
| AW450940 | ERCC6L2 | 13 | 211 | 9 | 98776644 | 98776842 | ABCC3 | 207 | 390 | 17 | 48738088 | 48738271 | |
| AK000791 | ABCC3 | 1 | 2578 | 17 | 48766883 | 48769460 | ABCC3 | 2572 | 3327 | 17 | 48765523 | 48766278 | |
| BQ302632 | ABCC3 | 20 | 377 | 17 | 48760952 | 48761501 | DLGAP2 | 366 | 400 | 8 | 1456800 | 1506271 | |
| AI761355 | YWHAZ | 1 | 190 | 8 | 101951468 | 101951657 | ABCC3 | 188 | 273 | 17 | 48721338 | 48721423 | |
| AI905457 | ABCC3 | 20 | 182 | 17 | 48724032 | 48724193 | ABCC3 | 177 | 609 | 17 | 48724397 | 48724829 | |
| AI905516 | ABCC3 | 20 | 182 | 17 | 48724032 | 48724193 | ABCC3 | 177 | 583 | 17 | 48724397 | 48724800 | |
| Top |
| Mutation type/ Tissue ID | brca | cns | cerv | endome | haematopo | kidn | Lintest | liver | lung | ns | ovary | pancre | prost | skin | stoma | thyro | urina | |||
| Total # sample | 10 | 2 | ||||||||||||||||||
| GAIN (# sample) | 10 | 2 | ||||||||||||||||||
| LOSS (# sample) |
| cf) Tissue ID; Tissue type (1; Breast, 2; Central_nervous_system, 3; Cervix, 4; Endometrium, 5; Haematopoietic_and_lymphoid_tissue, 6; Kidney, 7; Large_intestine, 8; Liver, 9; Lung, 10; NS, 11; Ovary, 12; Pancreas, 13; Prostate, 14; Skin, 15; Stomach, 16; Thyroid, 17; Urinary_tract) |
| Top |
|
 |
| Top |
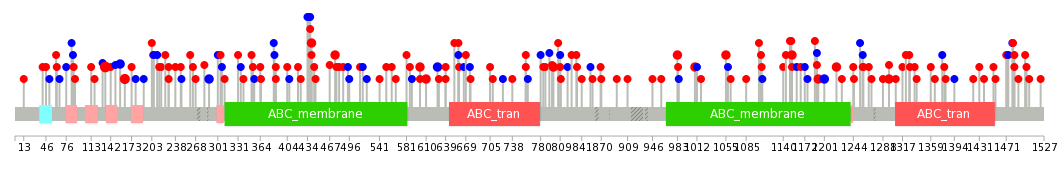
| Stat. for Non-Synonymous SNVs (# total SNVs=88) | (# total SNVs=25) |
 | 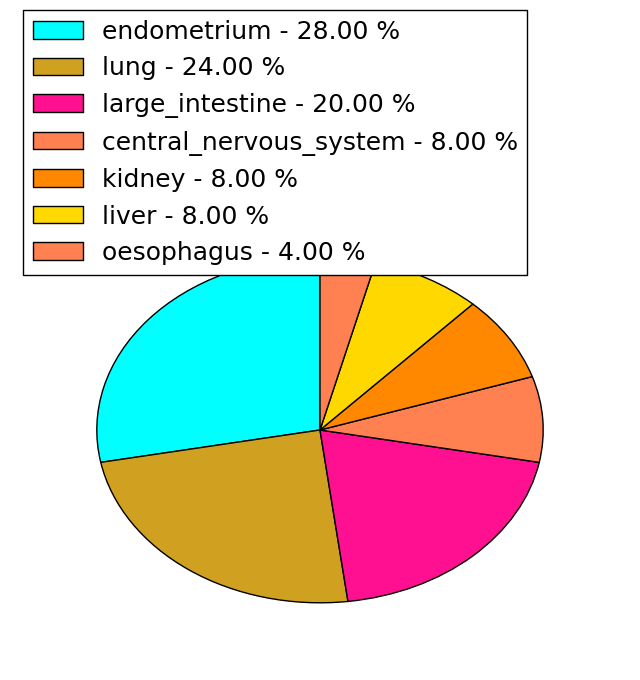 |
(# total SNVs=1) | (# total SNVs=1) |
 |  |
| Top |
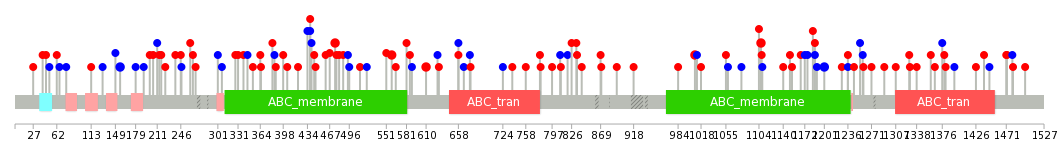
| * When you move the cursor on each content, you can see more deailed mutation information on the Tooltip. Those are primary_site,primary_histology,mutation(aa),pubmedID. |
| GRCh37 position | Mutation(aa) | Unique sampleID count |
| chr17:48734459-48734459 | p.S134L | 4 |
| chr17:48735443-48735443 | p.G163S | 3 |
| chr17:48738339-48738339 | p.L288L | 2 |
| chr17:48753332-48753332 | p.A983V | 2 |
| chr17:48746258-48746258 | p.D639N | 2 |
| chr17:48750485-48750485 | p.V799L | 2 |
| chr17:48736616-48736616 | p.Y231* | 2 |
| chr17:48741452-48741452 | p.A440T | 2 |
| chr17:48757227-48757227 | p.E1258E | 2 |
| chr17:48753410-48753410 | p.S1009F | 2 |
| Top |
|
 |
| Point Mutation/ Tissue ID | 1 | 2 | 3 | 4 | 5 | 6 | 7 | 8 | 9 | 10 | 11 | 12 | 13 | 14 | 15 | 16 | 17 | 18 | 19 | 20 |
| # sample | 9 | 3 | 2 | 14 | 2 | 8 | 1 | 1 | 12 | 3 | 1 | 40 | 10 | 12 | ||||||
| # mutation | 9 | 3 | 2 | 13 | 2 | 8 | 1 | 1 | 12 | 3 | 1 | 48 | 11 | 18 | ||||||
| nonsynonymous SNV | 6 | 3 | 2 | 10 | 2 | 8 | 1 | 9 | 3 | 1 | 26 | 8 | 11 | |||||||
| synonymous SNV | 3 | 3 | 1 | 3 | 22 | 3 | 7 |
| cf) Tissue ID; Tissue type (1; BLCA[Bladder Urothelial Carcinoma], 2; BRCA[Breast invasive carcinoma], 3; CESC[Cervical squamous cell carcinoma and endocervical adenocarcinoma], 4; COAD[Colon adenocarcinoma], 5; GBM[Glioblastoma multiforme], 6; Glioma Low Grade, 7; HNSC[Head and Neck squamous cell carcinoma], 8; KICH[Kidney Chromophobe], 9; KIRC[Kidney renal clear cell carcinoma], 10; KIRP[Kidney renal papillary cell carcinoma], 11; LAML[Acute Myeloid Leukemia], 12; LUAD[Lung adenocarcinoma], 13; LUSC[Lung squamous cell carcinoma], 14; OV[Ovarian serous cystadenocarcinoma ], 15; PAAD[Pancreatic adenocarcinoma], 16; PRAD[Prostate adenocarcinoma], 17; SKCM[Skin Cutaneous Melanoma], 18:STAD[Stomach adenocarcinoma], 19:THCA[Thyroid carcinoma], 20:UCEC[Uterine Corpus Endometrial Carcinoma]) |
| Top |
| * We represented just top 10 SNVs. When you move the cursor on each content, you can see more deailed mutation information on the Tooltip. Those are primary_site, primary_histology, mutation(aa), pubmedID. |
| Genomic Position | Mutation(aa) | Unique sampleID count |
| chr17:48734526 | p.E610K | 2 |
| chr17:48755478 | p.S1107N | 2 |
| chr17:48753410 | p.A475T,ABCC3 | 2 |
| chr17:48745263 | p.S1009F | 2 |
| chr17:48742598 | p.P559T | 2 |
| chr17:48745836 | p.I156I,ABCC3 | 2 |
| chr17:48753891 | p.F1201F | 2 |
| chr17:48741448 | p.V1236L | 1 |
| chr17:48750428 | p.P345P,ABCC3 | 1 |
| chr17:48755287 | p.R1381H | 1 |
| * Copy number data were extracted from TCGA using R package TCGA-Assembler. The URLs of all public data files on TCGA DCC data server were gathered on Jan-05-2015. Function ProcessCNAData in TCGA-Assembler package was used to obtain gene-level copy number value which is calculated as the average copy number of the genomic region of a gene. |
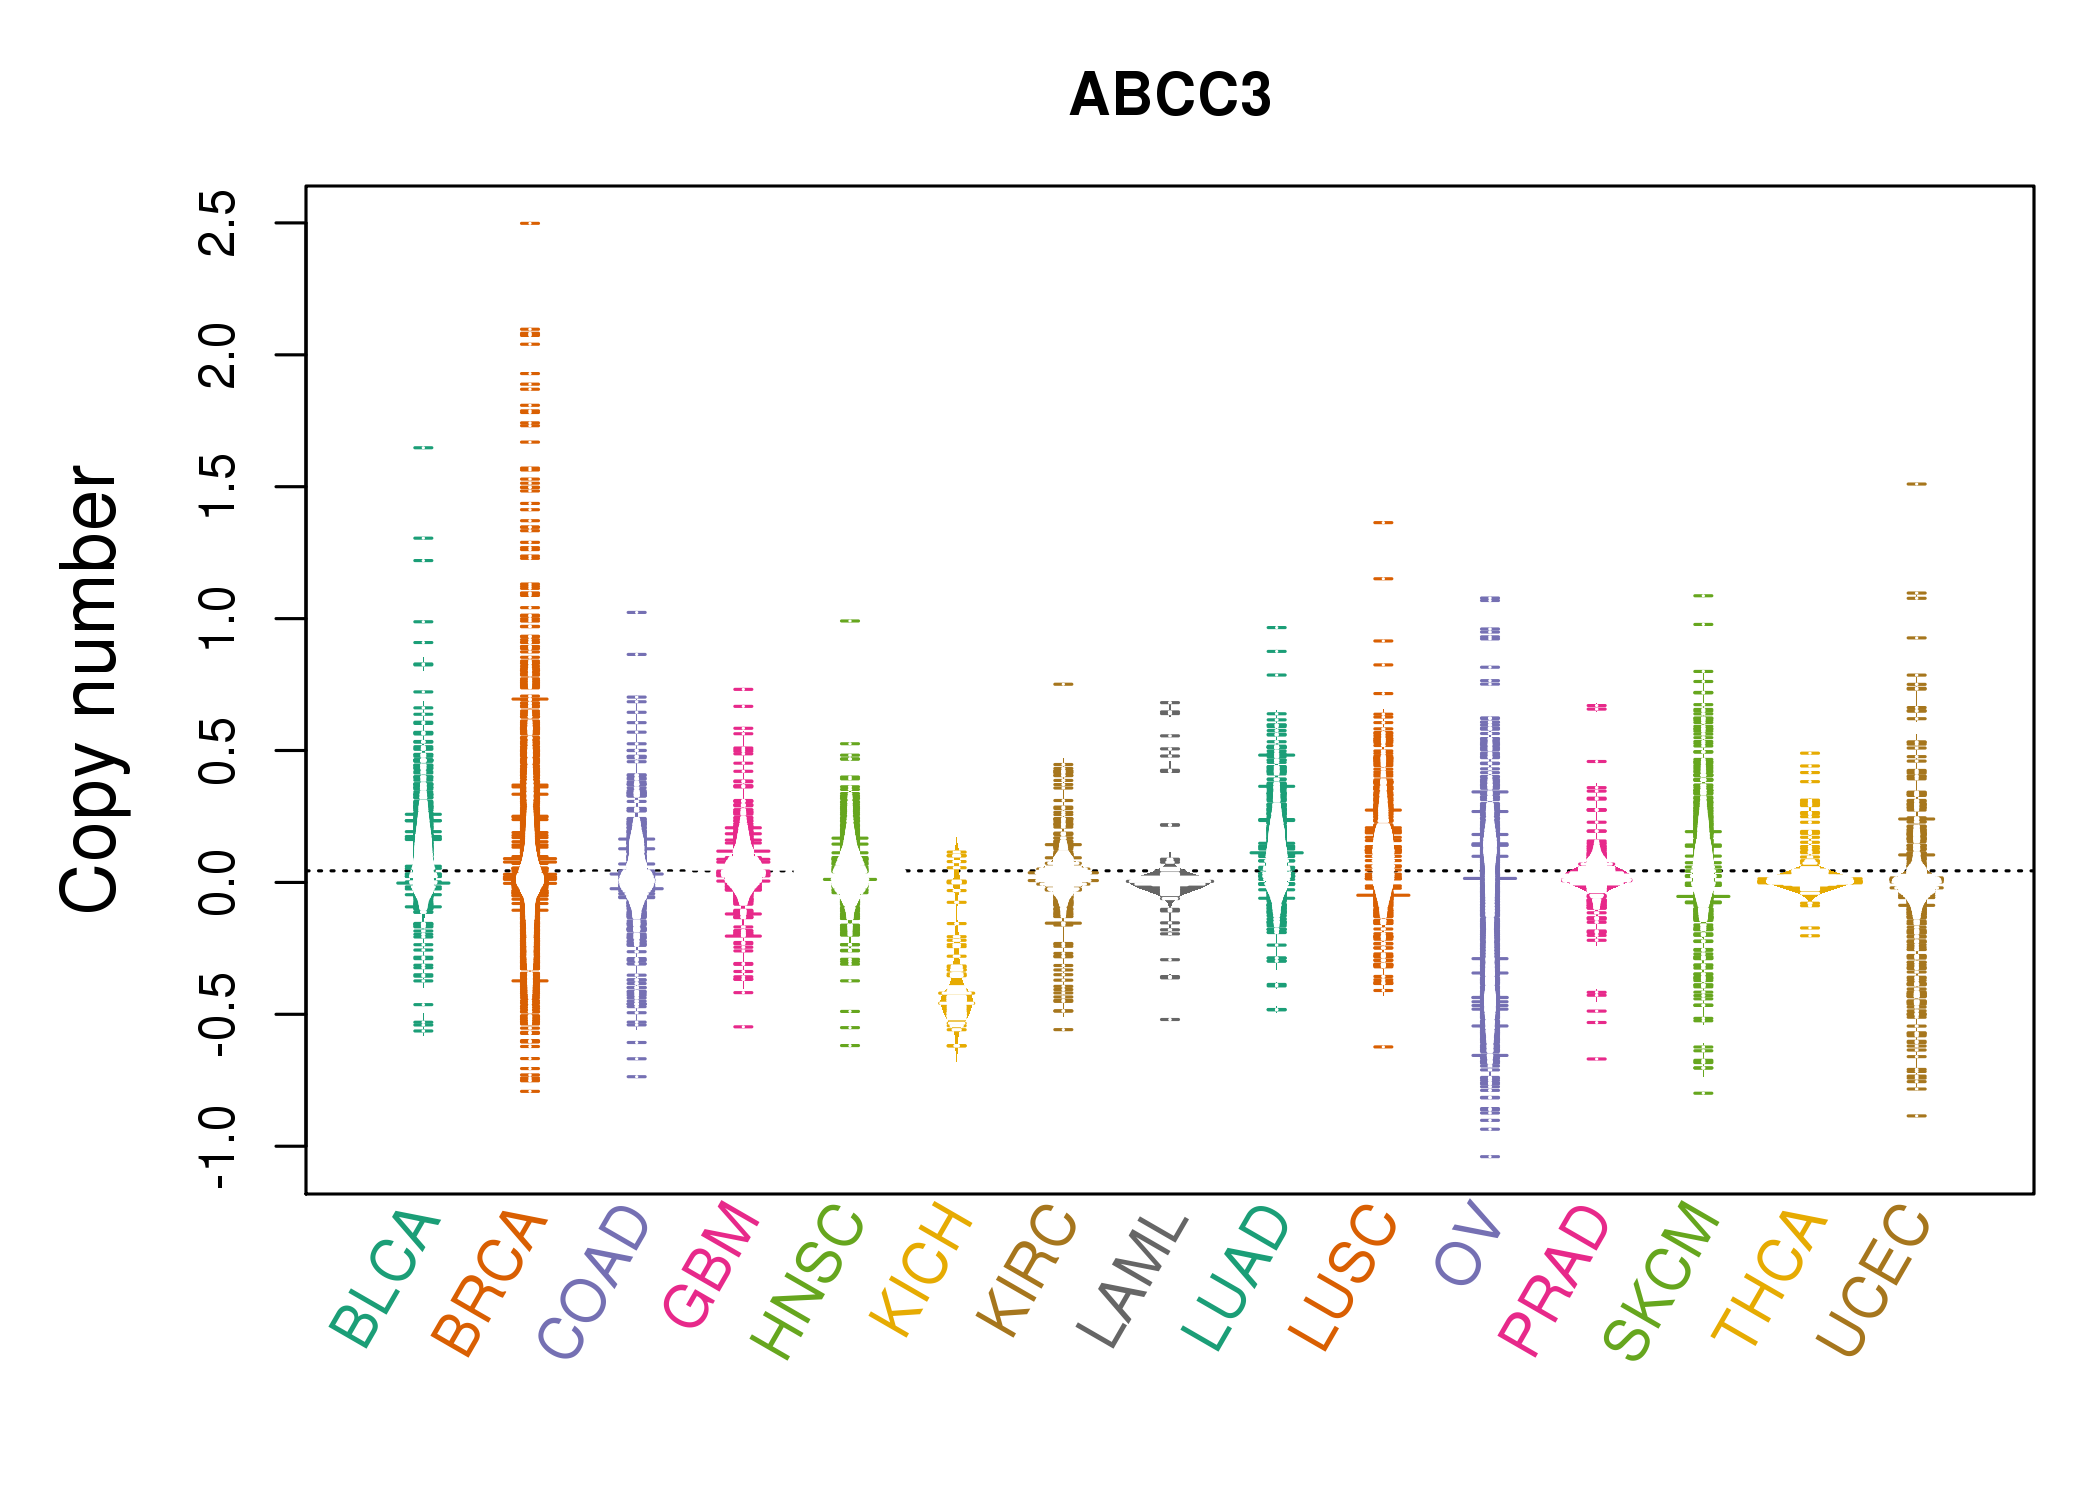 |
| cf) Tissue ID[Tissue type]: BLCA[Bladder Urothelial Carcinoma], BRCA[Breast invasive carcinoma], CESC[Cervical squamous cell carcinoma and endocervical adenocarcinoma], COAD[Colon adenocarcinoma], GBM[Glioblastoma multiforme], Glioma Low Grade, HNSC[Head and Neck squamous cell carcinoma], KICH[Kidney Chromophobe], KIRC[Kidney renal clear cell carcinoma], KIRP[Kidney renal papillary cell carcinoma], LAML[Acute Myeloid Leukemia], LUAD[Lung adenocarcinoma], LUSC[Lung squamous cell carcinoma], OV[Ovarian serous cystadenocarcinoma ], PAAD[Pancreatic adenocarcinoma], PRAD[Prostate adenocarcinoma], SKCM[Skin Cutaneous Melanoma], STAD[Stomach adenocarcinoma], THCA[Thyroid carcinoma], UCEC[Uterine Corpus Endometrial Carcinoma] |
| Top |
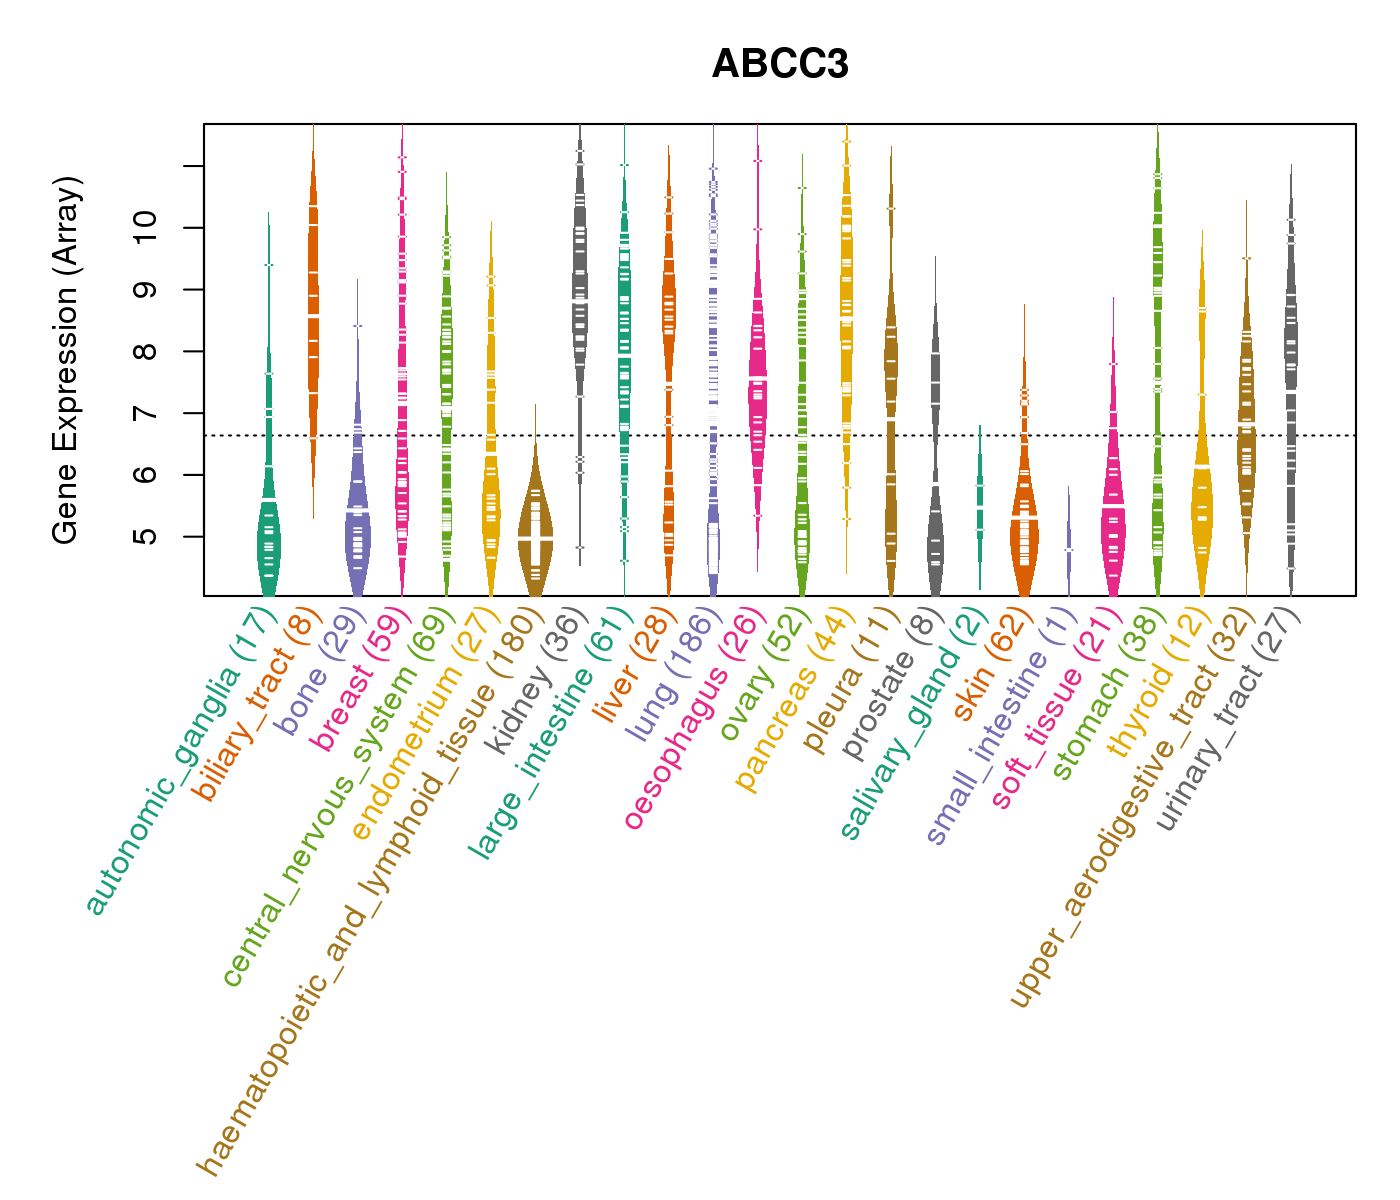
| Gene Expression for ABCC3 |
| * CCLE gene expression data were extracted from CCLE_Expression_Entrez_2012-10-18.res: Gene-centric RMA-normalized mRNA expression data. |
 |
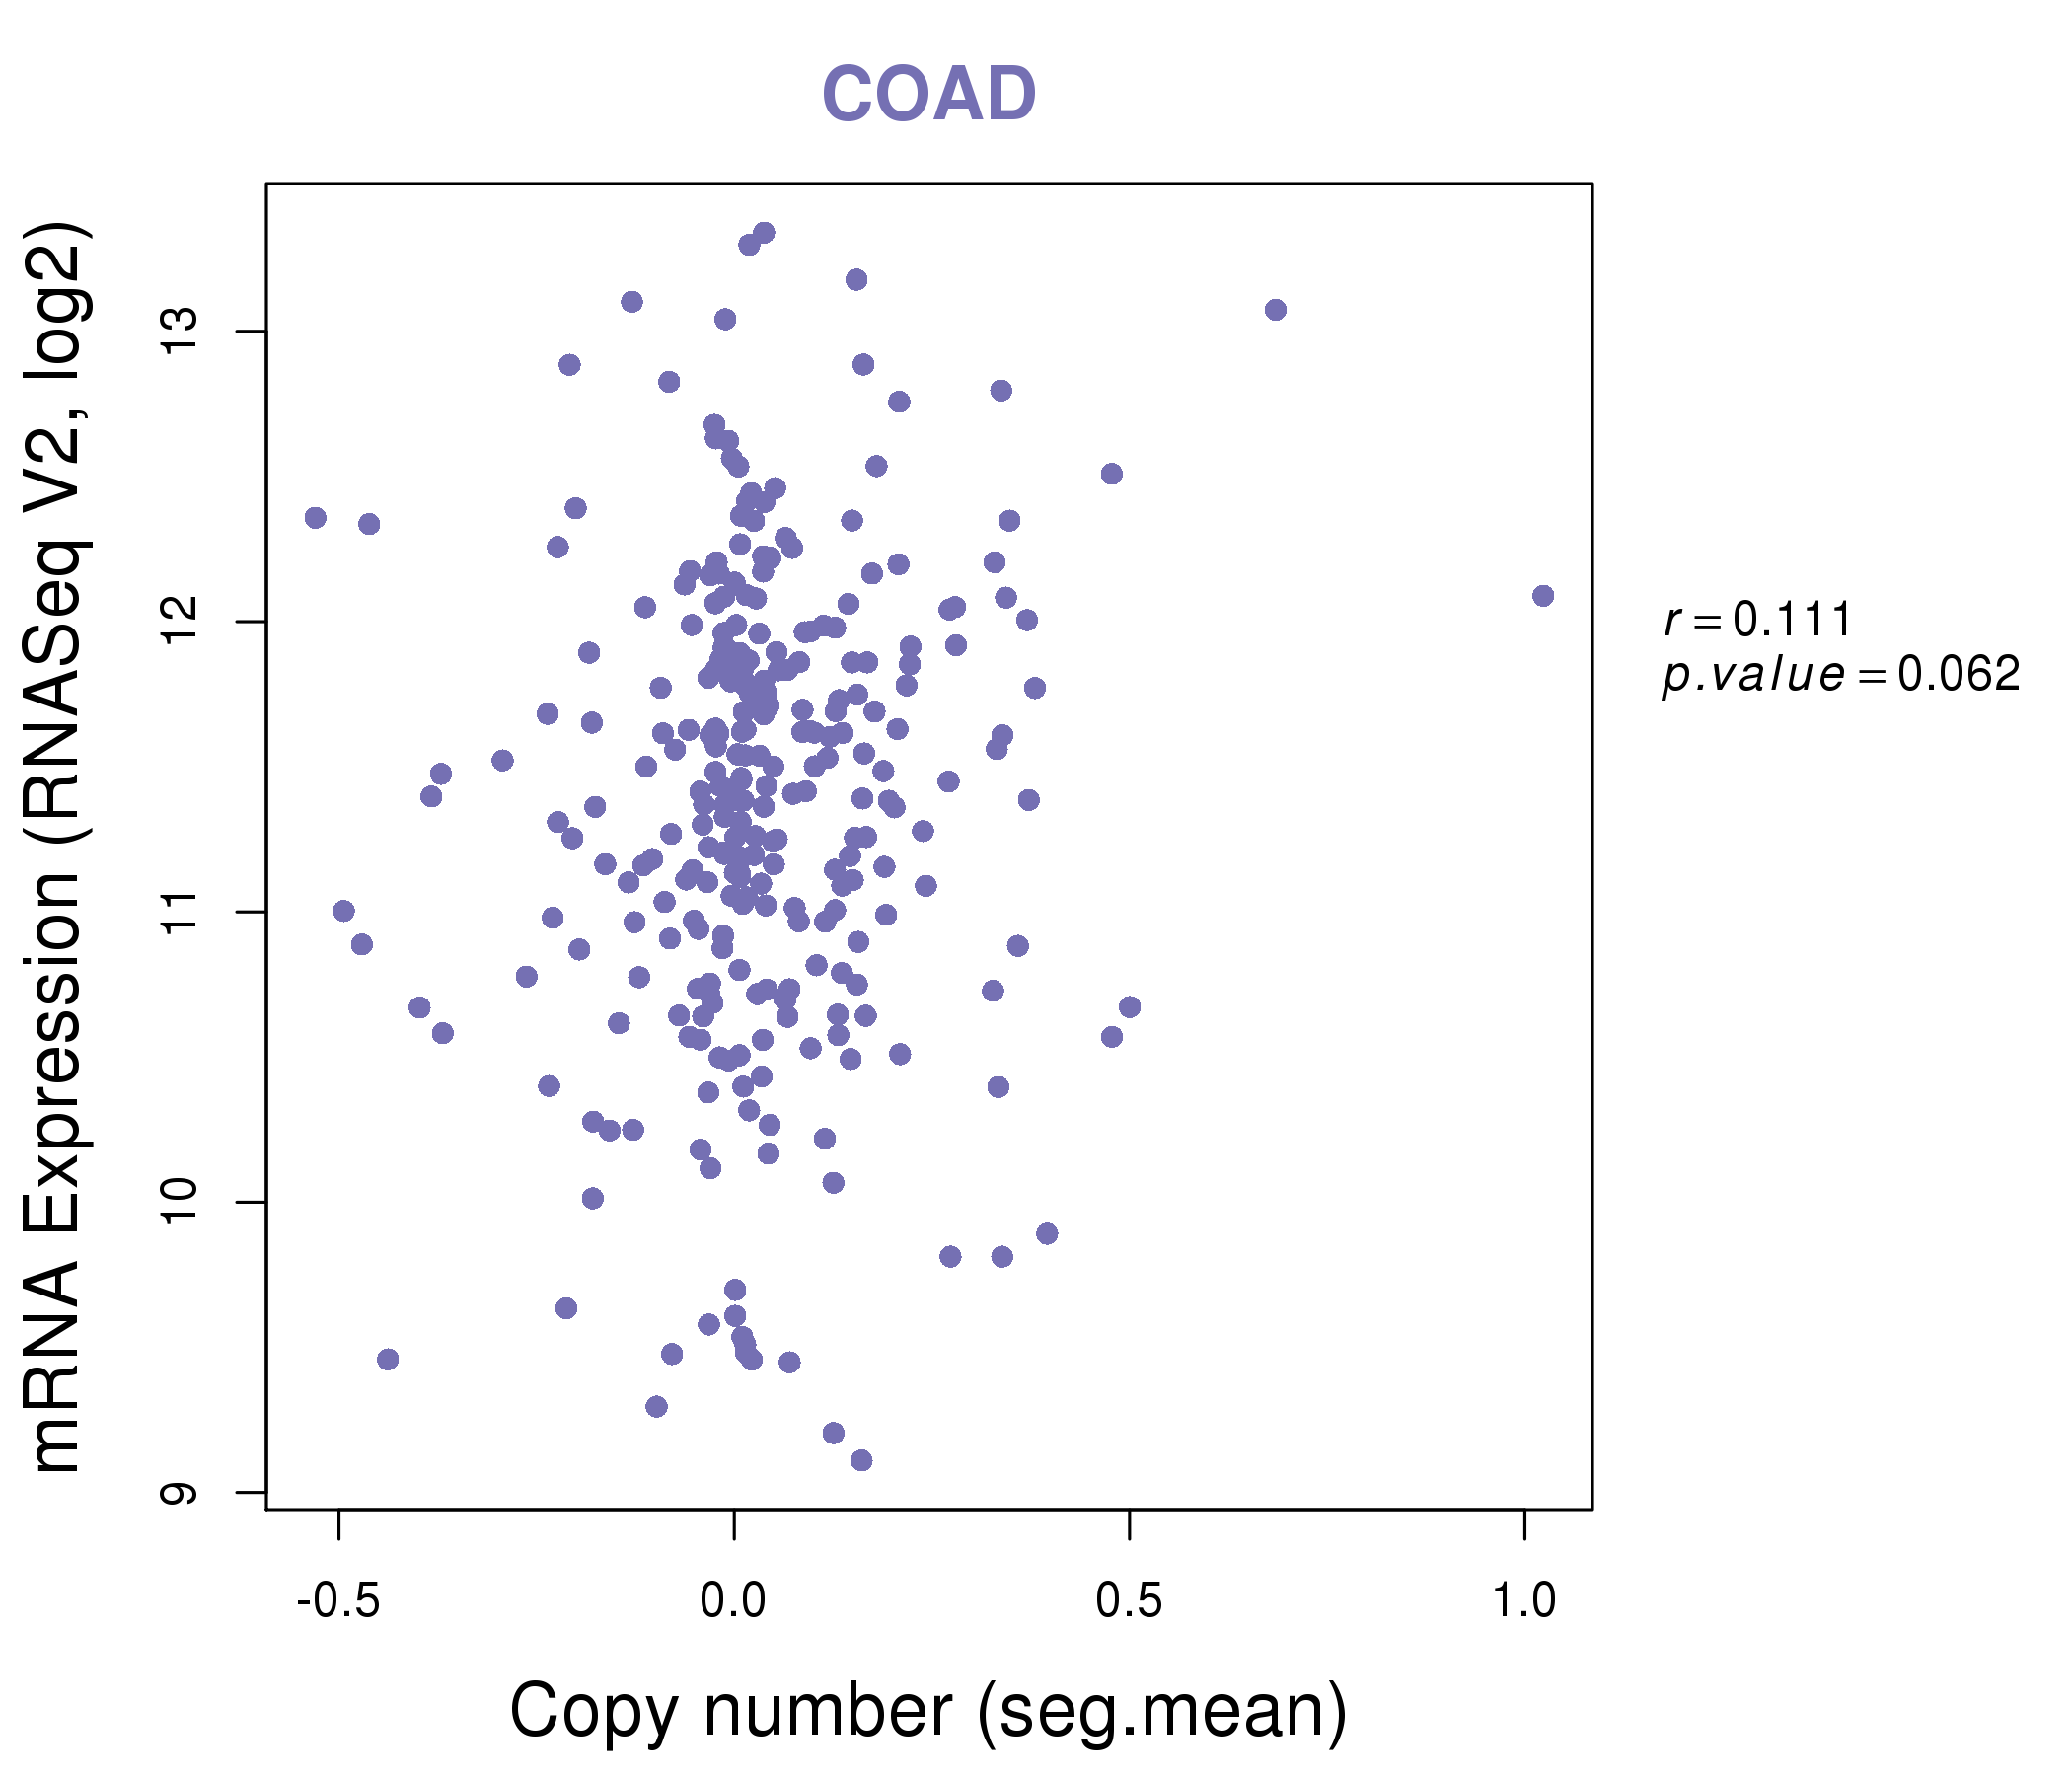
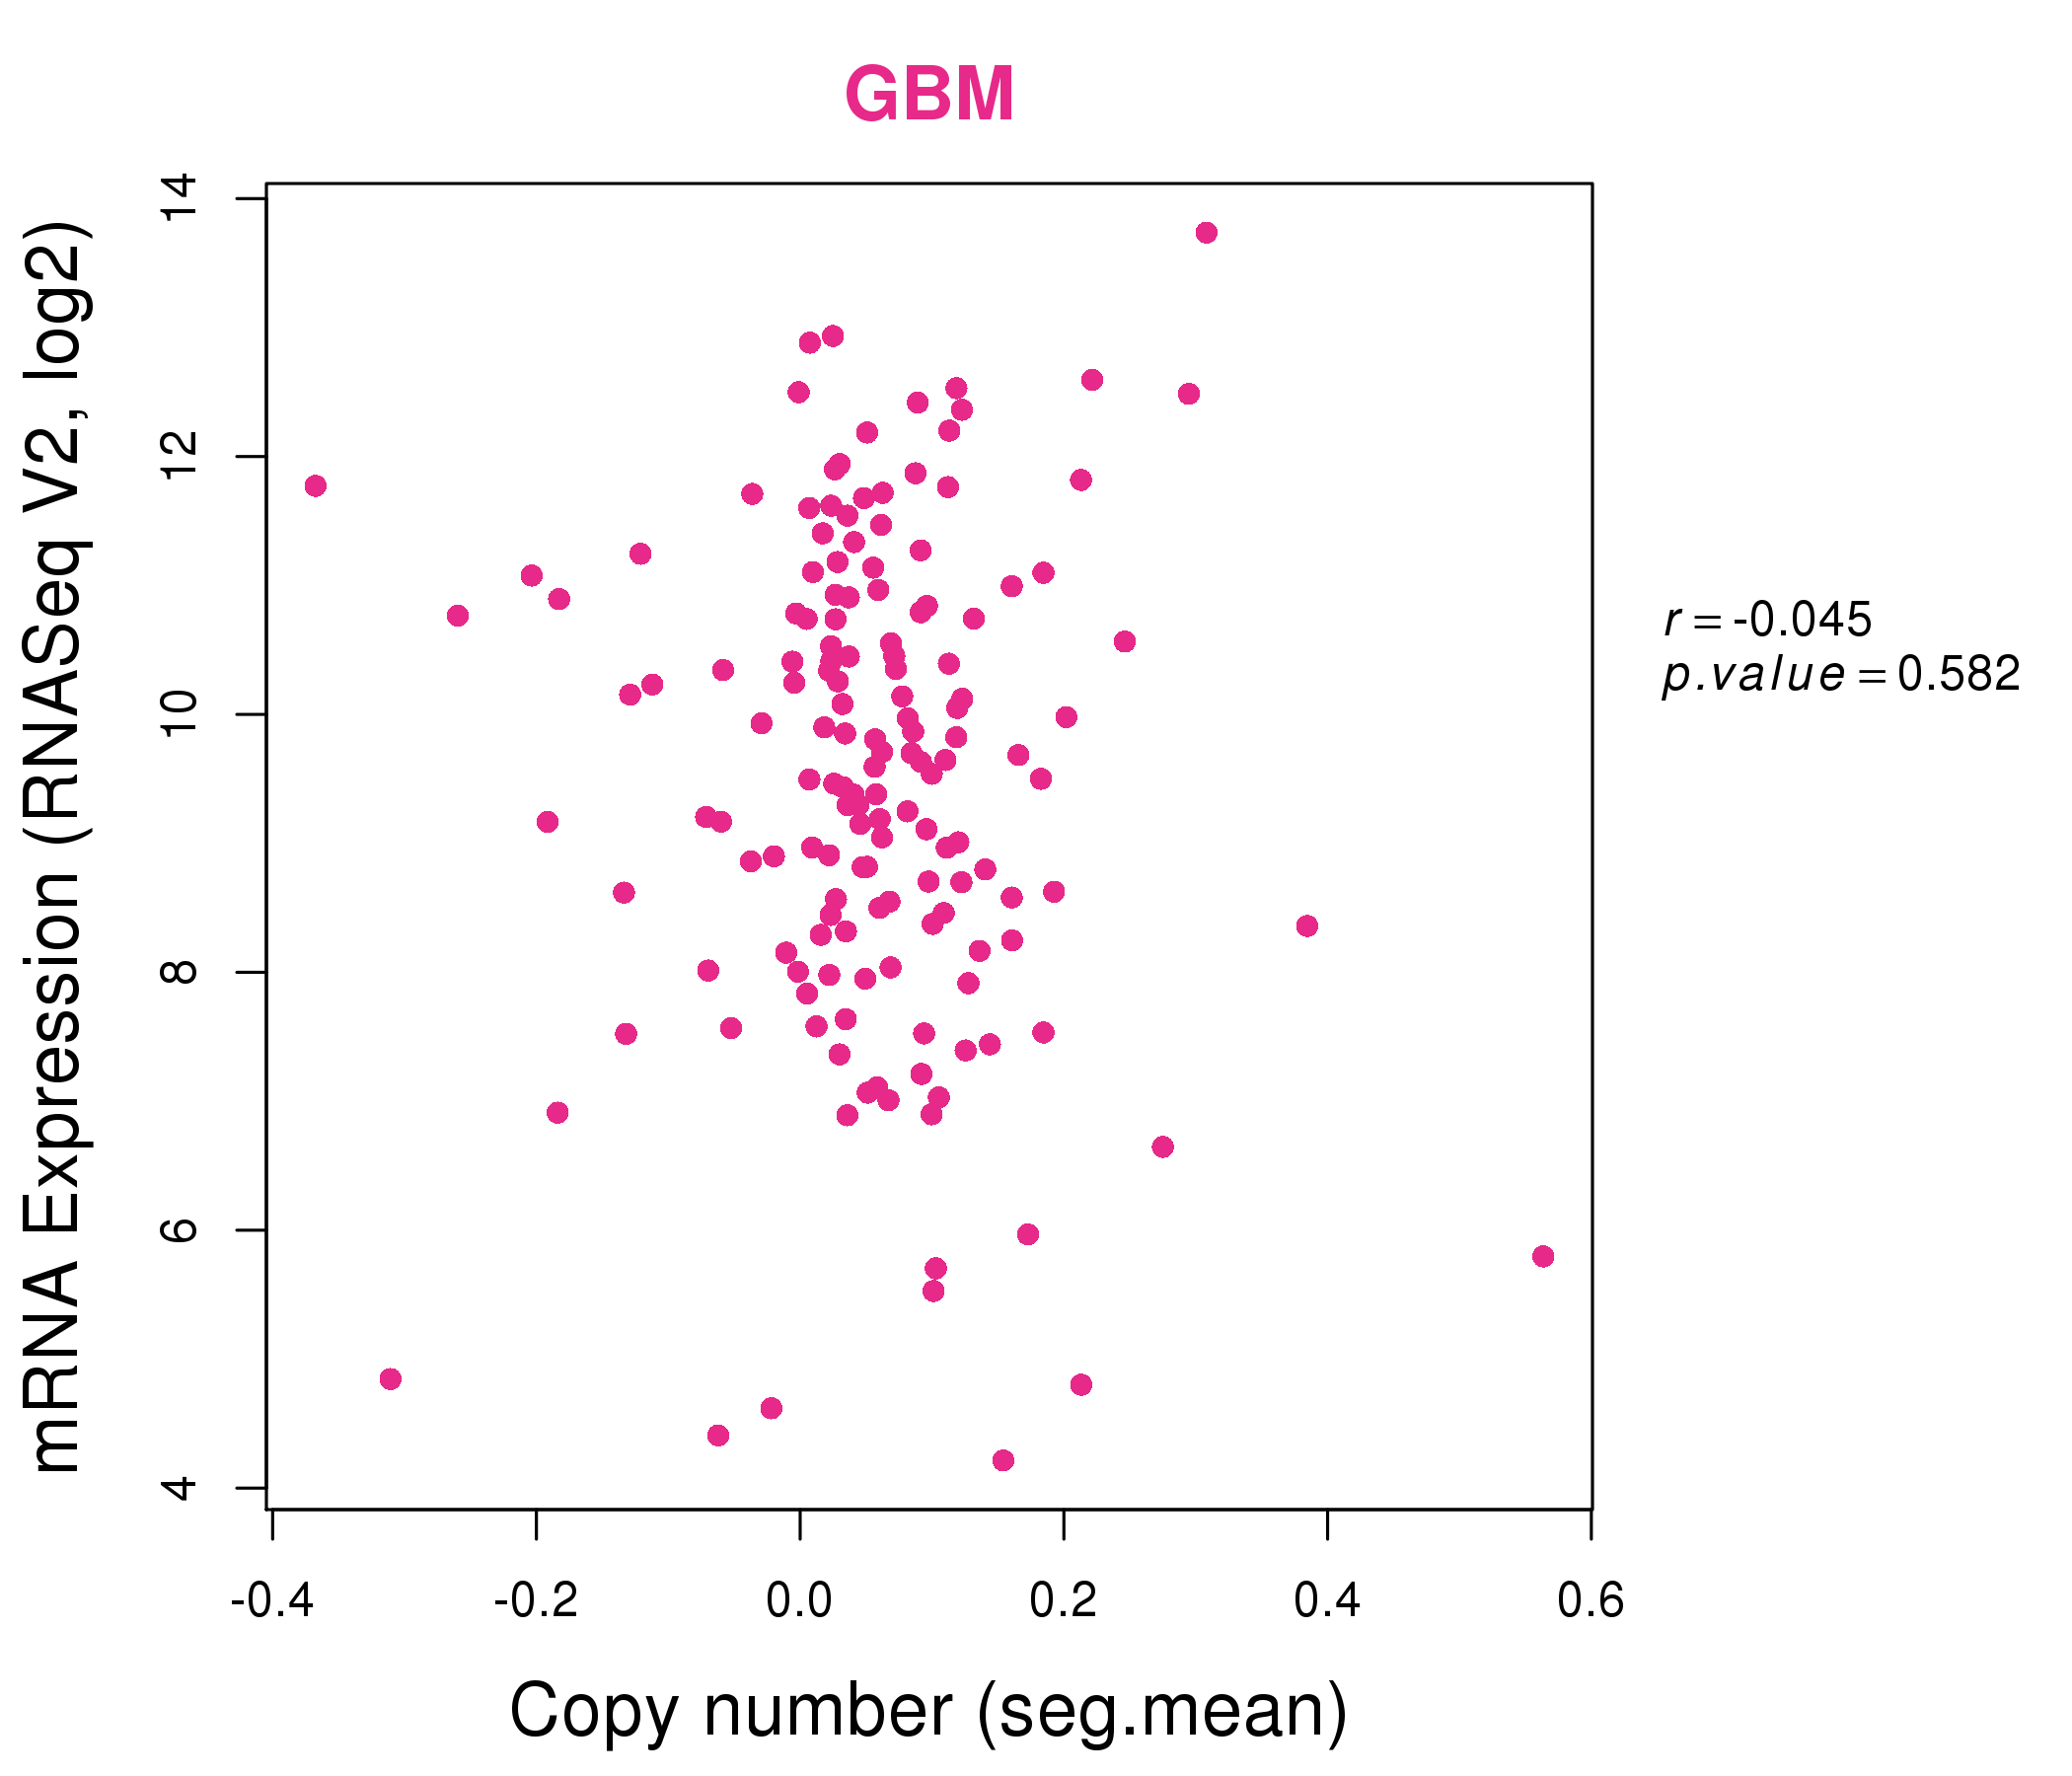
| * Normalized gene expression data of RNASeqV2 was extracted from TCGA using R package TCGA-Assembler. The URLs of all public data files on TCGA DCC data server were gathered at Jan-05-2015. Only eight cancer types have enough normal control samples for differential expression analysis. (t test, adjusted p<0.05 (using Benjamini-Hochberg FDR)) |
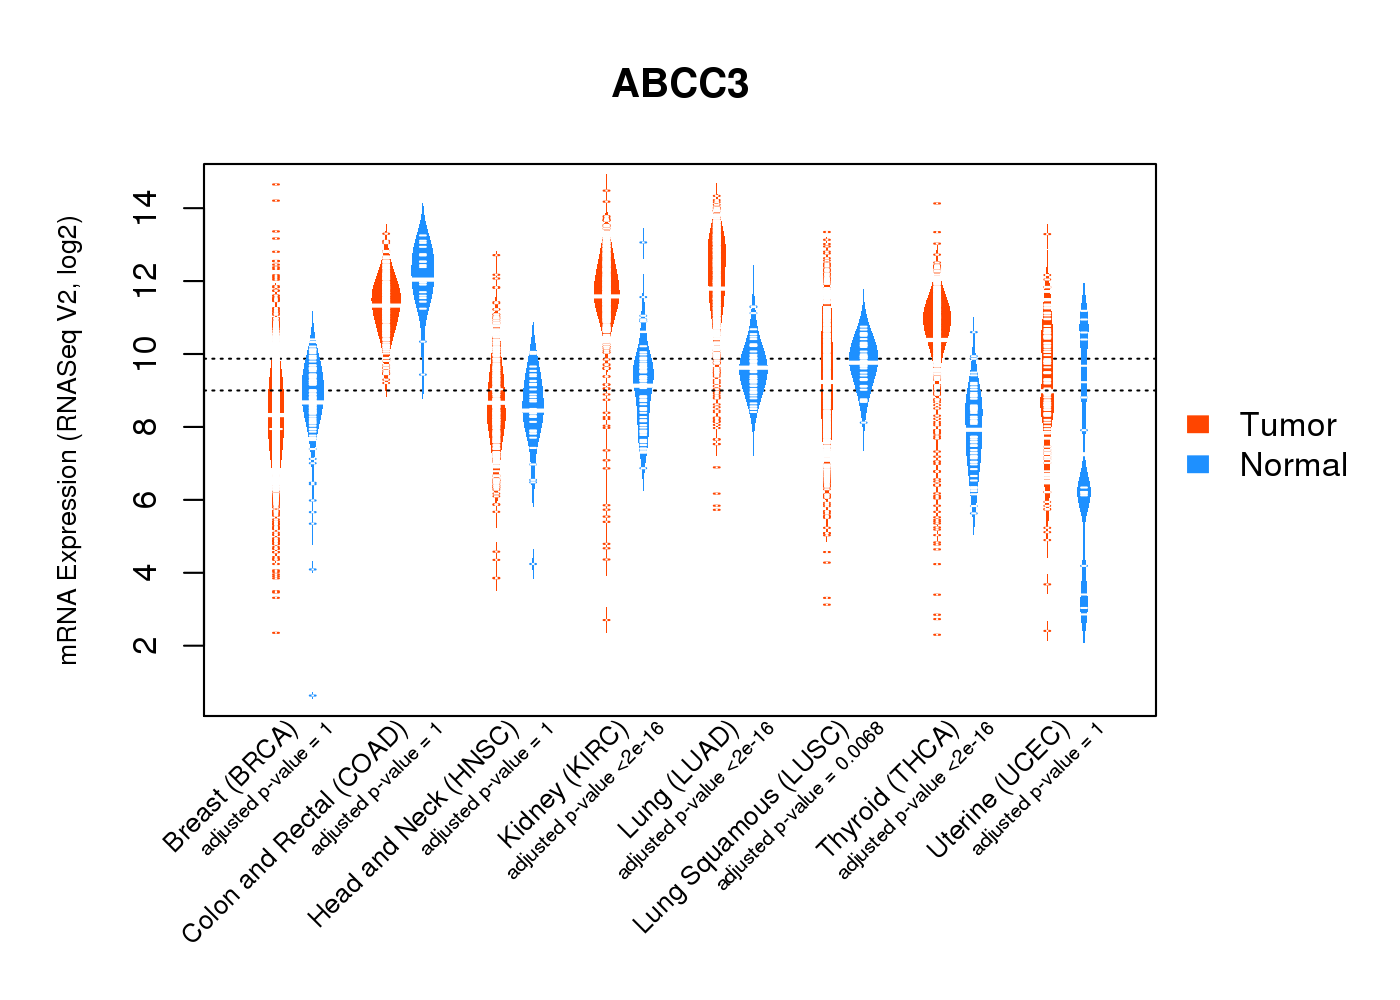 |
| Top |
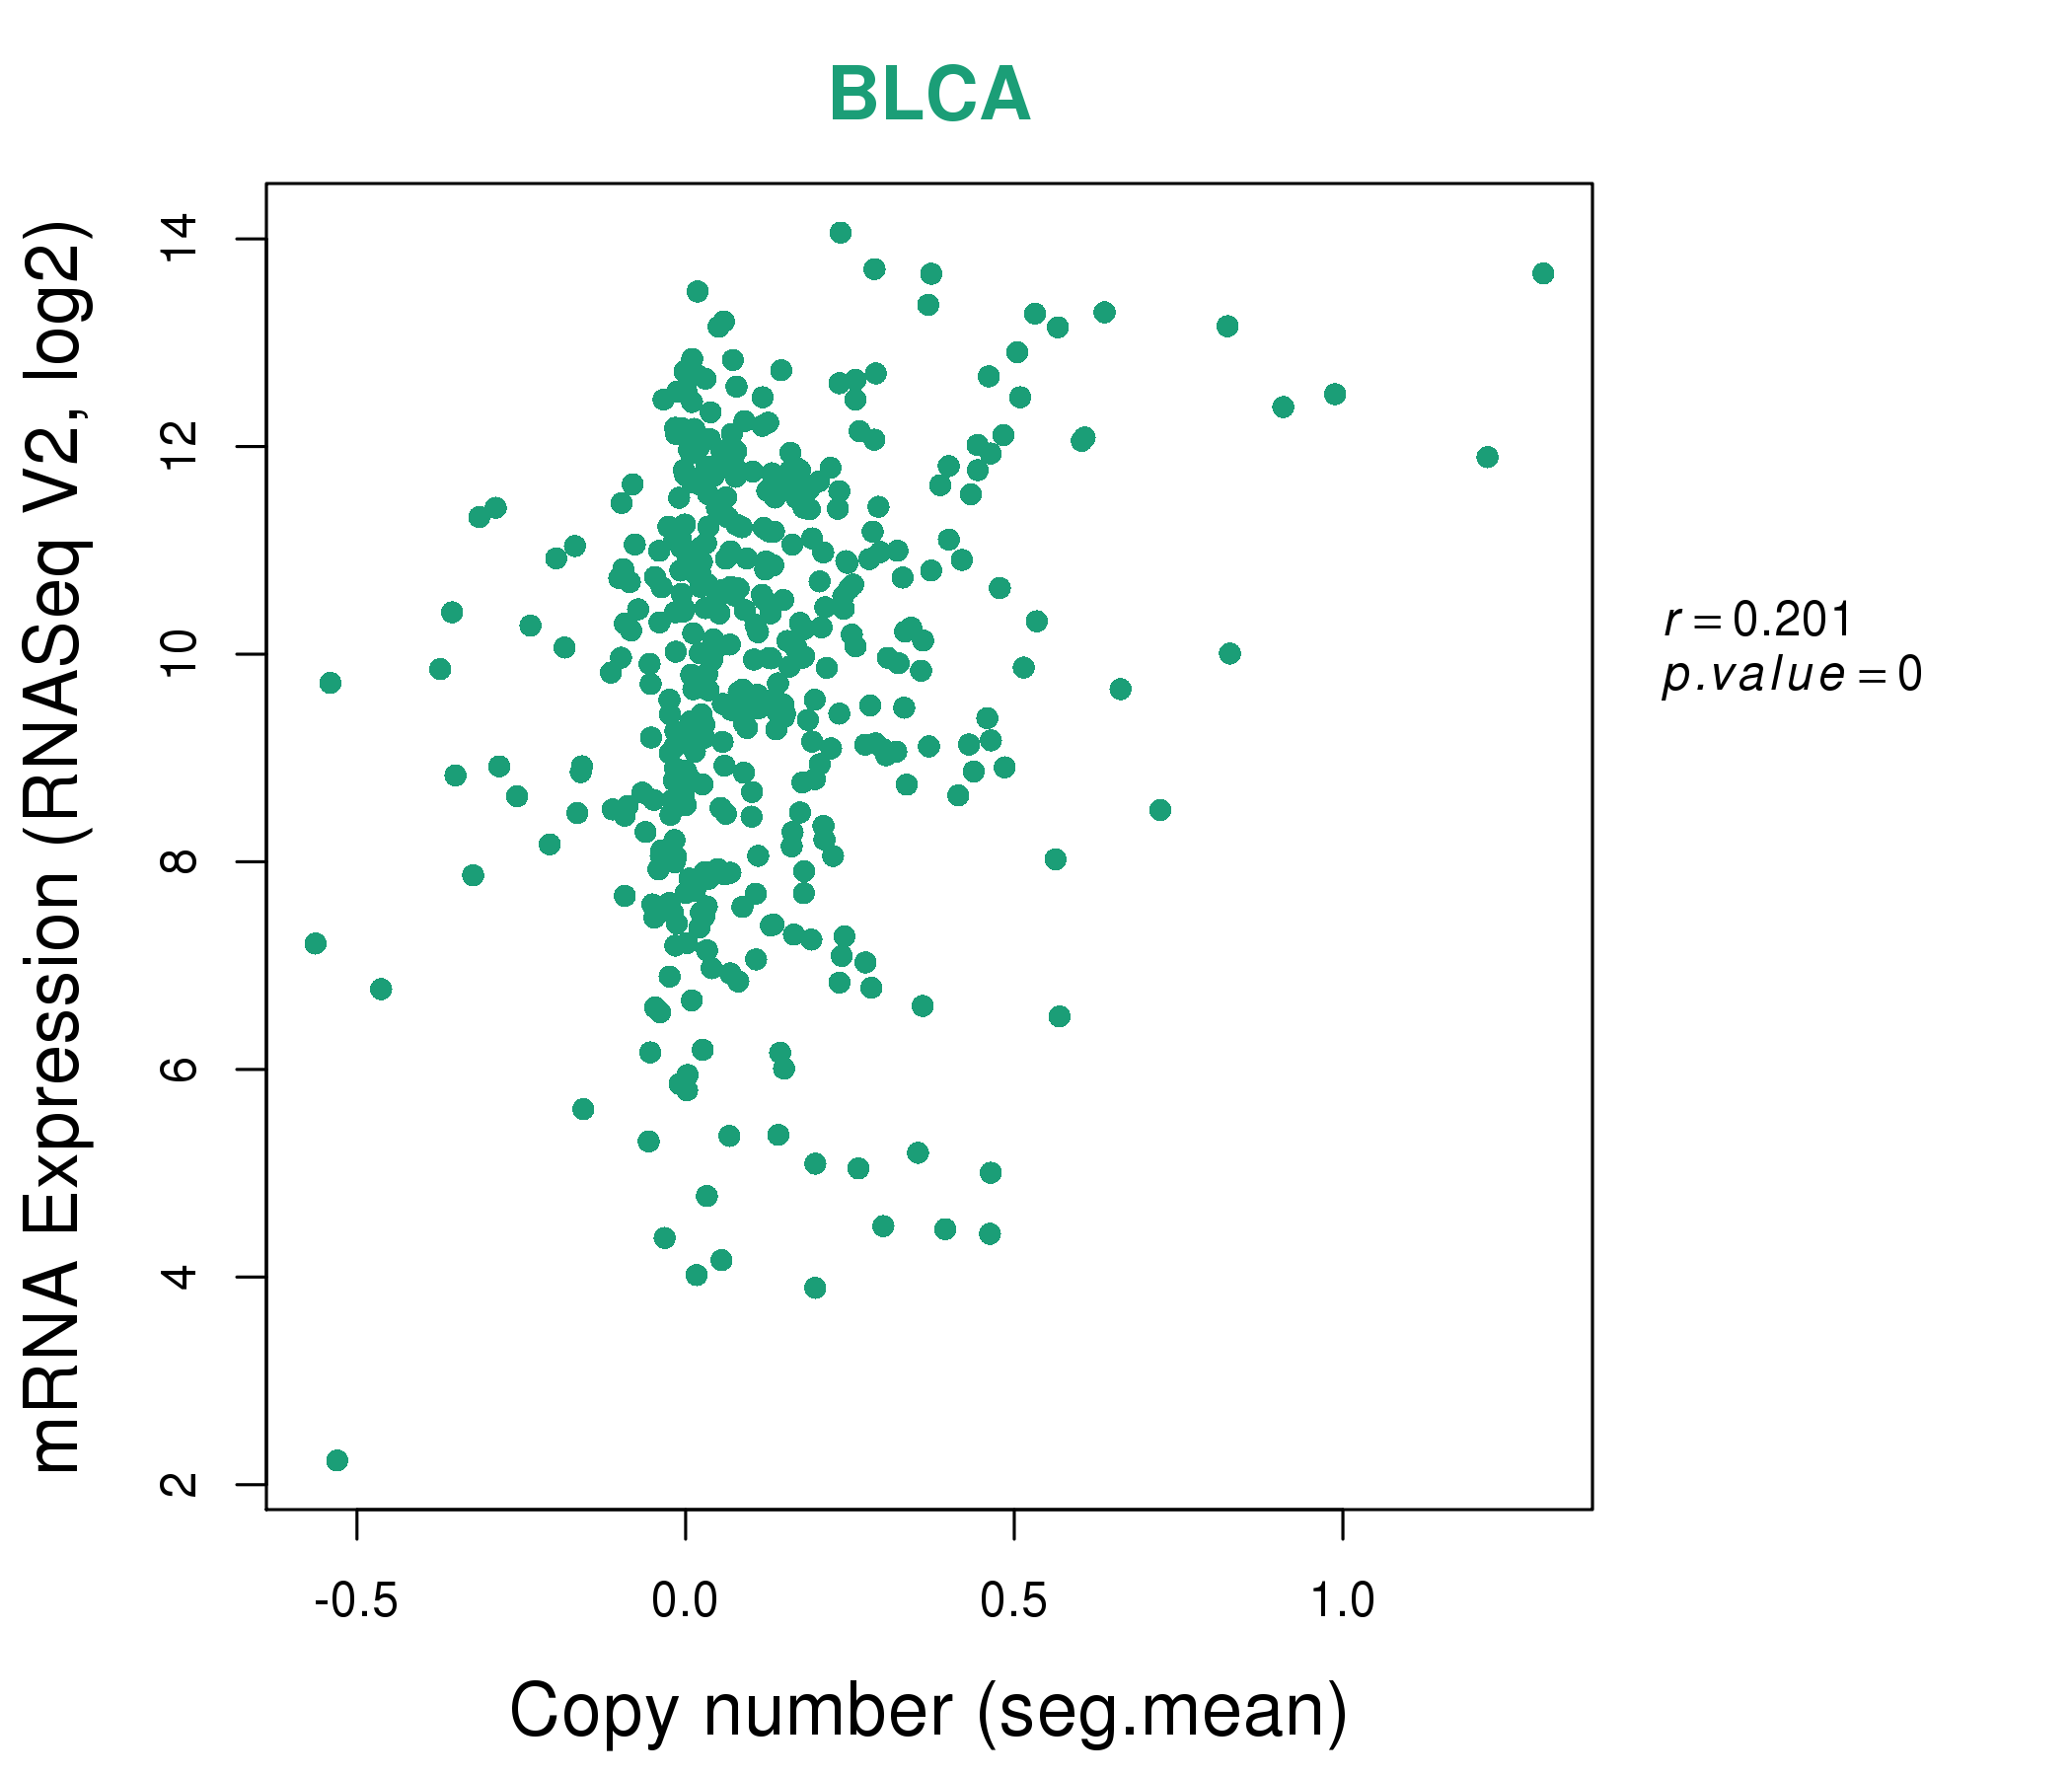
| * This plots show the correlation between CNV and gene expression. |
: Open all plots for all cancer types
 |
|
 |
|

| Top |
| Gene-Gene Network Information |
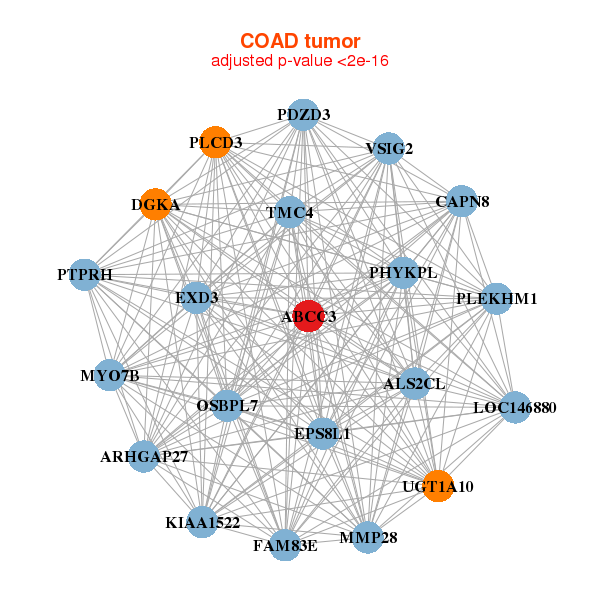
| * Co-Expression network figures were drawn using R package igraph. Only the top 20 genes with the highest correlations were shown. Red circle: input gene, orange circle: cell metabolism gene, sky circle: other gene |
: Open all plots for all cancer types
 |
| ||||
| ABCC2,ABCC3,ANKRD40,C2CD4A,CA10,EPN3,ITGA3, ITGB6,LUC7L3,KAT7,NME1,NME2,NME2P1,NUDT8, PPP1R9B,RTL1,SLC12A3,SLC35B1,SPAG9,TOB1,UTP18 | ABCC3,ACTN1,ALOX5,COX6B2,CRB2,DGKA,DSG3, GALNT14,IL34,IL4R,KRT17,KRT5,KRT9,LAMC2, PLCH2,RHBDF2,SFN,TEAD3,TMEM51,TRIM17,UNC13D | ||||
 |
| ||||
| ABCC3,PHYKPL,ALS2CL,ARHGAP27,CAPN8,DGKA,EPS8L1, EXD3,FAM83E,KIAA1522,LOC146880,MMP28,MYO7B,OSBPL7, PDZD3,PLCD3,PLEKHM1,PTPRH,TMC4,UGT1A10,VSIG2 | ABCC3,PRR14L,CC2D1A,CDH1,CPT1A,ENTPD5,FZD5, GRAMD4,HNF4A,LETM1,MAVS,MFSD9,MINK1,MYO1D, PLCE1,PRSS12,RAPGEFL1,TMEM131,TMEM63B,TRAPPC10,TRPM4 |
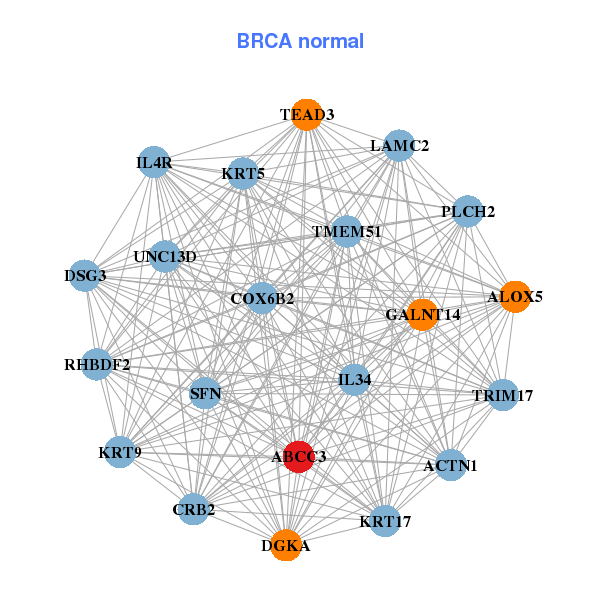
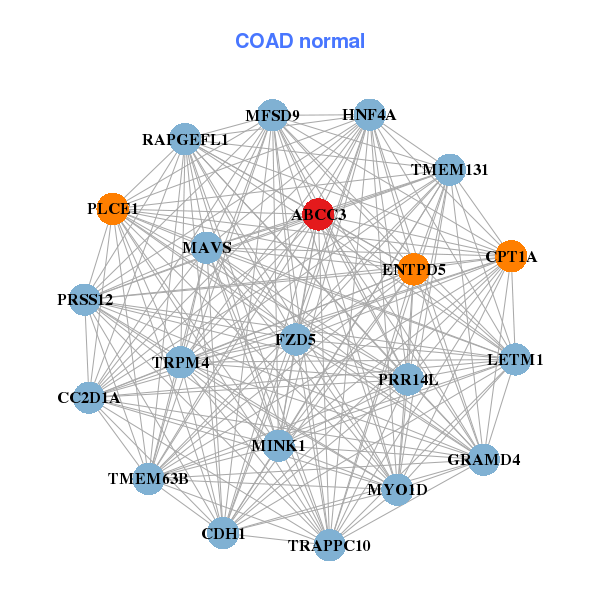
| * Co-Expression network figures were drawn using R package igraph. Only the top 20 genes with the highest correlations were shown. Red circle: input gene, orange circle: cell metabolism gene, sky circle: other gene |
: Open all plots for all cancer types
| Top |
: Open all interacting genes' information including KEGG pathway for all interacting genes from DAVID
| Top |
| Pharmacological Information for ABCC3 |
| DB Category | DB Name | DB's ID and Url link |
| * Gene Centered Interaction Network. |
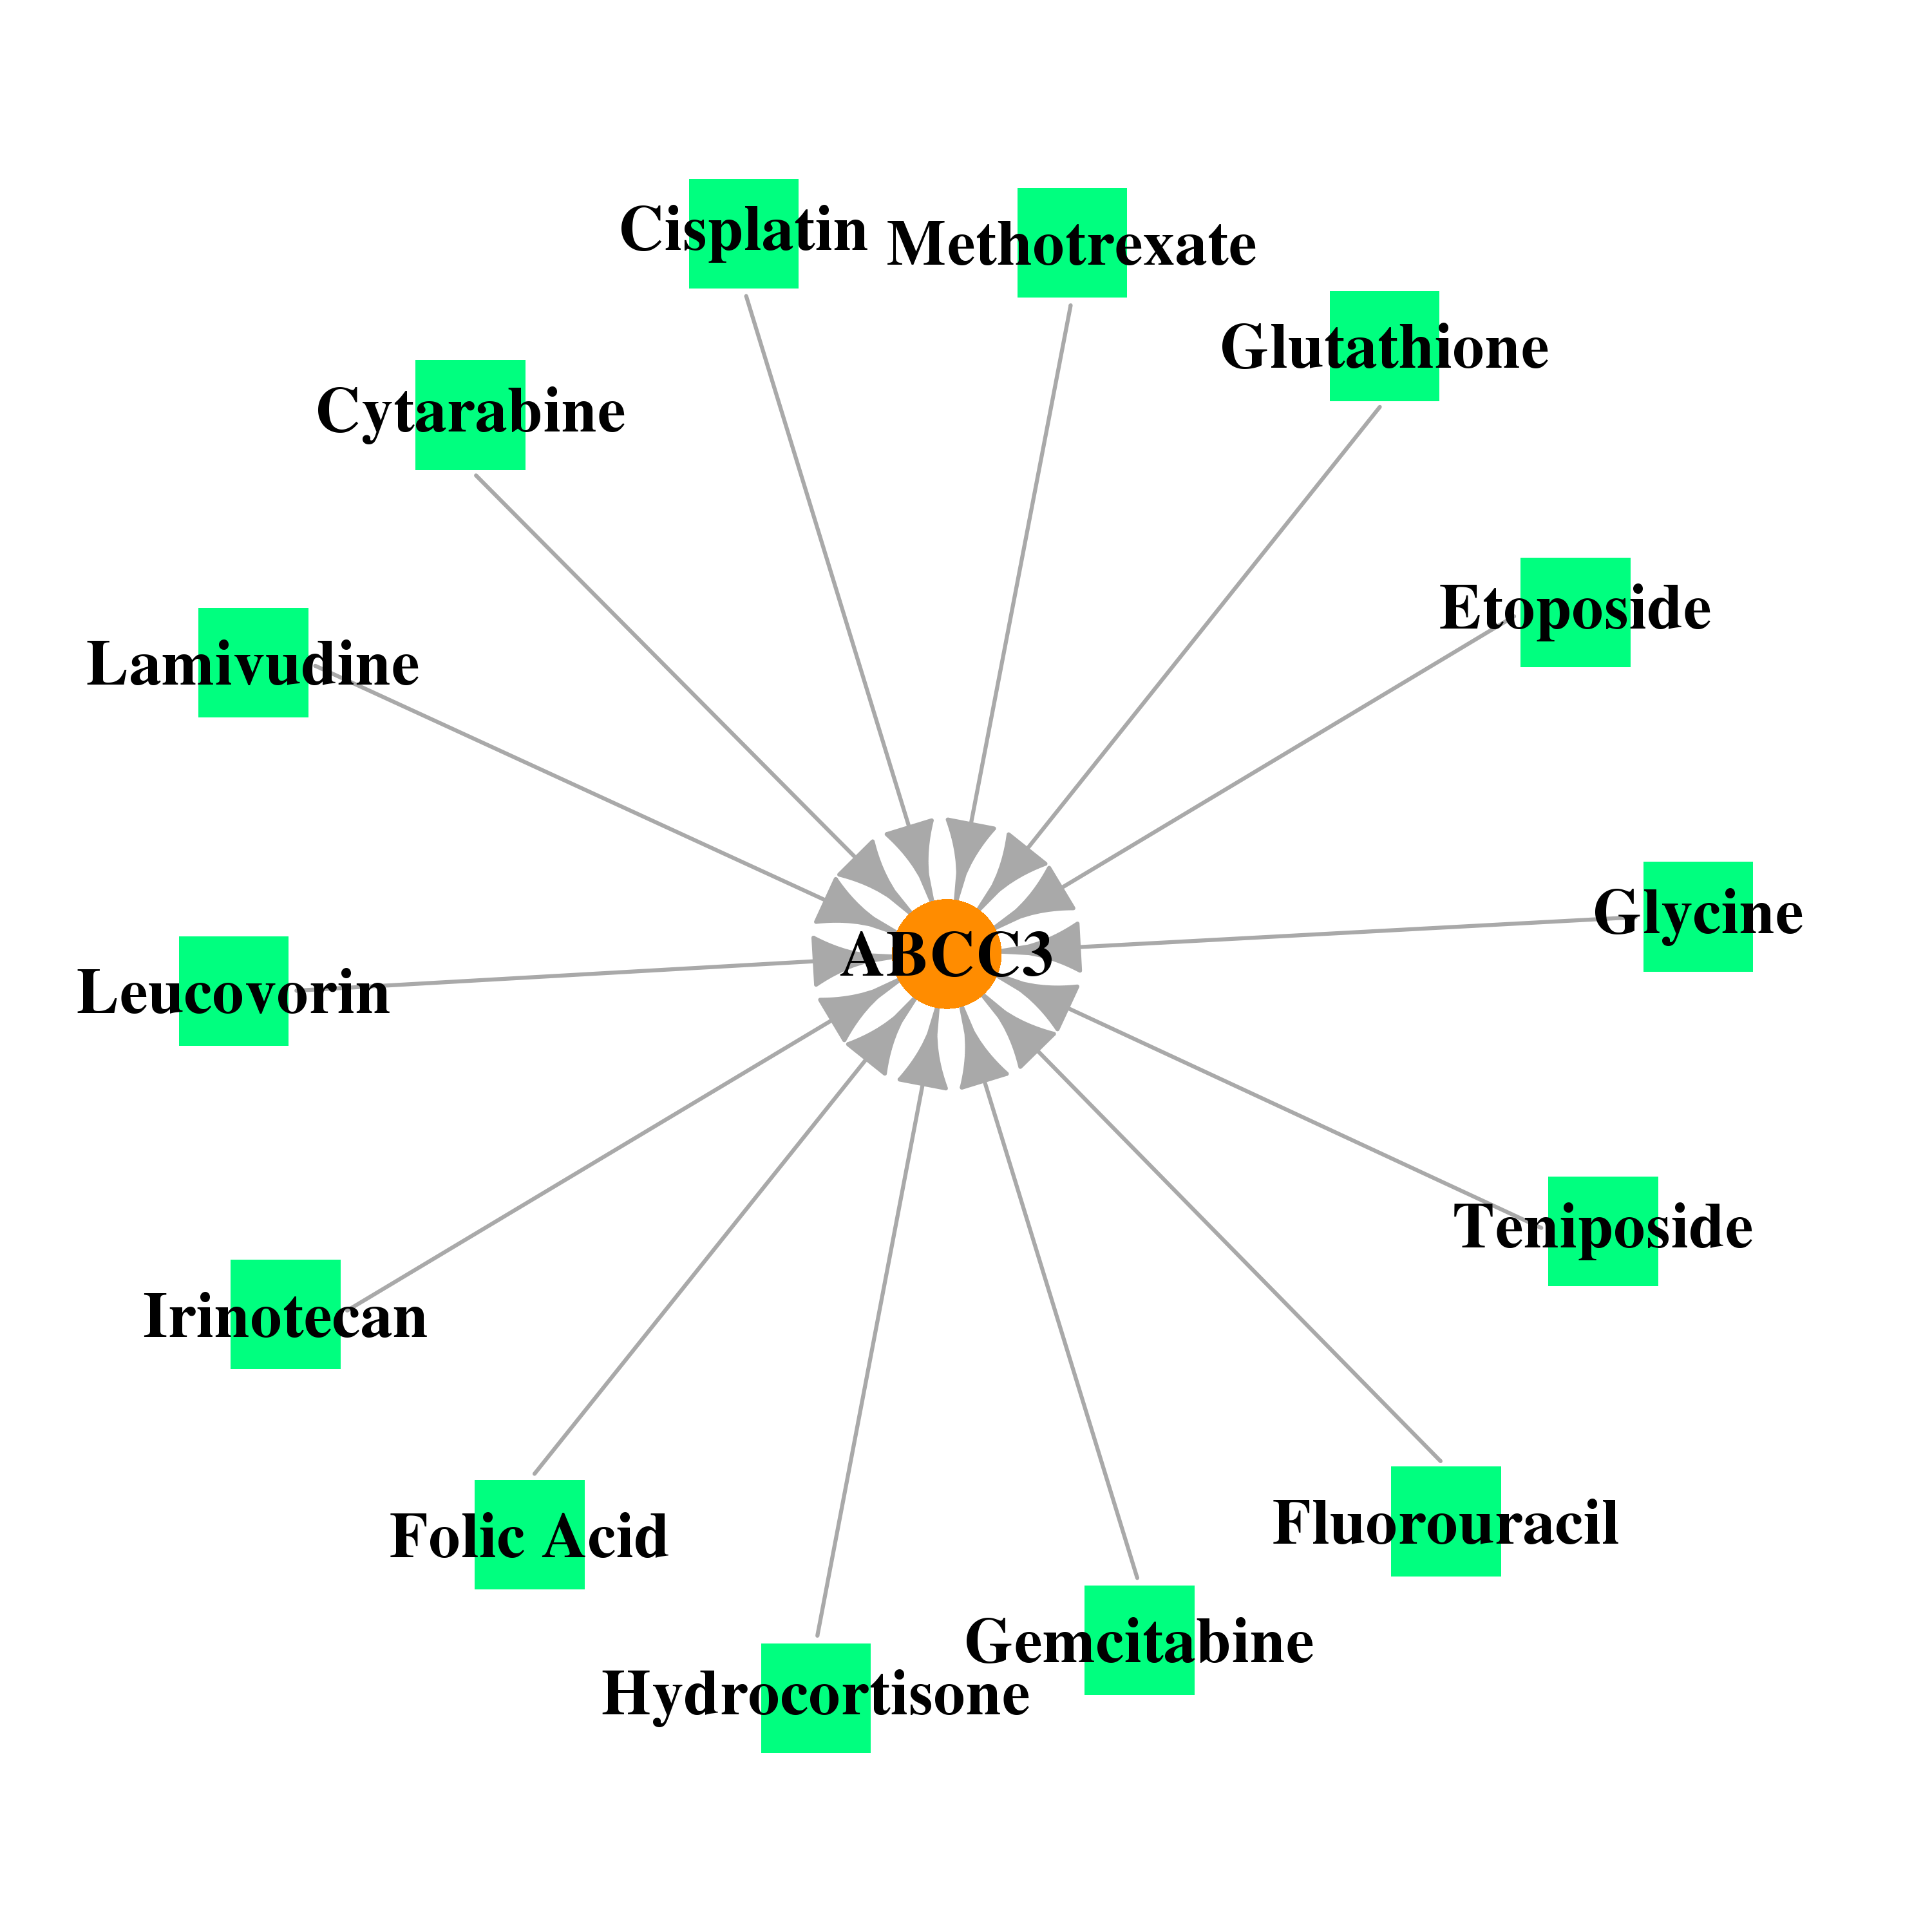 |
| * Drug Centered Interaction Network. |
| DrugBank ID | Target Name | Drug Groups | Generic Name | Drug Centered Network | Drug Structure |
| DB00709 | ATP-binding cassette, sub-family C (CFTR/MRP), member 3 | approved; investigational | Lamivudine |  | 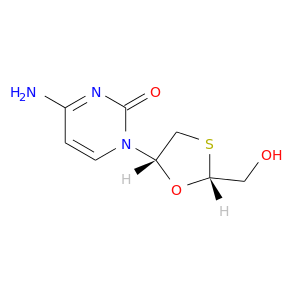 |
| DB00143 | ATP-binding cassette, sub-family C (CFTR/MRP), member 3 | approved; nutraceutical | Glutathione |  |  |
| DB00544 | ATP-binding cassette, sub-family C (CFTR/MRP), member 3 | approved | Fluorouracil |  |  |
| DB00145 | ATP-binding cassette, sub-family C (CFTR/MRP), member 3 | approved; nutraceutical | Glycine |  |  |
| DB00515 | ATP-binding cassette, sub-family C (CFTR/MRP), member 3 | approved | Cisplatin |  |  |
| DB00441 | ATP-binding cassette, sub-family C (CFTR/MRP), member 3 | approved | Gemcitabine | 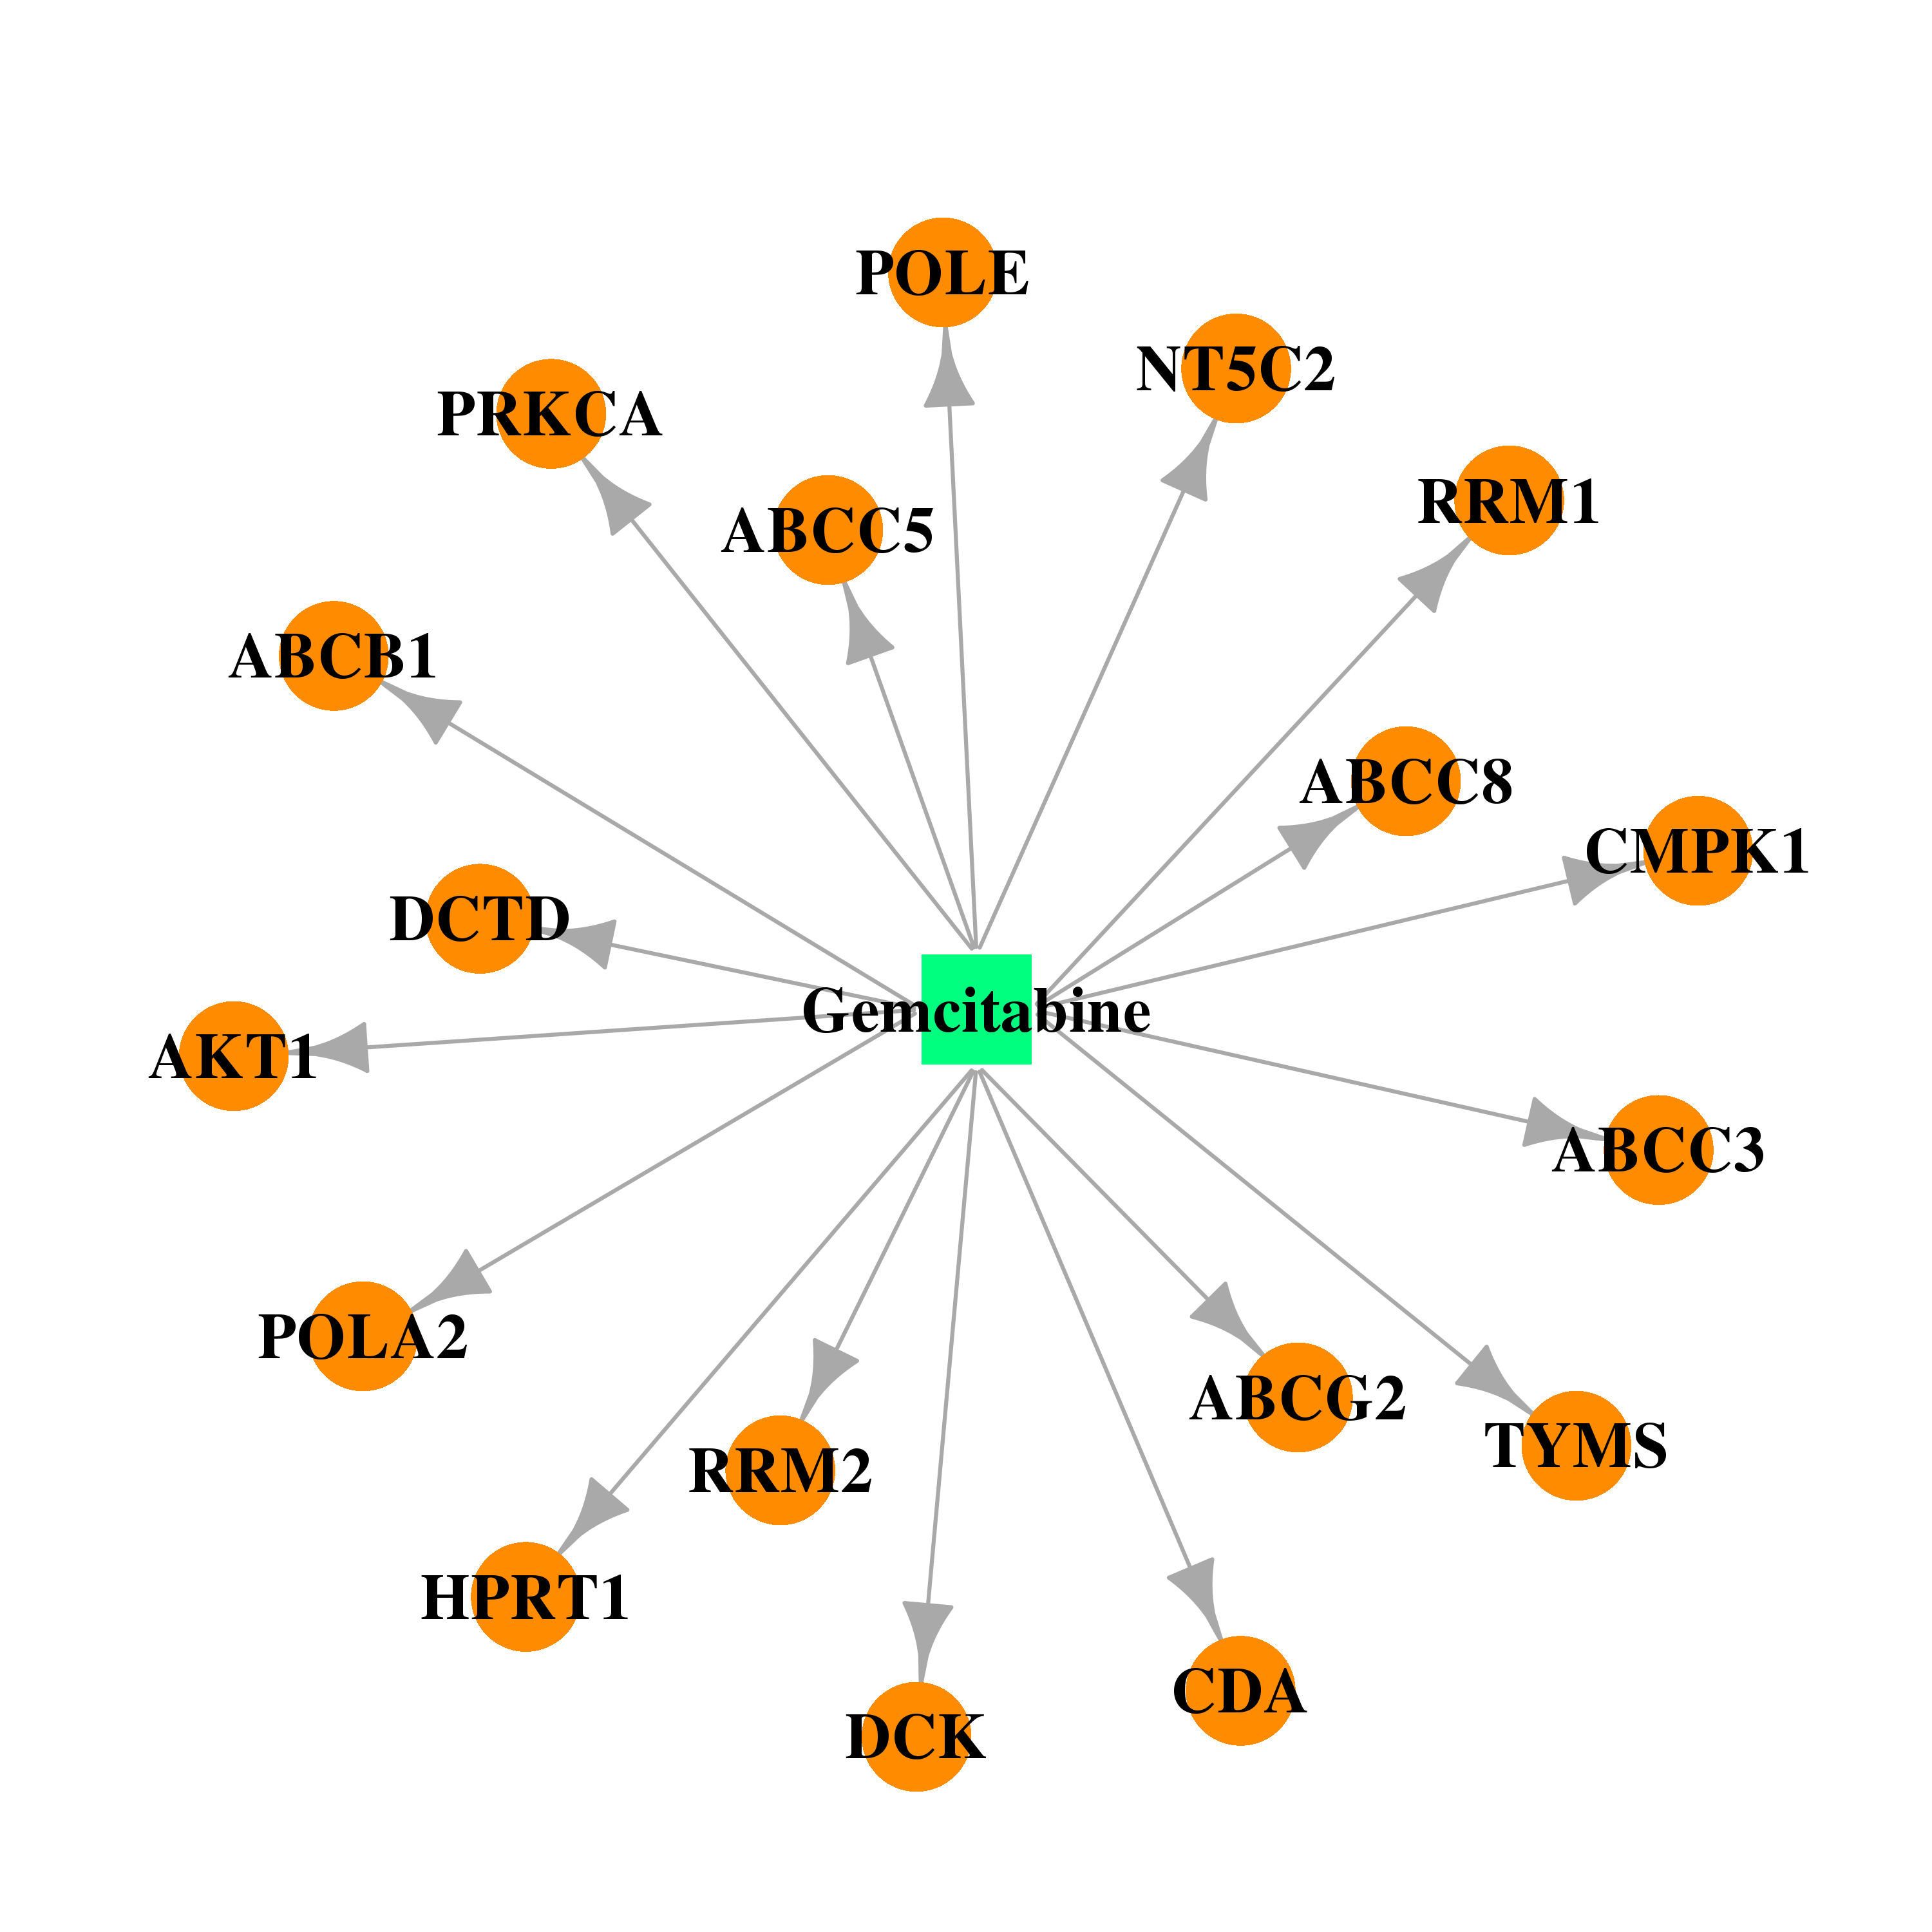 |  |
| DB00158 | ATP-binding cassette, sub-family C (CFTR/MRP), member 3 | approved; nutraceutical | Folic Acid | 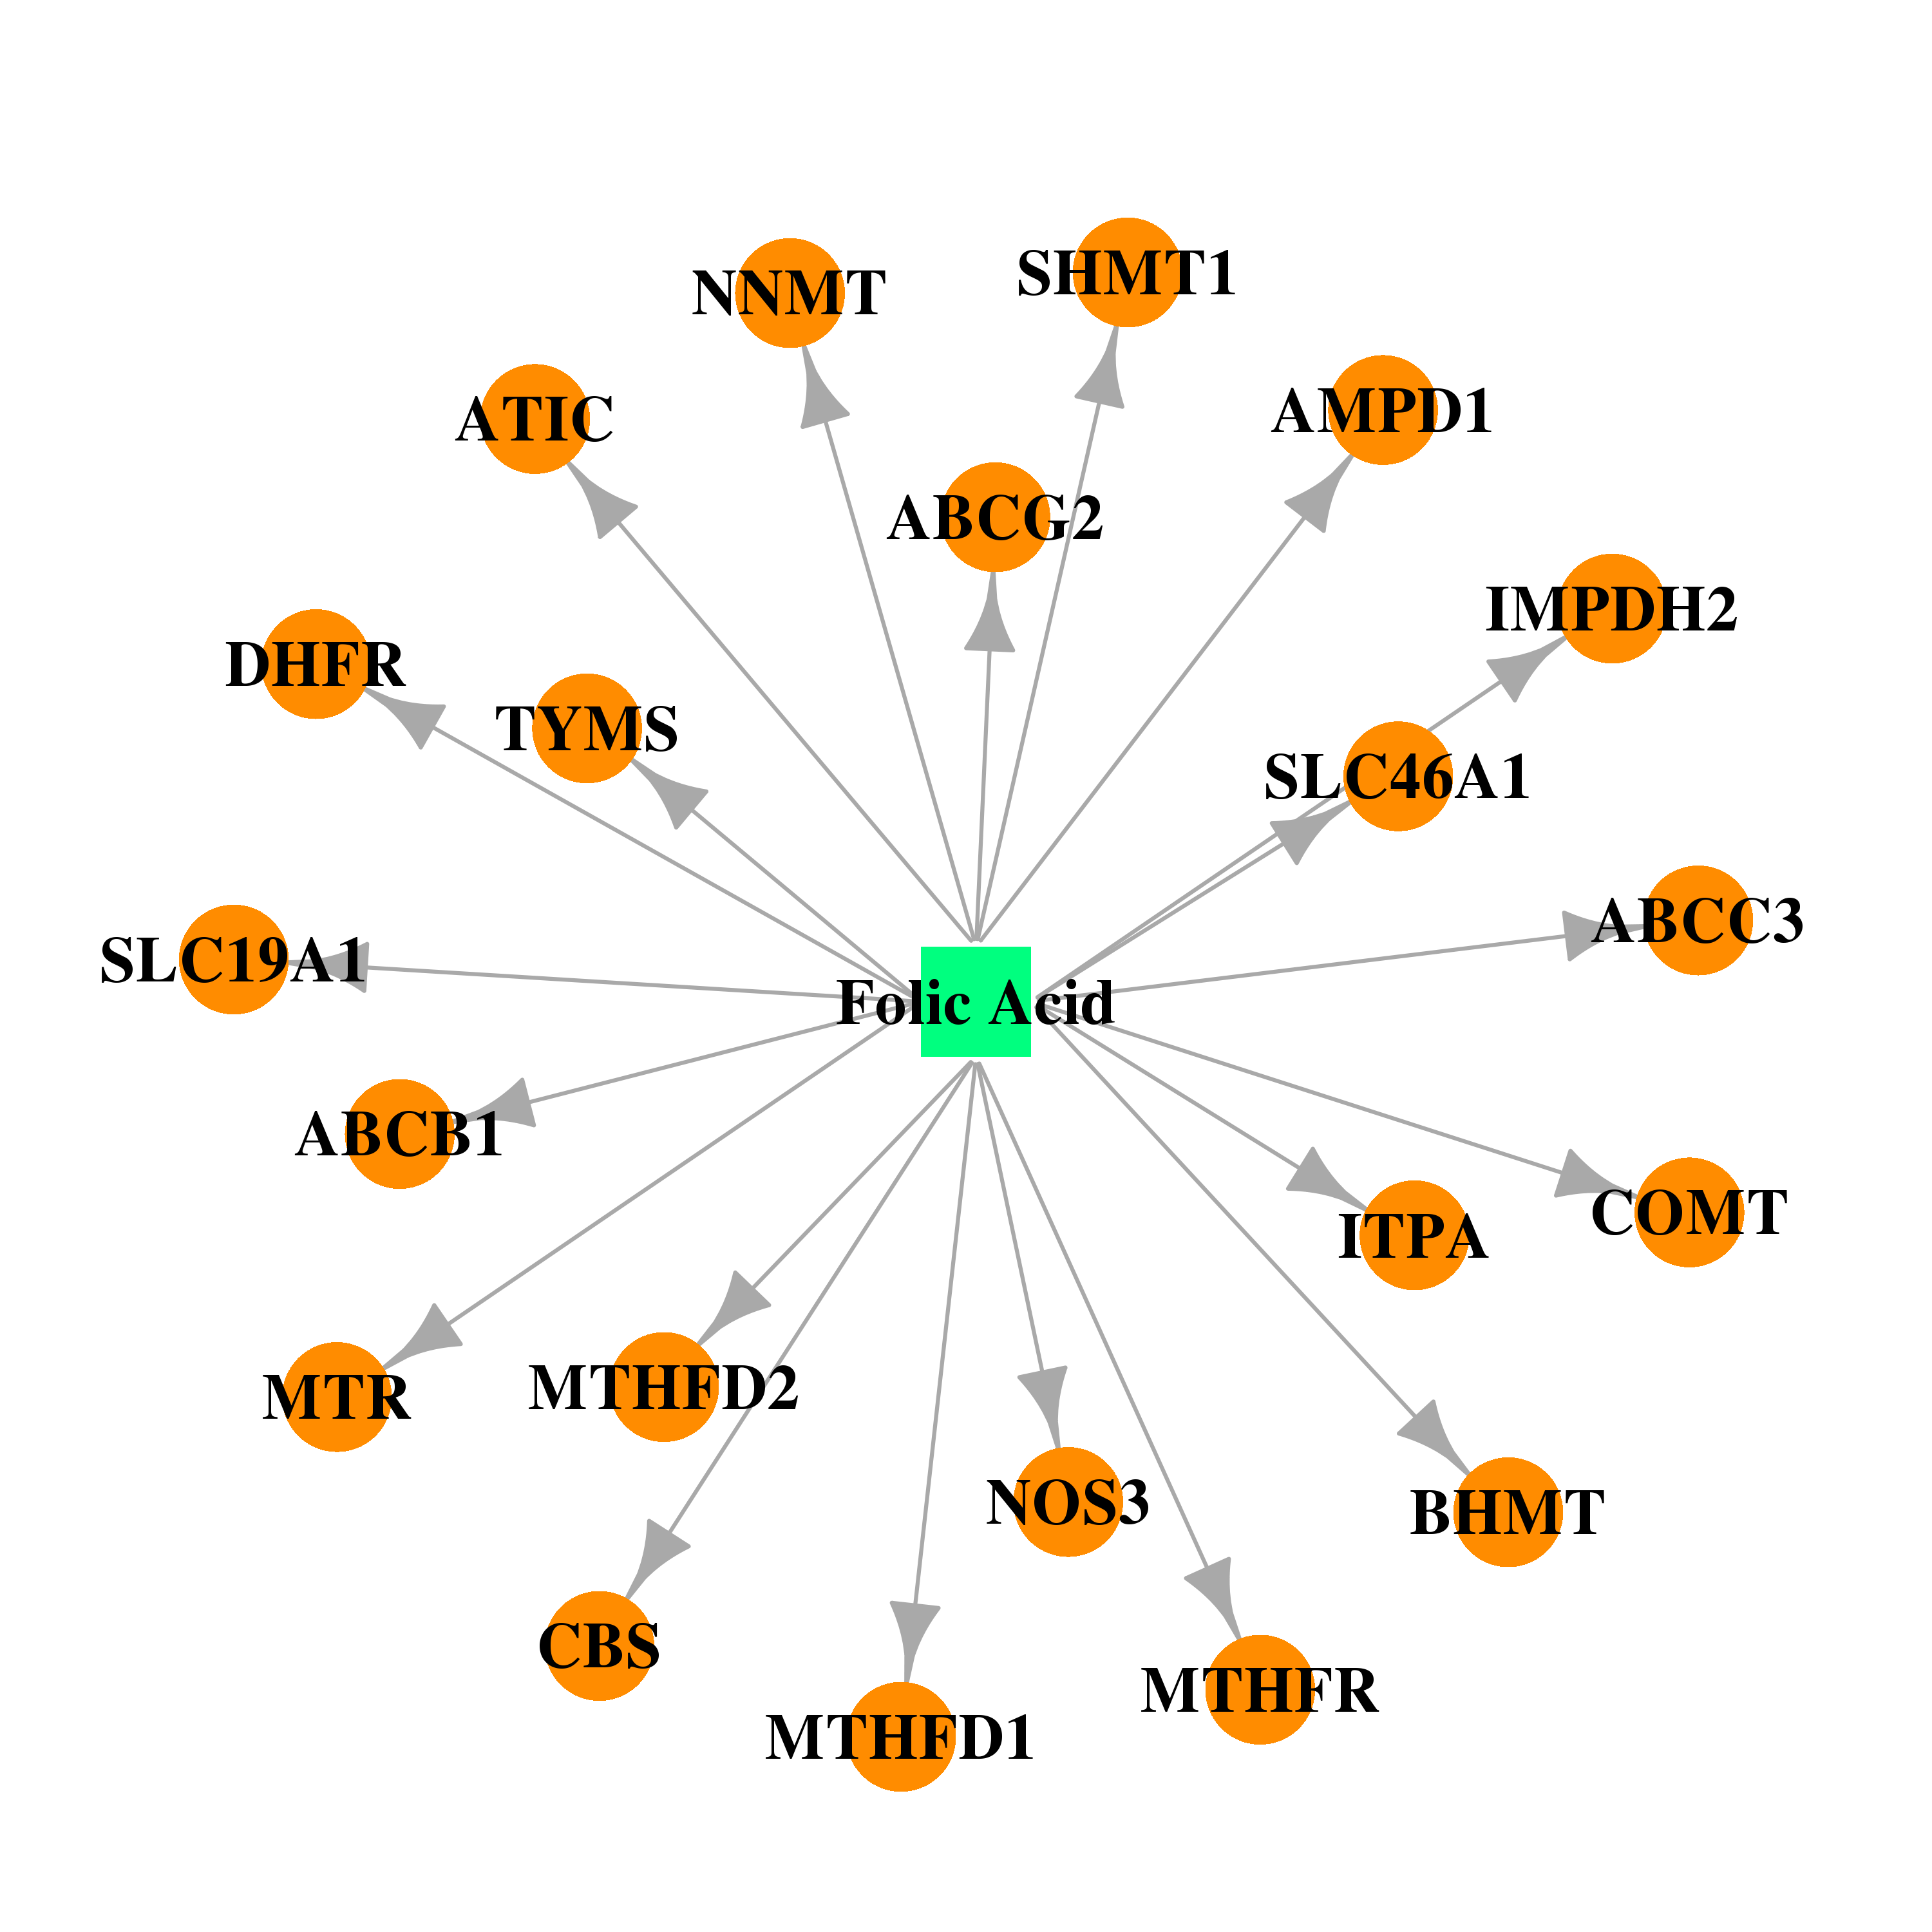 |  |
| DB00650 | ATP-binding cassette, sub-family C (CFTR/MRP), member 3 | approved | Leucovorin | 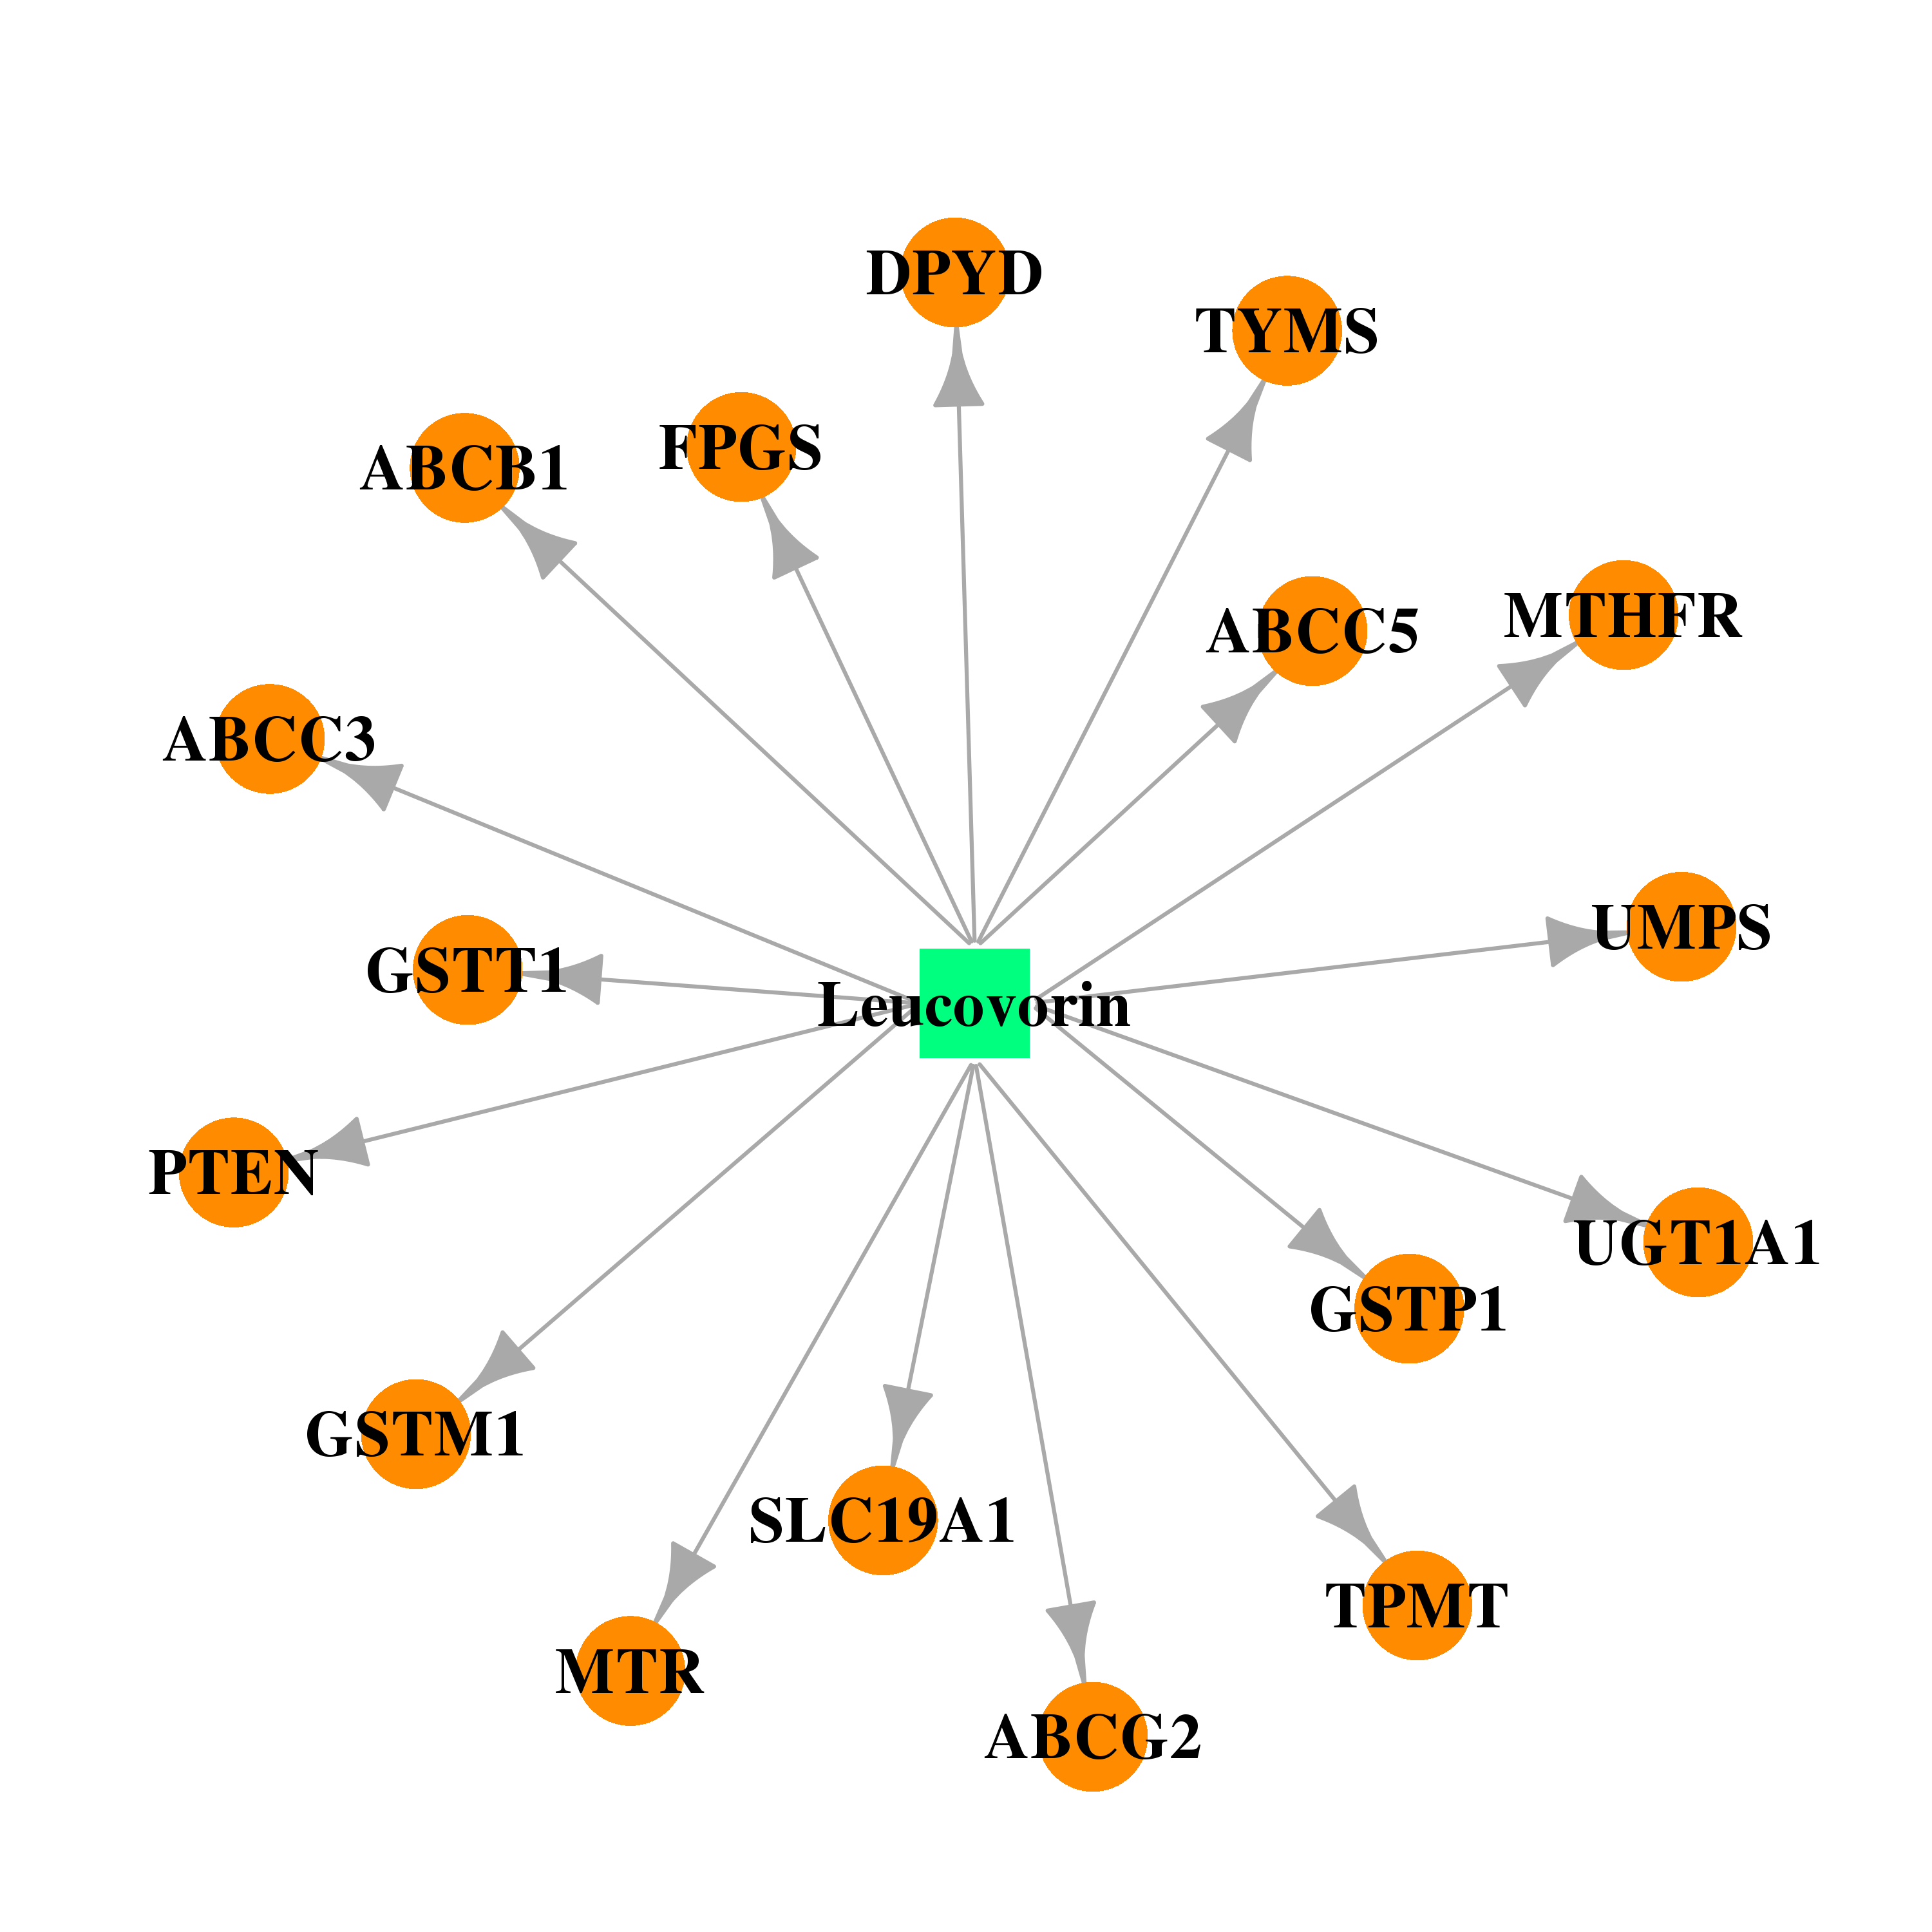 |  |
| DB00563 | ATP-binding cassette, sub-family C (CFTR/MRP), member 3 | approved | Methotrexate |  |  |
| DB00773 | ATP-binding cassette, sub-family C (CFTR/MRP), member 3 | approved | Etoposide |  |  |
| DB00444 | ATP-binding cassette, sub-family C (CFTR/MRP), member 3 | approved | Teniposide |  |  |
| DB00762 | ATP-binding cassette, sub-family C (CFTR/MRP), member 3 | approved; investigational | Irinotecan | 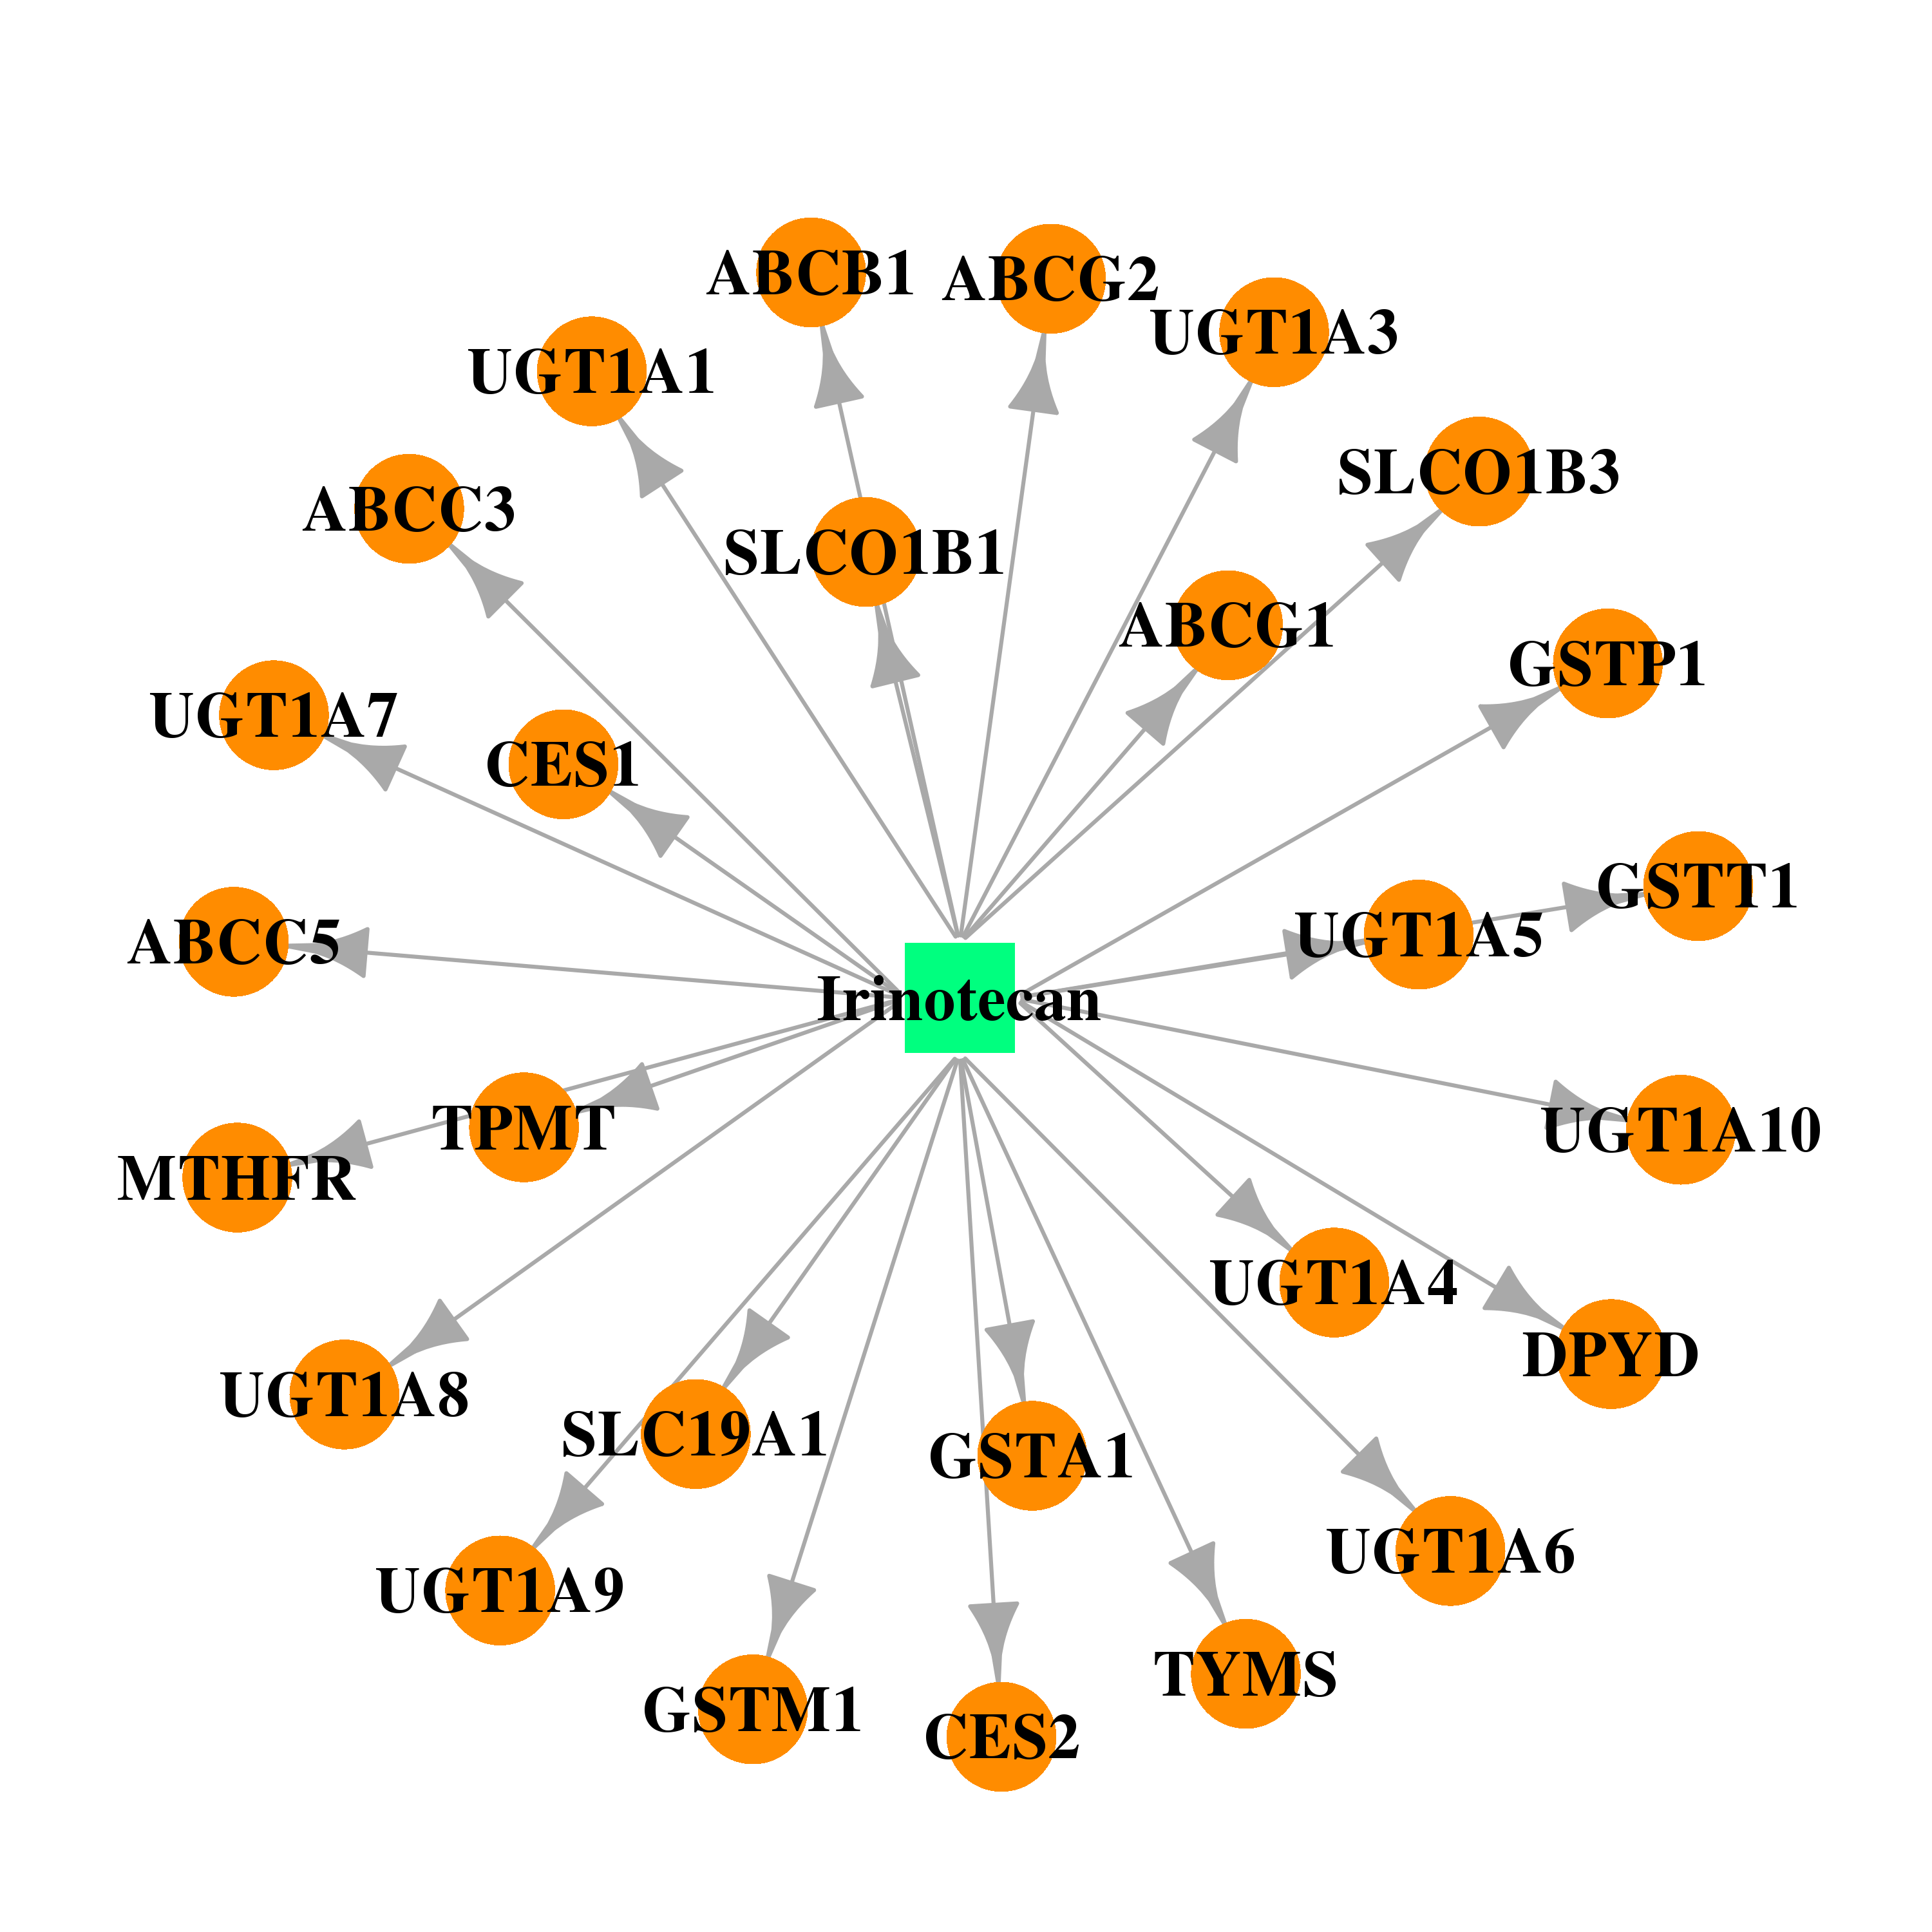 |  |
| DB00987 | ATP-binding cassette, sub-family C (CFTR/MRP), member 3 | approved; investigational | Cytarabine | 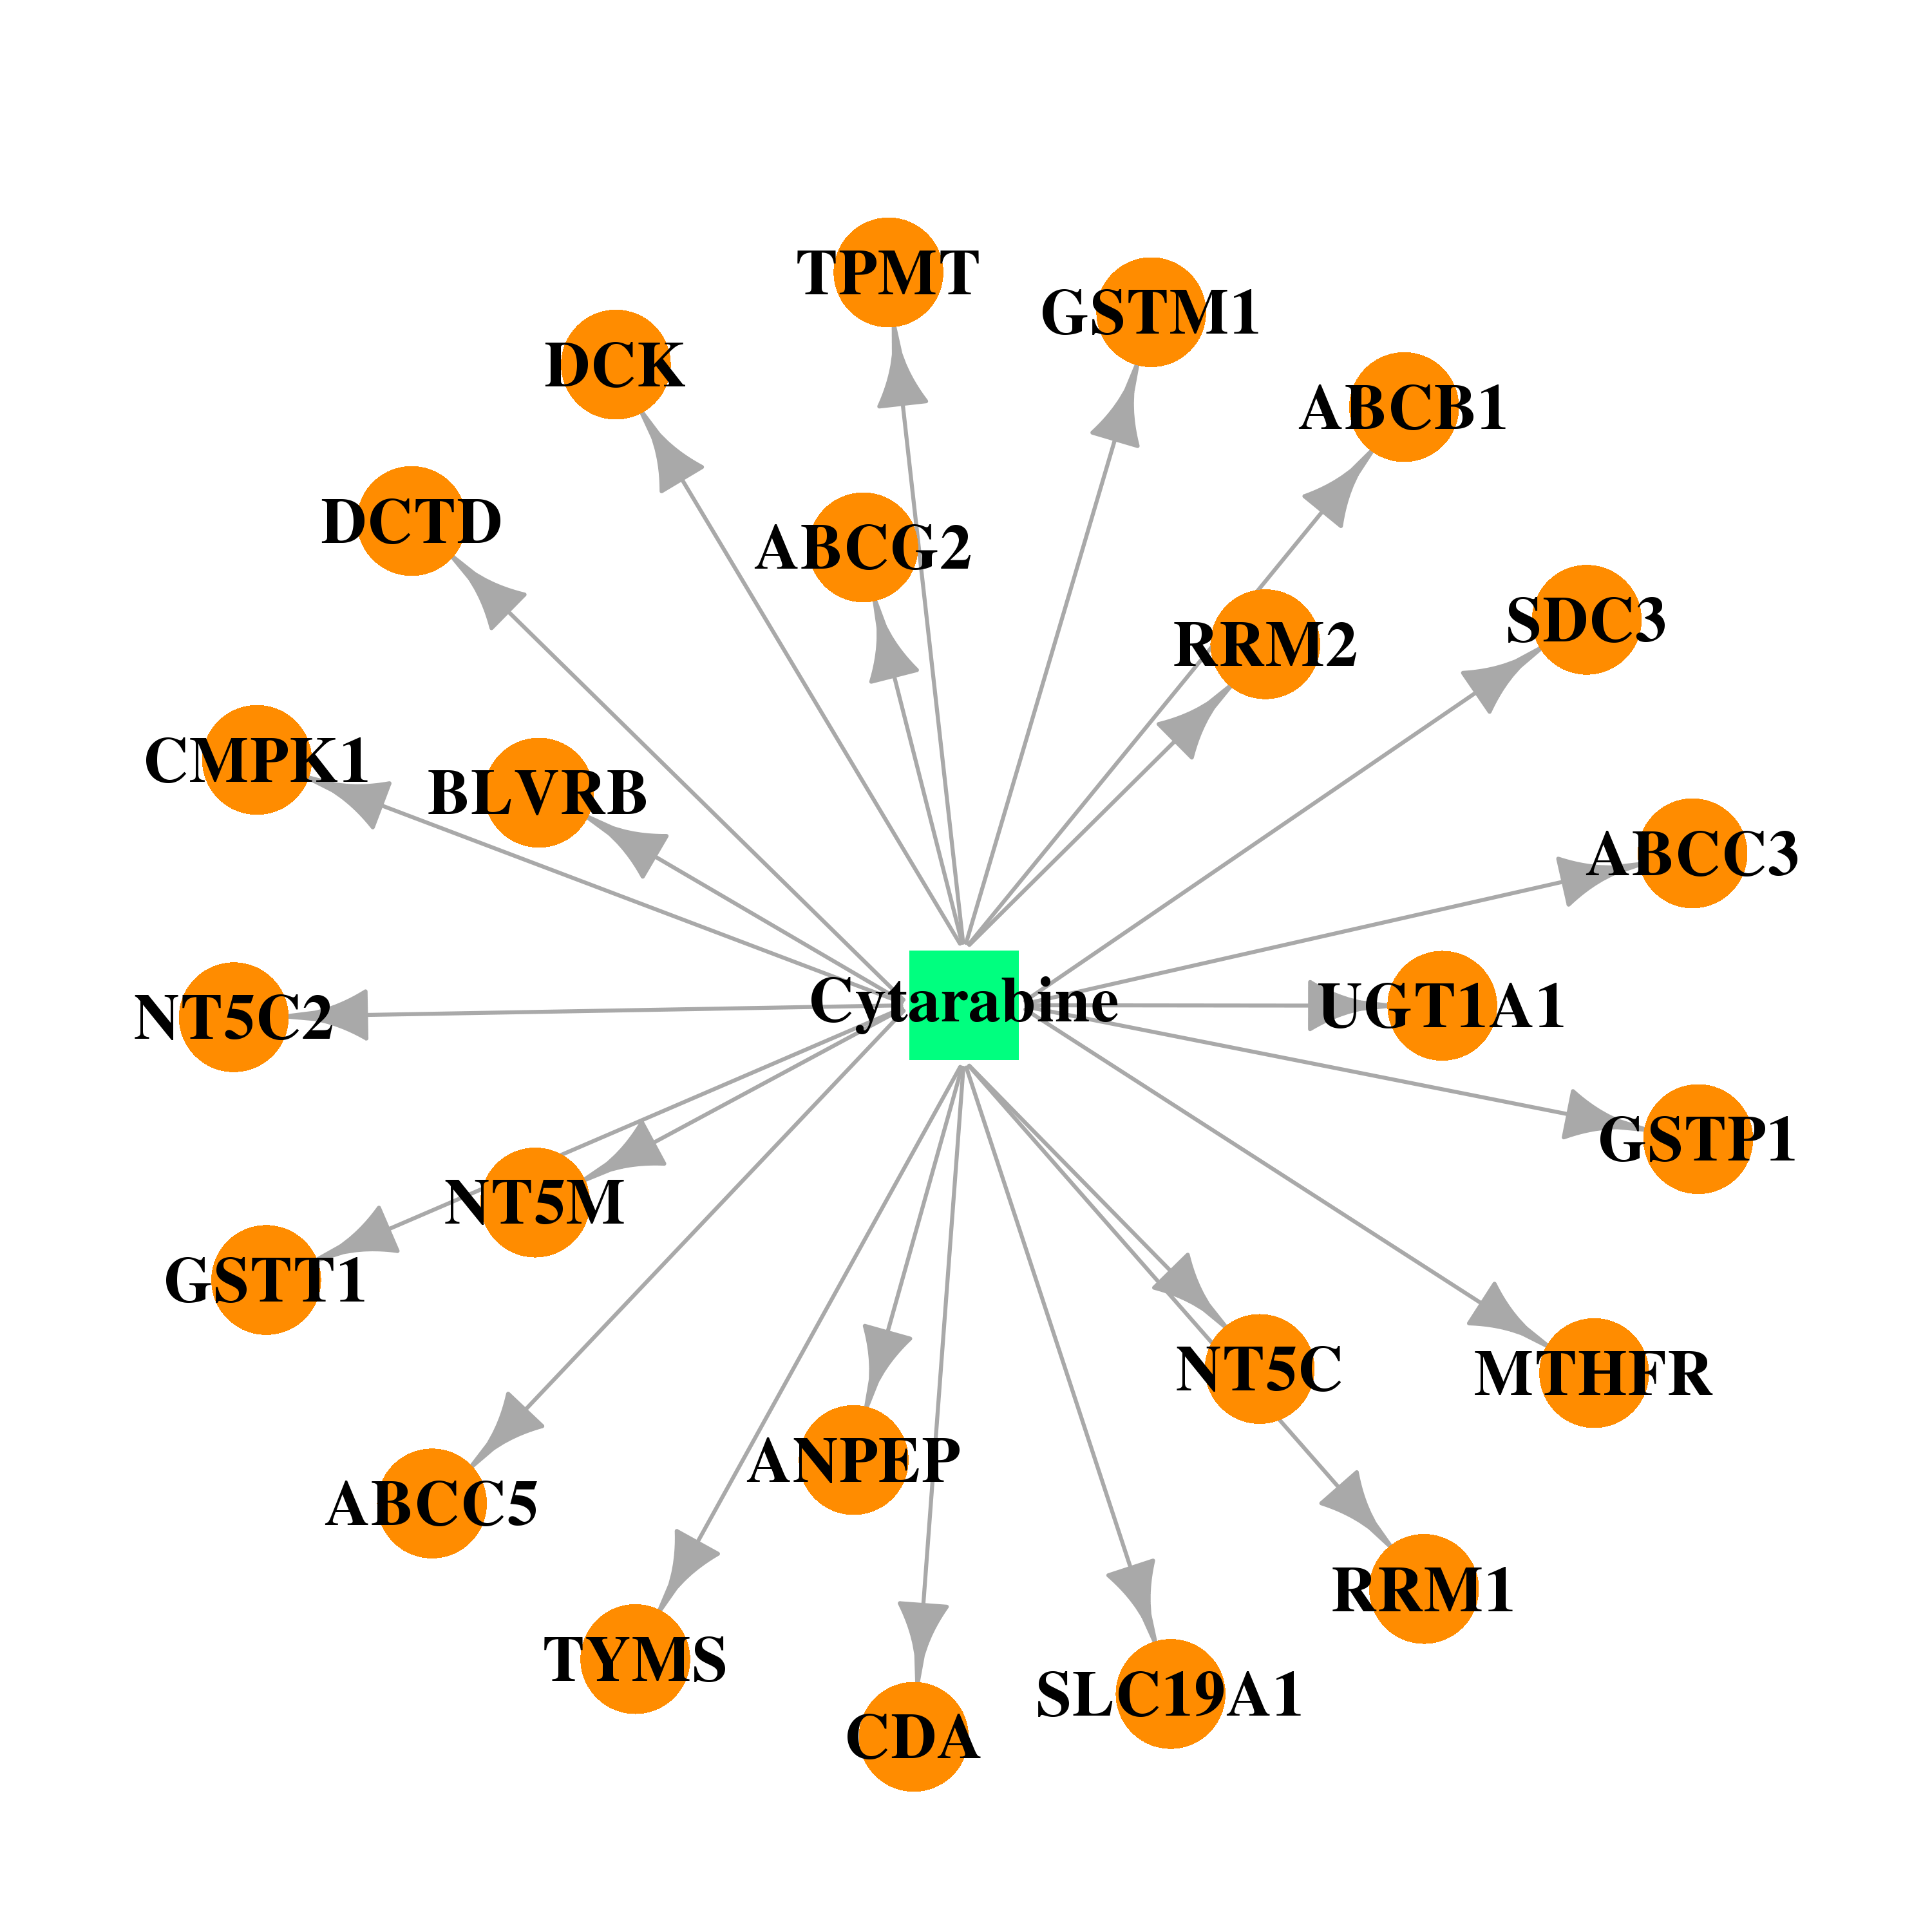 | 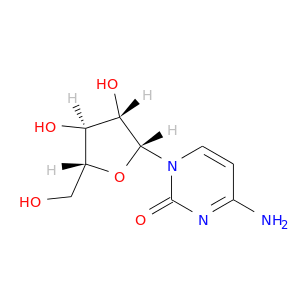 |
| DB00741 | ATP-binding cassette, sub-family C (CFTR/MRP), member 3 | approved | Hydrocortisone |  | 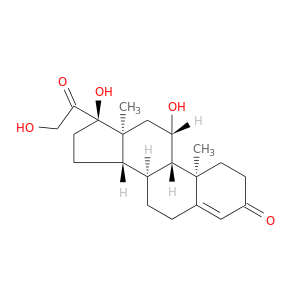 |
| Top |
| Cross referenced IDs for ABCC3 |
| * We obtained these cross-references from Uniprot database. It covers 150 different DBs, 18 categories. http://www.uniprot.org/help/cross_references_section |
: Open all cross reference information
|
Copyright © 2016-Present - The Univsersity of Texas Health Science Center at Houston @ |