|
||||||||||||||||||||
| |
| Phenotypic Information (metabolism pathway, cancer, disease, phenome) |
| |
| |
| Gene-Gene Network Information: Co-Expression Network, Interacting Genes & KEGG |
| |
|


| Gene Summary for GPAA1 |
| Basic gene info. | Gene symbol | GPAA1 |
| Gene name | glycosylphosphatidylinositol anchor attachment 1 | |
| Synonyms | GAA1|hGAA1 | |
| Cytomap | UCSC genome browser: 8q24.3 | |
| Genomic location | chr8 :145137523-145141119 | |
| Type of gene | protein-coding | |
| RefGenes | NM_003801.3, | |
| Ensembl id | ENSG00000260226 | |
| Description | GAA1 protein homologGPAA1P anchor attachment protein 1 homologGPI anchor attachment protein 1GPI transamidase subunitanchor attachment protein 1 (Gaa1p, yeast) homologglycophosphatidylinositol anchor attachment 1glycosylphosphatidylinositol anchor a | |
| Modification date | 20141207 | |
| dbXrefs | MIM : 603048 | |
| HGNC : HGNC | ||
| Ensembl : ENSG00000197858 | ||
| HPRD : 04334 | ||
| Vega : OTTHUMG00000165438 | ||
| Protein | UniProt: go to UniProt's Cross Reference DB Table | |
| Expression | CleanEX: HS_GPAA1 | |
| BioGPS: 8733 | ||
| Gene Expression Atlas: ENSG00000260226 | ||
| The Human Protein Atlas: ENSG00000260226 | ||
| Pathway | NCI Pathway Interaction Database: GPAA1 | |
| KEGG: GPAA1 | ||
| REACTOME: GPAA1 | ||
| ConsensusPathDB | ||
| Pathway Commons: GPAA1 | ||
| Metabolism | MetaCyc: GPAA1 | |
| HUMANCyc: GPAA1 | ||
| Regulation | Ensembl's Regulation: ENSG00000260226 | |
| miRBase: chr8 :145,137,523-145,141,119 | ||
| TargetScan: NM_003801 | ||
| cisRED: ENSG00000260226 | ||
| Context | iHOP: GPAA1 | |
| cancer metabolism search in PubMed: GPAA1 | ||
| UCL Cancer Institute: GPAA1 | ||
| Assigned class in ccmGDB | C | |
| Top |
| Phenotypic Information for GPAA1(metabolism pathway, cancer, disease, phenome) |
| Cancer | CGAP: GPAA1 |
| Familial Cancer Database: GPAA1 | |
| * This gene is included in those cancer gene databases. |
|
|
|
|
|
| . | ||||||||||||||
Oncogene 1 | Significant driver gene in | |||||||||||||||||||
| cf) number; DB name 1 Oncogene; http://nar.oxfordjournals.org/content/35/suppl_1/D721.long, 2 Tumor Suppressor gene; https://bioinfo.uth.edu/TSGene/, 3 Cancer Gene Census; http://www.nature.com/nrc/journal/v4/n3/abs/nrc1299.html, 4 CancerGenes; http://nar.oxfordjournals.org/content/35/suppl_1/D721.long, 5 Network of Cancer Gene; http://ncg.kcl.ac.uk/index.php, 1Therapeutic Vulnerabilities in Cancer; http://cbio.mskcc.org/cancergenomics/statius/ |
| REACTOME_METABOLISM_OF_PROTEINS | |
| OMIM | |
| Orphanet | |
| Disease | KEGG Disease: GPAA1 |
| MedGen: GPAA1 (Human Medical Genetics with Condition) | |
| ClinVar: GPAA1 | |
| Phenotype | MGI: GPAA1 (International Mouse Phenotyping Consortium) |
| PhenomicDB: GPAA1 | |
| Mutations for GPAA1 |
| * Under tables are showing count per each tissue to give us broad intuition about tissue specific mutation patterns.You can go to the detailed page for each mutation database's web site. |
| There's no structural variation information in COSMIC data for this gene. |
| * From mRNA Sanger sequences, Chitars2.0 arranged chimeric transcripts. This table shows GPAA1 related fusion information. |
| ID | Head Gene | Tail Gene | Accession | Gene_a | qStart_a | qEnd_a | Chromosome_a | tStart_a | tEnd_a | Gene_a | qStart_a | qEnd_a | Chromosome_a | tStart_a | tEnd_a |
| Top |
| There's no copy number variation information in COSMIC data for this gene. |
| Top |
|
 |
| Top |
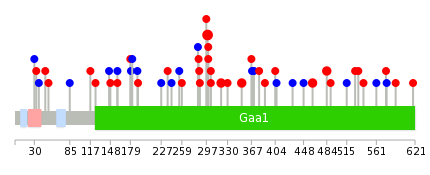
| Stat. for Non-Synonymous SNVs (# total SNVs=29) | (# total SNVs=13) |
 |  |
(# total SNVs=0) | (# total SNVs=0) |
| Top |
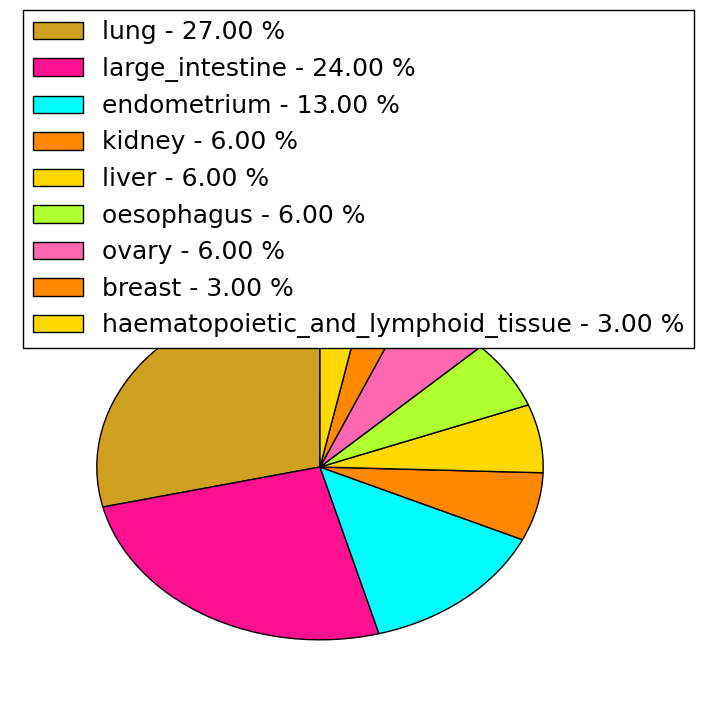
| * When you move the cursor on each content, you can see more deailed mutation information on the Tooltip. Those are primary_site,primary_histology,mutation(aa),pubmedID. |
| GRCh37 position | Mutation(aa) | Unique sampleID count |
| chr8:145139397-145139397 | p.S299P | 4 |
| chr8:145140316-145140316 | p.E462G | 2 |
| chr8:145140382-145140382 | p.R484Q | 2 |
| chr8:145139400-145139400 | p.G300S | 2 |
| chr8:145139412-145139412 | p.G304S | 2 |
| chr8:145139460-145139460 | p.R320C | 2 |
| chr8:145139522-145139522 | p.? | 2 |
| chr8:145139669-145139669 | p.R352L | 2 |
| chr8:145138063-145138063 | p.L37L | 1 |
| chr8:145139713-145139713 | p.R367C | 1 |
| Top |
|
 |
| Point Mutation/ Tissue ID | 1 | 2 | 3 | 4 | 5 | 6 | 7 | 8 | 9 | 10 | 11 | 12 | 13 | 14 | 15 | 16 | 17 | 18 | 19 | 20 |
| # sample | 1 | 1 | 7 | 3 | 1 | 1 | 5 | 5 | 2 | 7 | 2 | |||||||||
| # mutation | 1 | 1 | 7 | 3 | 1 | 1 | 5 | 5 | 2 | 8 | 3 | |||||||||
| nonsynonymous SNV | 1 | 1 | 5 | 1 | 1 | 1 | 2 | 3 | 5 | 3 | ||||||||||
| synonymous SNV | 2 | 2 | 3 | 2 | 2 | 3 |
| cf) Tissue ID; Tissue type (1; BLCA[Bladder Urothelial Carcinoma], 2; BRCA[Breast invasive carcinoma], 3; CESC[Cervical squamous cell carcinoma and endocervical adenocarcinoma], 4; COAD[Colon adenocarcinoma], 5; GBM[Glioblastoma multiforme], 6; Glioma Low Grade, 7; HNSC[Head and Neck squamous cell carcinoma], 8; KICH[Kidney Chromophobe], 9; KIRC[Kidney renal clear cell carcinoma], 10; KIRP[Kidney renal papillary cell carcinoma], 11; LAML[Acute Myeloid Leukemia], 12; LUAD[Lung adenocarcinoma], 13; LUSC[Lung squamous cell carcinoma], 14; OV[Ovarian serous cystadenocarcinoma ], 15; PAAD[Pancreatic adenocarcinoma], 16; PRAD[Prostate adenocarcinoma], 17; SKCM[Skin Cutaneous Melanoma], 18:STAD[Stomach adenocarcinoma], 19:THCA[Thyroid carcinoma], 20:UCEC[Uterine Corpus Endometrial Carcinoma]) |
| Top |
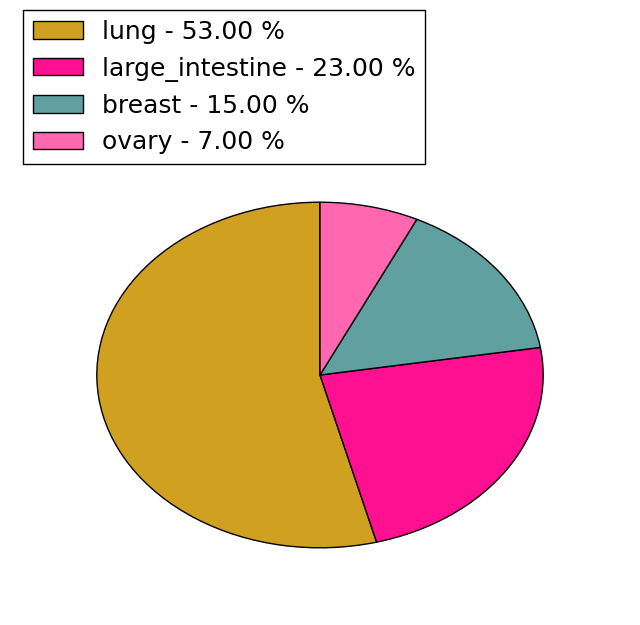
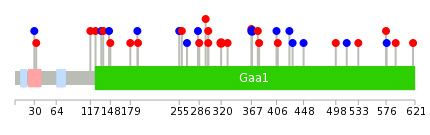
| * We represented just top 10 SNVs. When you move the cursor on each content, you can see more deailed mutation information on the Tooltip. Those are primary_site, primary_histology, mutation(aa), pubmedID. |
| Genomic Position | Mutation(aa) | Unique sampleID count |
| chr8:145139400 | p.F368F | 2 |
| chr8:145139460 | p.G300S | 2 |
| chr8:145139718 | p.R320C | 2 |
| chr8:145138388 | p.R134R | 1 |
| chr8:145140934 | p.R367C | 1 |
| chr8:145139221 | p.R137C | 1 |
| chr8:145139999 | p.L146L | 1 |
| chr8:145138624 | p.A377V | 1 |
| chr8:145141014 | p.V148M | 1 |
| chr8:145139352 | p.G379S | 1 |
| * Copy number data were extracted from TCGA using R package TCGA-Assembler. The URLs of all public data files on TCGA DCC data server were gathered on Jan-05-2015. Function ProcessCNAData in TCGA-Assembler package was used to obtain gene-level copy number value which is calculated as the average copy number of the genomic region of a gene. |
 |
| cf) Tissue ID[Tissue type]: BLCA[Bladder Urothelial Carcinoma], BRCA[Breast invasive carcinoma], CESC[Cervical squamous cell carcinoma and endocervical adenocarcinoma], COAD[Colon adenocarcinoma], GBM[Glioblastoma multiforme], Glioma Low Grade, HNSC[Head and Neck squamous cell carcinoma], KICH[Kidney Chromophobe], KIRC[Kidney renal clear cell carcinoma], KIRP[Kidney renal papillary cell carcinoma], LAML[Acute Myeloid Leukemia], LUAD[Lung adenocarcinoma], LUSC[Lung squamous cell carcinoma], OV[Ovarian serous cystadenocarcinoma ], PAAD[Pancreatic adenocarcinoma], PRAD[Prostate adenocarcinoma], SKCM[Skin Cutaneous Melanoma], STAD[Stomach adenocarcinoma], THCA[Thyroid carcinoma], UCEC[Uterine Corpus Endometrial Carcinoma] |
| Top |
| Gene Expression for GPAA1 |
| * CCLE gene expression data were extracted from CCLE_Expression_Entrez_2012-10-18.res: Gene-centric RMA-normalized mRNA expression data. |
 |
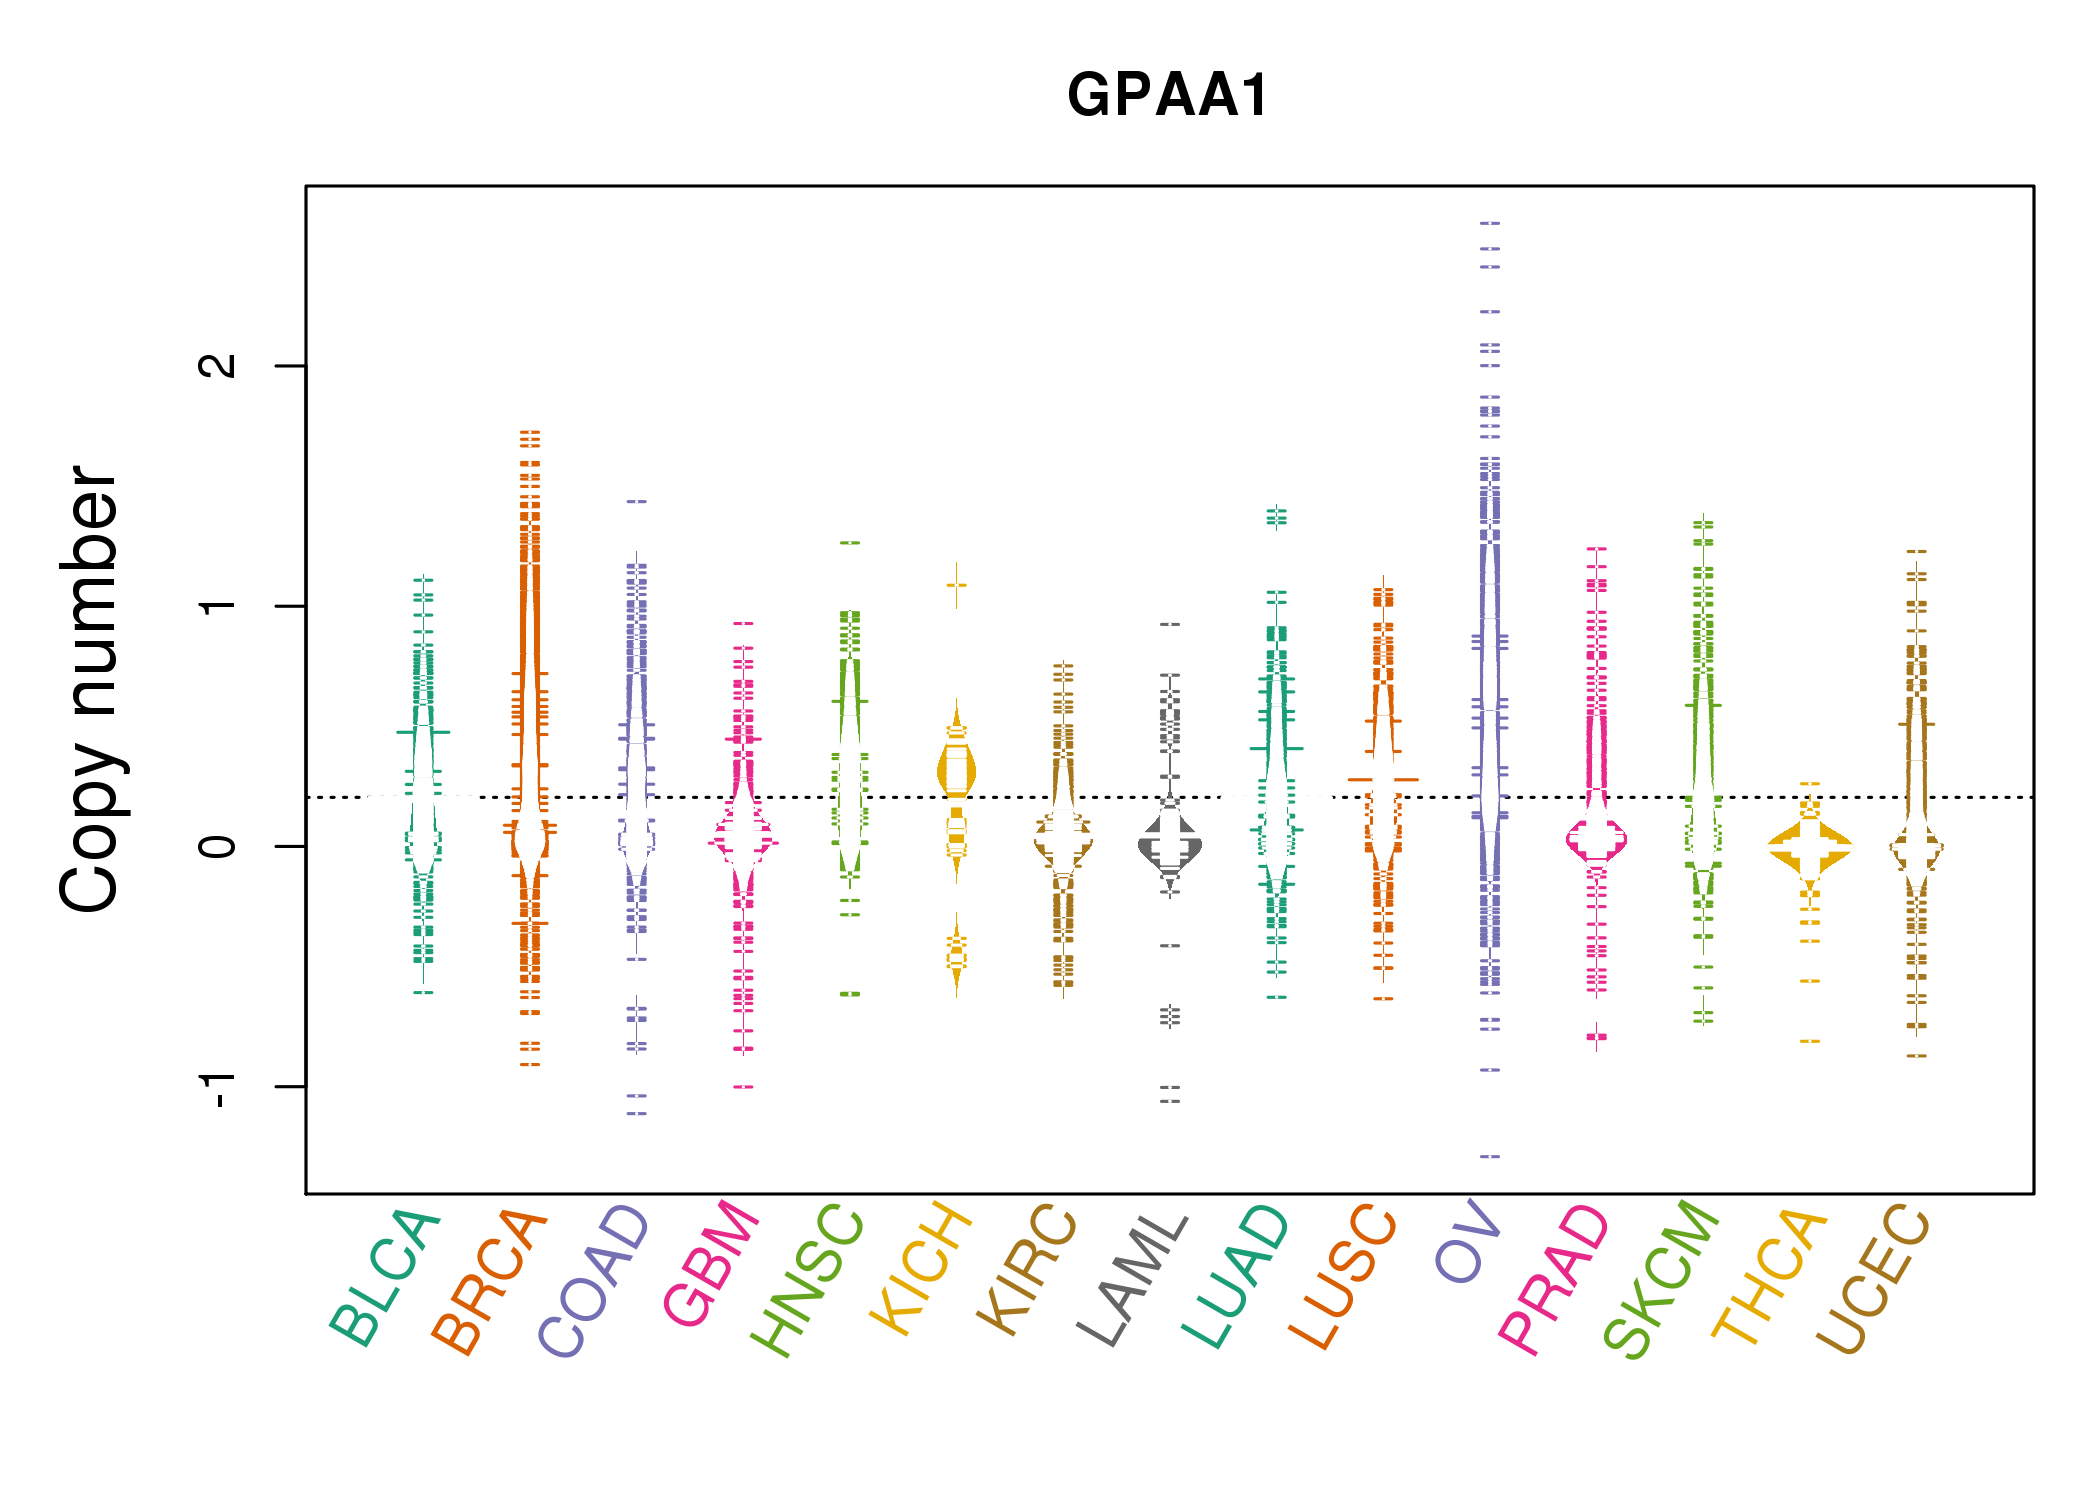
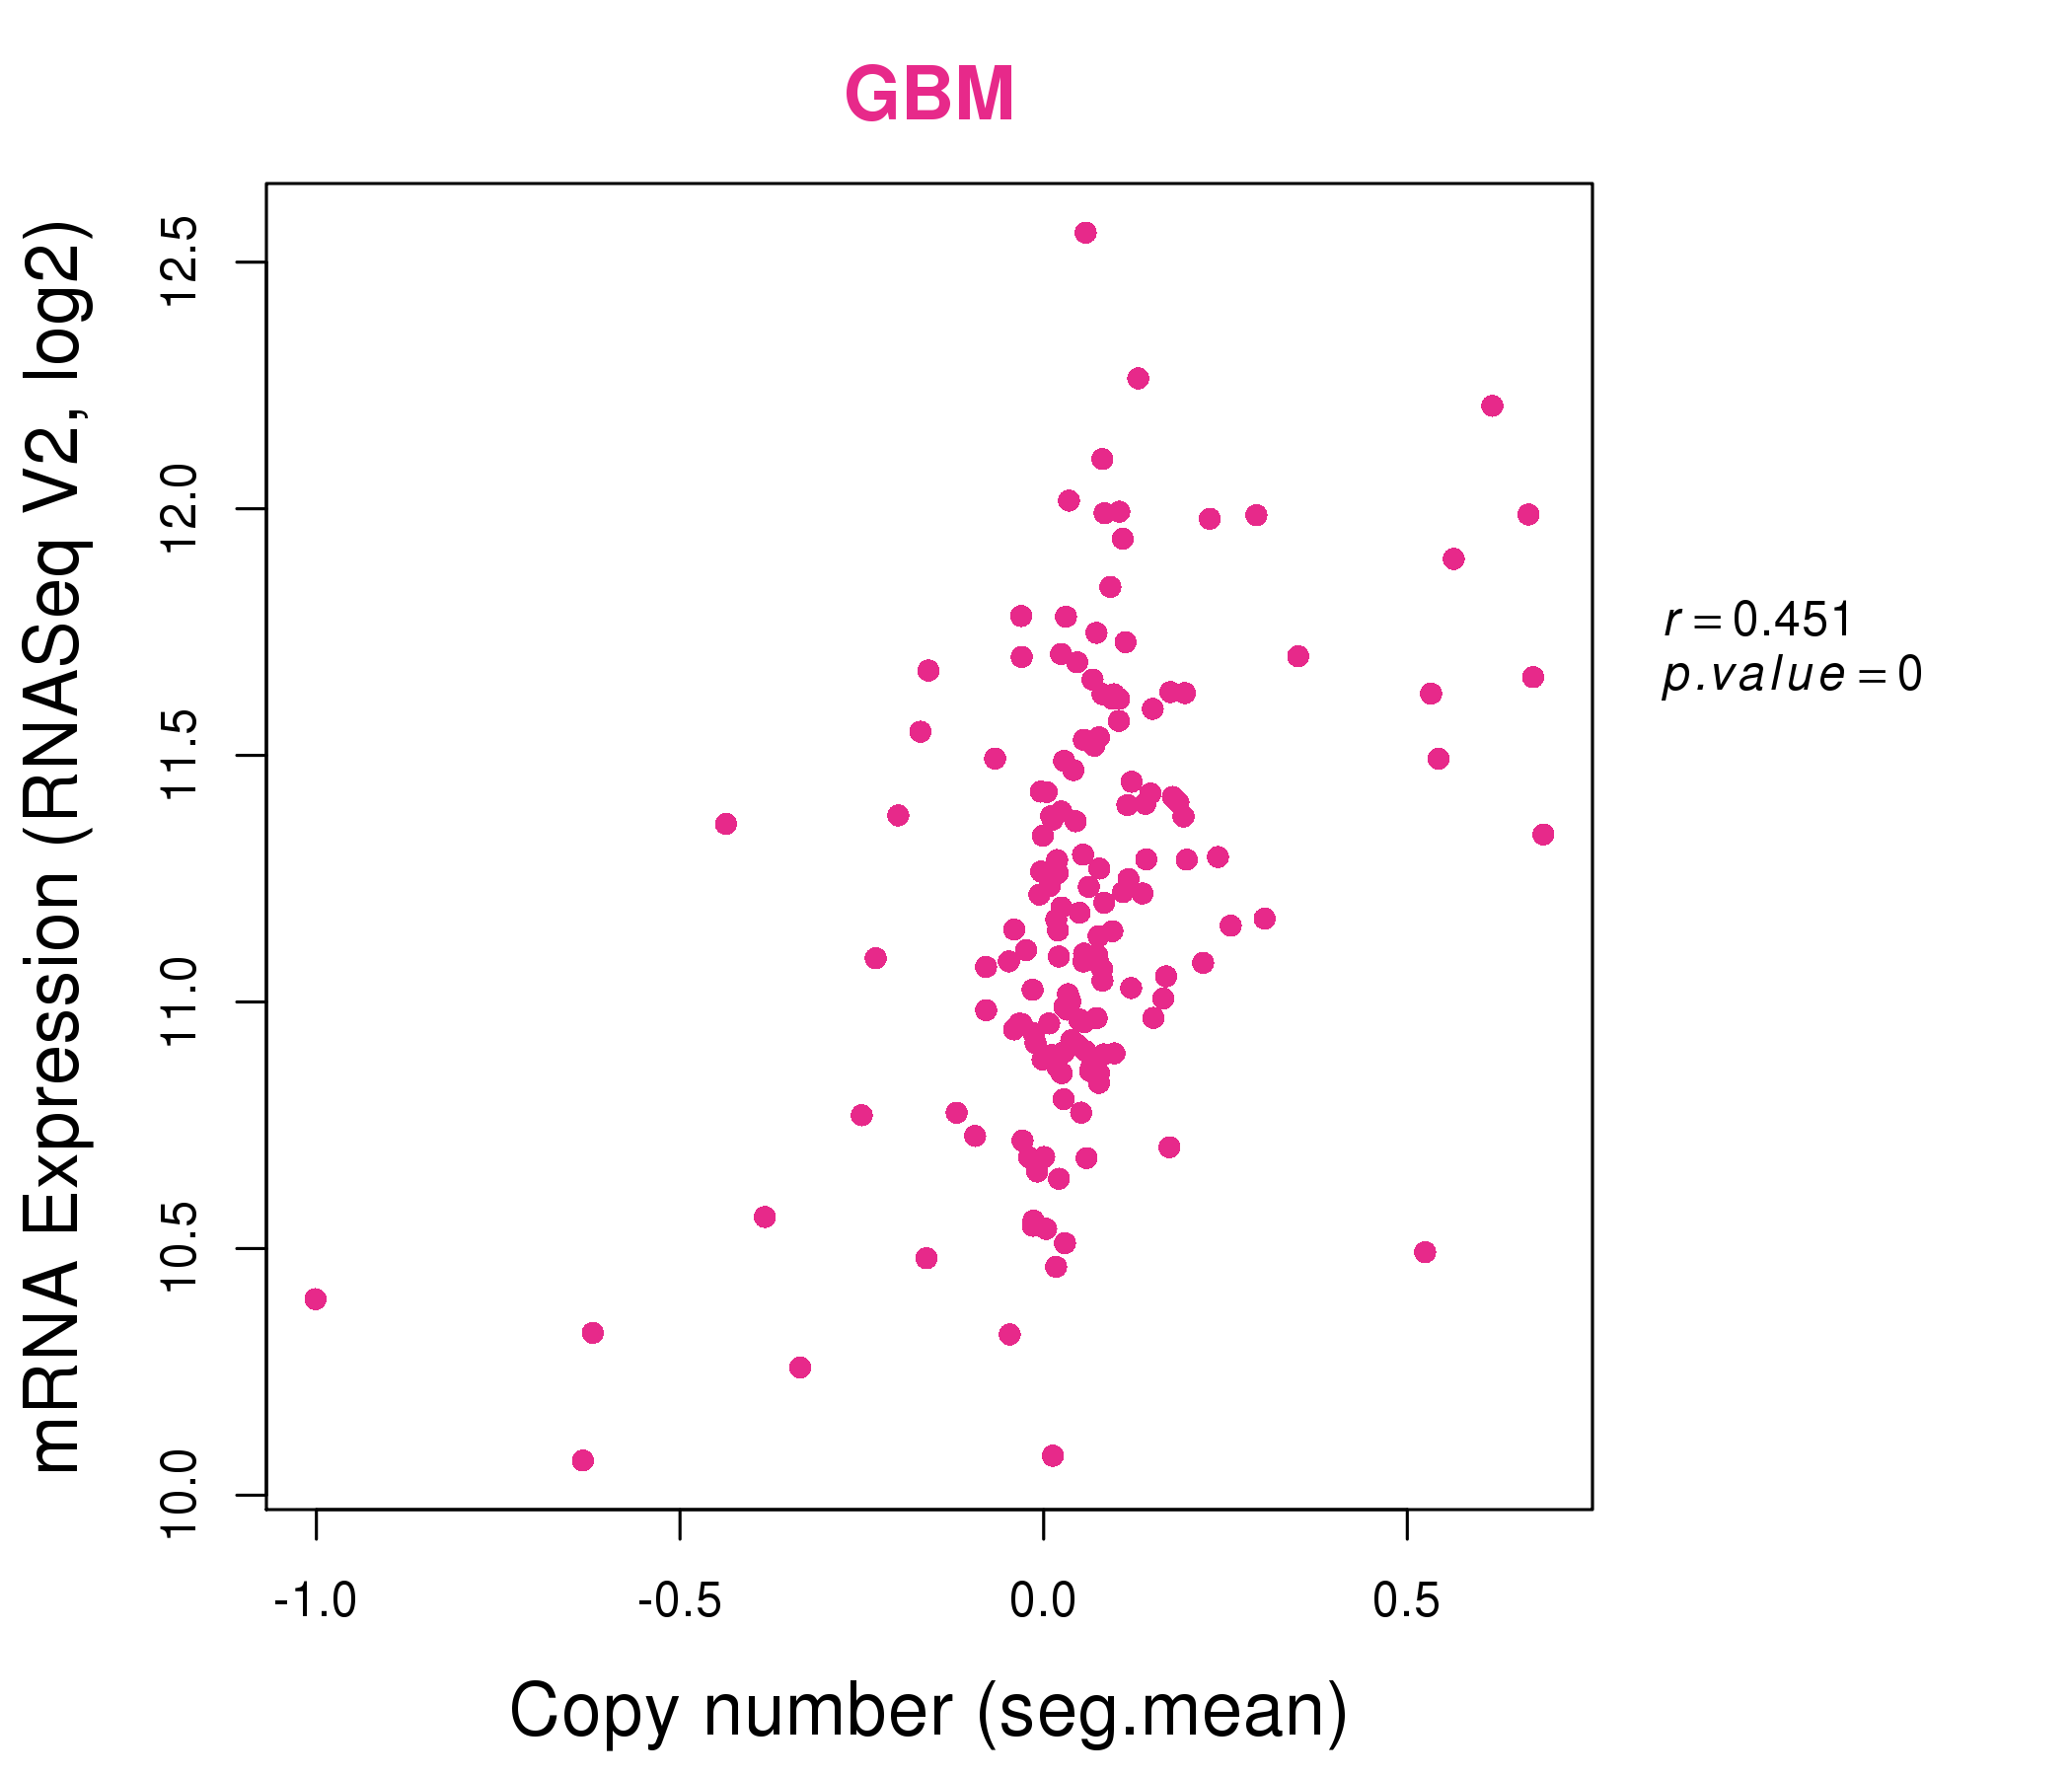
| * Normalized gene expression data of RNASeqV2 was extracted from TCGA using R package TCGA-Assembler. The URLs of all public data files on TCGA DCC data server were gathered at Jan-05-2015. Only eight cancer types have enough normal control samples for differential expression analysis. (t test, adjusted p<0.05 (using Benjamini-Hochberg FDR)) |
 |
| Top |
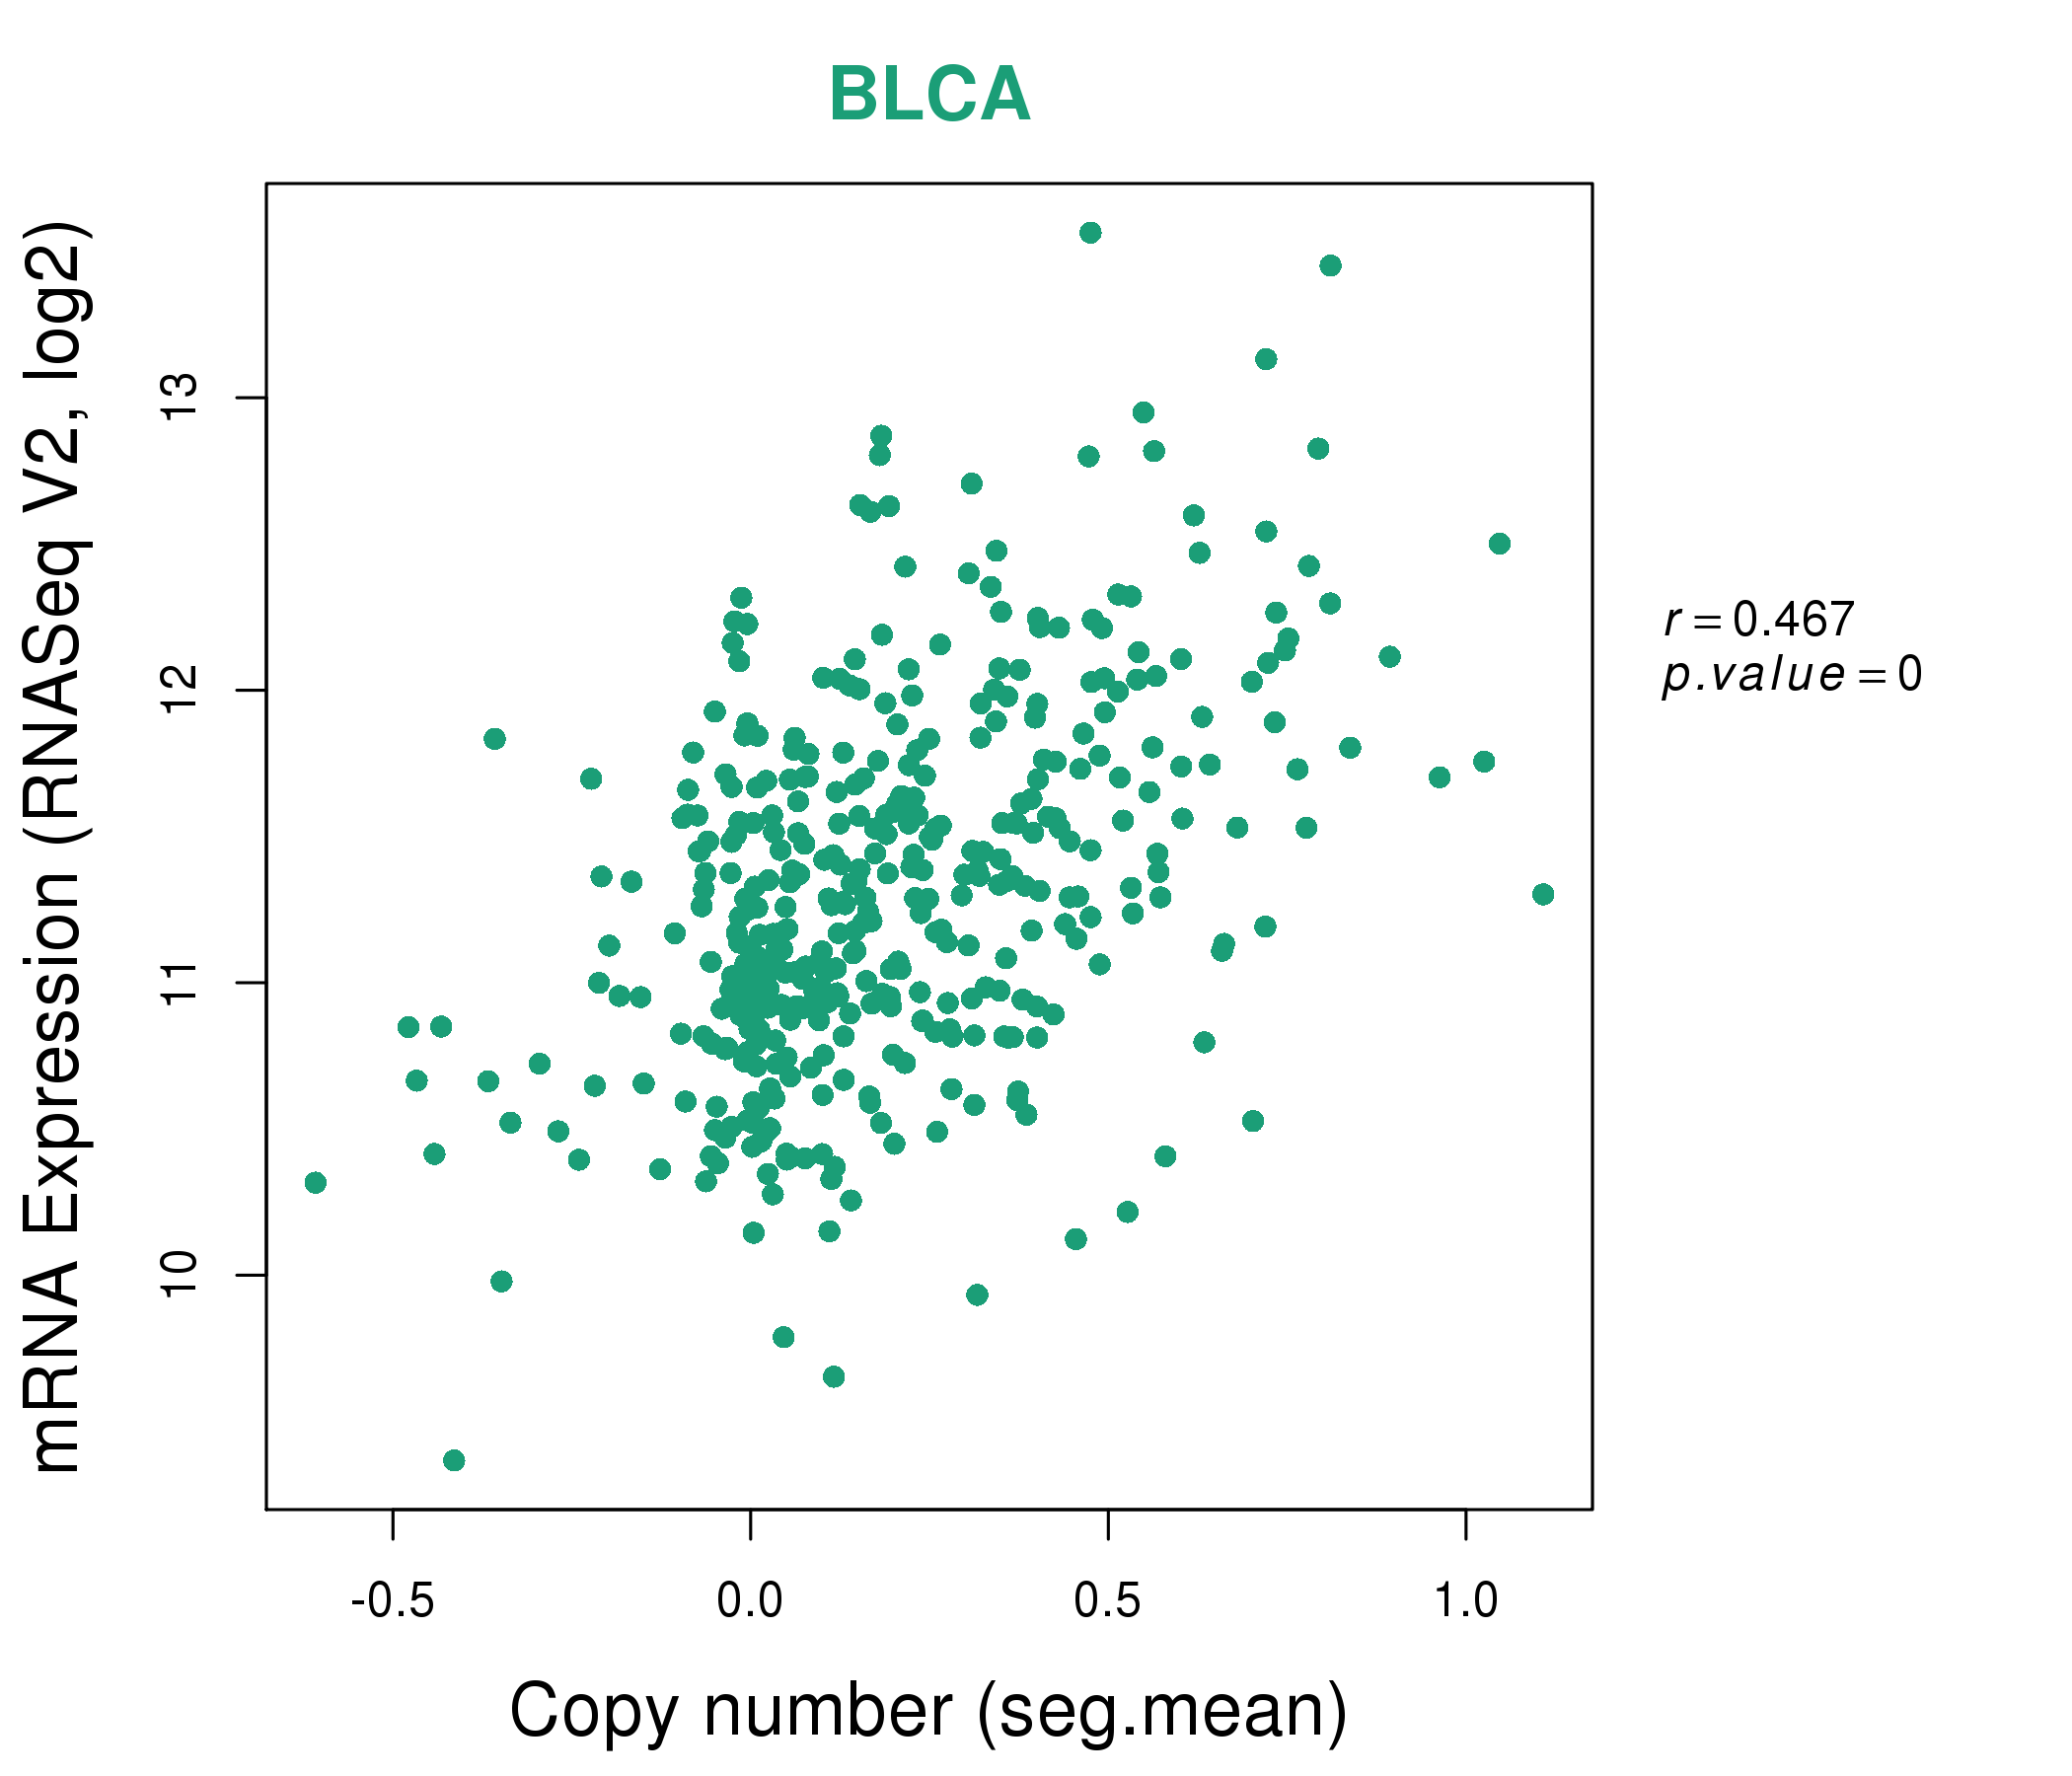
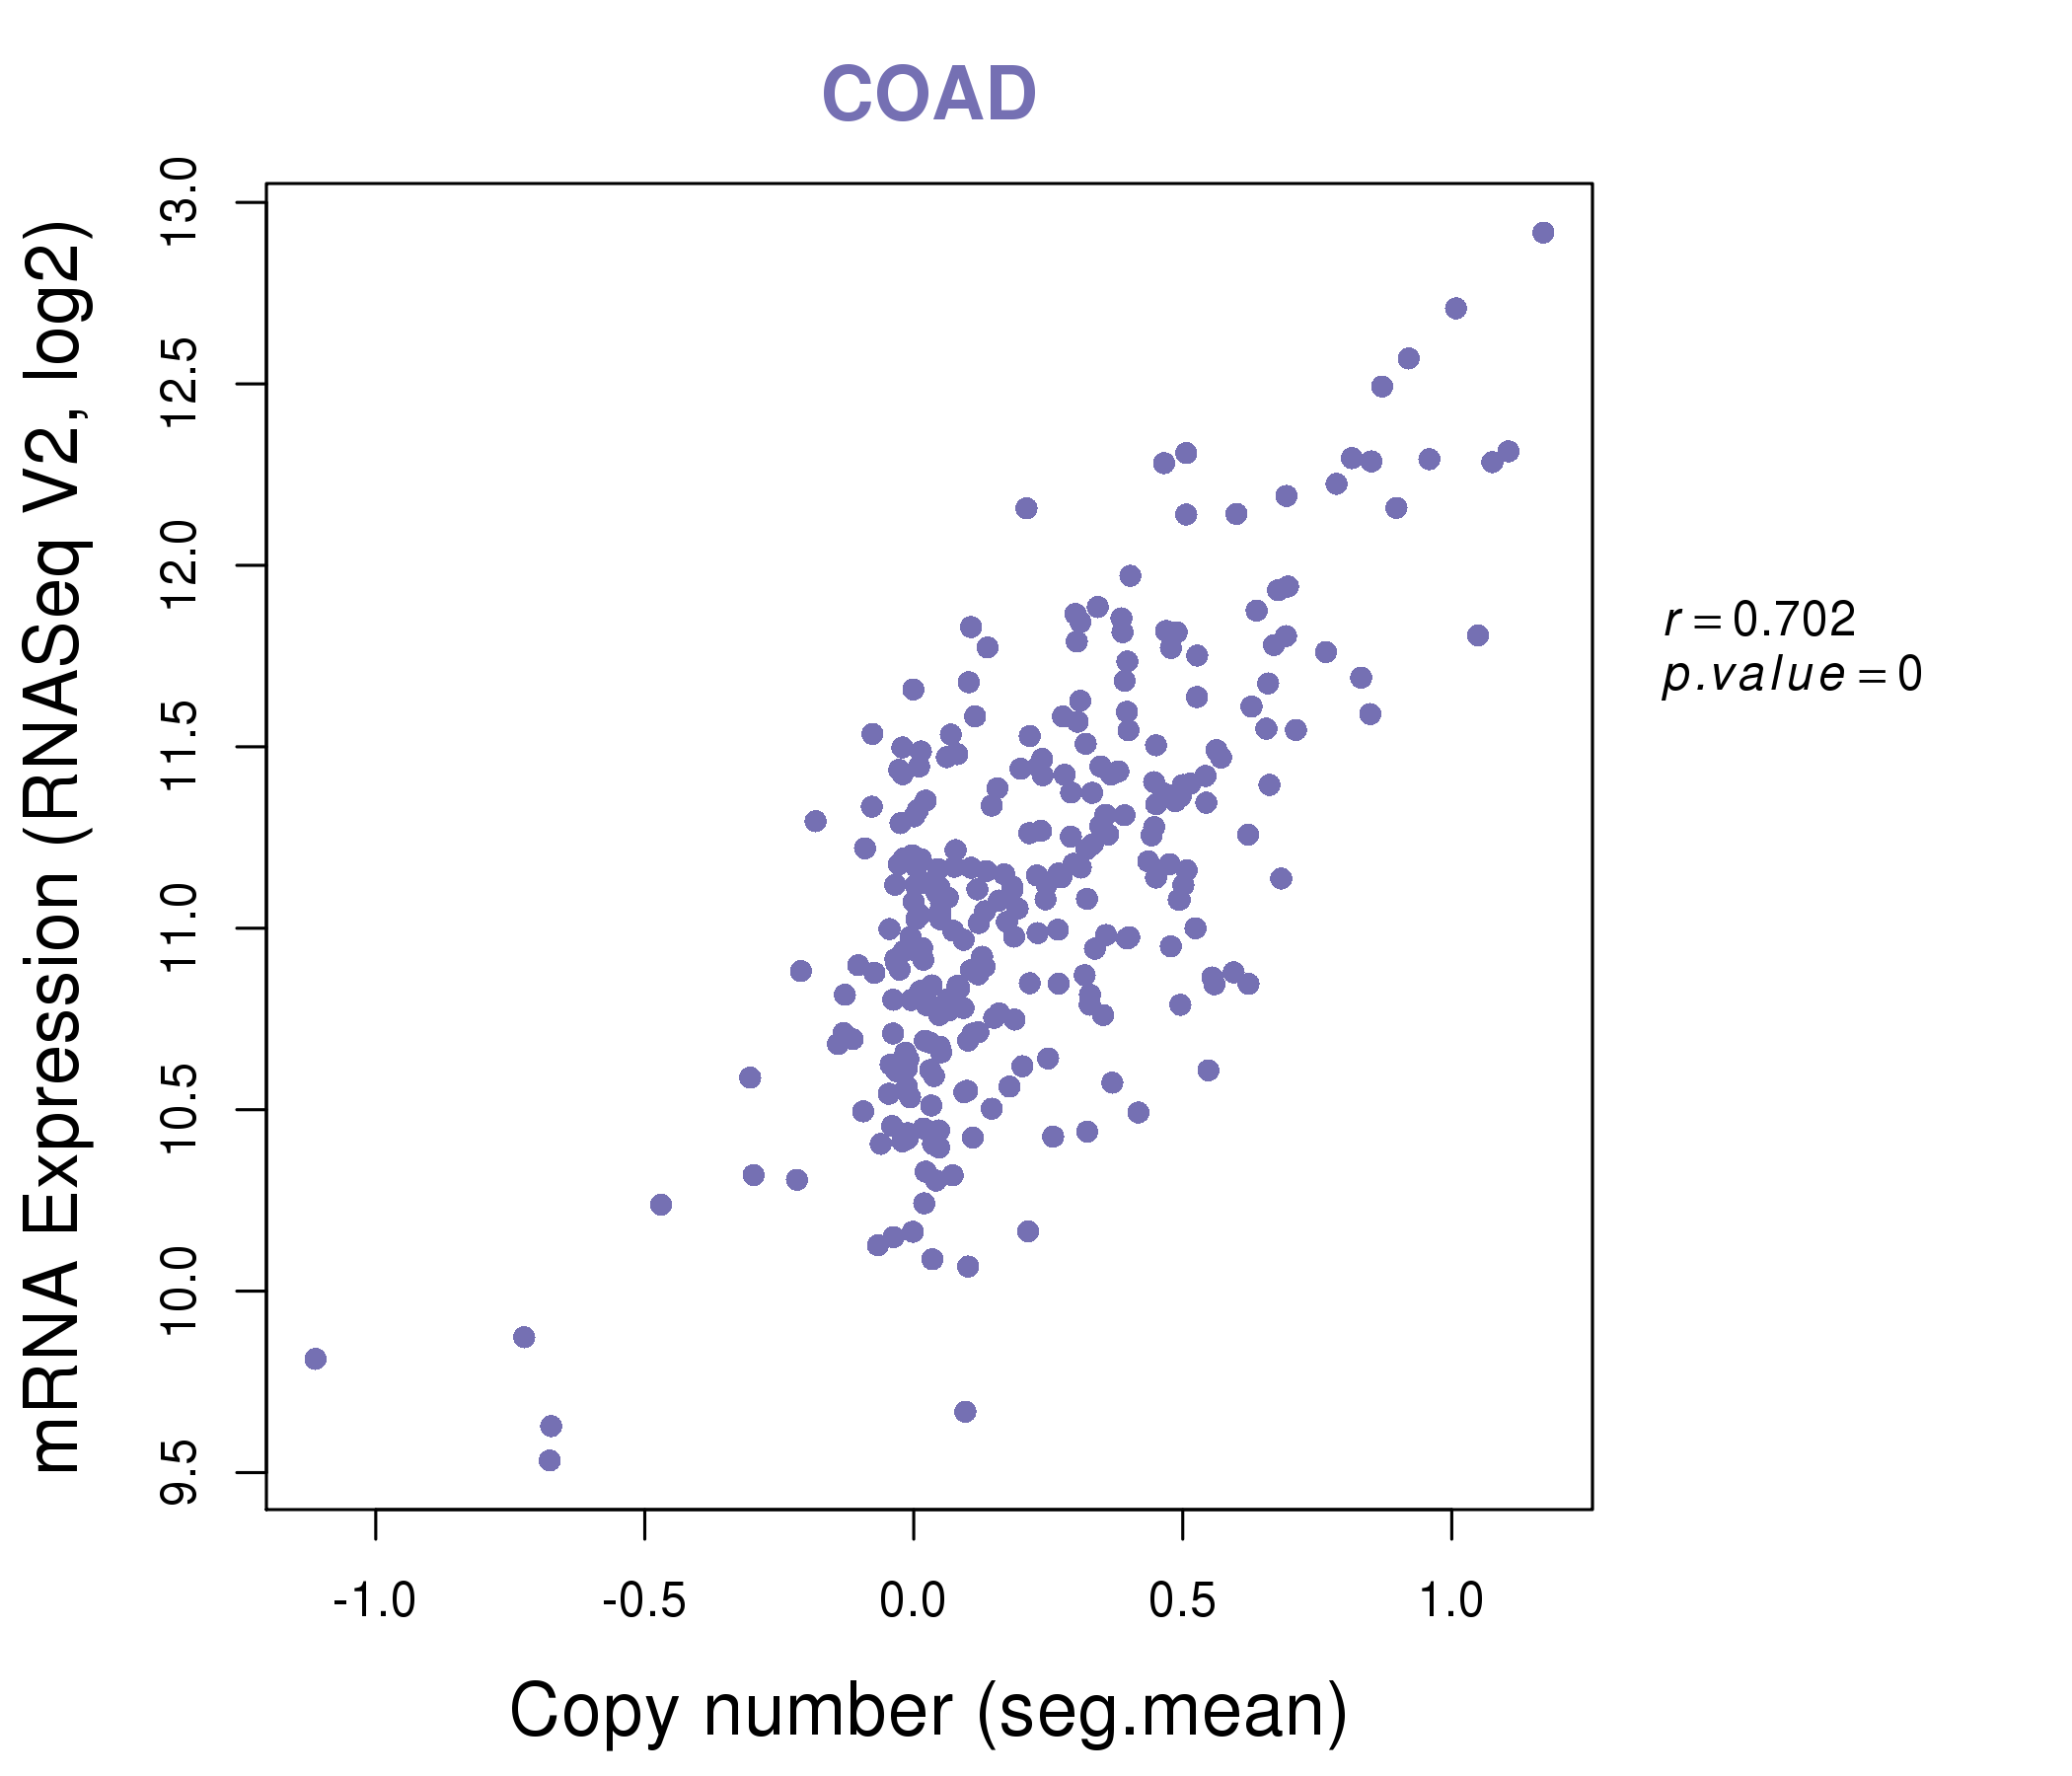
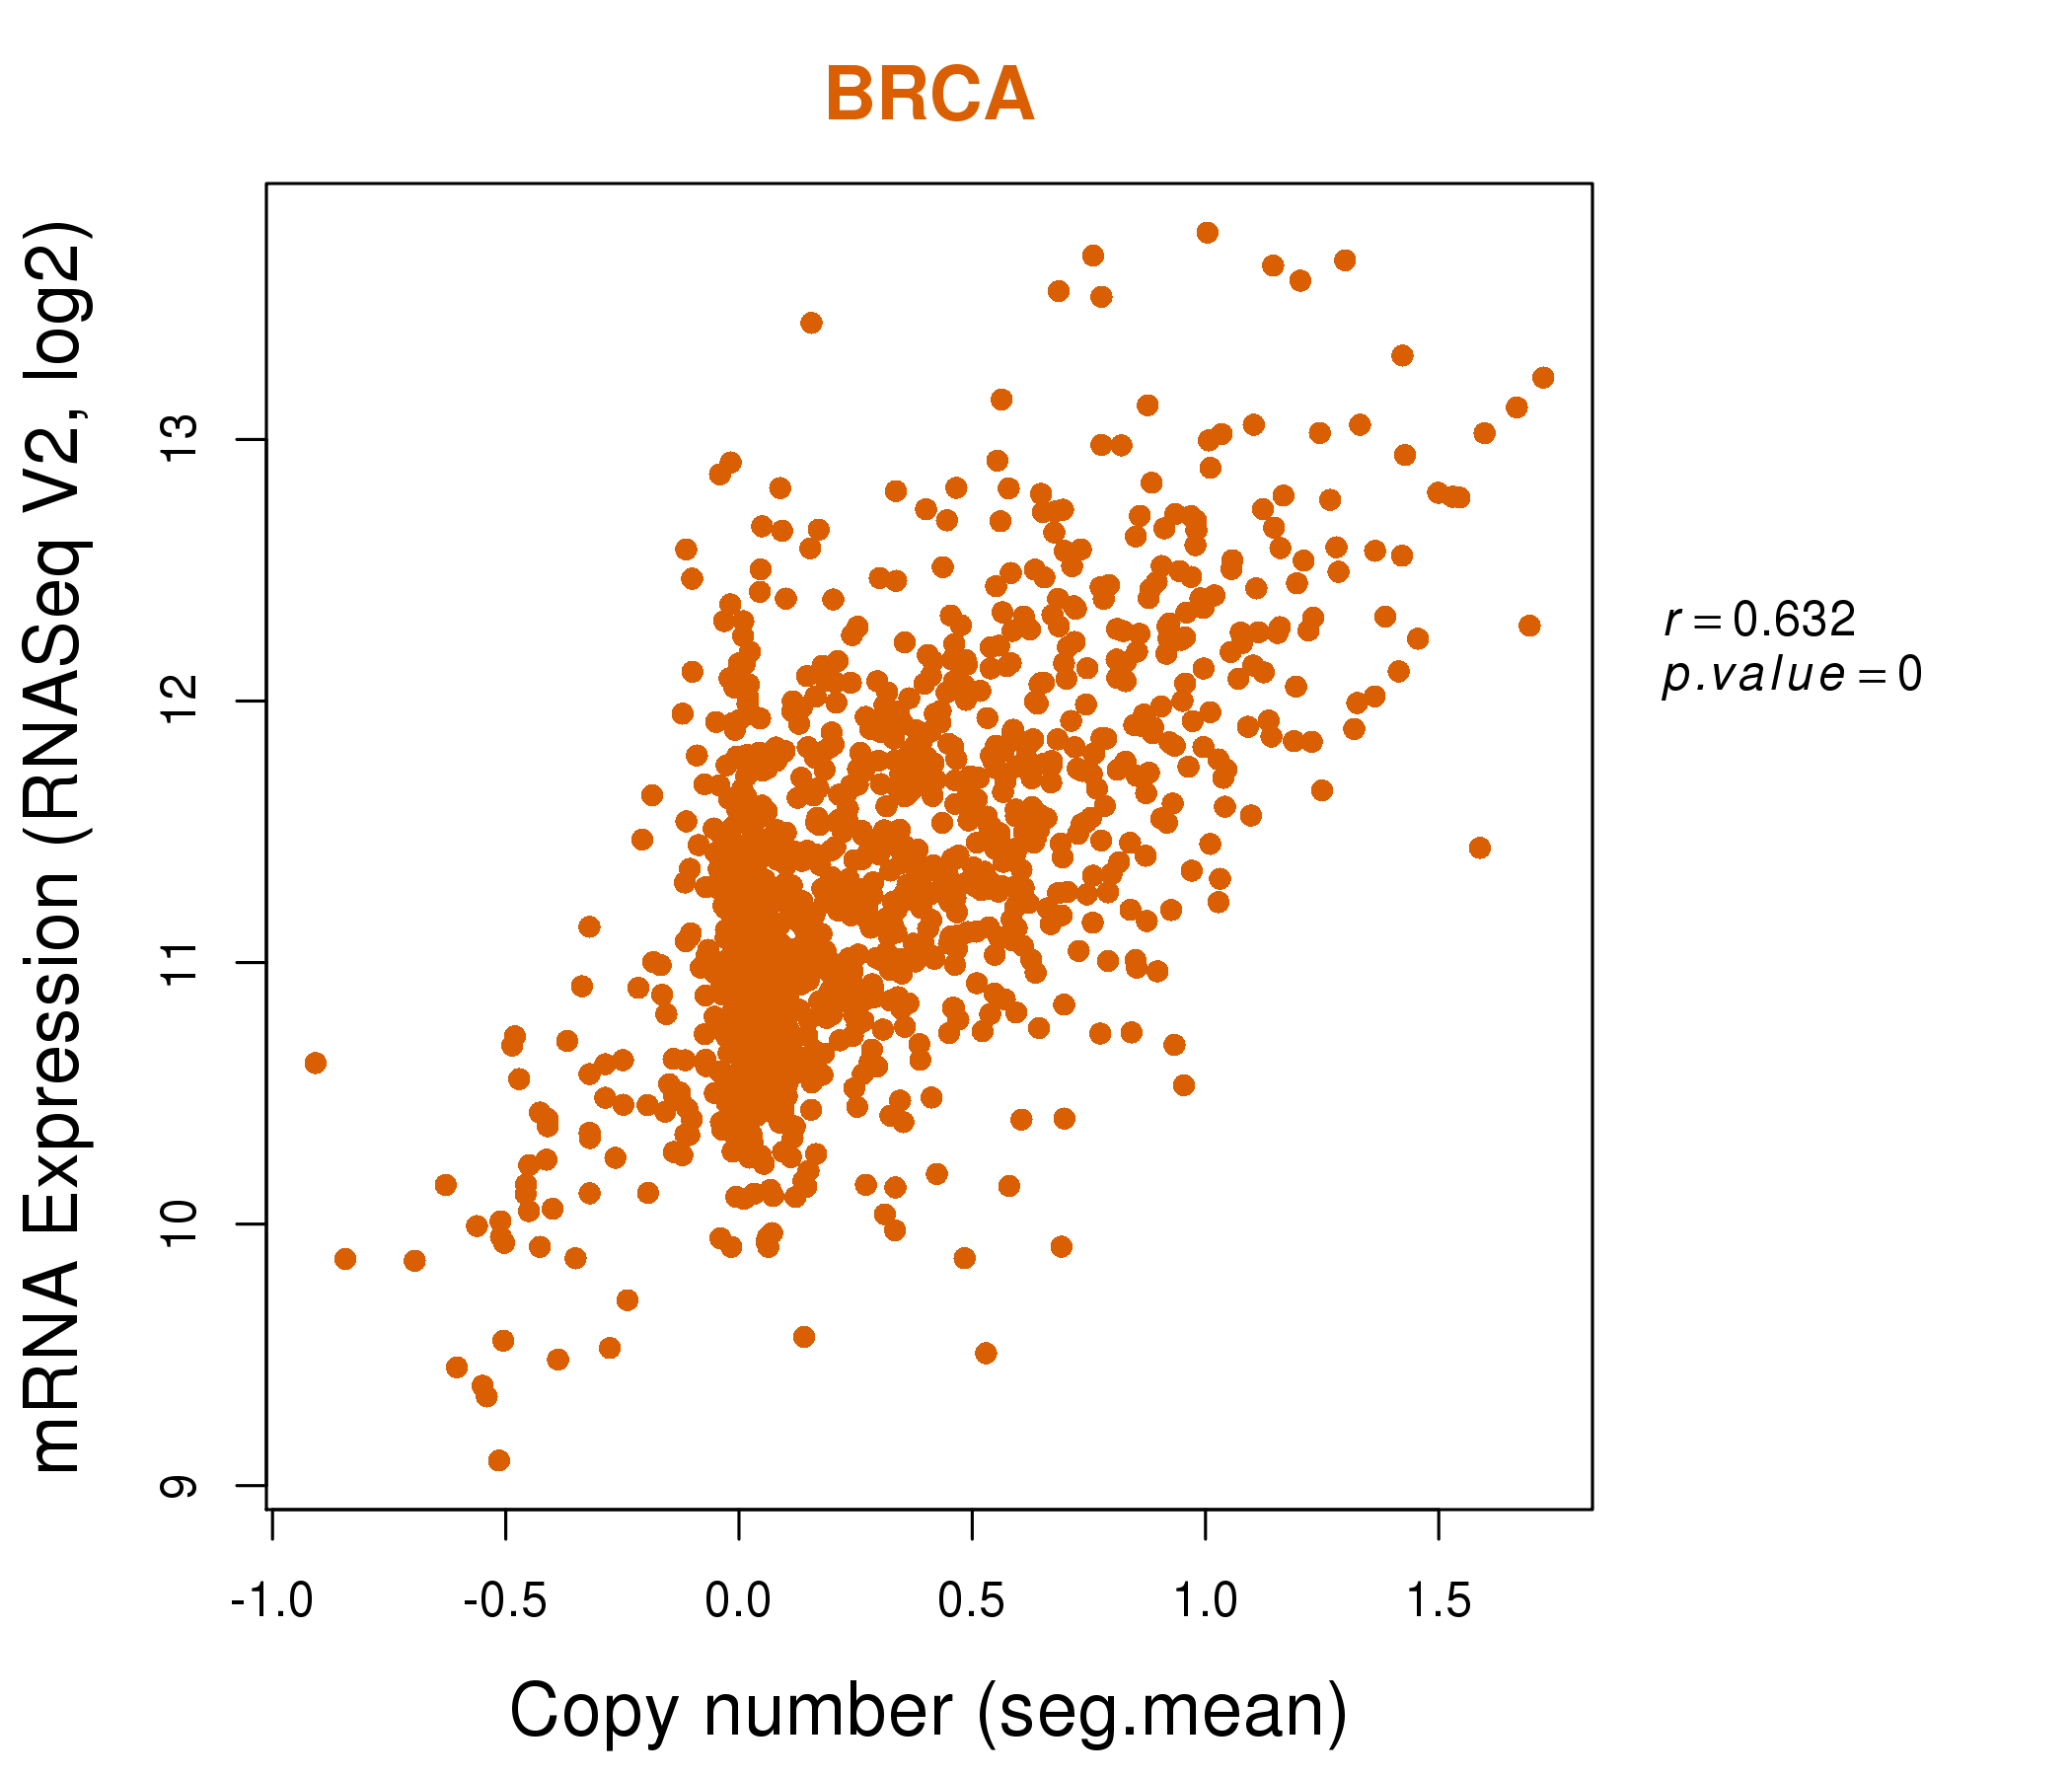
| * This plots show the correlation between CNV and gene expression. |
: Open all plots for all cancer types
 |
|
 |
|
| Top |
| Gene-Gene Network Information |
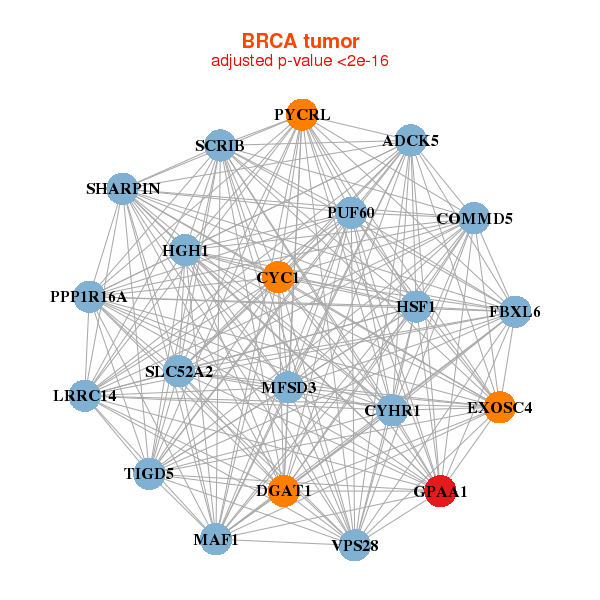
| * Co-Expression network figures were drawn using R package igraph. Only the top 20 genes with the highest correlations were shown. Red circle: input gene, orange circle: cell metabolism gene, sky circle: other gene |
: Open all plots for all cancer types
 |
|
| ADCK5,HGH1,COMMD5,CYC1,CYHR1,DGAT1,EXOSC4, FBXL6,GPAA1,SLC52A2,HSF1,LRRC14,MAF1,MFSD3, PPP1R16A,PUF60,PYCRL,SCRIB,SHARPIN,TIGD5,VPS28 | C19orf24,C9orf16,COPE,GPAA1,GPR137,SLC52A2,GUK1, JMJD8,MOSPD3,MRPS12,NUBP2,NUDT22,PPP1CA,PPP4C, SLC25A39,SSSCA1,TMEM222,YIF1B,ZDHHC12,ZDHHC24,ZFPL1 |
 |
|
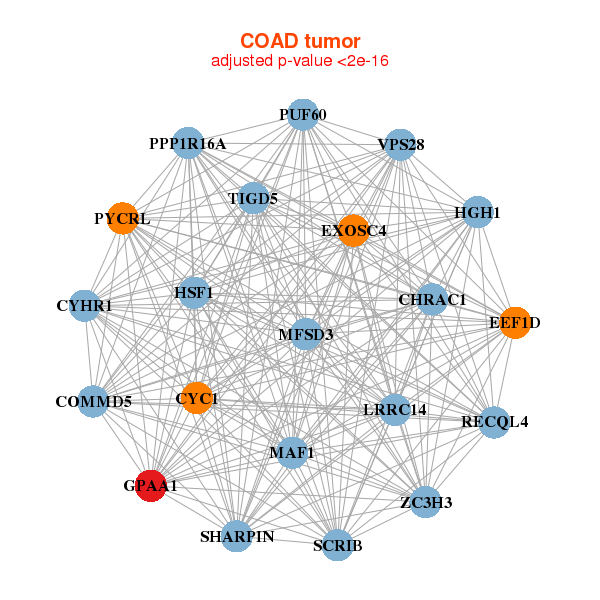
| HGH1,CHRAC1,COMMD5,CYC1,CYHR1,EEF1D,EXOSC4, GPAA1,HSF1,LRRC14,MAF1,MFSD3,PPP1R16A,PUF60, PYCRL,RECQL4,SCRIB,SHARPIN,TIGD5,VPS28,ZC3H3 | ATP5D,ELMO3,EPN1,ESRRA,ETFB,FBXW5,GPAA1, ILVBL,MAP3K11,MGAT4B,NAGPA,NAPRT,NBL1,PEX16, PPP1R16A,RILP,SDF4,SLC25A1,TMUB1,TNIP2,ZDHHC12 |


| * Co-Expression network figures were drawn using R package igraph. Only the top 20 genes with the highest correlations were shown. Red circle: input gene, orange circle: cell metabolism gene, sky circle: other gene |
: Open all plots for all cancer types
| Top |
: Open all interacting genes' information including KEGG pathway for all interacting genes from DAVID
| Top |
| Pharmacological Information for GPAA1 |
| There's no related Drug. |
| Top |
| Cross referenced IDs for GPAA1 |
| * We obtained these cross-references from Uniprot database. It covers 150 different DBs, 18 categories. http://www.uniprot.org/help/cross_references_section |
: Open all cross reference information
|
Copyright © 2016-Present - The Univsersity of Texas Health Science Center at Houston @ |