|
||||||||||||||||||||
| |
| Phenotypic Information (metabolism pathway, cancer, disease, phenome) |
| |
| |
| Gene-Gene Network Information: Co-Expression Network, Interacting Genes & KEGG |
| |
|


| Gene Summary for FPGT |
| Top |
| Phenotypic Information for FPGT(metabolism pathway, cancer, disease, phenome) |
| Cancer | CGAP: FPGT |
| Familial Cancer Database: FPGT | |
| * This gene is included in those cancer gene databases. |
|
|
|
|
|
| . | ||||||||||||||
Oncogene 1 | Significant driver gene in | |||||||||||||||||||
| cf) number; DB name 1 Oncogene; http://nar.oxfordjournals.org/content/35/suppl_1/D721.long, 2 Tumor Suppressor gene; https://bioinfo.uth.edu/TSGene/, 3 Cancer Gene Census; http://www.nature.com/nrc/journal/v4/n3/abs/nrc1299.html, 4 CancerGenes; http://nar.oxfordjournals.org/content/35/suppl_1/D721.long, 5 Network of Cancer Gene; http://ncg.kcl.ac.uk/index.php, 1Therapeutic Vulnerabilities in Cancer; http://cbio.mskcc.org/cancergenomics/statius/ |
| KEGG_FRUCTOSE_AND_MANNOSE_METABOLISM KEGG_AMINO_SUGAR_AND_NUCLEOTIDE_SUGAR_METABOLISM | |
| OMIM | |
| Orphanet | |
| Disease | KEGG Disease: FPGT |
| MedGen: FPGT (Human Medical Genetics with Condition) | |
| ClinVar: FPGT | |
| Phenotype | MGI: FPGT (International Mouse Phenotyping Consortium) |
| PhenomicDB: FPGT | |
| Mutations for FPGT |
| * Under tables are showing count per each tissue to give us broad intuition about tissue specific mutation patterns.You can go to the detailed page for each mutation database's web site. |
| There's no structural variation information in COSMIC data for this gene. |
| * From mRNA Sanger sequences, Chitars2.0 arranged chimeric transcripts. This table shows FPGT related fusion information. |
| ID | Head Gene | Tail Gene | Accession | Gene_a | qStart_a | qEnd_a | Chromosome_a | tStart_a | tEnd_a | Gene_a | qStart_a | qEnd_a | Chromosome_a | tStart_a | tEnd_a |
| NM6777215 | FPGT | 1 | 150 | 1 | 74198212 | 74208702 | TNNI3K | 151 | 3328 | 1 | 74235387 | 74544432 | |
| NM6777215 | FPGT | 1 | 149 | 1 | 74198212 | 74208702 | TNNI3K | 150 | 2782 | 1 | 74235387 | 74544432 | |
| Top |
| There's no copy number variation information in COSMIC data for this gene. |
| Top |
|
 |
| Top |
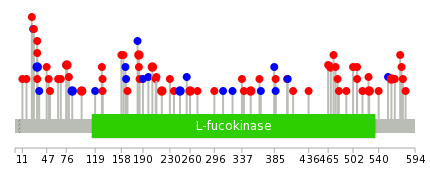
| Stat. for Non-Synonymous SNVs (# total SNVs=56) | (# total SNVs=17) |
 |  |
(# total SNVs=6) | (# total SNVs=1) |
 |  |
| Top |
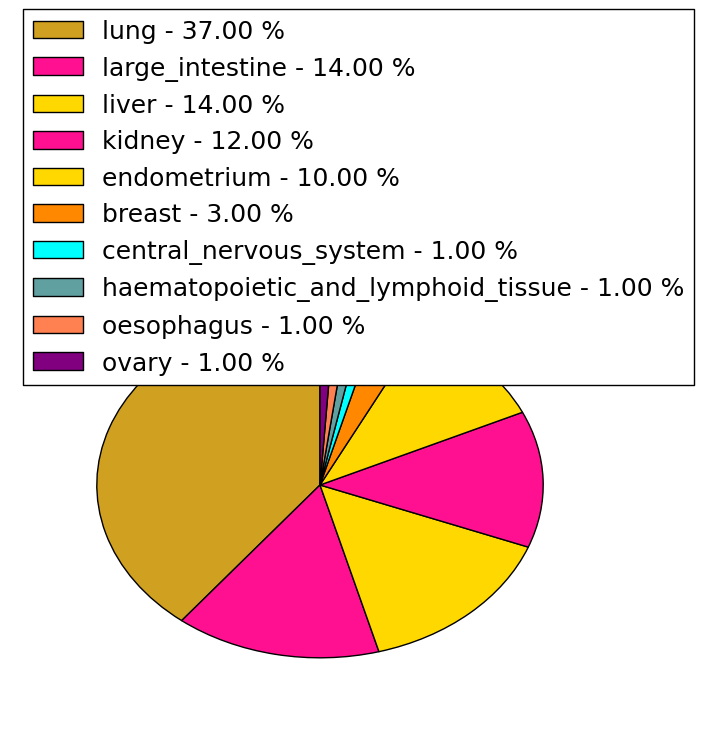
| * When you move the cursor on each content, you can see more deailed mutation information on the Tooltip. Those are primary_site,primary_histology,mutation(aa),pubmedID. |
| GRCh37 position | Mutation(aa) | Unique sampleID count |
| chr1:74665494-74665494 | p.D77Y | 2 |
| chr1:74665362-74665362 | p.R33G | 2 |
| chr1:74670342-74670342 | p.G204E | 2 |
| chr1:74671308-74671308 | p.R526H | 2 |
| chr1:74667006-74667006 | p.N85N | 2 |
| chr1:74665364-74665364 | p.R33R | 2 |
| chr1:74667047-74667047 | p.L99P | 2 |
| chr1:74671407-74671407 | p.Y559C | 2 |
| chr1:74670385-74670385 | p.D218E | 2 |
| chr1:74670281-74670281 | p.D184N | 2 |
| Top |
|
 |
| Point Mutation/ Tissue ID | 1 | 2 | 3 | 4 | 5 | 6 | 7 | 8 | 9 | 10 | 11 | 12 | 13 | 14 | 15 | 16 | 17 | 18 | 19 | 20 |
| # sample | 6 | 9 | 3 | 2 | 4 | 7 | 3 | 3 | 7 | |||||||||||
| # mutation | 6 | 9 | 3 | 2 | 4 | 7 | 3 | 3 | 7 | |||||||||||
| nonsynonymous SNV | 4 | 8 | 3 | 2 | 2 | 4 | 2 | 2 | 5 | |||||||||||
| synonymous SNV | 2 | 1 | 2 | 3 | 1 | 1 | 2 |
| cf) Tissue ID; Tissue type (1; BLCA[Bladder Urothelial Carcinoma], 2; BRCA[Breast invasive carcinoma], 3; CESC[Cervical squamous cell carcinoma and endocervical adenocarcinoma], 4; COAD[Colon adenocarcinoma], 5; GBM[Glioblastoma multiforme], 6; Glioma Low Grade, 7; HNSC[Head and Neck squamous cell carcinoma], 8; KICH[Kidney Chromophobe], 9; KIRC[Kidney renal clear cell carcinoma], 10; KIRP[Kidney renal papillary cell carcinoma], 11; LAML[Acute Myeloid Leukemia], 12; LUAD[Lung adenocarcinoma], 13; LUSC[Lung squamous cell carcinoma], 14; OV[Ovarian serous cystadenocarcinoma ], 15; PAAD[Pancreatic adenocarcinoma], 16; PRAD[Prostate adenocarcinoma], 17; SKCM[Skin Cutaneous Melanoma], 18:STAD[Stomach adenocarcinoma], 19:THCA[Thyroid carcinoma], 20:UCEC[Uterine Corpus Endometrial Carcinoma]) |
| Top |
| * We represented just top 10 SNVs. When you move the cursor on each content, you can see more deailed mutation information on the Tooltip. Those are primary_site, primary_histology, mutation(aa), pubmedID. |
| Genomic Position | Mutation(aa) | Unique sampleID count |
| chr1:74671407 | p.Y572C,FPGT | 2 |
| chr1:74670226 | p.M249I | 1 |
| chr1:74671308 | p.M473I,FPGT | 1 |
| chr1:74670509 | p.D273N | 1 |
| chr1:74670968 | p.K478N,FPGT | 1 |
| chr1:74670277 | p.D284H | 1 |
| chr1:74671320 | p.K492N,FPGT | 1 |
| chr1:74670542 | p.Q132Q,FPGT | 1 |
| chr1:74670983 | p.G322G | 1 |
| chr1:74670281 | p.F505L,FPGT | 1 |
| * Copy number data were extracted from TCGA using R package TCGA-Assembler. The URLs of all public data files on TCGA DCC data server were gathered on Jan-05-2015. Function ProcessCNAData in TCGA-Assembler package was used to obtain gene-level copy number value which is calculated as the average copy number of the genomic region of a gene. |
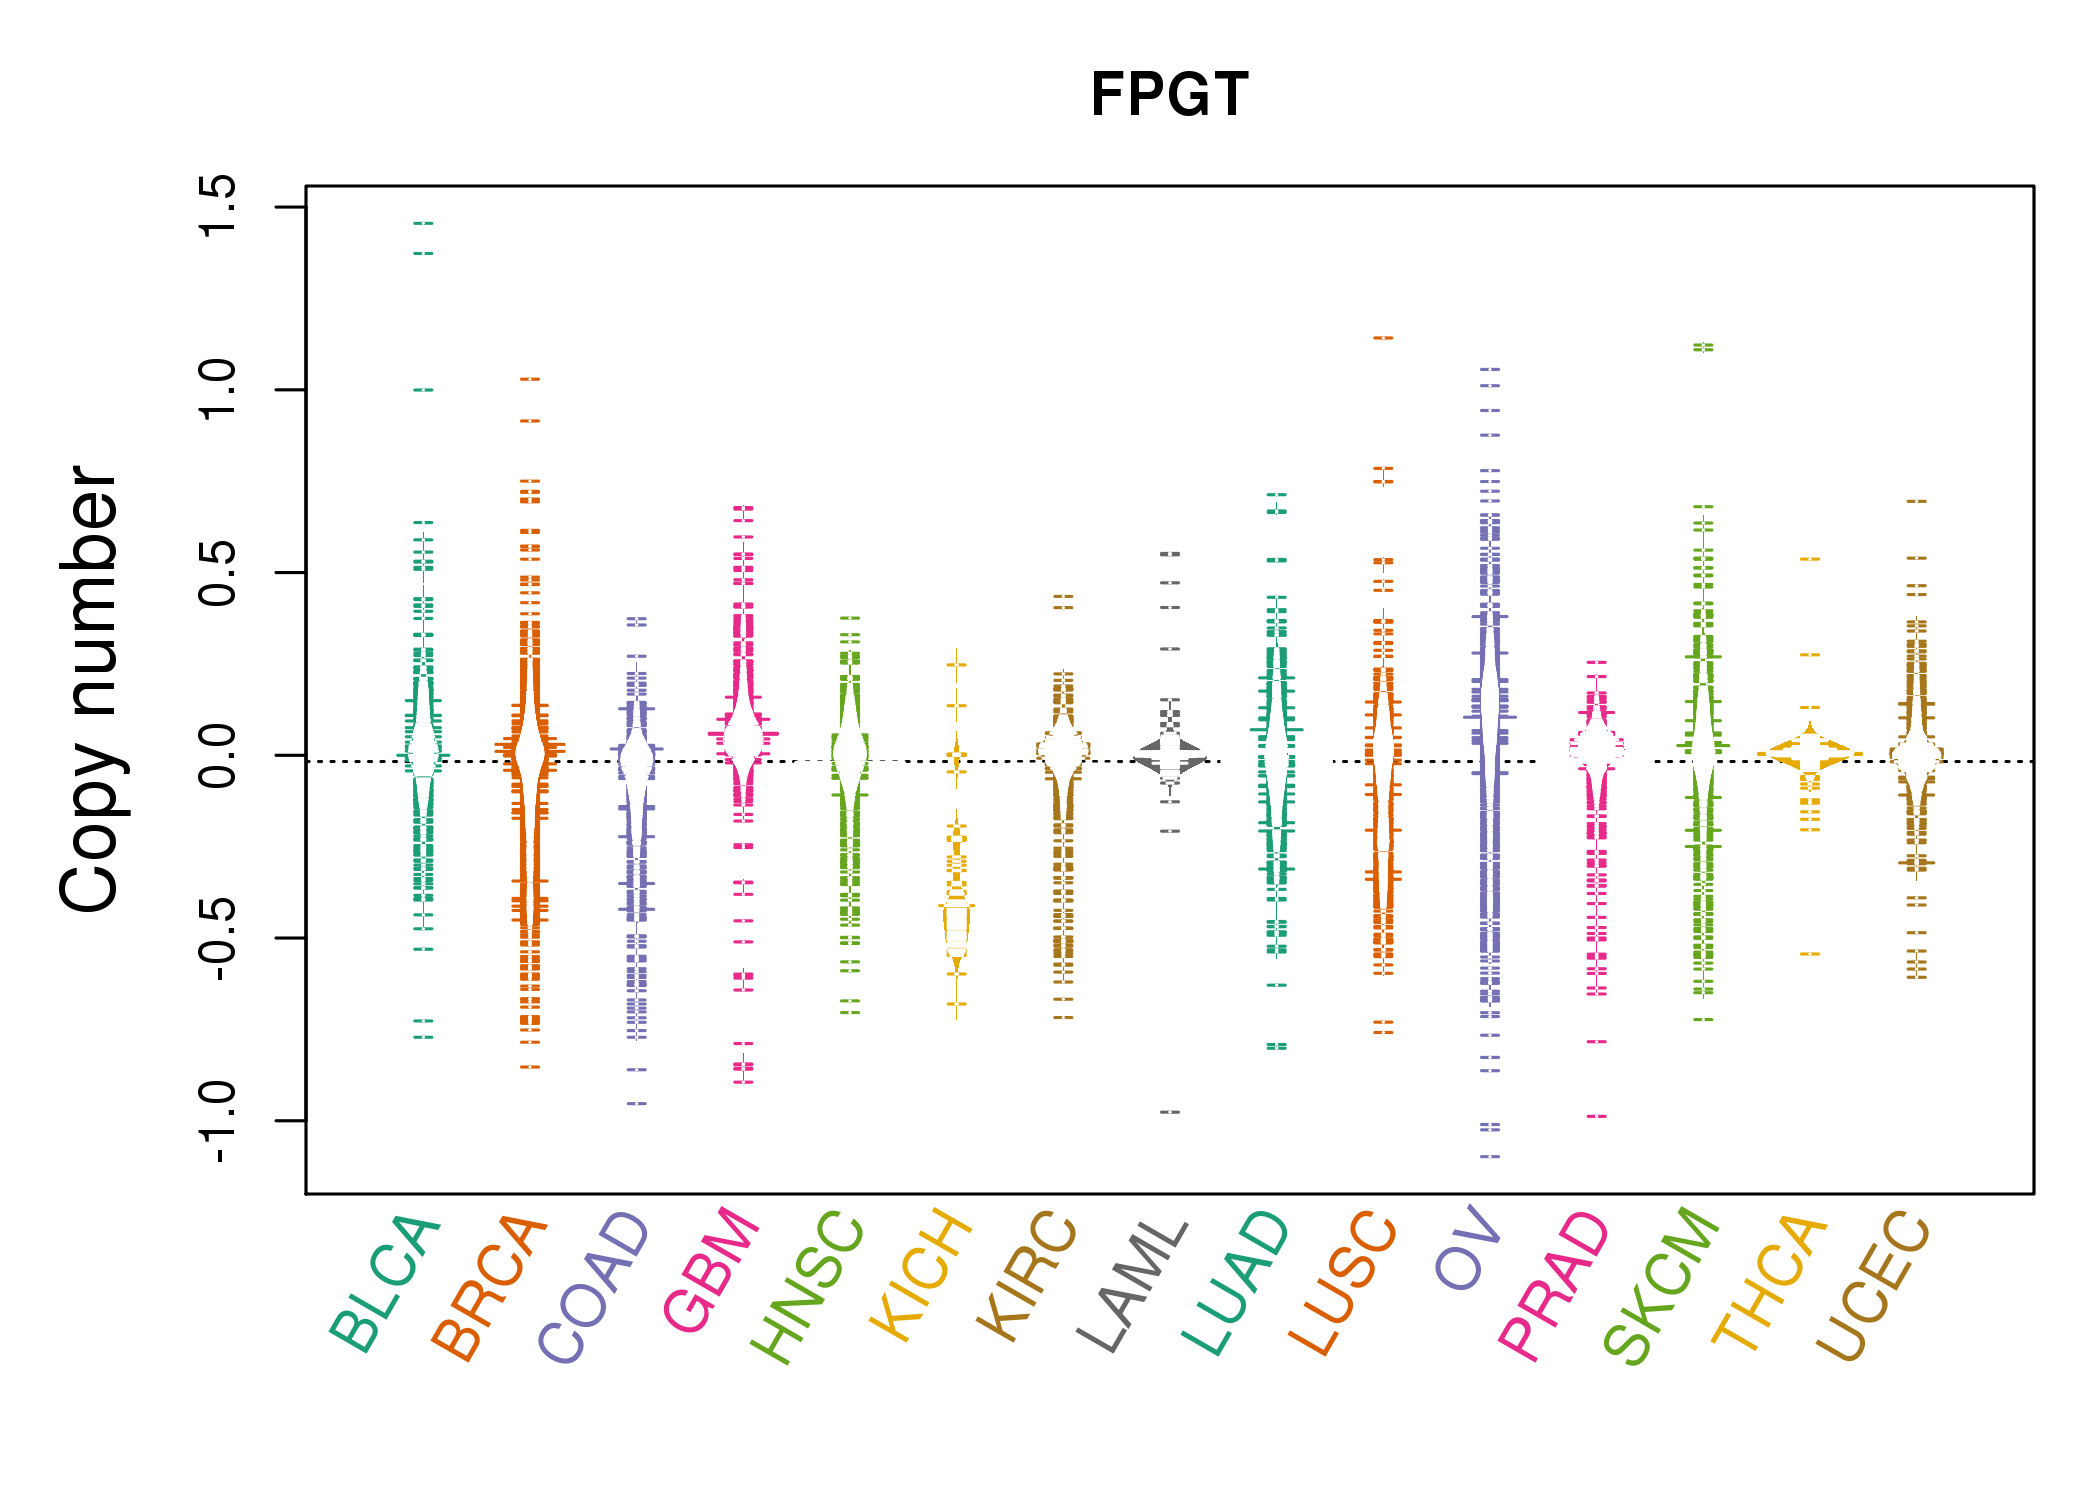 |
| cf) Tissue ID[Tissue type]: BLCA[Bladder Urothelial Carcinoma], BRCA[Breast invasive carcinoma], CESC[Cervical squamous cell carcinoma and endocervical adenocarcinoma], COAD[Colon adenocarcinoma], GBM[Glioblastoma multiforme], Glioma Low Grade, HNSC[Head and Neck squamous cell carcinoma], KICH[Kidney Chromophobe], KIRC[Kidney renal clear cell carcinoma], KIRP[Kidney renal papillary cell carcinoma], LAML[Acute Myeloid Leukemia], LUAD[Lung adenocarcinoma], LUSC[Lung squamous cell carcinoma], OV[Ovarian serous cystadenocarcinoma ], PAAD[Pancreatic adenocarcinoma], PRAD[Prostate adenocarcinoma], SKCM[Skin Cutaneous Melanoma], STAD[Stomach adenocarcinoma], THCA[Thyroid carcinoma], UCEC[Uterine Corpus Endometrial Carcinoma] |
| Top |
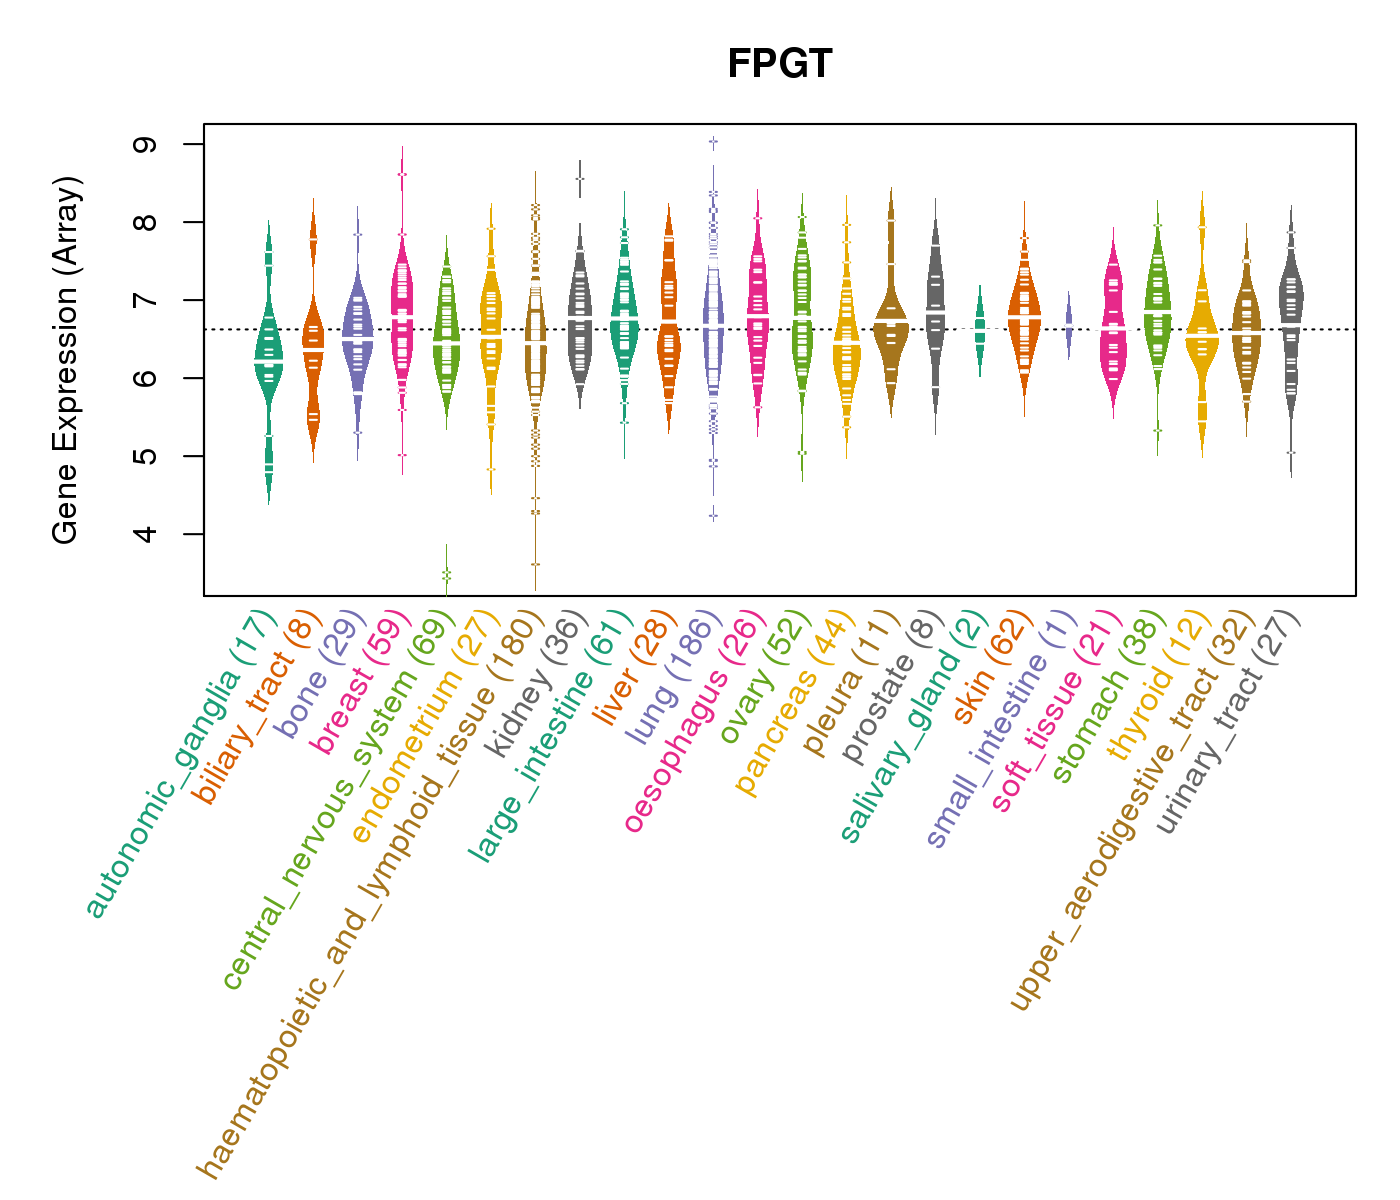
| Gene Expression for FPGT |
| * CCLE gene expression data were extracted from CCLE_Expression_Entrez_2012-10-18.res: Gene-centric RMA-normalized mRNA expression data. |
 |
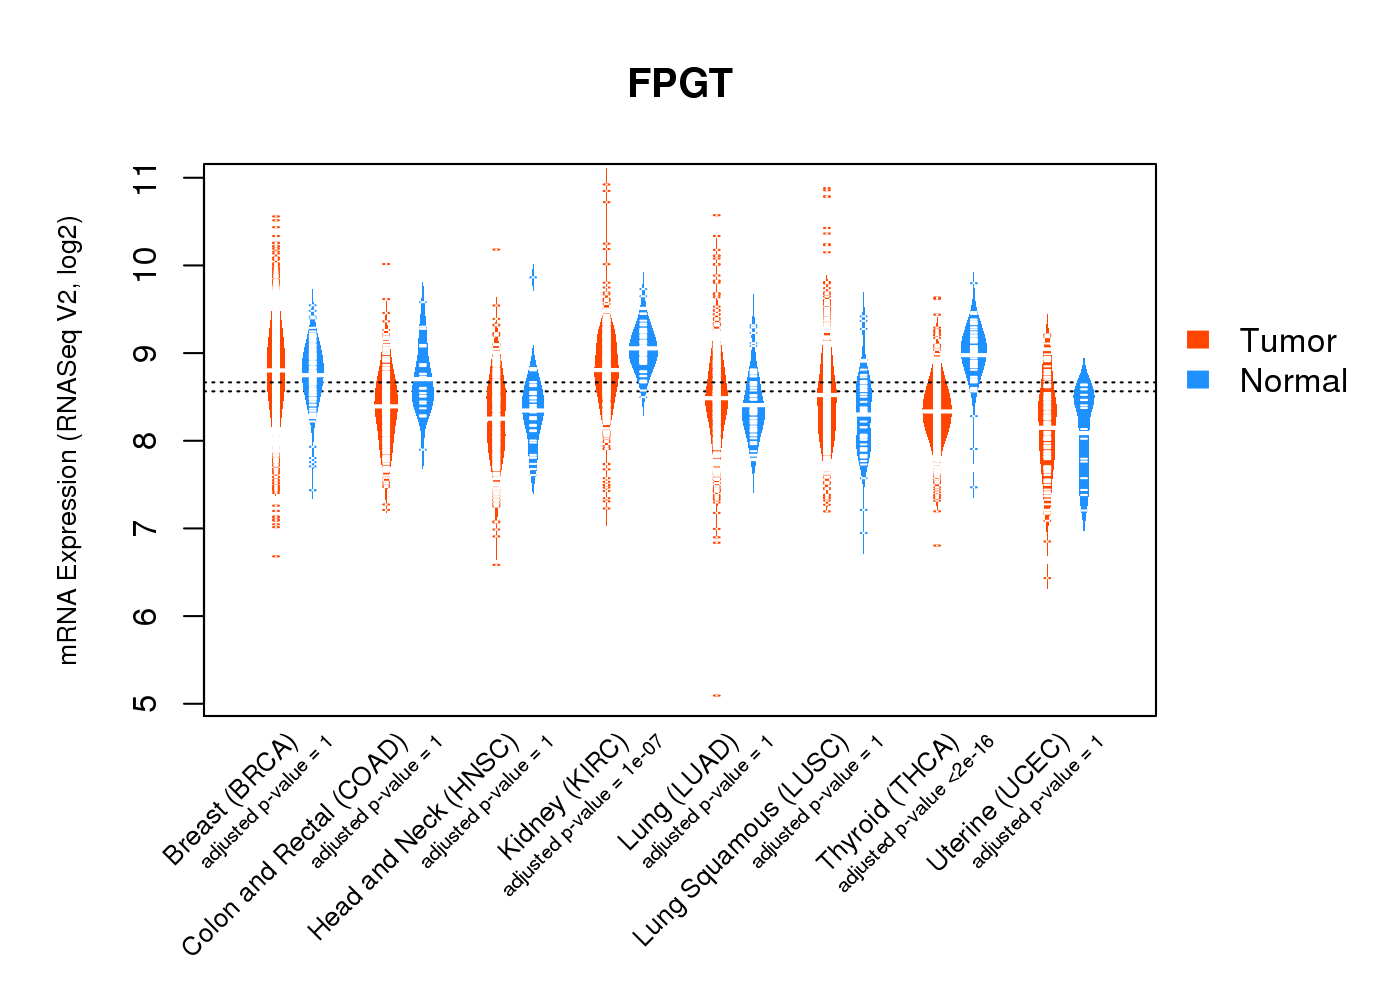
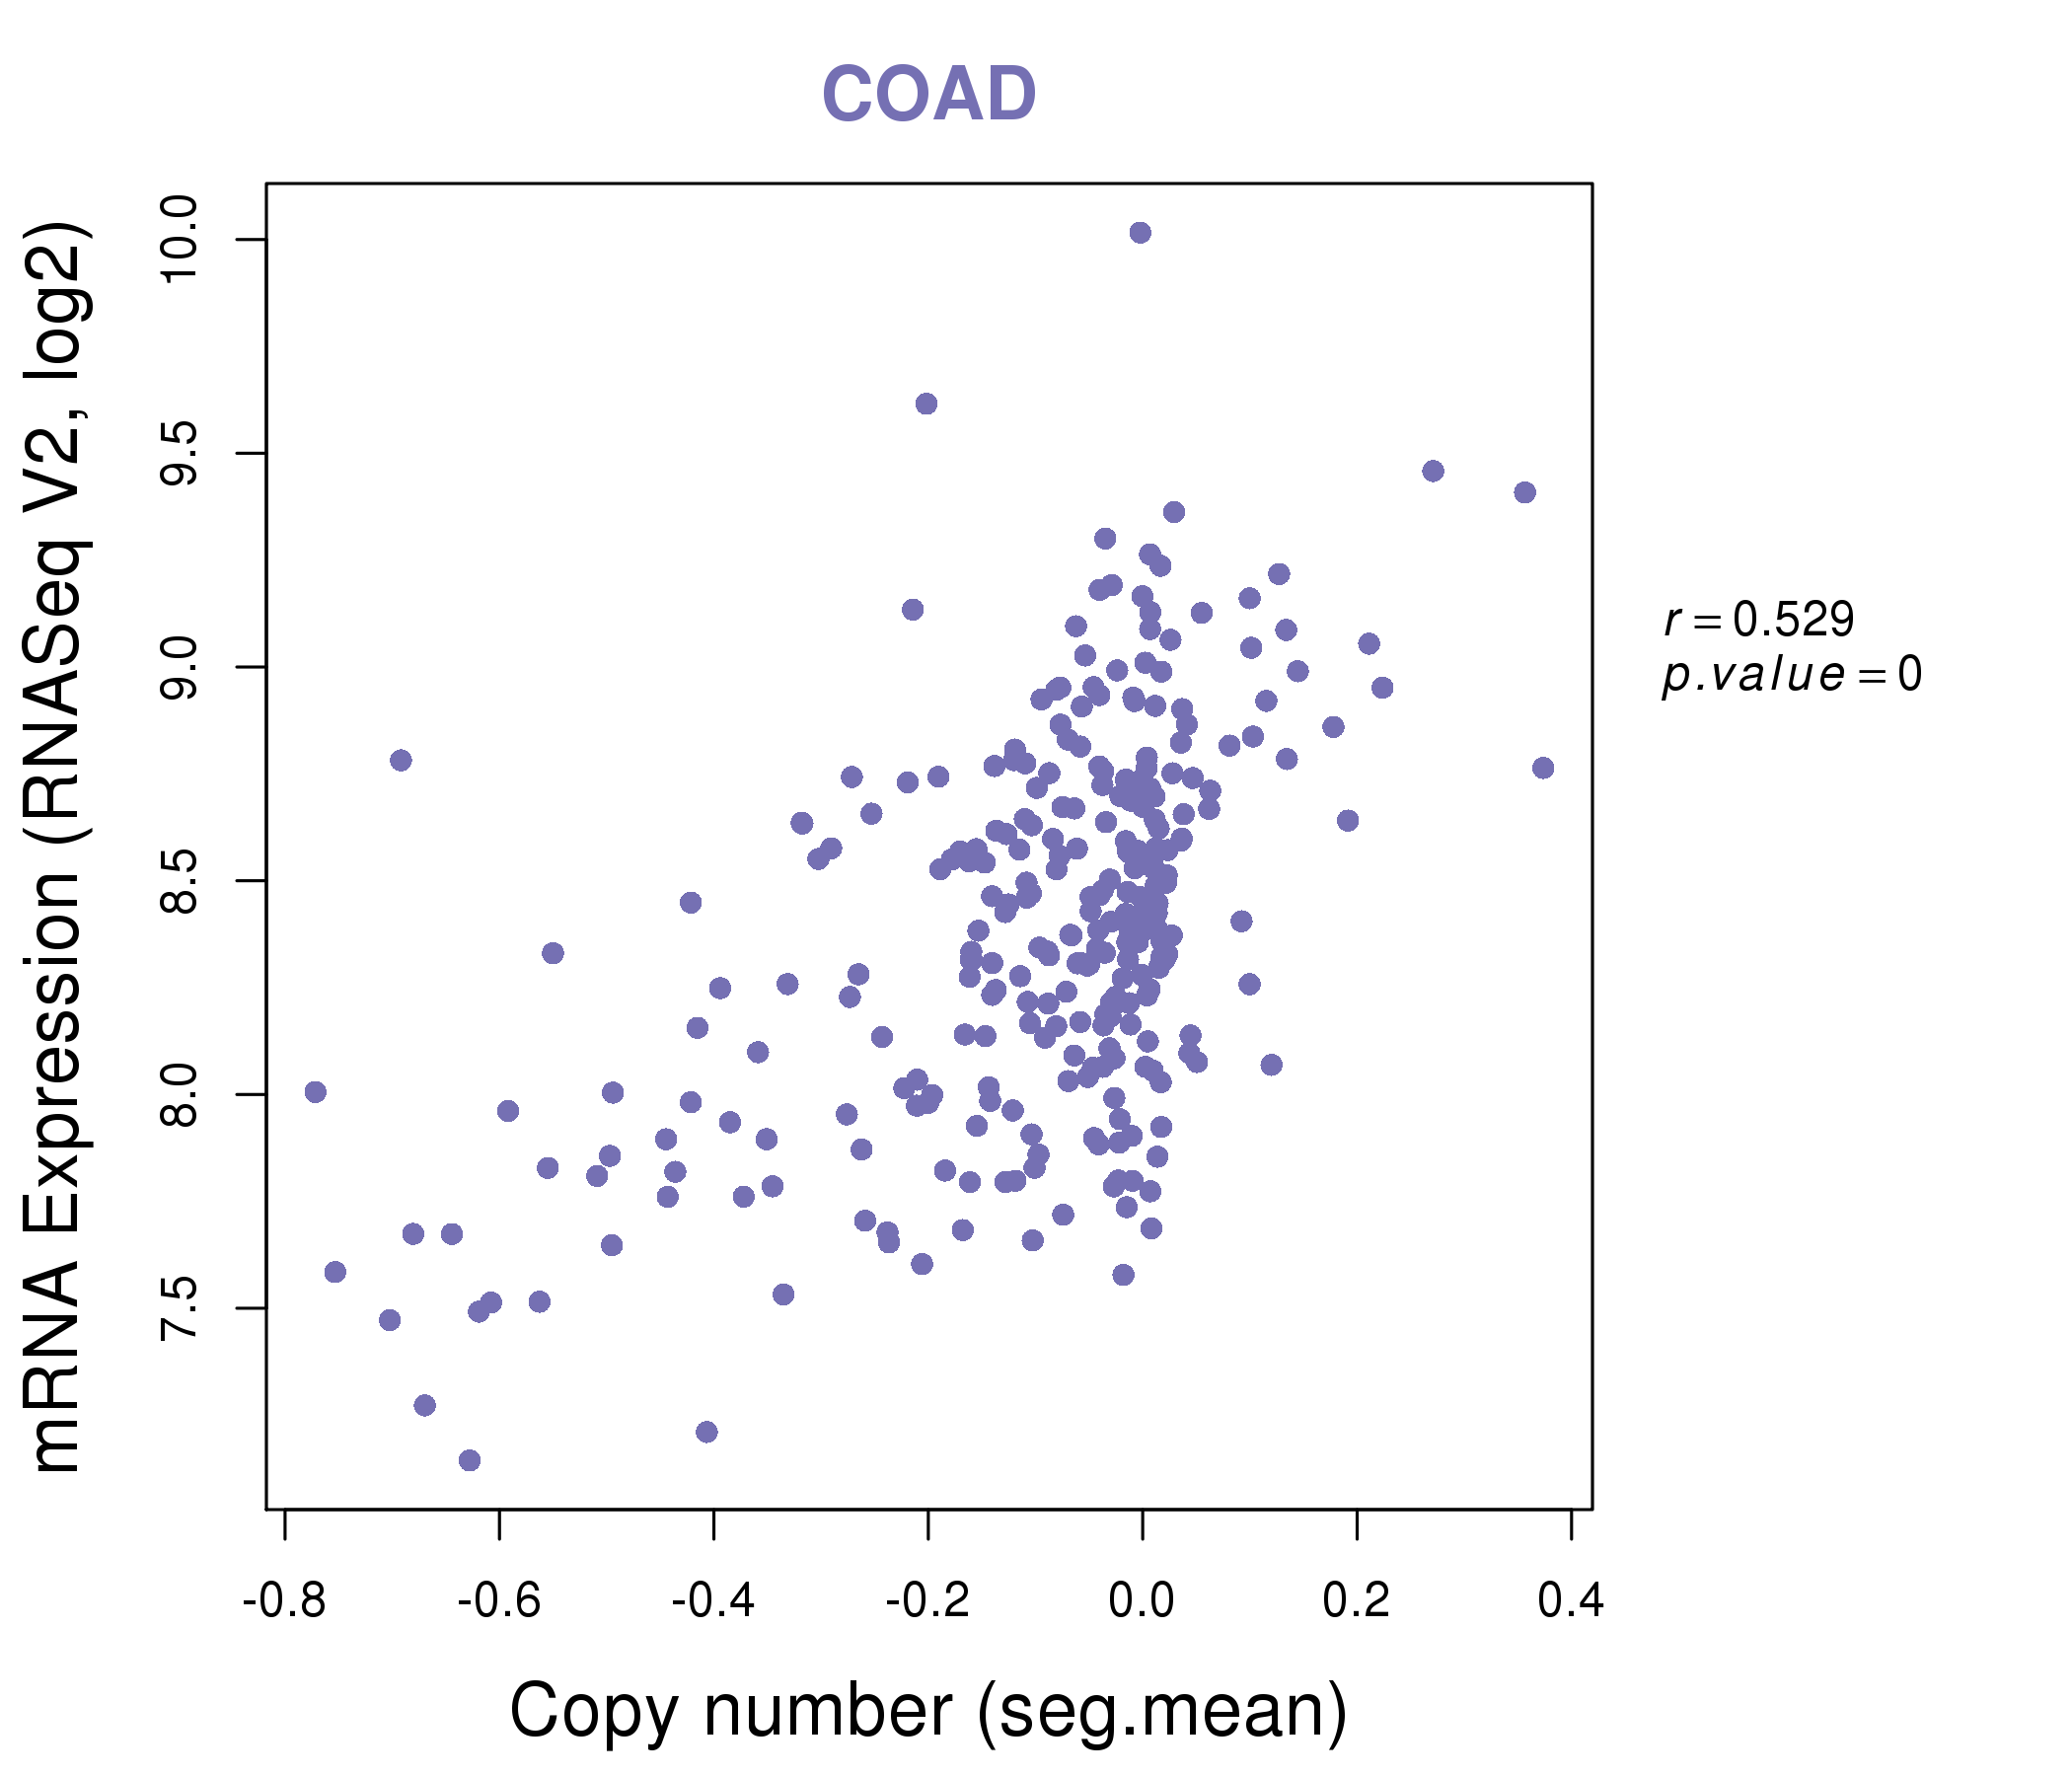
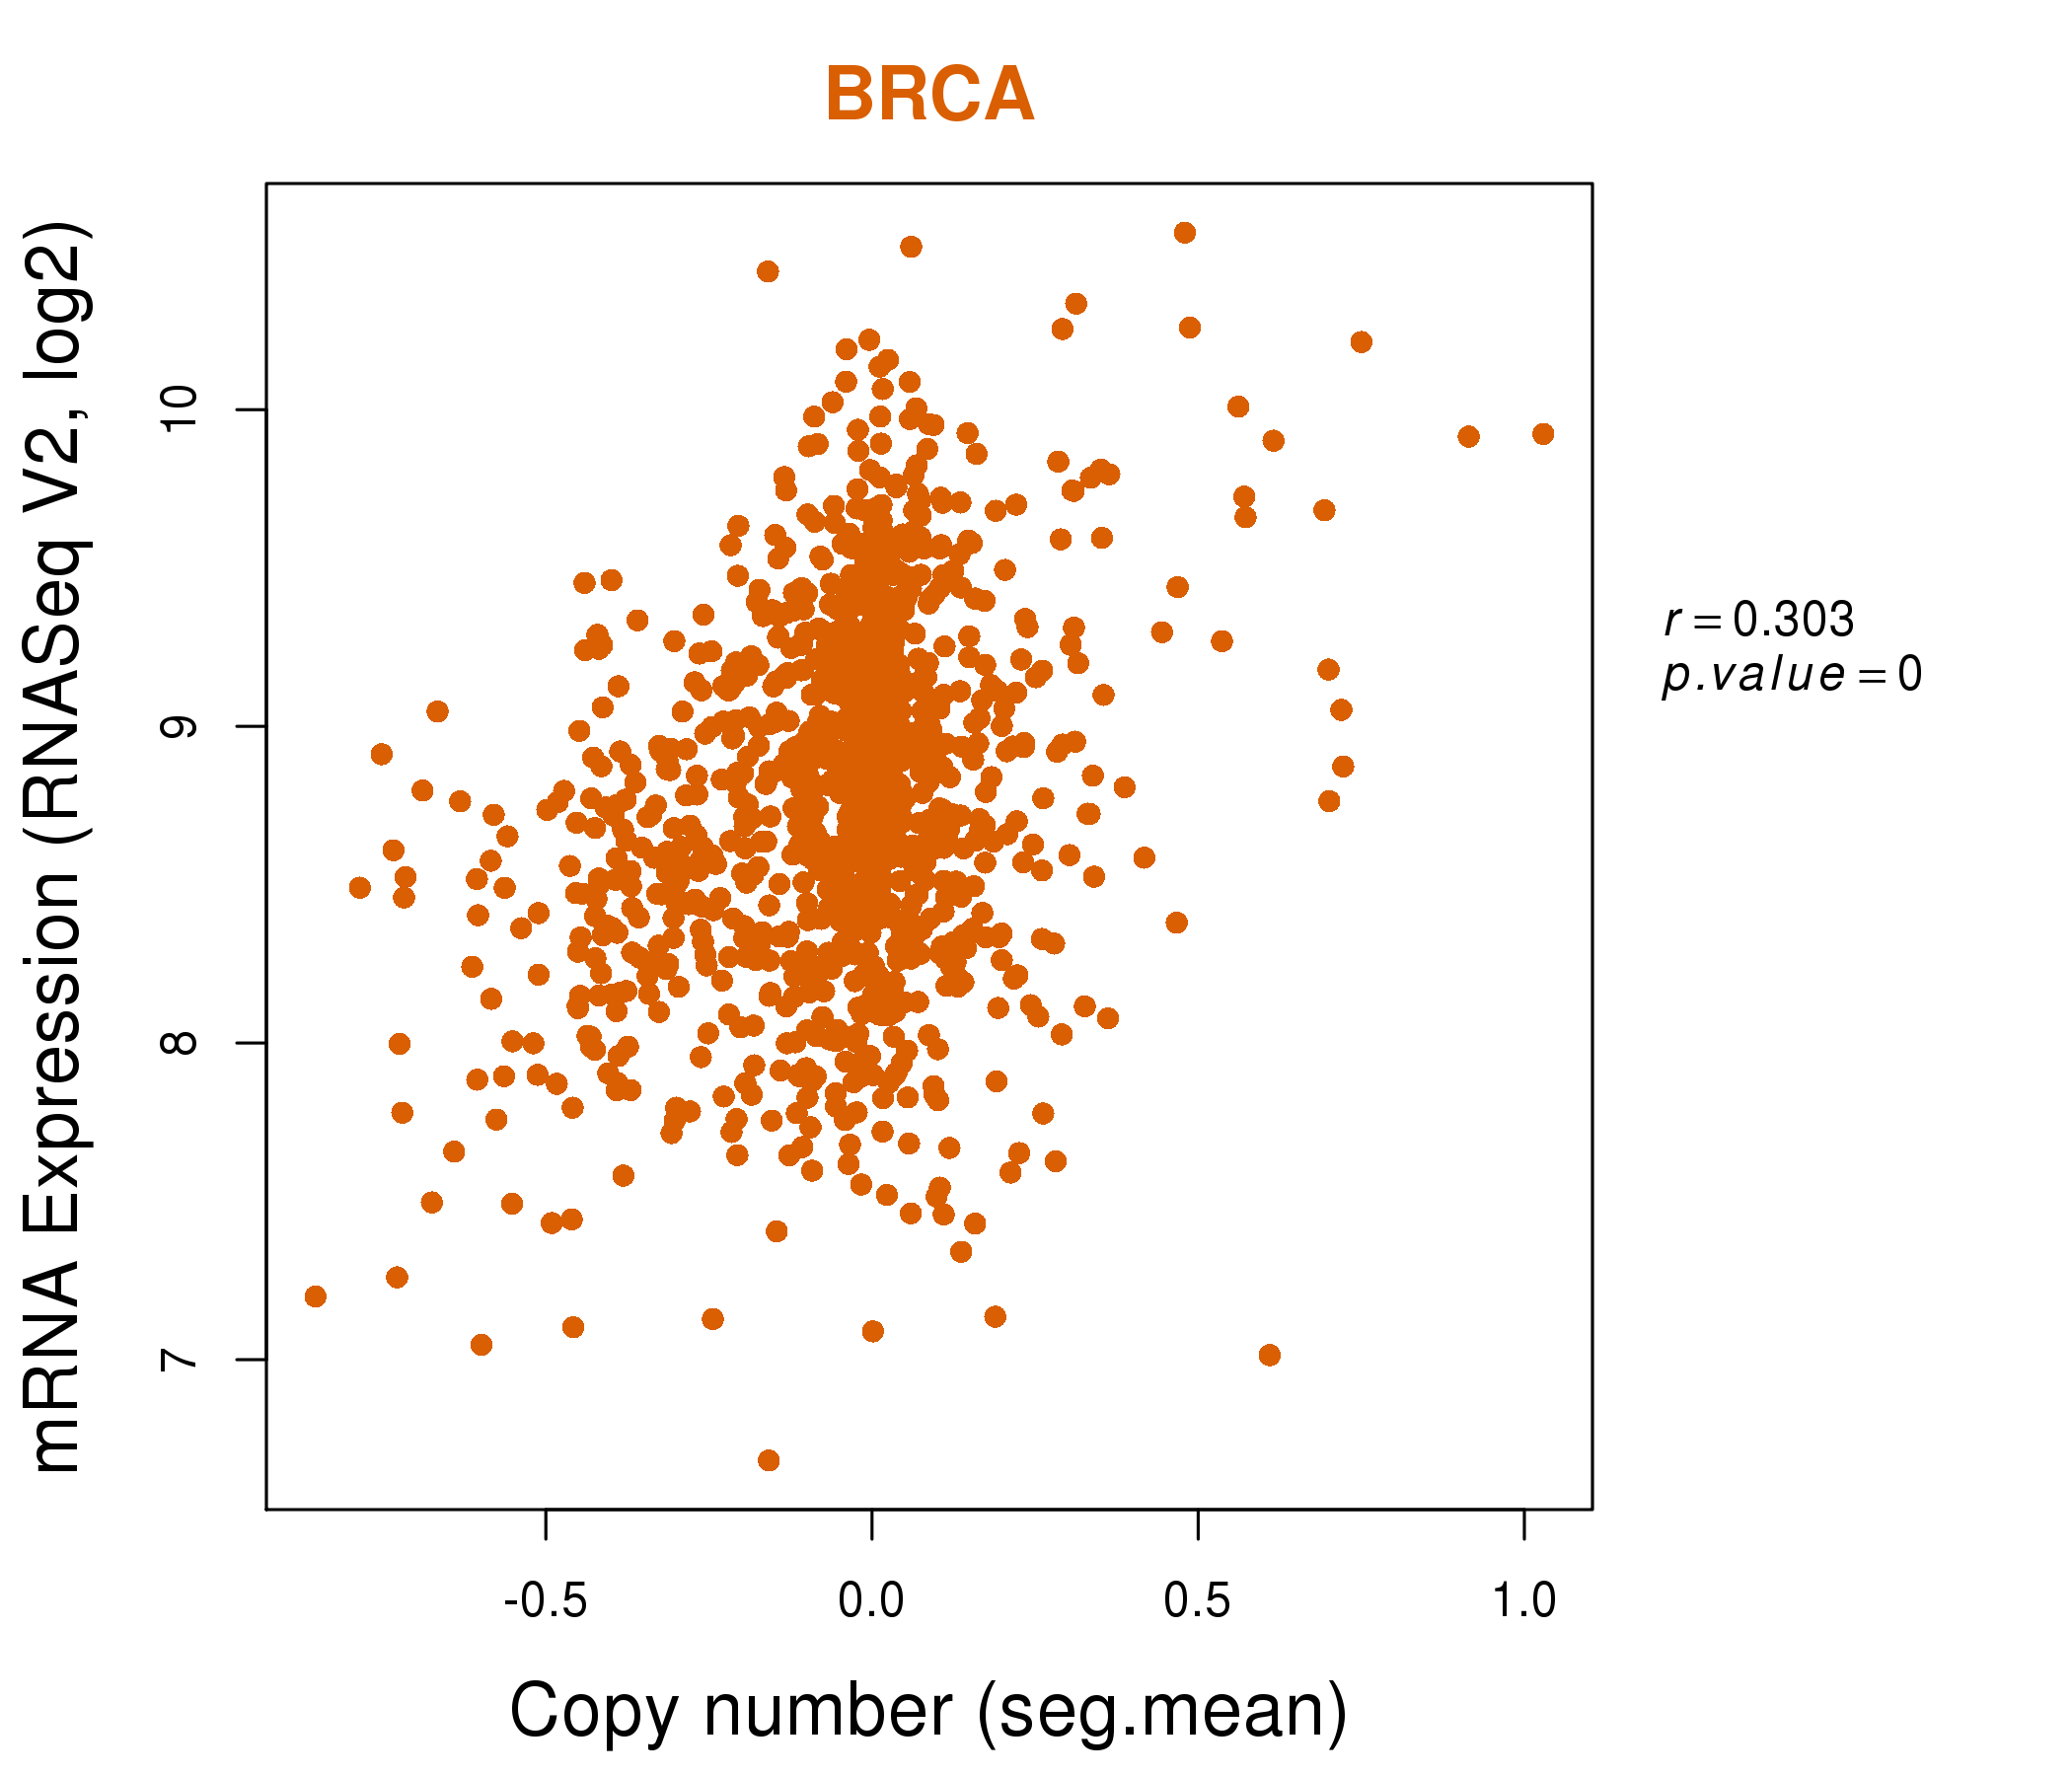
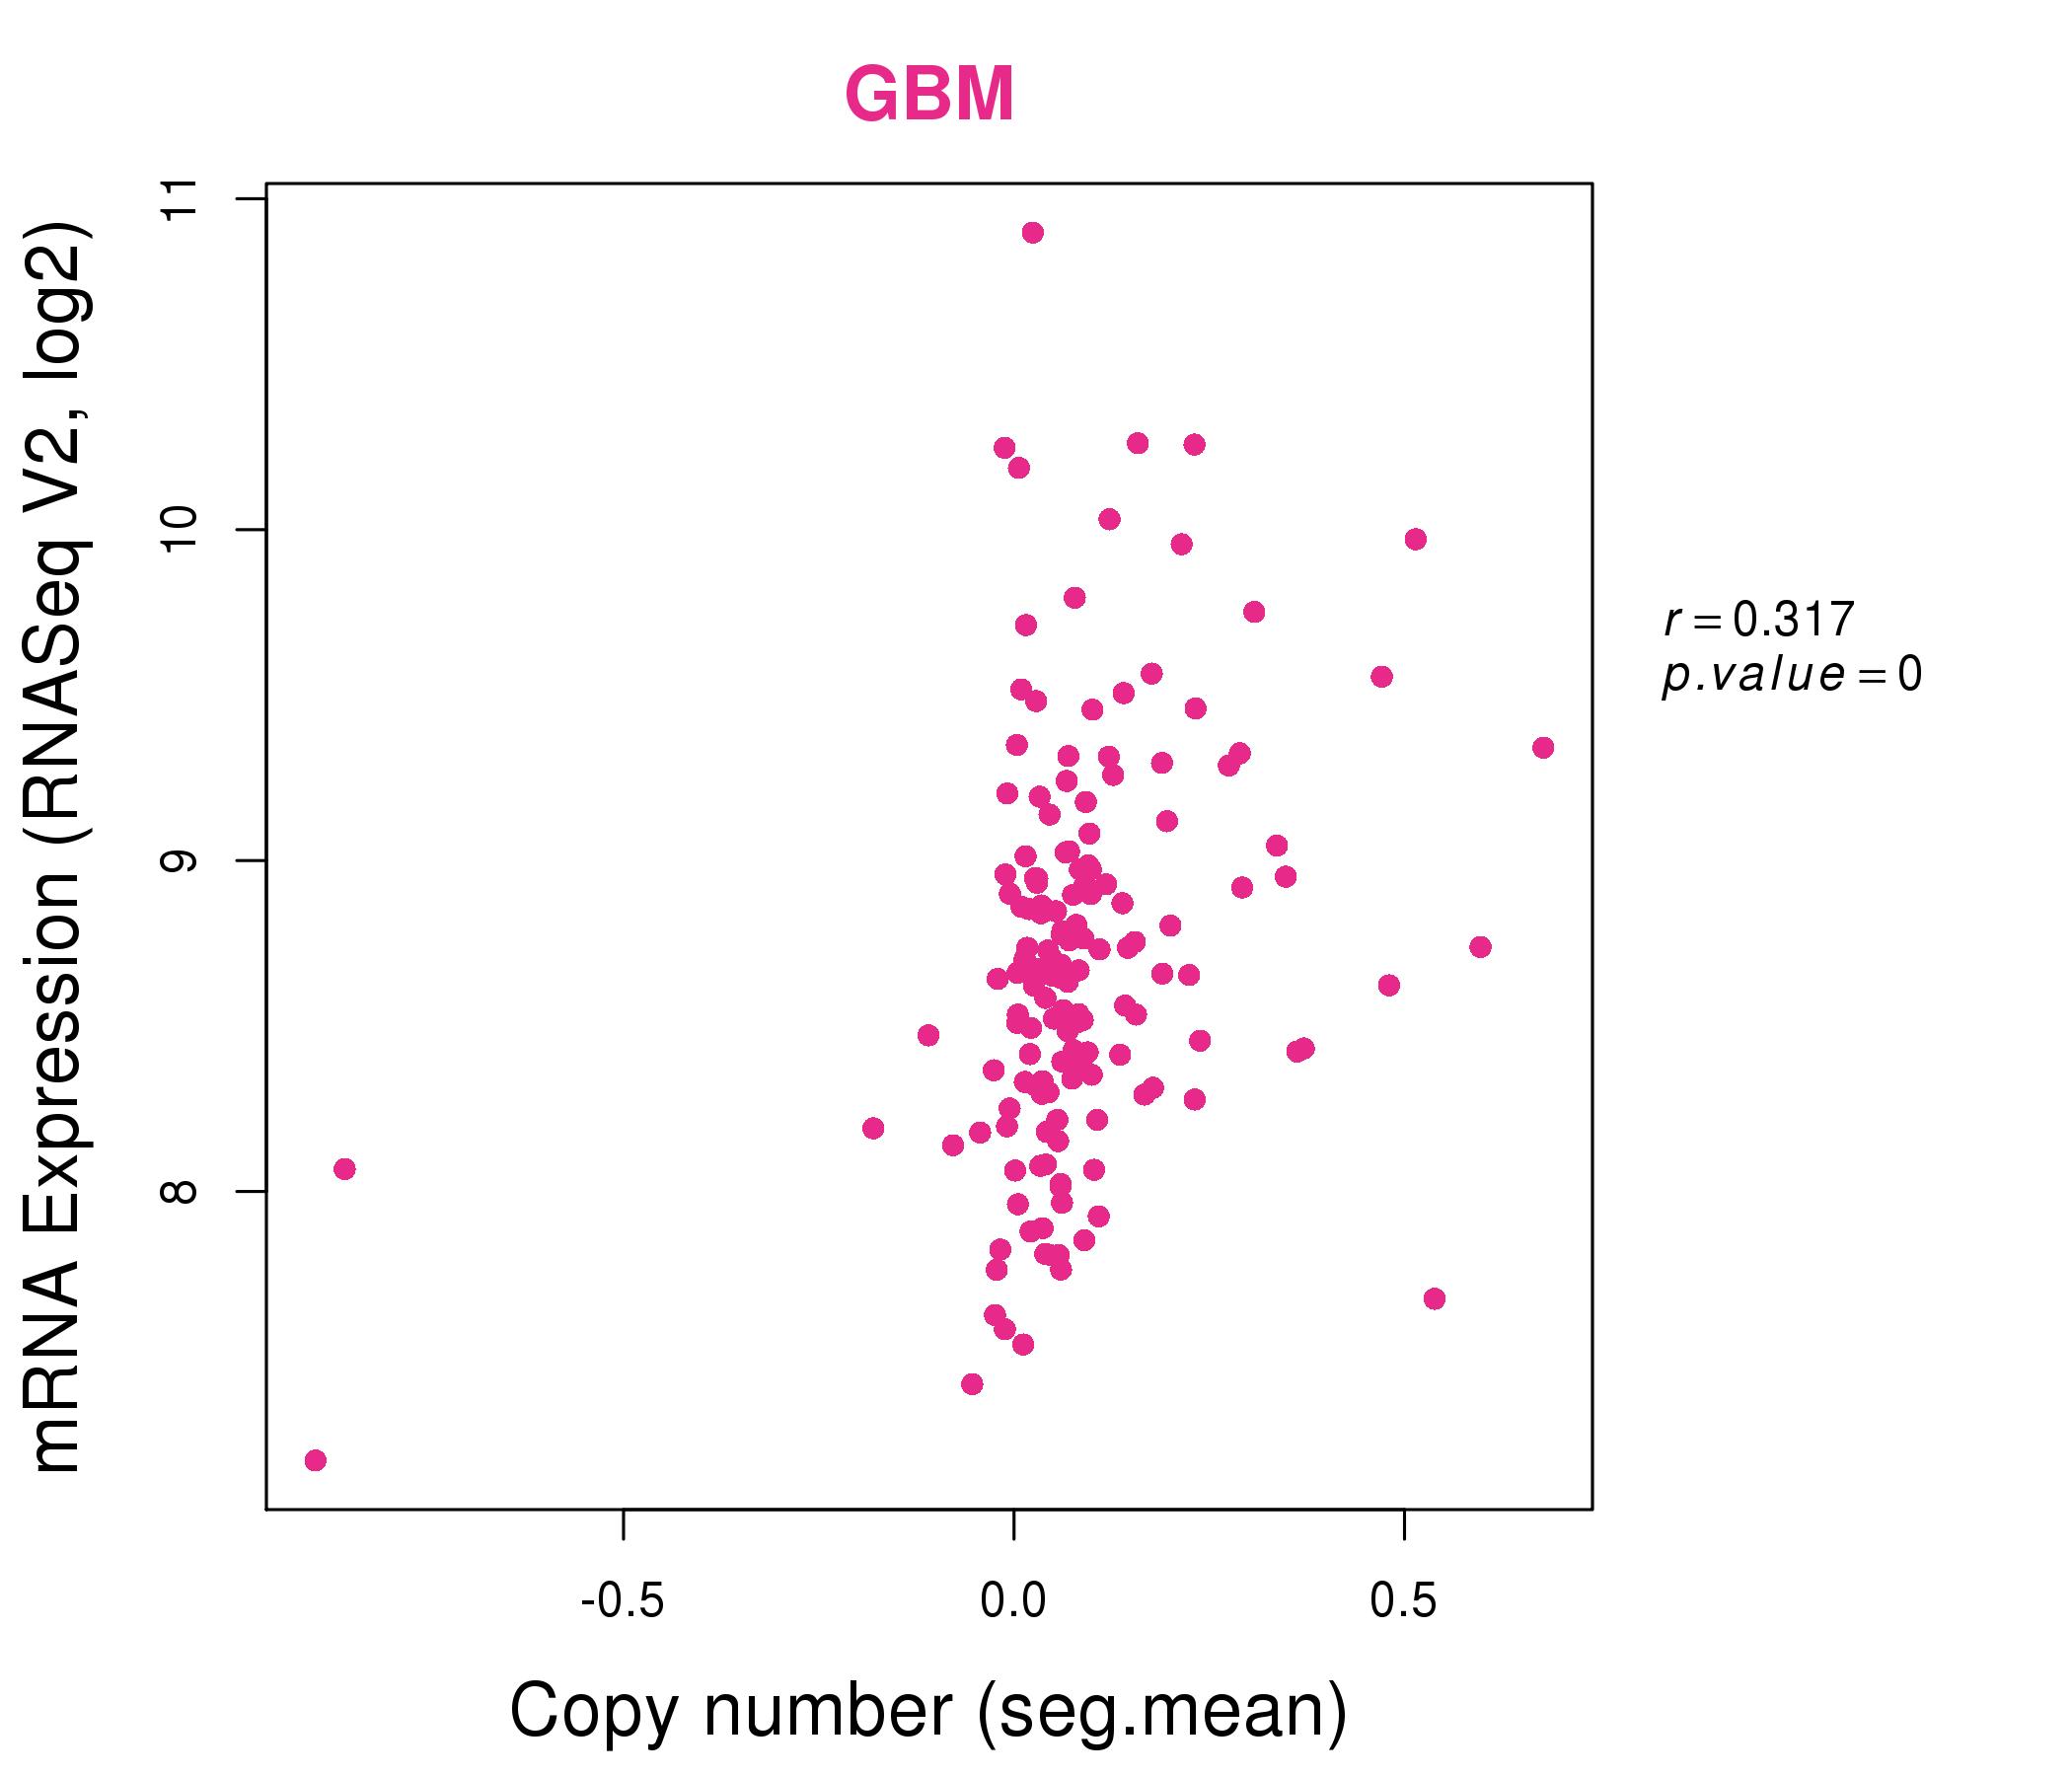
| * Normalized gene expression data of RNASeqV2 was extracted from TCGA using R package TCGA-Assembler. The URLs of all public data files on TCGA DCC data server were gathered at Jan-05-2015. Only eight cancer types have enough normal control samples for differential expression analysis. (t test, adjusted p<0.05 (using Benjamini-Hochberg FDR)) |
 |
| Top |
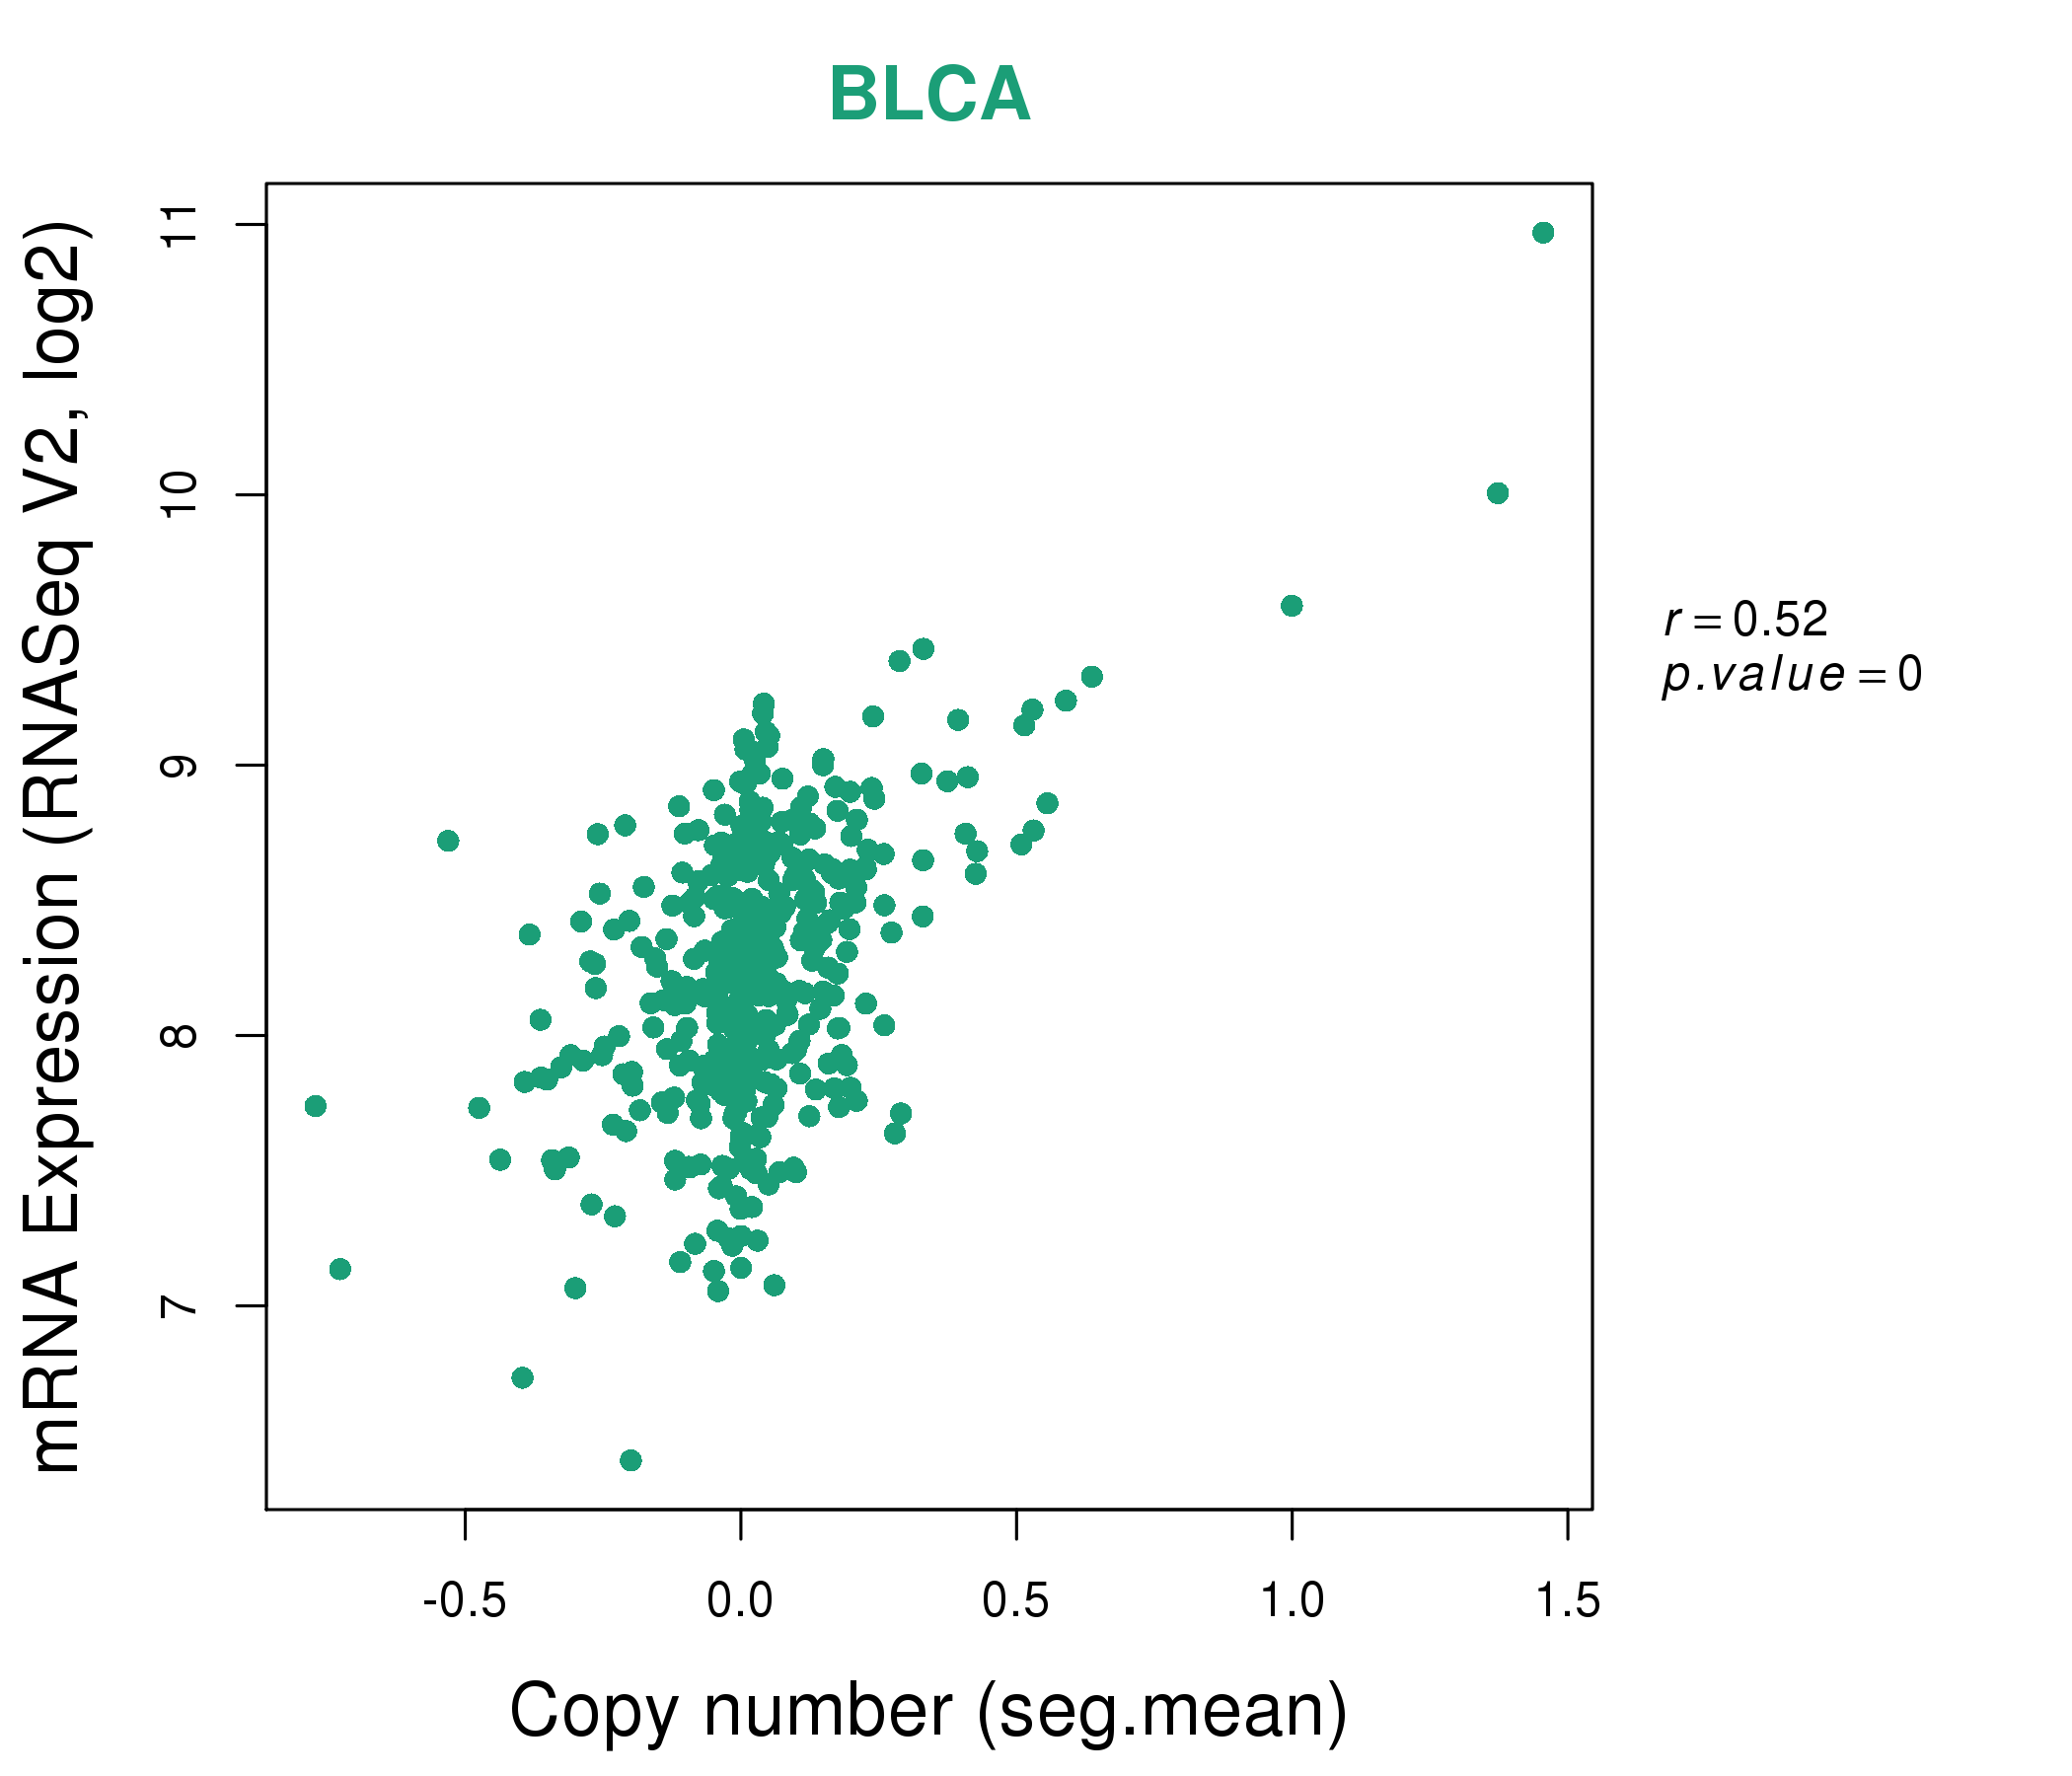
| * This plots show the correlation between CNV and gene expression. |
: Open all plots for all cancer types
 |
|
 |
|
| Top |
| Gene-Gene Network Information |
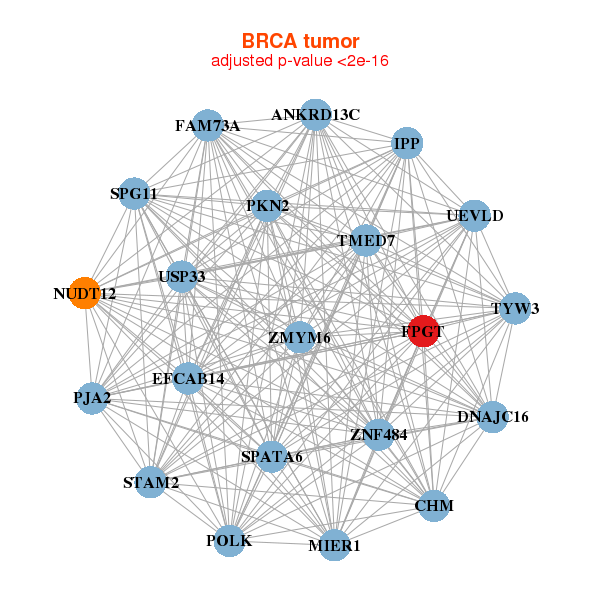
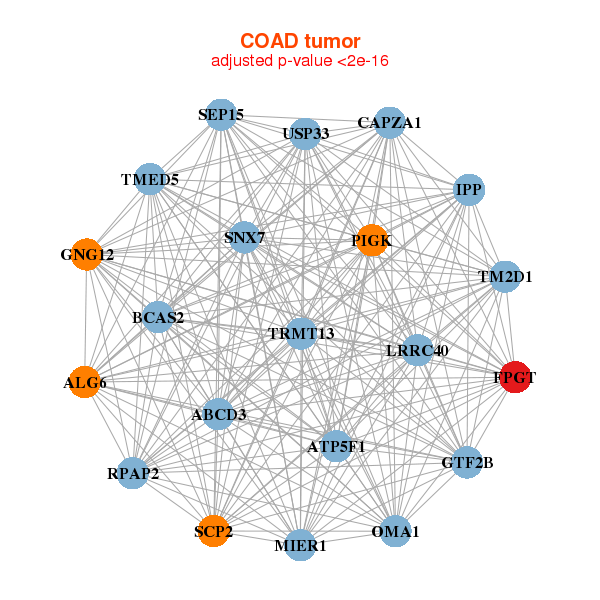
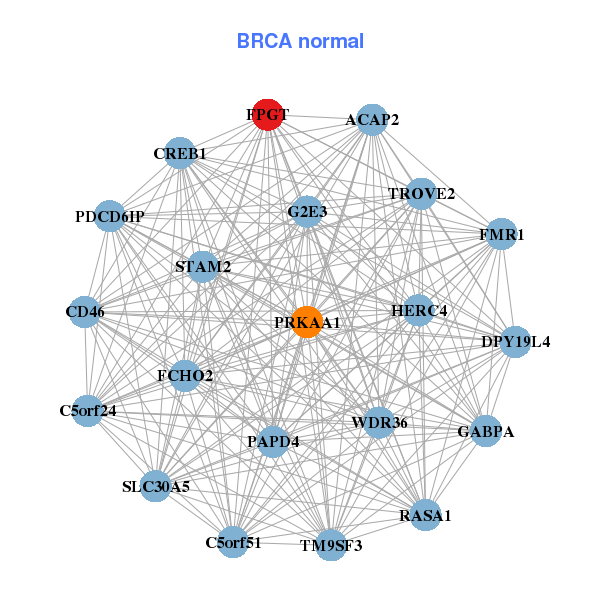
| * Co-Expression network figures were drawn using R package igraph. Only the top 20 genes with the highest correlations were shown. Red circle: input gene, orange circle: cell metabolism gene, sky circle: other gene |
: Open all plots for all cancer types
 |
|
| ANKRD13C,CHM,DNAJC16,FAM73A,FPGT,IPP,EFCAB14, MIER1,NUDT12,PJA2,PKN2,POLK,SPATA6,SPG11, STAM2,TMED7,TYW3,UEVLD,USP33,ZMYM6,ZNF484 | ACAP2,C5orf24,C5orf51,CD46,CREB1,DPY19L4,FCHO2, FMR1,FPGT,G2E3,GABPA,HERC4,PAPD4,PDCD6IP, PRKAA1,RASA1,SLC30A5,STAM2,TM9SF3,TROVE2,WDR36 |
 |
|
| ABCD3,ALG6,ATP5F1,BCAS2,CAPZA1,TRMT13,FPGT, GNG12,GTF2B,IPP,LRRC40,MIER1,OMA1,PIGK, RPAP2,SCP2,SEP15,SNX7,TM2D1,TMED5,USP33 | ATG5,TMEM251,C18orf32,C3orf38,FAM96A,FPGT,HINT1, IRAK4,KRCC1,MRPS36,NXT2,PDCD10,PPA2,PPCS, RFWD2,SDHD,SNX6,TMBIM4,TMEM68,TWF1,ZCCHC10 |

| * Co-Expression network figures were drawn using R package igraph. Only the top 20 genes with the highest correlations were shown. Red circle: input gene, orange circle: cell metabolism gene, sky circle: other gene |
: Open all plots for all cancer types
| Top |
: Open all interacting genes' information including KEGG pathway for all interacting genes from DAVID
| Top |
| Pharmacological Information for FPGT |
| There's no related Drug. |
| Top |
| Cross referenced IDs for FPGT |
| * We obtained these cross-references from Uniprot database. It covers 150 different DBs, 18 categories. http://www.uniprot.org/help/cross_references_section |
: Open all cross reference information
|
Copyright © 2016-Present - The Univsersity of Texas Health Science Center at Houston @ |