|
|||||||||||||||||||||||||||||||||||||||||||||||||||||||||||||||||||||||||||||||||||||||||||||||||||||||||||||||||||||||||||||||||||||||||||||||||||||||||||||||||||||||||||||||||||||||||||||||||||||||||||||||||||||||||||||||||||||||||||||||||||||||||||||||||||||||||||||||||||||||||||||||||||||||||||||||||||||||||||||||||||||||||||||
| |
| Phenotypic Information (metabolism pathway, cancer, disease, phenome) |
| |
| |
| Gene-Gene Network Information: Co-Expression Network, Interacting Genes & KEGG |
| |
|


| Gene Summary for SUCLG1 |
| Basic gene info. | Gene symbol | SUCLG1 |
| Gene name | succinate-CoA ligase, alpha subunit | |
| Synonyms | GALPHA|MTDPS9|SUCLA1 | |
| Cytomap | UCSC genome browser: 2p11.2 | |
| Genomic location | chr2 :84650646-84686586 | |
| Type of gene | protein-coding | |
| RefGenes | NM_003849.3, | |
| Ensembl id | ENSG00000163541 | |
| Description | SCS-alphasuccinyl-CoA ligase [ADP/GDP-forming] subunit alpha, mitochondrialsuccinyl-CoA ligase [GDP-forming] subunit alpha, mitochondrialsuccinyl-CoA synthetase subunit alpha | |
| Modification date | 20141207 | |
| dbXrefs | MIM : 611224 | |
| HGNC : HGNC | ||
| Ensembl : ENSG00000163541 | ||
| HPRD : 18128 | ||
| Vega : OTTHUMG00000130023 | ||
| Protein | UniProt: go to UniProt's Cross Reference DB Table | |
| Expression | CleanEX: HS_SUCLG1 | |
| BioGPS: 8802 | ||
| Gene Expression Atlas: ENSG00000163541 | ||
| The Human Protein Atlas: ENSG00000163541 | ||
| Pathway | NCI Pathway Interaction Database: SUCLG1 | |
| KEGG: SUCLG1 | ||
| REACTOME: SUCLG1 | ||
| ConsensusPathDB | ||
| Pathway Commons: SUCLG1 | ||
| Metabolism | MetaCyc: SUCLG1 | |
| HUMANCyc: SUCLG1 | ||
| Regulation | Ensembl's Regulation: ENSG00000163541 | |
| miRBase: chr2 :84,650,646-84,686,586 | ||
| TargetScan: NM_003849 | ||
| cisRED: ENSG00000163541 | ||
| Context | iHOP: SUCLG1 | |
| cancer metabolism search in PubMed: SUCLG1 | ||
| UCL Cancer Institute: SUCLG1 | ||
| Assigned class in ccmGDB | C | |
| Top |
| Phenotypic Information for SUCLG1(metabolism pathway, cancer, disease, phenome) |
| Cancer | CGAP: SUCLG1 |
| Familial Cancer Database: SUCLG1 | |
| * This gene is included in those cancer gene databases. |
|
|
|
|
|
|
| |||||||||||||||||||||||||||||||||||||||||||||||||||||||||||||||||||||||||||||||||||||||||||||||||||||||||||||||||||||||||||||||||||||||||||||||||||||||||||||||||||||||||||||||||||||||||||||||||||||||||||||||||||||||||||||||||||||||||||||||||||||||||||||||||||||||||||||||||||||||||||||||||||||||||||||||||||||||||||||||||||||||
Oncogene 1 | Significant driver gene in | ||||||||||||||||||||||||||||||||||||||||||||||||||||||||||||||||||||||||||||||||||||||||||||||||||||||||||||||||||||||||||||||||||||||||||||||||||||||||||||||||||||||||||||||||||||||||||||||||||||||||||||||||||||||||||||||||||||||||||||||||||||||||||||||||||||||||||||||||||||||||||||||||||||||||||||||||||||||||||||||||||||||||||||
| cf) number; DB name 1 Oncogene; http://nar.oxfordjournals.org/content/35/suppl_1/D721.long, 2 Tumor Suppressor gene; https://bioinfo.uth.edu/TSGene/, 3 Cancer Gene Census; http://www.nature.com/nrc/journal/v4/n3/abs/nrc1299.html, 4 CancerGenes; http://nar.oxfordjournals.org/content/35/suppl_1/D721.long, 5 Network of Cancer Gene; http://ncg.kcl.ac.uk/index.php, 1Therapeutic Vulnerabilities in Cancer; http://cbio.mskcc.org/cancergenomics/statius/ |
| KEGG_PROPANOATE_METABOLISM REACTOME_PYRUVATE_METABOLISM_AND_CITRIC_ACID_TCA_CYCLE | |
| OMIM | |
| Orphanet | |
| Disease | KEGG Disease: SUCLG1 |
| MedGen: SUCLG1 (Human Medical Genetics with Condition) | |
| ClinVar: SUCLG1 | |
| Phenotype | MGI: SUCLG1 (International Mouse Phenotyping Consortium) |
| PhenomicDB: SUCLG1 | |
| Mutations for SUCLG1 |
| * Under tables are showing count per each tissue to give us broad intuition about tissue specific mutation patterns.You can go to the detailed page for each mutation database's web site. |
| There's no structural variation information in COSMIC data for this gene. |
| * From mRNA Sanger sequences, Chitars2.0 arranged chimeric transcripts. This table shows SUCLG1 related fusion information. |
| ID | Head Gene | Tail Gene | Accession | Gene_a | qStart_a | qEnd_a | Chromosome_a | tStart_a | tEnd_a | Gene_a | qStart_a | qEnd_a | Chromosome_a | tStart_a | tEnd_a |
| BP319935 | SP100 | 2 | 265 | 2 | 231280936 | 231307732 | SUCLG1 | 258 | 339 | 2 | 84650652 | 84650733 | |
| BM968054 | SUCLG1 | 5 | 170 | 2 | 84650857 | 84652664 | SUCLG1 | 167 | 420 | 2 | 84658640 | 84668196 | |
| BU607293 | SUCLG1 | 5 | 170 | 2 | 84650857 | 84652664 | SUCLG1 | 167 | 420 | 2 | 84658640 | 84668196 | |
| Top |
| Mutation type/ Tissue ID | brca | cns | cerv | endome | haematopo | kidn | Lintest | liver | lung | ns | ovary | pancre | prost | skin | stoma | thyro | urina | |||
| Total # sample | 1 | |||||||||||||||||||
| GAIN (# sample) | 1 | |||||||||||||||||||
| LOSS (# sample) |
| cf) Tissue ID; Tissue type (1; Breast, 2; Central_nervous_system, 3; Cervix, 4; Endometrium, 5; Haematopoietic_and_lymphoid_tissue, 6; Kidney, 7; Large_intestine, 8; Liver, 9; Lung, 10; NS, 11; Ovary, 12; Pancreas, 13; Prostate, 14; Skin, 15; Stomach, 16; Thyroid, 17; Urinary_tract) |
| Top |
|
 |
| Top |
| Stat. for Non-Synonymous SNVs (# total SNVs=24) | (# total SNVs=11) |
 |  |
(# total SNVs=1) | (# total SNVs=2) |
 |  |
| Top |
| * When you move the cursor on each content, you can see more deailed mutation information on the Tooltip. Those are primary_site,primary_histology,mutation(aa),pubmedID. |
| GRCh37 position | Mutation(aa) | Unique sampleID count |
| chr2:84658736-84658736 | p.E241K | 4 |
| chr2:84652606-84652606 | p.S316F | 3 |
| chr2:84676841-84676841 | p.A45T | 2 |
| chr2:84652539-84652539 | p.K338K | 2 |
| chr2:84658692-84658692 | p.I255M | 1 |
| chr2:84686342-84686342 | p.S18R | 1 |
| chr2:84660508-84660508 | p.T214M | 1 |
| chr2:84652566-84652566 | p.P329P | 1 |
| chr2:84670433-84670433 | p.L98S | 1 |
| chr2:84658704-84658704 | p.G251G | 1 |
| Top |
|
 |
| Point Mutation/ Tissue ID | 1 | 2 | 3 | 4 | 5 | 6 | 7 | 8 | 9 | 10 | 11 | 12 | 13 | 14 | 15 | 16 | 17 | 18 | 19 | 20 |
| # sample | 1 | 3 | 2 | 6 | 4 | 1 | 2 | 5 | 3 | |||||||||||
| # mutation | 1 | 3 | 2 | 6 | 4 | 1 | 2 | 5 | 3 | |||||||||||
| nonsynonymous SNV | 1 | 1 | 2 | 4 | 2 | 2 | 2 | 2 | ||||||||||||
| synonymous SNV | 2 | 2 | 2 | 1 | 3 | 1 |
| cf) Tissue ID; Tissue type (1; BLCA[Bladder Urothelial Carcinoma], 2; BRCA[Breast invasive carcinoma], 3; CESC[Cervical squamous cell carcinoma and endocervical adenocarcinoma], 4; COAD[Colon adenocarcinoma], 5; GBM[Glioblastoma multiforme], 6; Glioma Low Grade, 7; HNSC[Head and Neck squamous cell carcinoma], 8; KICH[Kidney Chromophobe], 9; KIRC[Kidney renal clear cell carcinoma], 10; KIRP[Kidney renal papillary cell carcinoma], 11; LAML[Acute Myeloid Leukemia], 12; LUAD[Lung adenocarcinoma], 13; LUSC[Lung squamous cell carcinoma], 14; OV[Ovarian serous cystadenocarcinoma ], 15; PAAD[Pancreatic adenocarcinoma], 16; PRAD[Prostate adenocarcinoma], 17; SKCM[Skin Cutaneous Melanoma], 18:STAD[Stomach adenocarcinoma], 19:THCA[Thyroid carcinoma], 20:UCEC[Uterine Corpus Endometrial Carcinoma]) |
| Top |
| * We represented just top 10 SNVs. When you move the cursor on each content, you can see more deailed mutation information on the Tooltip. Those are primary_site, primary_histology, mutation(aa), pubmedID. |
| Genomic Position | Mutation(aa) | Unique sampleID count |
| chr2:84668224 | p.G301W | 1 |
| chr2:84676834 | p.L98S | 1 |
| chr2:84652596 | p.S284A | 1 |
| chr2:84668385 | p.G91E | 1 |
| chr2:84676841 | p.H273H | 1 |
| chr2:84652652 | p.V83I | 1 |
| chr2:84668443 | p.G251G | 1 |
| chr2:84686342 | p.T69T | 1 |
| chr2:84652703 | p.D246N | 1 |
| chr2:84668483 | p.R47Q | 1 |
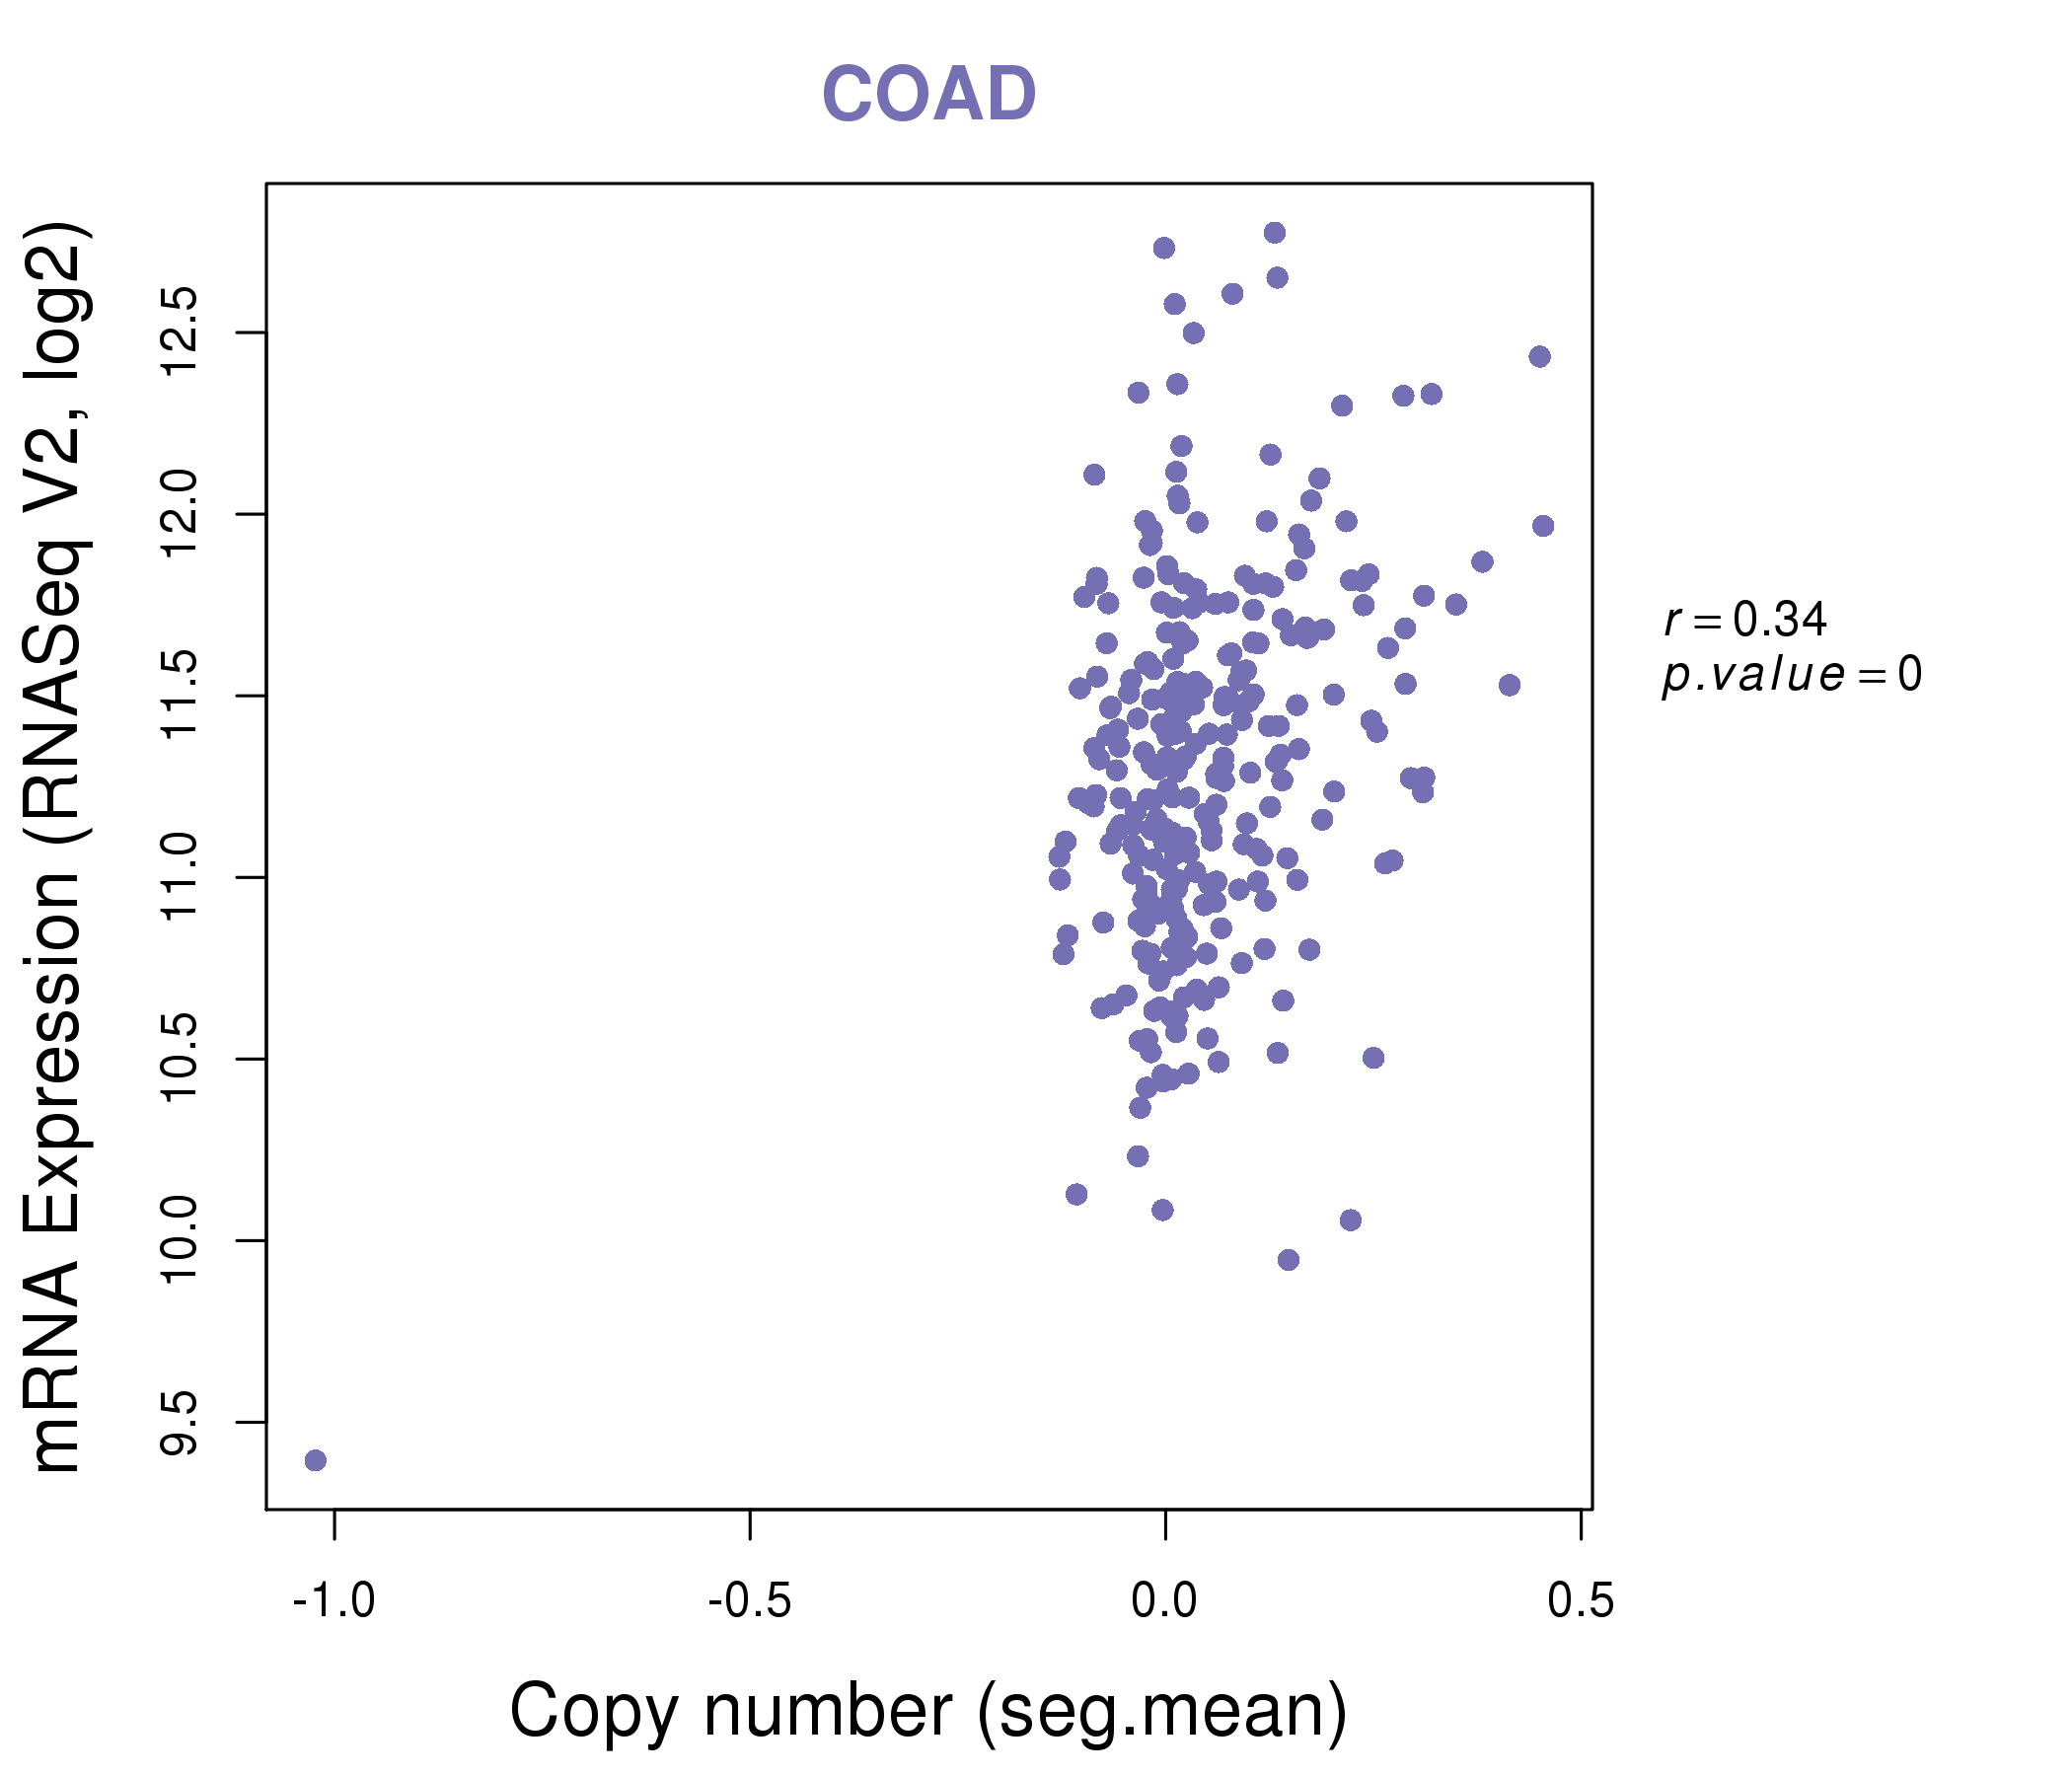
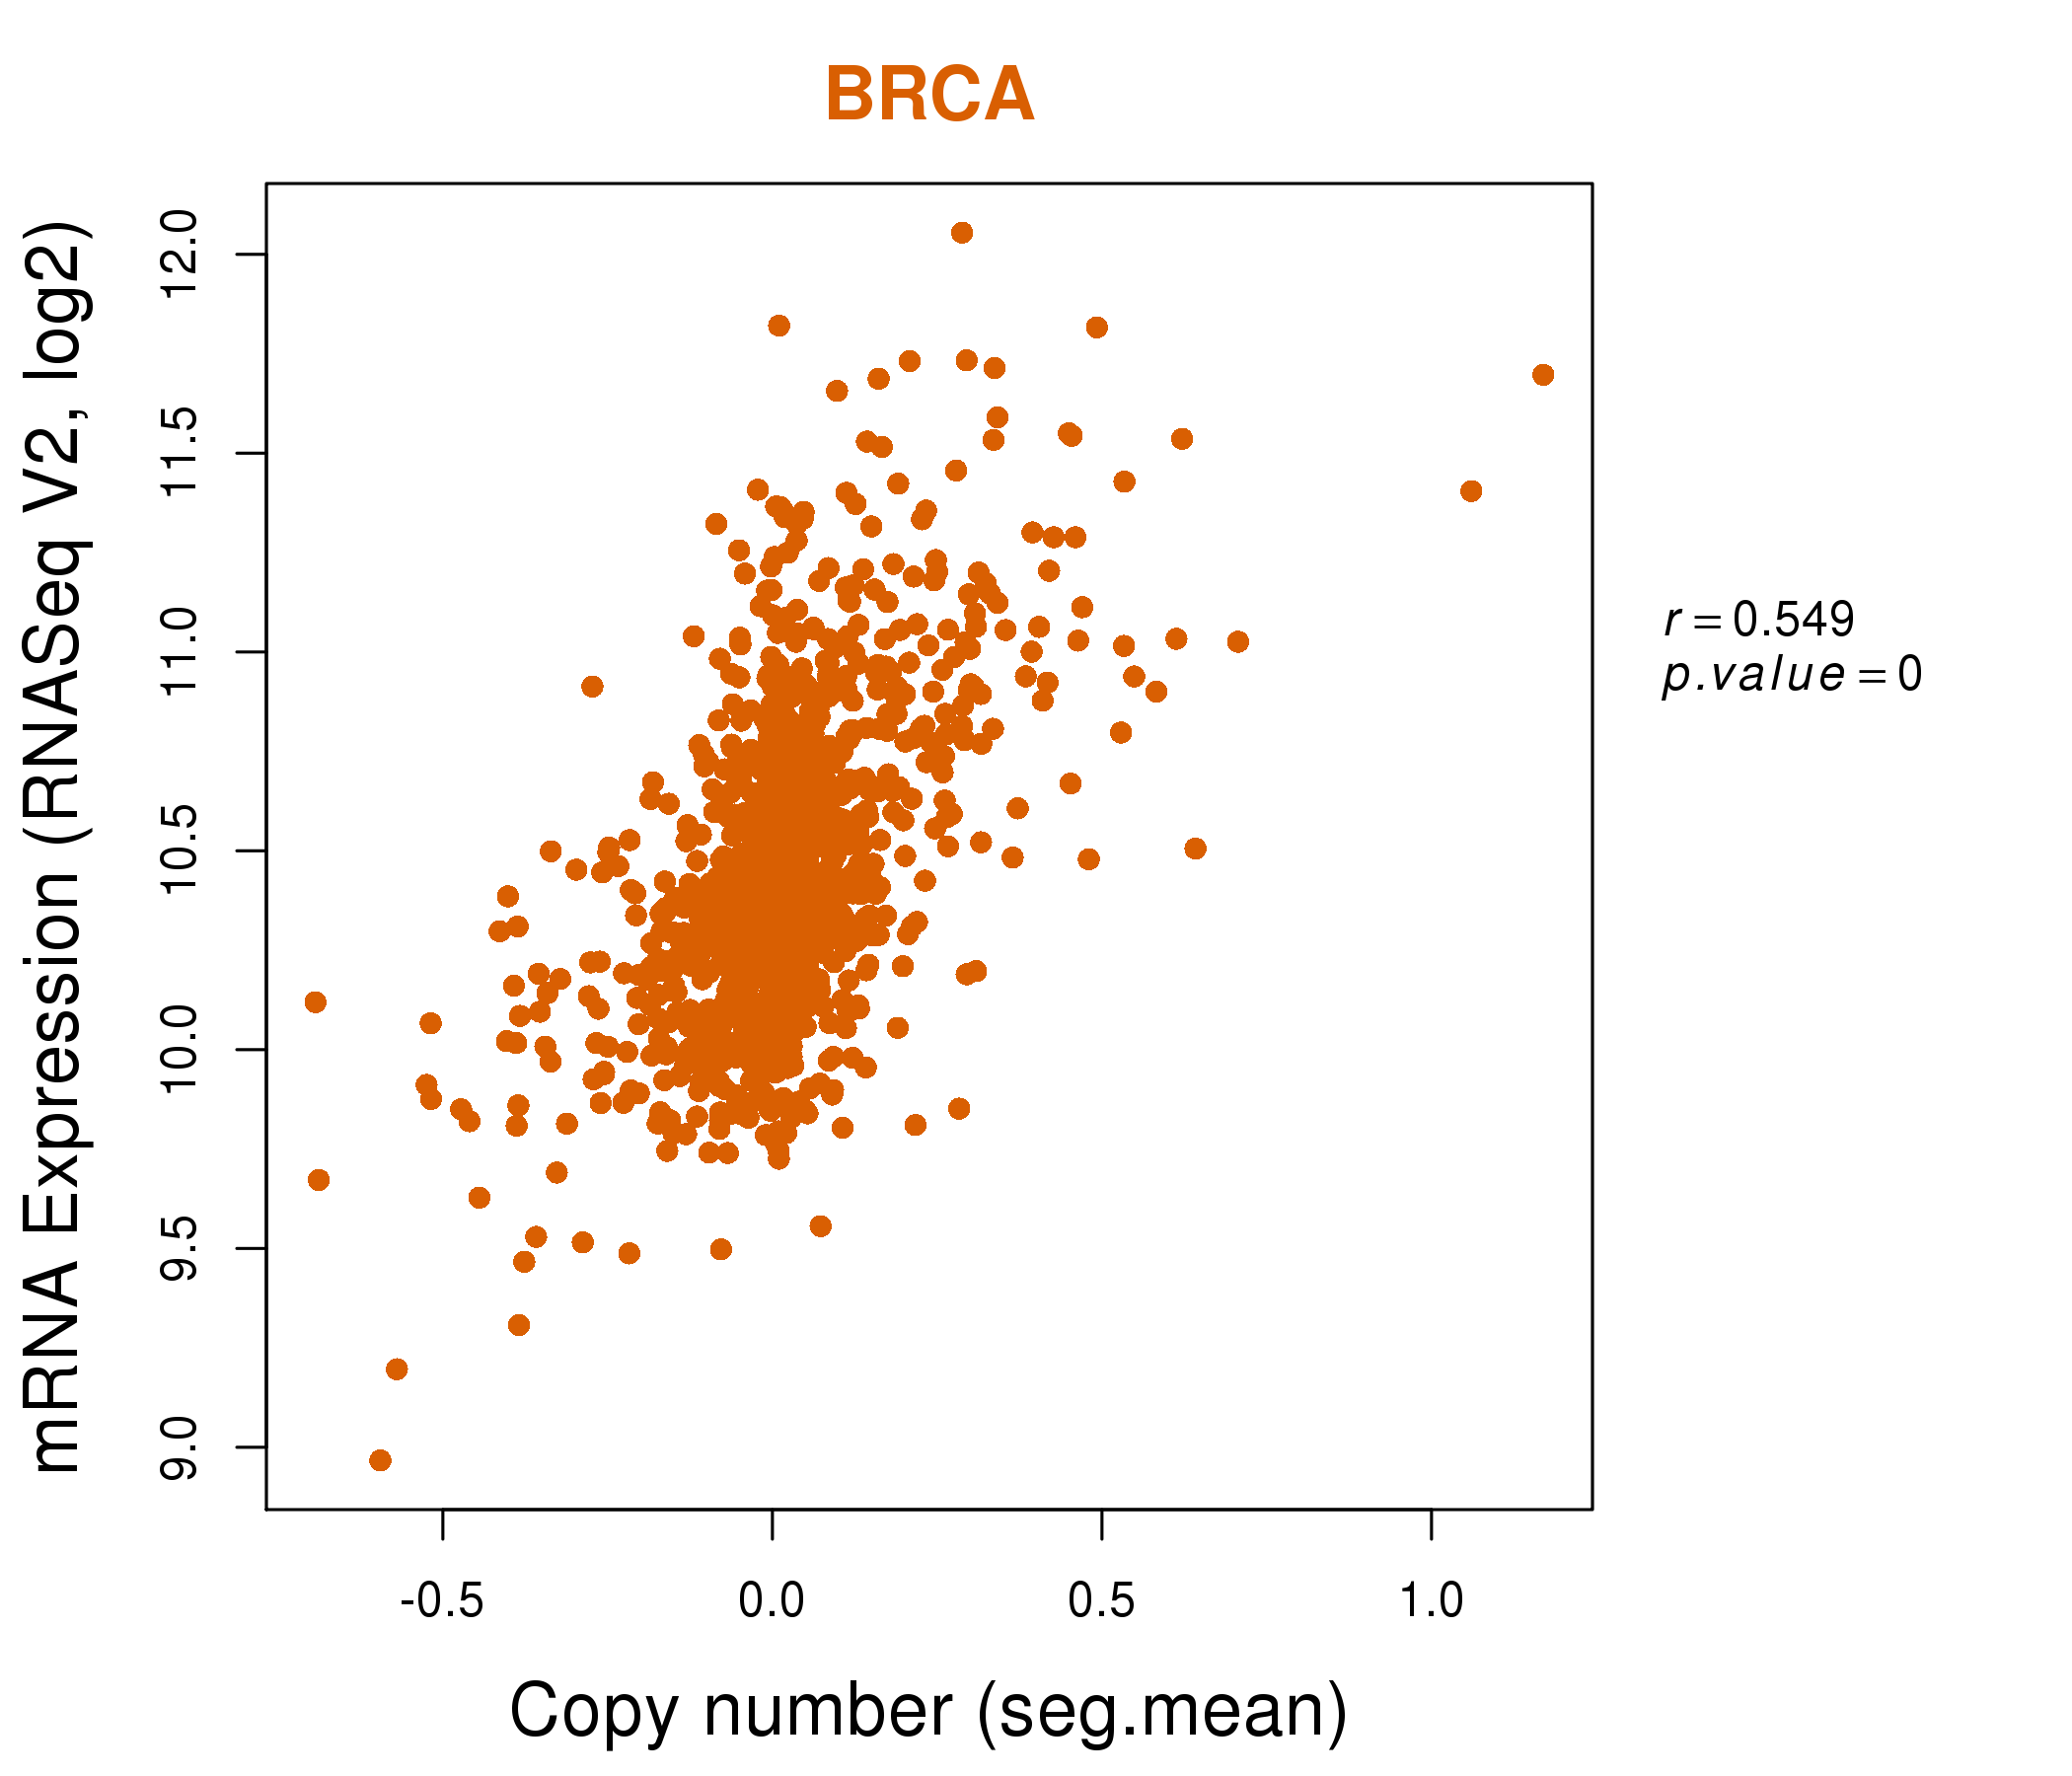
| * Copy number data were extracted from TCGA using R package TCGA-Assembler. The URLs of all public data files on TCGA DCC data server were gathered on Jan-05-2015. Function ProcessCNAData in TCGA-Assembler package was used to obtain gene-level copy number value which is calculated as the average copy number of the genomic region of a gene. |
 |
| cf) Tissue ID[Tissue type]: BLCA[Bladder Urothelial Carcinoma], BRCA[Breast invasive carcinoma], CESC[Cervical squamous cell carcinoma and endocervical adenocarcinoma], COAD[Colon adenocarcinoma], GBM[Glioblastoma multiforme], Glioma Low Grade, HNSC[Head and Neck squamous cell carcinoma], KICH[Kidney Chromophobe], KIRC[Kidney renal clear cell carcinoma], KIRP[Kidney renal papillary cell carcinoma], LAML[Acute Myeloid Leukemia], LUAD[Lung adenocarcinoma], LUSC[Lung squamous cell carcinoma], OV[Ovarian serous cystadenocarcinoma ], PAAD[Pancreatic adenocarcinoma], PRAD[Prostate adenocarcinoma], SKCM[Skin Cutaneous Melanoma], STAD[Stomach adenocarcinoma], THCA[Thyroid carcinoma], UCEC[Uterine Corpus Endometrial Carcinoma] |
| Top |
| Gene Expression for SUCLG1 |
| * CCLE gene expression data were extracted from CCLE_Expression_Entrez_2012-10-18.res: Gene-centric RMA-normalized mRNA expression data. |
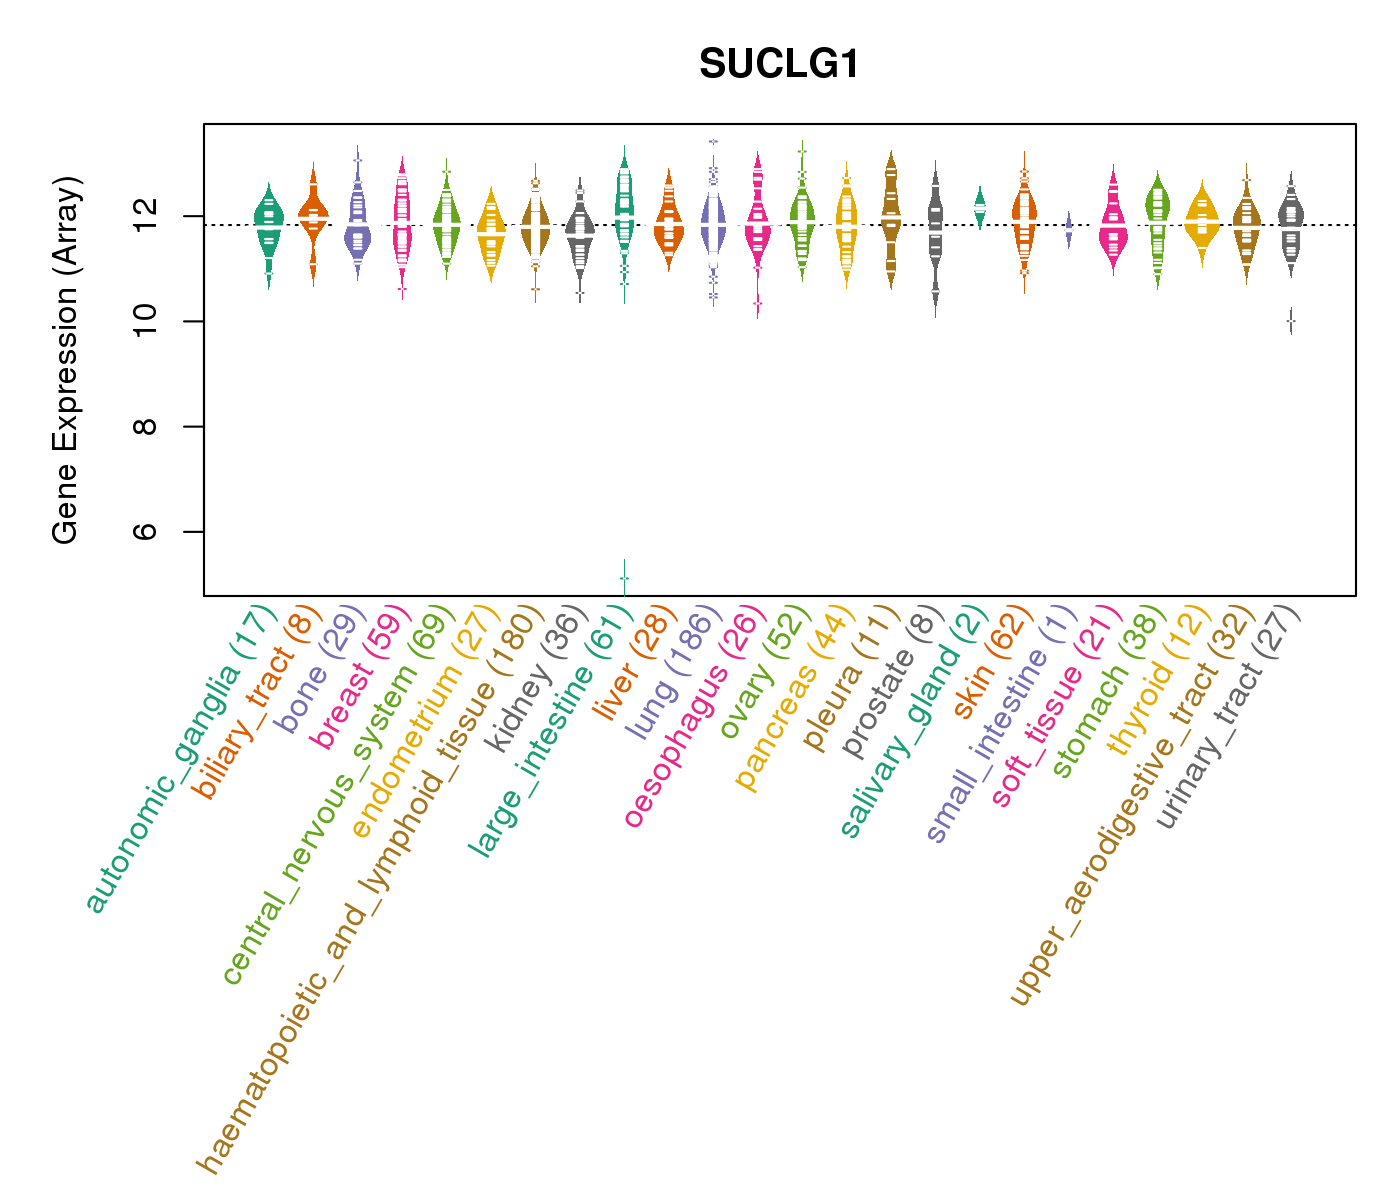 |
| * Normalized gene expression data of RNASeqV2 was extracted from TCGA using R package TCGA-Assembler. The URLs of all public data files on TCGA DCC data server were gathered at Jan-05-2015. Only eight cancer types have enough normal control samples for differential expression analysis. (t test, adjusted p<0.05 (using Benjamini-Hochberg FDR)) |
 |
| Top |
| * This plots show the correlation between CNV and gene expression. |
: Open all plots for all cancer types
 |
|
 |
|

| Top |
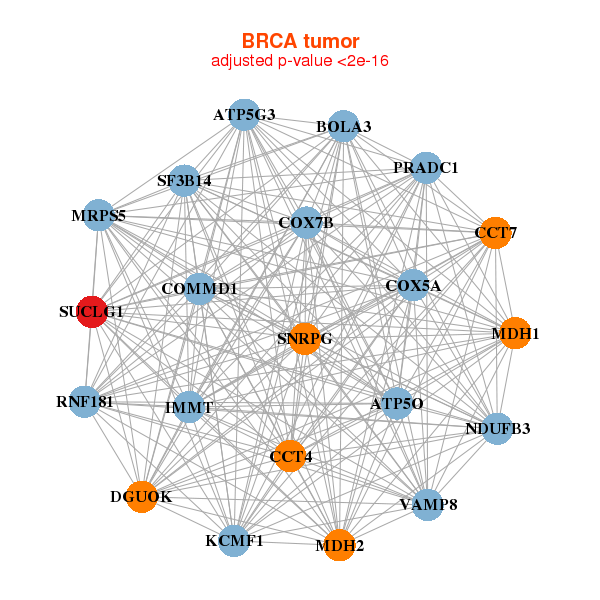
| Gene-Gene Network Information |
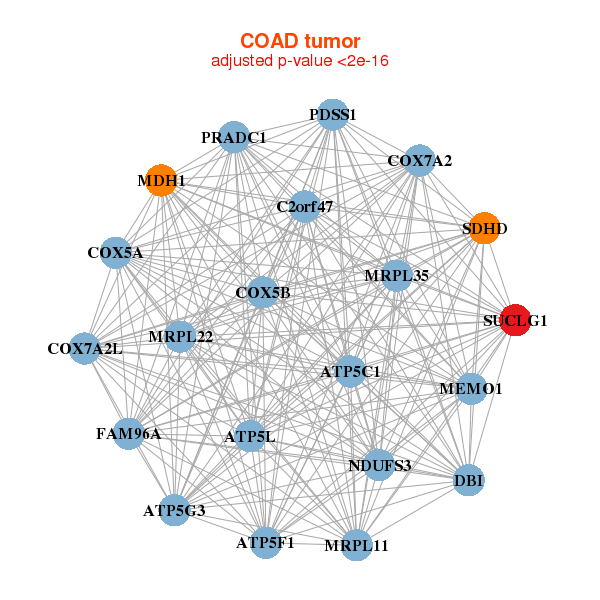
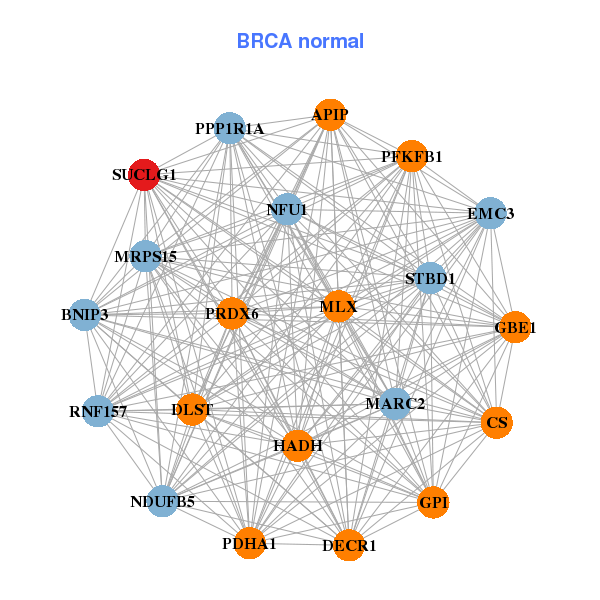
| * Co-Expression network figures were drawn using R package igraph. Only the top 20 genes with the highest correlations were shown. Red circle: input gene, orange circle: cell metabolism gene, sky circle: other gene |
: Open all plots for all cancer types
 |
| ||||
| ATP5G3,ATP5O,BOLA3,PRADC1,CCT4,CCT7,COMMD1, COX5A,COX7B,DGUOK,IMMT,KCMF1,MDH1,MDH2, MRPS5,NDUFB3,RNF181,SF3B14,SNRPG,SUCLG1,VAMP8 | APIP,BNIP3,CS,DECR1,DLST,GBE1,GPI, HADH,MLX,MARC2,MRPS15,NDUFB5,NFU1,PDHA1, PFKFB1,PPP1R1A,PRDX6,RNF157,STBD1,SUCLG1,EMC3 | ||||
 |
| ||||
| ATP5C1,ATP5F1,ATP5G3,ATP5L,C2orf47,PRADC1,COX5A, COX5B,COX7A2,COX7A2L,DBI,FAM96A,MDH1,MEMO1, MRPL11,MRPL22,MRPL35,NDUFS3,PDSS1,SDHD,SUCLG1 | AK2,ATP5C1,ATPIF1,MPC2,C2orf47,CENPV,CRYL1, FAM96A,GLOD4,IMP3,MGST2,MRPL48,MTCH2,NDUFC2, OXNAD1,RARS2,SAR1B,SDHAF2,SDHB,SUCLG1,TMEM106C |
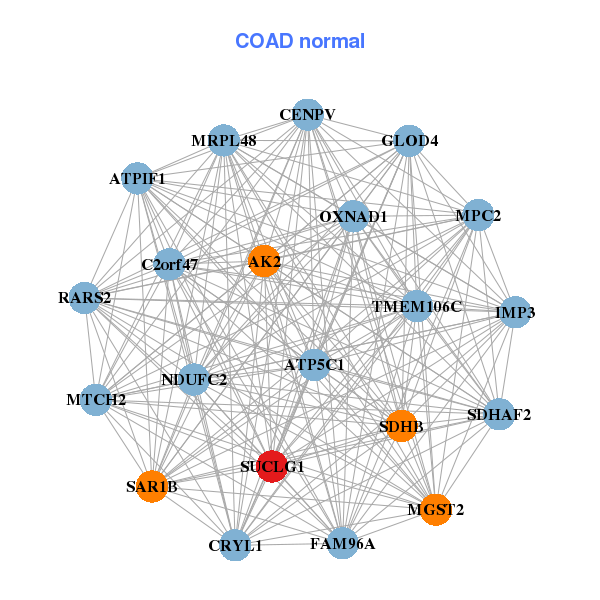
| * Co-Expression network figures were drawn using R package igraph. Only the top 20 genes with the highest correlations were shown. Red circle: input gene, orange circle: cell metabolism gene, sky circle: other gene |
: Open all plots for all cancer types
| Top |
: Open all interacting genes' information including KEGG pathway for all interacting genes from DAVID
| Top |
| Pharmacological Information for SUCLG1 |
| DB Category | DB Name | DB's ID and Url link |
| * Gene Centered Interaction Network. |
 |
| * Drug Centered Interaction Network. |
| DrugBank ID | Target Name | Drug Groups | Generic Name | Drug Centered Network | Drug Structure |
| DB00139 | succinate-CoA ligase, alpha subunit | approved; nutraceutical | Succinic acid | 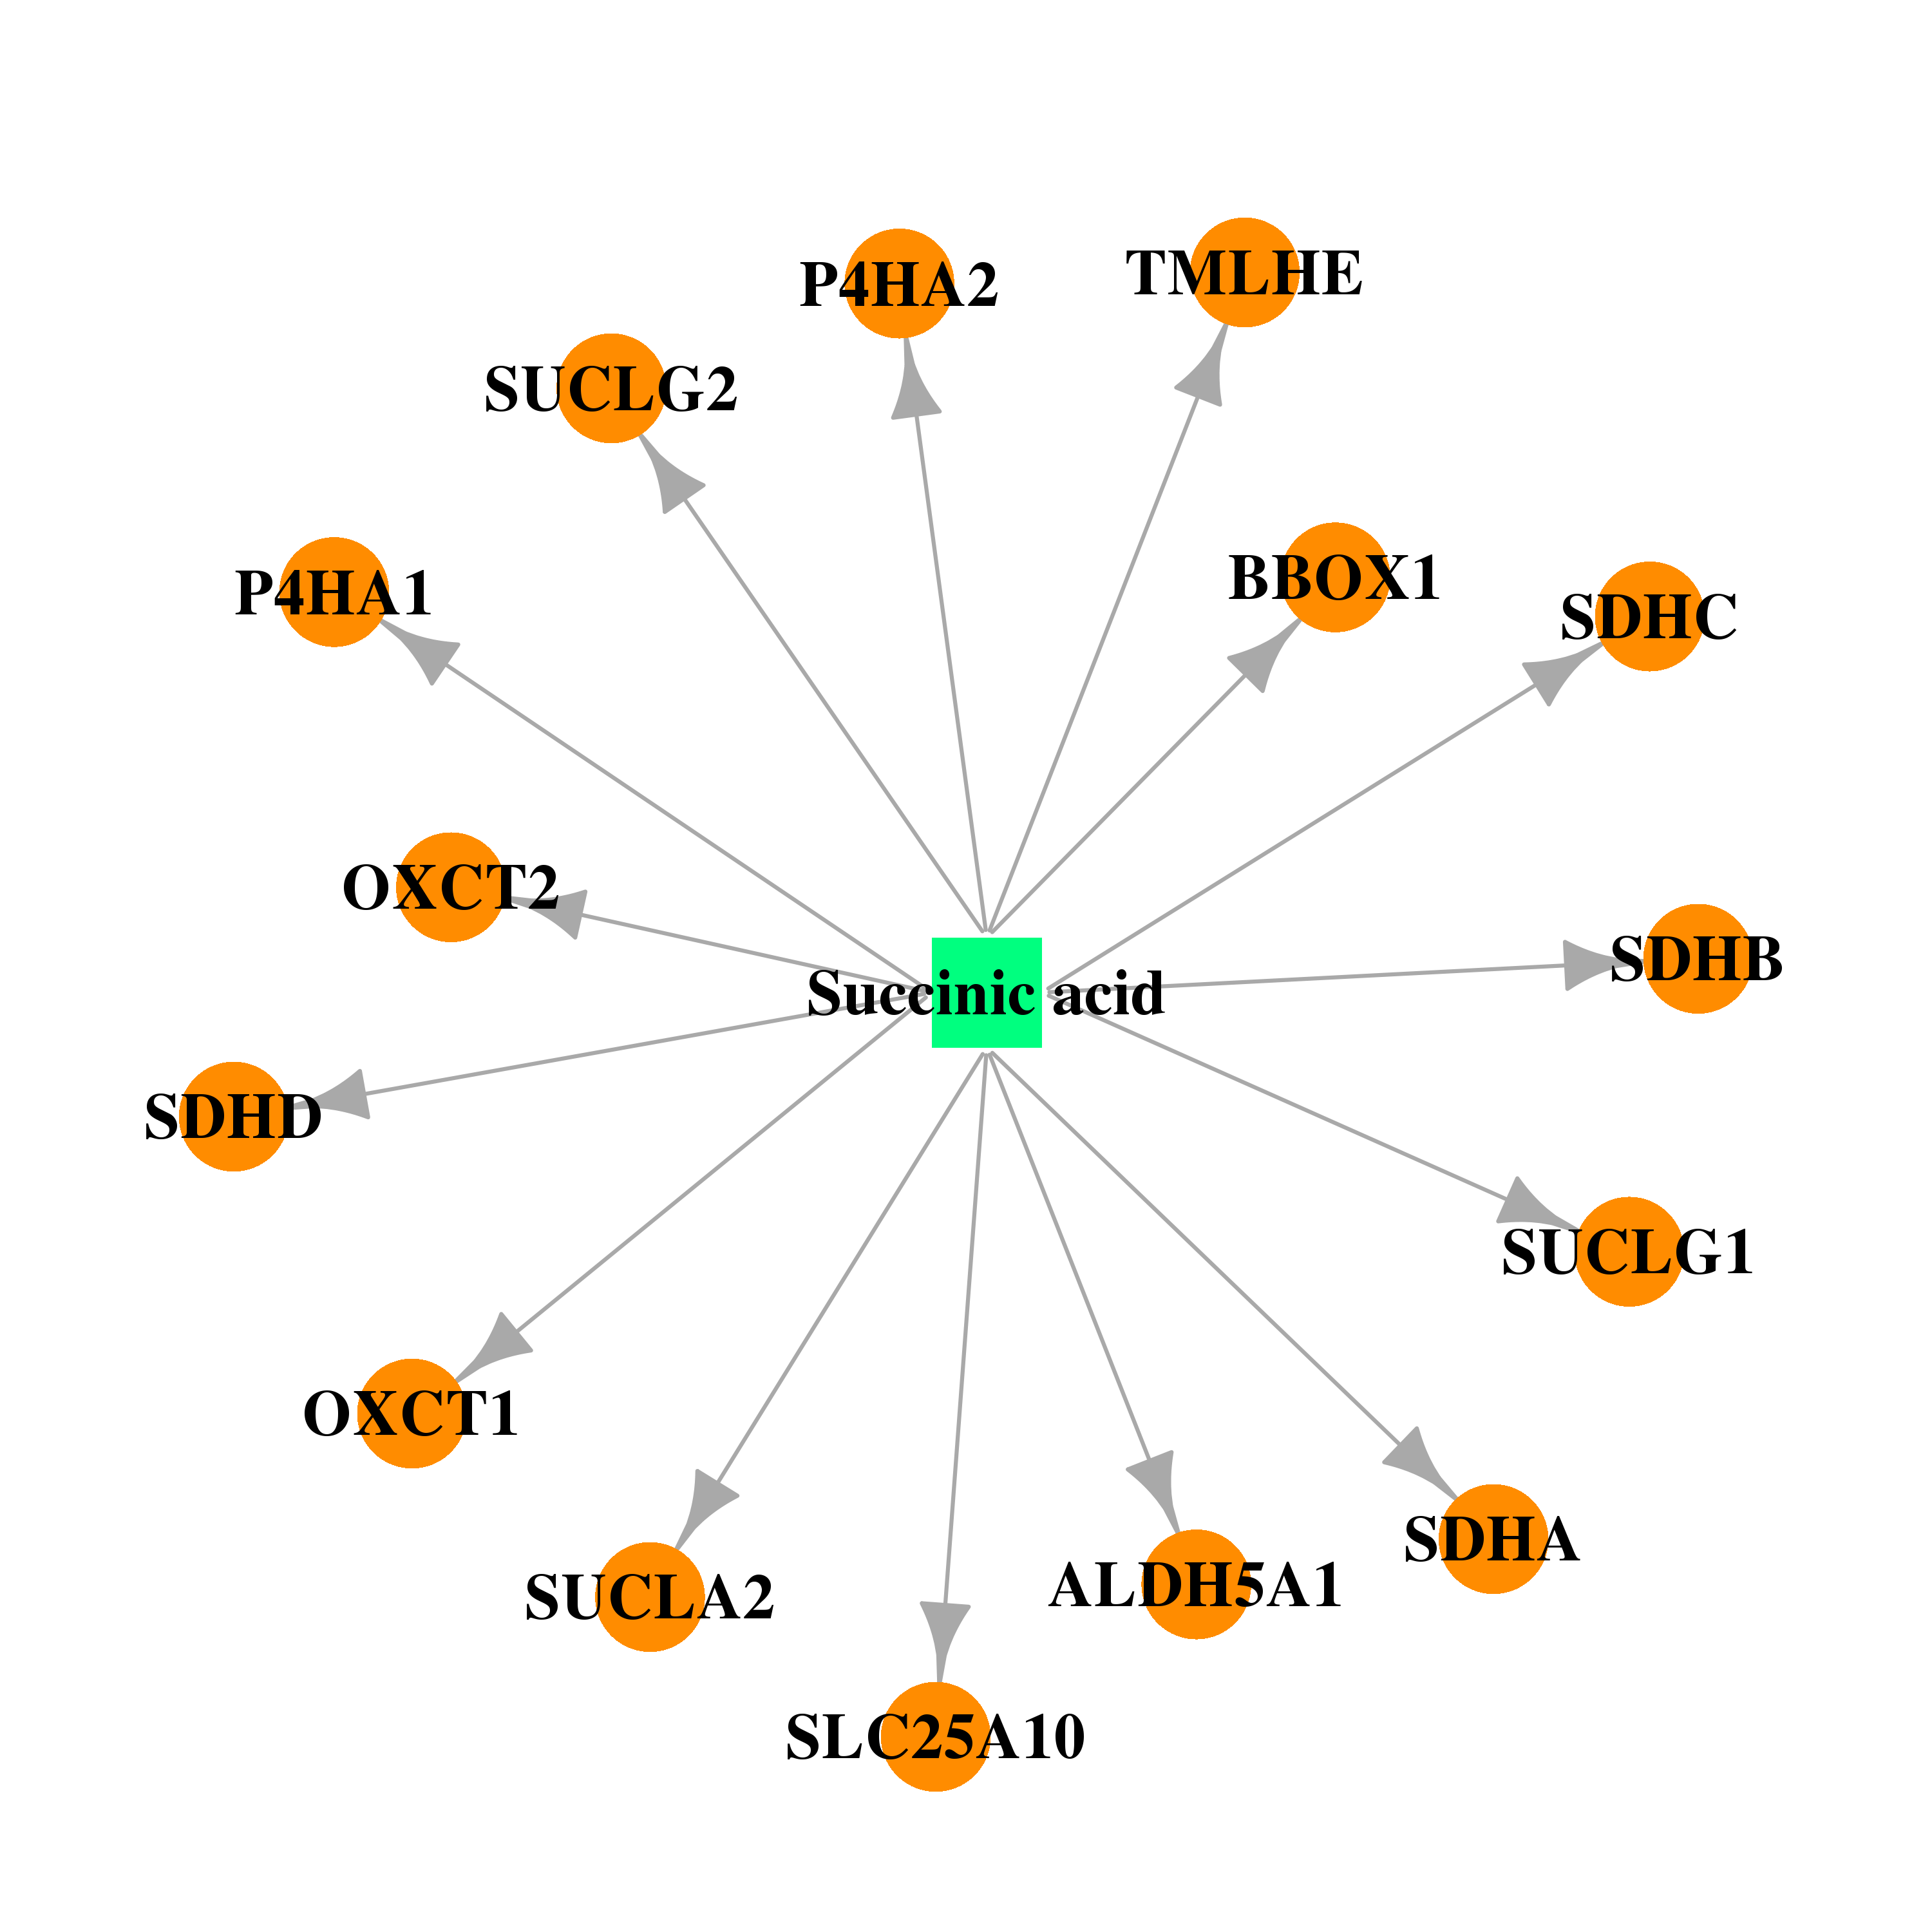 |  |
| Top |
| Cross referenced IDs for SUCLG1 |
| * We obtained these cross-references from Uniprot database. It covers 150 different DBs, 18 categories. http://www.uniprot.org/help/cross_references_section |
: Open all cross reference information
|
Copyright © 2016-Present - The Univsersity of Texas Health Science Center at Houston @ |