|
||||||||||||||||||||||||||||||||||||||||||||||||||||||||||||||||||||||||||||||||||||||||||||||||||||||||||||||||||||||||||||||||||||||||||||||||||||||||||||||||||||||||||||||||||||||||||||||||||||||||||||||||||||||||||||||||||||||||||||||||||||||||||||||||||||||||||||||||||||||||||||||||||||||||||||||||||||||||||||||||||||||||||||||||||||||||||||||||||||||||
| |
| Phenotypic Information (metabolism pathway, cancer, disease, phenome) |
| |
| |
| Gene-Gene Network Information: Co-Expression Network, Interacting Genes & KEGG |
| |
|


| Gene Summary for GMPS |
| Basic gene info. | Gene symbol | GMPS |
| Gene name | guanine monphosphate synthase | |
| Synonyms | - | |
| Cytomap | UCSC genome browser: 3q24 | |
| Genomic location | chr3 :155588324-155655520 | |
| Type of gene | protein-coding | |
| RefGenes | NM_003875.2, | |
| Ensembl id | ENSG00000163655 | |
| Description | GMP synthaseGMP synthase [glutamine-hydrolyzing]GMP synthetaseMLL/GMPS fusion proteinglutamine amidotransferaseguanine monphosphate synthetaseguanosine 5'-monophosphate synthase | |
| Modification date | 20141207 | |
| dbXrefs | MIM : 600358 | |
| HGNC : HGNC | ||
| Ensembl : ENSG00000163655 | ||
| HPRD : 10927 | ||
| Vega : OTTHUMG00000158551 | ||
| Protein | UniProt: P49915 go to UniProt's Cross Reference DB Table | |
| Expression | CleanEX: HS_GMPS | |
| BioGPS: 8833 | ||
| Gene Expression Atlas: ENSG00000163655 | ||
| The Human Protein Atlas: ENSG00000163655 | ||
| Pathway | NCI Pathway Interaction Database: GMPS | |
| KEGG: GMPS | ||
| REACTOME: GMPS | ||
| ConsensusPathDB | ||
| Pathway Commons: GMPS | ||
| Metabolism | MetaCyc: GMPS | |
| HUMANCyc: GMPS | ||
| Regulation | Ensembl's Regulation: ENSG00000163655 | |
| miRBase: chr3 :155,588,324-155,655,520 | ||
| TargetScan: NM_003875 | ||
| cisRED: ENSG00000163655 | ||
| Context | iHOP: GMPS | |
| cancer metabolism search in PubMed: GMPS | ||
| UCL Cancer Institute: GMPS | ||
| Assigned class in ccmGDB | B - This gene belongs to cancer gene. | |
| Top |
| Phenotypic Information for GMPS(metabolism pathway, cancer, disease, phenome) |
| Cancer | CGAP: GMPS |
| Familial Cancer Database: GMPS | |
| * This gene is included in those cancer gene databases. |
|
|
|
|
|
| . | ||||||||||||||||||||||||||||||||||||||||||||||||||||||||||||||||||||||||||||||||||||||||||||||||||||||||||||||||||||||||||||||||||||||||||||||||||||||||||||||||||||||||||||||||||||||||||||||||||||||||||||||||||||||||||||||||||||||||||||||||||||||||||||||||||||||||||||||||||||||||||||||||||||||||||||||||||||||||||||||||||||||||||||||||||||||||||||||||||
Oncogene 1 | Significant driver gene in | |||||||||||||||||||||||||||||||||||||||||||||||||||||||||||||||||||||||||||||||||||||||||||||||||||||||||||||||||||||||||||||||||||||||||||||||||||||||||||||||||||||||||||||||||||||||||||||||||||||||||||||||||||||||||||||||||||||||||||||||||||||||||||||||||||||||||||||||||||||||||||||||||||||||||||||||||||||||||||||||||||||||||||||||||||||||||||||||||||||||
| cf) number; DB name 1 Oncogene; http://nar.oxfordjournals.org/content/35/suppl_1/D721.long, 2 Tumor Suppressor gene; https://bioinfo.uth.edu/TSGene/, 3 Cancer Gene Census; http://www.nature.com/nrc/journal/v4/n3/abs/nrc1299.html, 4 CancerGenes; http://nar.oxfordjournals.org/content/35/suppl_1/D721.long, 5 Network of Cancer Gene; http://ncg.kcl.ac.uk/index.php, 1Therapeutic Vulnerabilities in Cancer; http://cbio.mskcc.org/cancergenomics/statius/ |
| KEGG_PURINE_METABOLISM KEGG_DRUG_METABOLISM_OTHER_ENZYMES REACTOME_METABOLISM_OF_NUCLEOTIDES REACTOME_PURINE_METABOLISM | |
| OMIM | 600358; gene. |
| Orphanet | |
| Disease | KEGG Disease: GMPS |
| MedGen: GMPS (Human Medical Genetics with Condition) | |
| ClinVar: GMPS | |
| Phenotype | MGI: GMPS (International Mouse Phenotyping Consortium) |
| PhenomicDB: GMPS | |
| Mutations for GMPS |
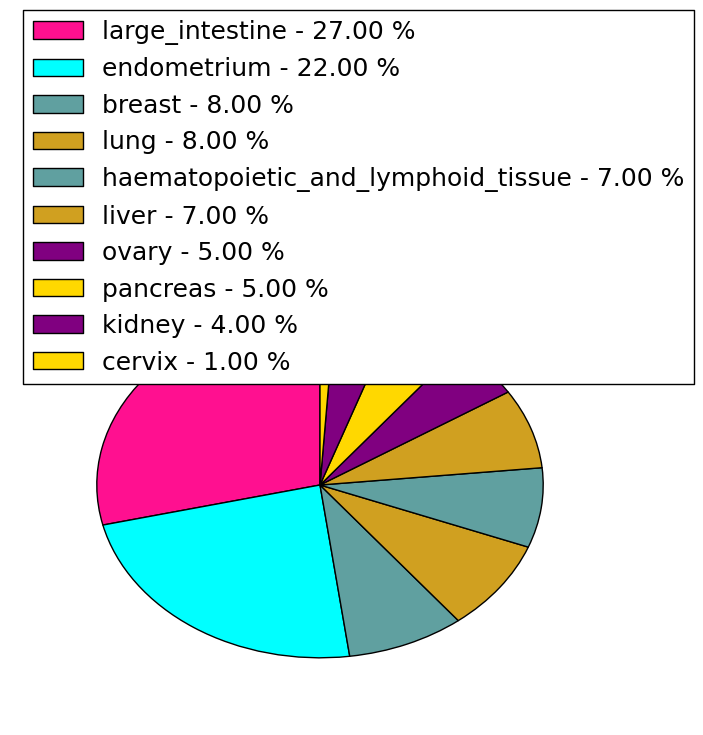
| * Under tables are showing count per each tissue to give us broad intuition about tissue specific mutation patterns.You can go to the detailed page for each mutation database's web site. |
| - Statistics for Tissue and Mutation type | Top |
 |
| - For Inter-chromosomal Variations |
| * Inter-chromosomal variantions includes 'interchromosomal amplicon to amplicon', 'interchromosomal amplicon to non-amplified dna', 'interchromosomal insertion', 'Interchromosomal unknown type'. |
 |
| - For Intra-chromosomal Variations |
| * Intra-chromosomal variantions includes 'intrachromosomal amplicon to amplicon', 'intrachromosomal amplicon to non-amplified dna', 'intrachromosomal deletion', 'intrachromosomal fold-back inversion', 'intrachromosomal inversion', 'intrachromosomal tandem duplication', 'Intrachromosomal unknown type', 'intrachromosomal with inverted orientation', 'intrachromosomal with non-inverted orientation'. |
 |
| Sample | Symbol_a | Chr_a | Start_a | End_a | Symbol_b | Chr_b | Start_b | End_b |
| ovary | GMPS | chr3 | 155642643 | 155642663 | GMPS | chr3 | 155642549 | 155642569 |
| ovary | GMPS | chr3 | 155649791 | 155649811 | GMPS | chr3 | 155650012 | 155650032 |
| cf) Tissue number; Tissue name (1;Breast, 2;Central_nervous_system, 3;Haematopoietic_and_lymphoid_tissue, 4;Large_intestine, 5;Liver, 6;Lung, 7;Ovary, 8;Pancreas, 9;Prostate, 10;Skin, 11;Soft_tissue, 12;Upper_aerodigestive_tract) |
| * From mRNA Sanger sequences, Chitars2.0 arranged chimeric transcripts. This table shows GMPS related fusion information. |
| ID | Head Gene | Tail Gene | Accession | Gene_a | qStart_a | qEnd_a | Chromosome_a | tStart_a | tEnd_a | Gene_a | qStart_a | qEnd_a | Chromosome_a | tStart_a | tEnd_a |
| AF297747 | MLL | 2 | 426 | 11 | 118352703 | 118355690 | GMPS | 425 | 1586 | 3 | 155611305 | 155633956 | |
| AF297748 | MLL | 1 | 171 | 11 | 118353172 | 118355029 | GMPS | 170 | 353 | 3 | 155611305 | 155611488 | |
| AF297746 | MLL | 2 | 312 | 11 | 118352703 | 118355029 | GMPS | 311 | 658 | 3 | 155611305 | 155621700 | |
| AF297749 | MLL | 1 | 285 | 11 | 118353172 | 118355690 | GMPS | 284 | 467 | 3 | 155611305 | 155611488 | |
| AU132130 | CCDC141 | 1 | 512 | 2 | 179912011 | 179916447 | GMPS | 511 | 694 | 3 | 155611305 | 155611489 | |
| Top |
| Mutation type/ Tissue ID | brca | cns | cerv | endome | haematopo | kidn | Lintest | liver | lung | ns | ovary | pancre | prost | skin | stoma | thyro | urina | |||
| Total # sample | 1 | 1 | ||||||||||||||||||
| GAIN (# sample) | 1 | 1 | ||||||||||||||||||
| LOSS (# sample) |
| cf) Tissue ID; Tissue type (1; Breast, 2; Central_nervous_system, 3; Cervix, 4; Endometrium, 5; Haematopoietic_and_lymphoid_tissue, 6; Kidney, 7; Large_intestine, 8; Liver, 9; Lung, 10; NS, 11; Ovary, 12; Pancreas, 13; Prostate, 14; Skin, 15; Stomach, 16; Thyroid, 17; Urinary_tract) |
| Top |
|
 |
| Top |
| Stat. for Non-Synonymous SNVs (# total SNVs=68) | (# total SNVs=12) |
 |  |
(# total SNVs=2) | (# total SNVs=0) |
 |
| Top |
| * When you move the cursor on each content, you can see more deailed mutation information on the Tooltip. Those are primary_site,primary_histology,mutation(aa),pubmedID. |
| GRCh37 position | Mutation(aa) | Unique sampleID count |
| chr3:155628496-155628496 | p.S181F | 3 |
| chr3:155628985-155628985 | p.V268A | 3 |
| chr3:155652794-155652794 | p.R589H | 3 |
| chr3:155652730-155652730 | p.V568I | 2 |
| chr3:155652736-155652736 | p.E570* | 2 |
| chr3:155655429-155655429 | p.R677Q | 2 |
| chr3:155621691-155621691 | p.S122G | 2 |
| chr3:155639983-155639983 | p.G442G | 2 |
| chr3:155654194-155654194 | p.L625L | 2 |
| chr3:155654195-155654195 | p.Q626* | 2 |
| Top |
|
 |
| Point Mutation/ Tissue ID | 1 | 2 | 3 | 4 | 5 | 6 | 7 | 8 | 9 | 10 | 11 | 12 | 13 | 14 | 15 | 16 | 17 | 18 | 19 | 20 |
| # sample | 3 | 2 | 1 | 16 | 3 | 1 | 10 | 1 | 2 | 5 | 4 | 1 | 10 | |||||||
| # mutation | 3 | 2 | 1 | 15 | 3 | 1 | 11 | 1 | 2 | 6 | 4 | 1 | 12 | |||||||
| nonsynonymous SNV | 2 | 2 | 1 | 13 | 3 | 1 | 9 | 1 | 6 | 3 | 1 | 11 | ||||||||
| synonymous SNV | 1 | 2 | 2 | 1 | 1 | 1 | 1 |
| cf) Tissue ID; Tissue type (1; BLCA[Bladder Urothelial Carcinoma], 2; BRCA[Breast invasive carcinoma], 3; CESC[Cervical squamous cell carcinoma and endocervical adenocarcinoma], 4; COAD[Colon adenocarcinoma], 5; GBM[Glioblastoma multiforme], 6; Glioma Low Grade, 7; HNSC[Head and Neck squamous cell carcinoma], 8; KICH[Kidney Chromophobe], 9; KIRC[Kidney renal clear cell carcinoma], 10; KIRP[Kidney renal papillary cell carcinoma], 11; LAML[Acute Myeloid Leukemia], 12; LUAD[Lung adenocarcinoma], 13; LUSC[Lung squamous cell carcinoma], 14; OV[Ovarian serous cystadenocarcinoma ], 15; PAAD[Pancreatic adenocarcinoma], 16; PRAD[Prostate adenocarcinoma], 17; SKCM[Skin Cutaneous Melanoma], 18:STAD[Stomach adenocarcinoma], 19:THCA[Thyroid carcinoma], 20:UCEC[Uterine Corpus Endometrial Carcinoma]) |
| Top |
| * We represented just top 10 SNVs. When you move the cursor on each content, you can see more deailed mutation information on the Tooltip. Those are primary_site, primary_histology, mutation(aa), pubmedID. |
| Genomic Position | Mutation(aa) | Unique sampleID count |
| chr3:155652794 | p.V268A | 3 |
| chr3:155628985 | p.R589H | 3 |
| chr3:155655458 | p.P687T | 2 |
| chr3:155624029 | p.S237P | 1 |
| chr3:155649612 | p.H391H | 1 |
| chr3:155632226 | p.A595P | 1 |
| chr3:155655416 | p.L48Q | 1 |
| chr3:155633963 | p.Q264R | 1 |
| chr3:155611427 | p.I398I | 1 |
| chr3:155628494 | p.P612P | 1 |
| * Copy number data were extracted from TCGA using R package TCGA-Assembler. The URLs of all public data files on TCGA DCC data server were gathered on Jan-05-2015. Function ProcessCNAData in TCGA-Assembler package was used to obtain gene-level copy number value which is calculated as the average copy number of the genomic region of a gene. |
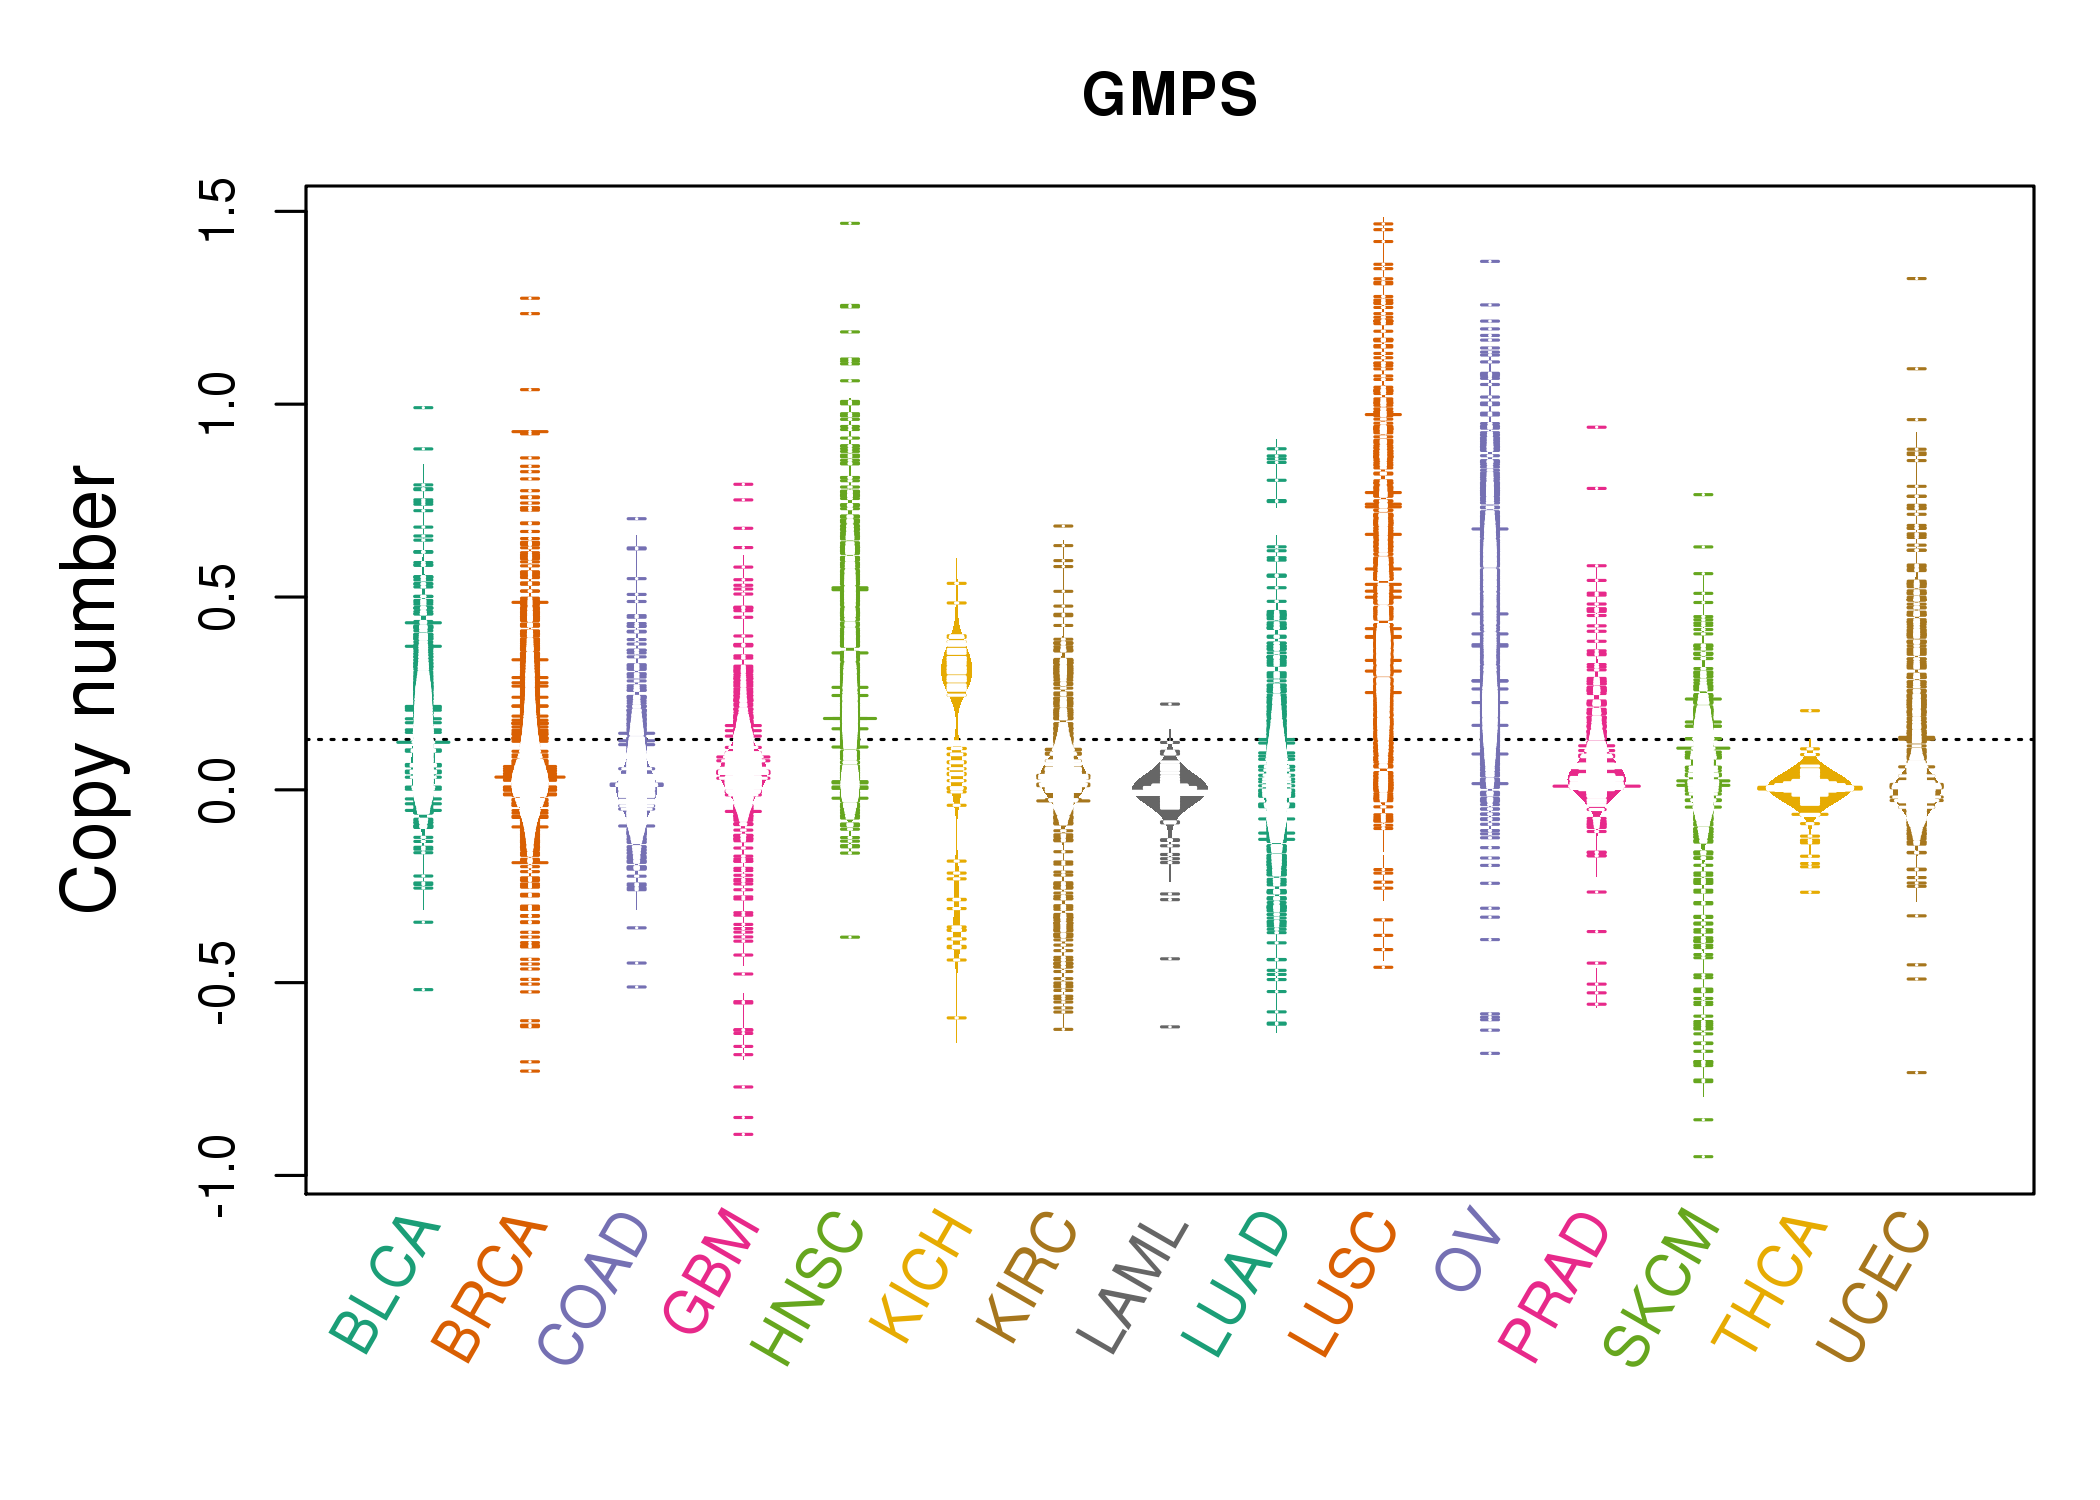 |
| cf) Tissue ID[Tissue type]: BLCA[Bladder Urothelial Carcinoma], BRCA[Breast invasive carcinoma], CESC[Cervical squamous cell carcinoma and endocervical adenocarcinoma], COAD[Colon adenocarcinoma], GBM[Glioblastoma multiforme], Glioma Low Grade, HNSC[Head and Neck squamous cell carcinoma], KICH[Kidney Chromophobe], KIRC[Kidney renal clear cell carcinoma], KIRP[Kidney renal papillary cell carcinoma], LAML[Acute Myeloid Leukemia], LUAD[Lung adenocarcinoma], LUSC[Lung squamous cell carcinoma], OV[Ovarian serous cystadenocarcinoma ], PAAD[Pancreatic adenocarcinoma], PRAD[Prostate adenocarcinoma], SKCM[Skin Cutaneous Melanoma], STAD[Stomach adenocarcinoma], THCA[Thyroid carcinoma], UCEC[Uterine Corpus Endometrial Carcinoma] |
| Top |
| Gene Expression for GMPS |
| * CCLE gene expression data were extracted from CCLE_Expression_Entrez_2012-10-18.res: Gene-centric RMA-normalized mRNA expression data. |
 |
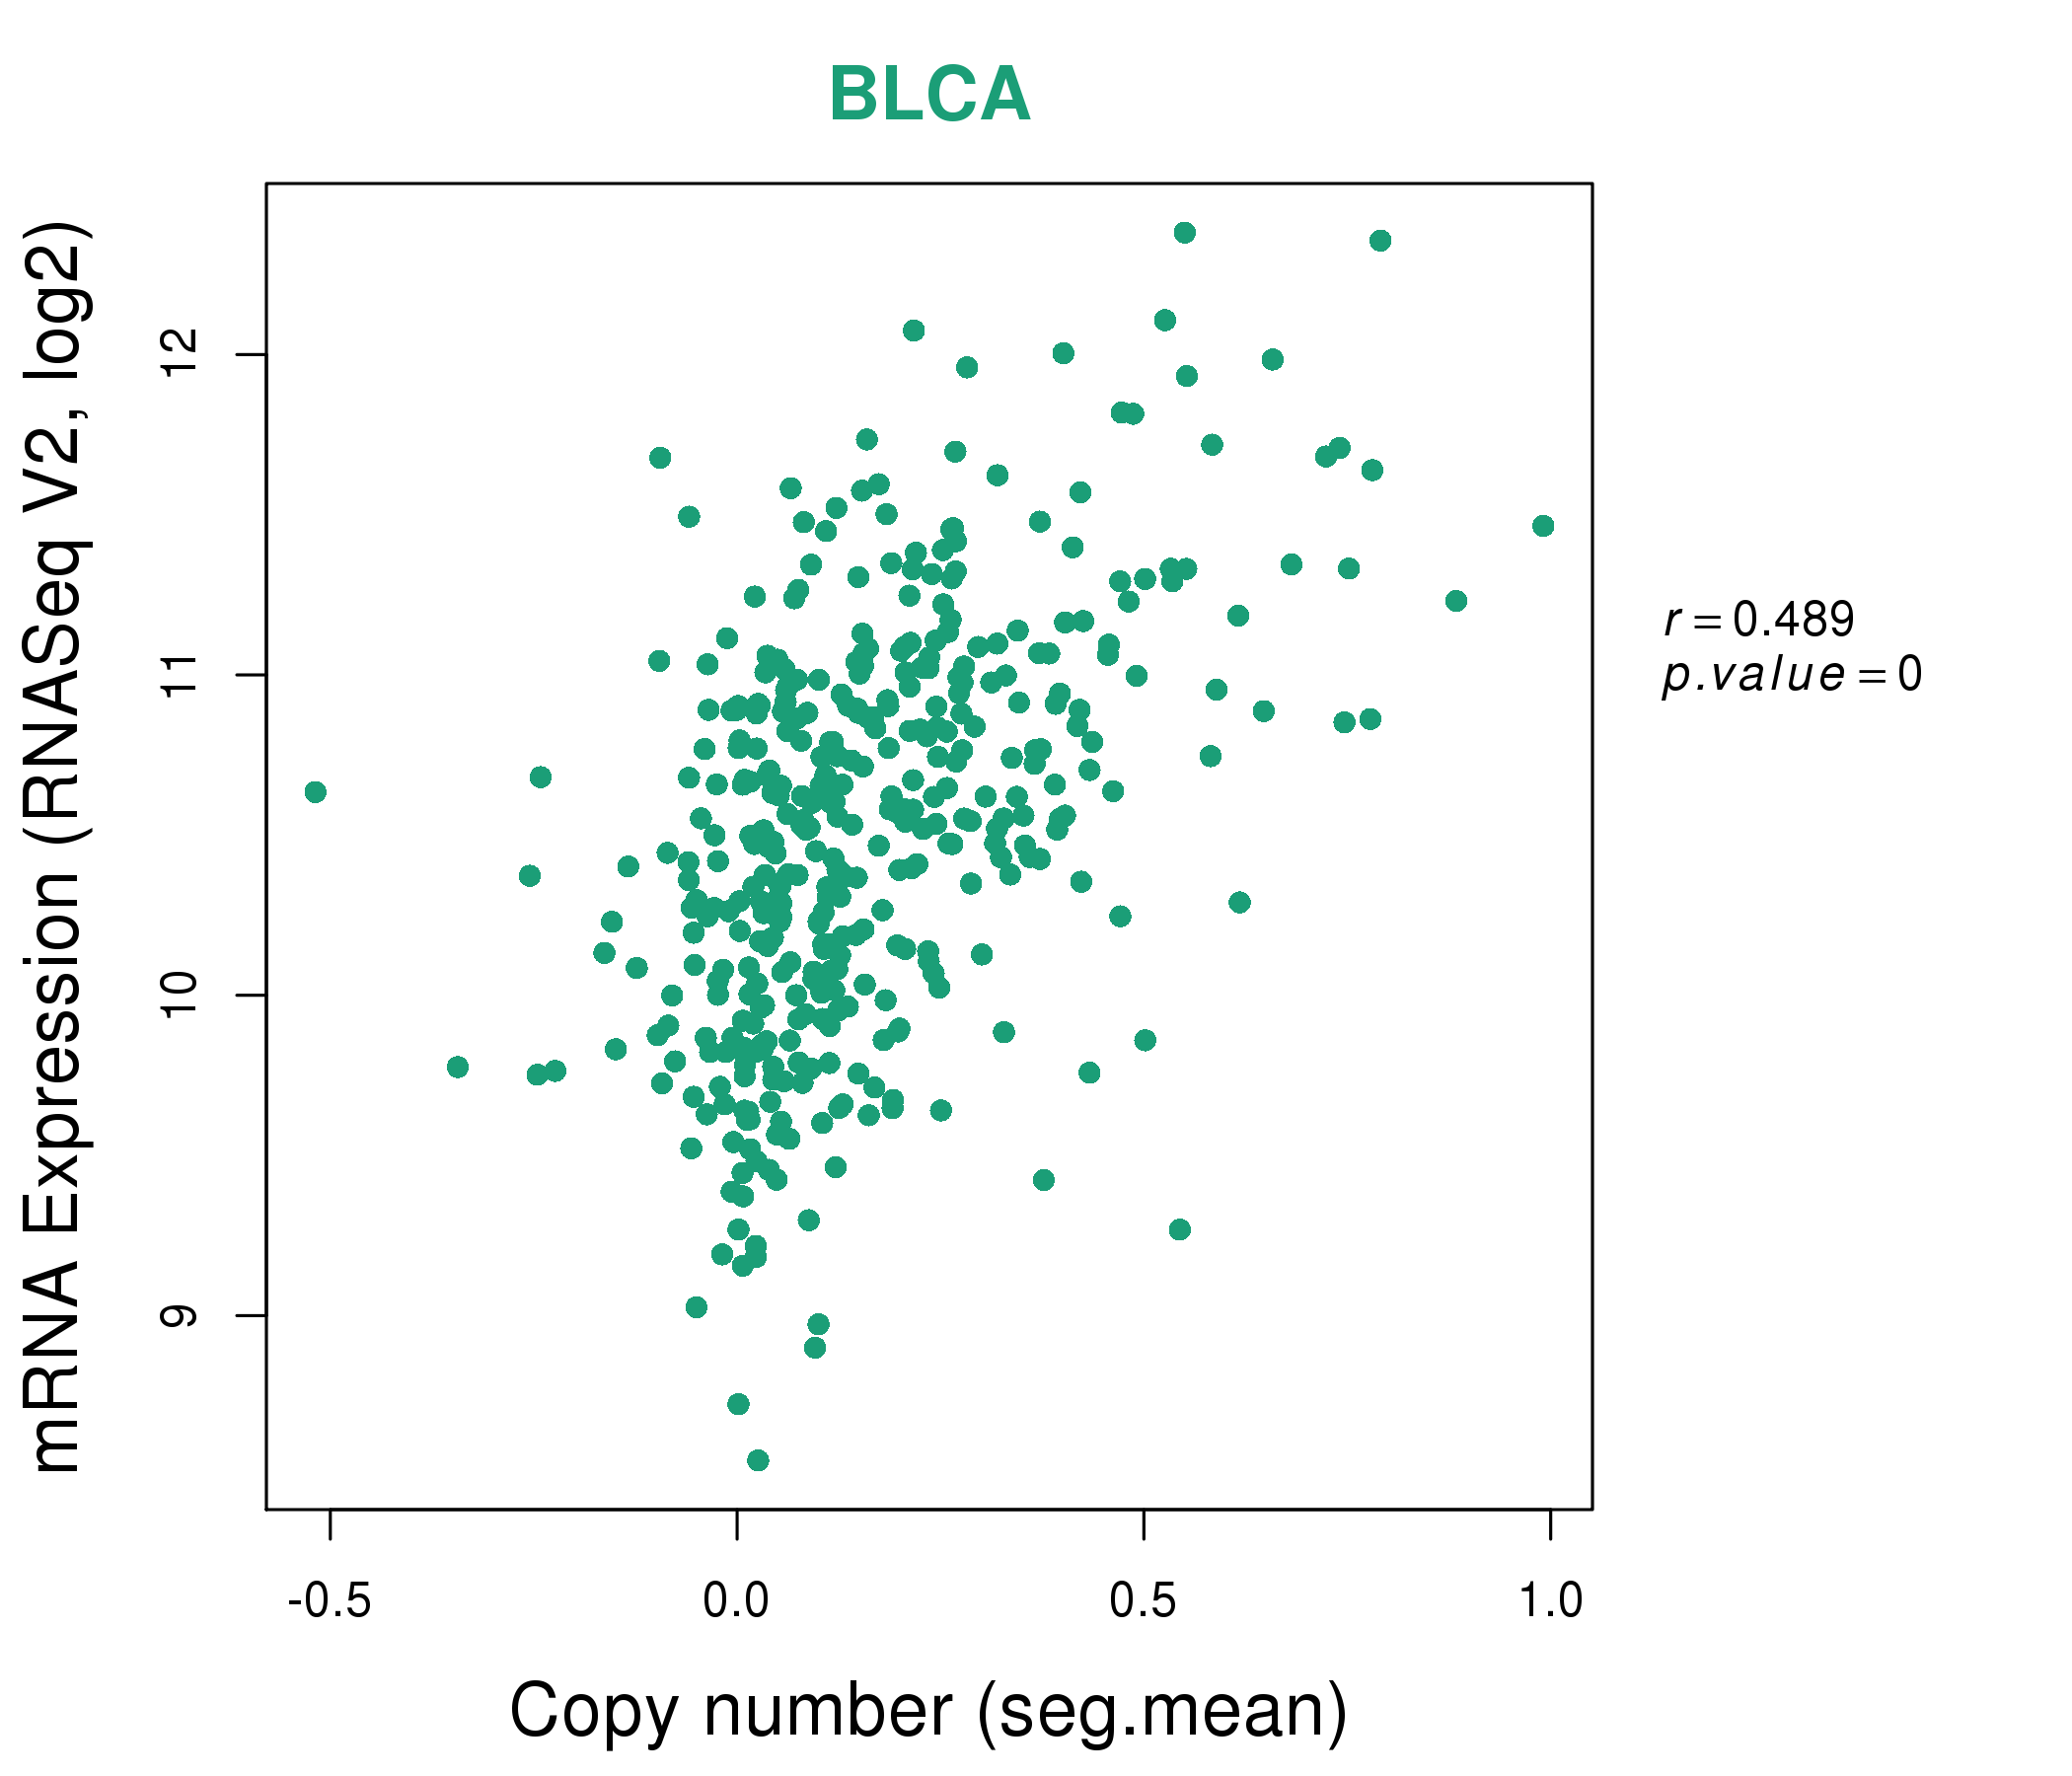
| * Normalized gene expression data of RNASeqV2 was extracted from TCGA using R package TCGA-Assembler. The URLs of all public data files on TCGA DCC data server were gathered at Jan-05-2015. Only eight cancer types have enough normal control samples for differential expression analysis. (t test, adjusted p<0.05 (using Benjamini-Hochberg FDR)) |
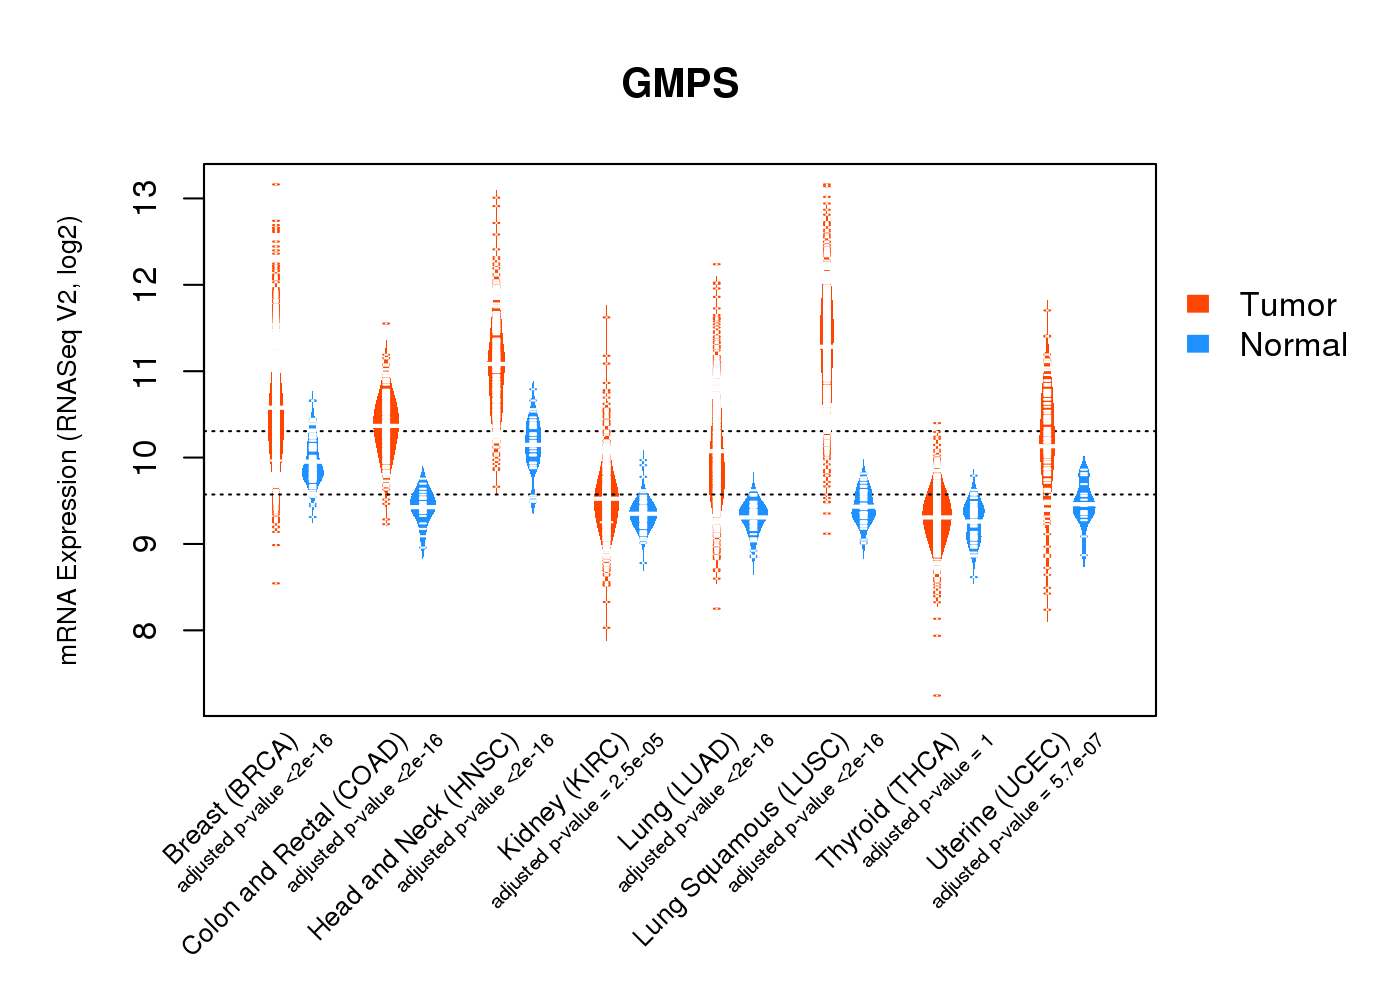 |
| Top |
| * This plots show the correlation between CNV and gene expression. |
: Open all plots for all cancer types
 |
|
 |
|


| Top |
| Gene-Gene Network Information |
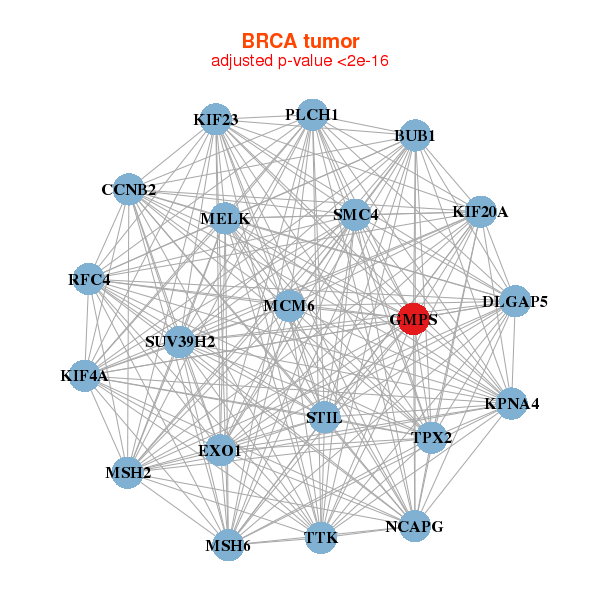
| * Co-Expression network figures were drawn using R package igraph. Only the top 20 genes with the highest correlations were shown. Red circle: input gene, orange circle: cell metabolism gene, sky circle: other gene |
: Open all plots for all cancer types
 |
| ||||
| BUB1,CCNB2,DLGAP5,EXO1,GMPS,KIF20A,KIF23, KIF4A,KPNA4,MCM6,MELK,MSH2,MSH6,NCAPG, PLCH1,RFC4,SMC4,STIL,SUV39H2,TPX2,TTK | CCDC138,DSC2,FAM60A,GMPS,HDAC2,LARS,LRRC8D, MSH2,MSH6,PAICS,PPAT,SEC23B,SET,SLC25A13, SRP72,SRPK1,STIL,TDP1,TEX10,TMEM97,ZNF146 | ||||
 |
| ||||
| ACTL6A,CMSS1,CHEK1,ECT2,FBXO45,GMPS,KIAA1524, MCM2,MRPL3,NAA50,NCAPH,POLQ,PRIM2,RFC4, RSRC1,RUVBL1,SMC4,TOPBP1,TRA2B,TTK,UMPS | CCT3,CCT6A,CHEK1,CSE1L,FAM98A,GMPS,HSPD1, IARS,IPO11,MCM6,NAA15,NOL10,PA2G4,PA2G4P4, PAICS,RUVBL1,SERBP1,SET,STIP1,USP1,ZW10 |


| * Co-Expression network figures were drawn using R package igraph. Only the top 20 genes with the highest correlations were shown. Red circle: input gene, orange circle: cell metabolism gene, sky circle: other gene |
: Open all plots for all cancer types
| Top |
: Open all interacting genes' information including KEGG pathway for all interacting genes from DAVID
| Top |
| Pharmacological Information for GMPS |
| DB Category | DB Name | DB's ID and Url link |
| Chemistry | ChEMBL | CHEMBL5721; -. |
| Organism-specific databases | PharmGKB | PA28763; -. |
| Organism-specific databases | CTD | 8833; -. |
| * Gene Centered Interaction Network. |
 |
| * Drug Centered Interaction Network. |
| DrugBank ID | Target Name | Drug Groups | Generic Name | Drug Centered Network | Drug Structure |
| DB00142 | guanine monphosphate synthase | approved; nutraceutical | L-Glutamic Acid | 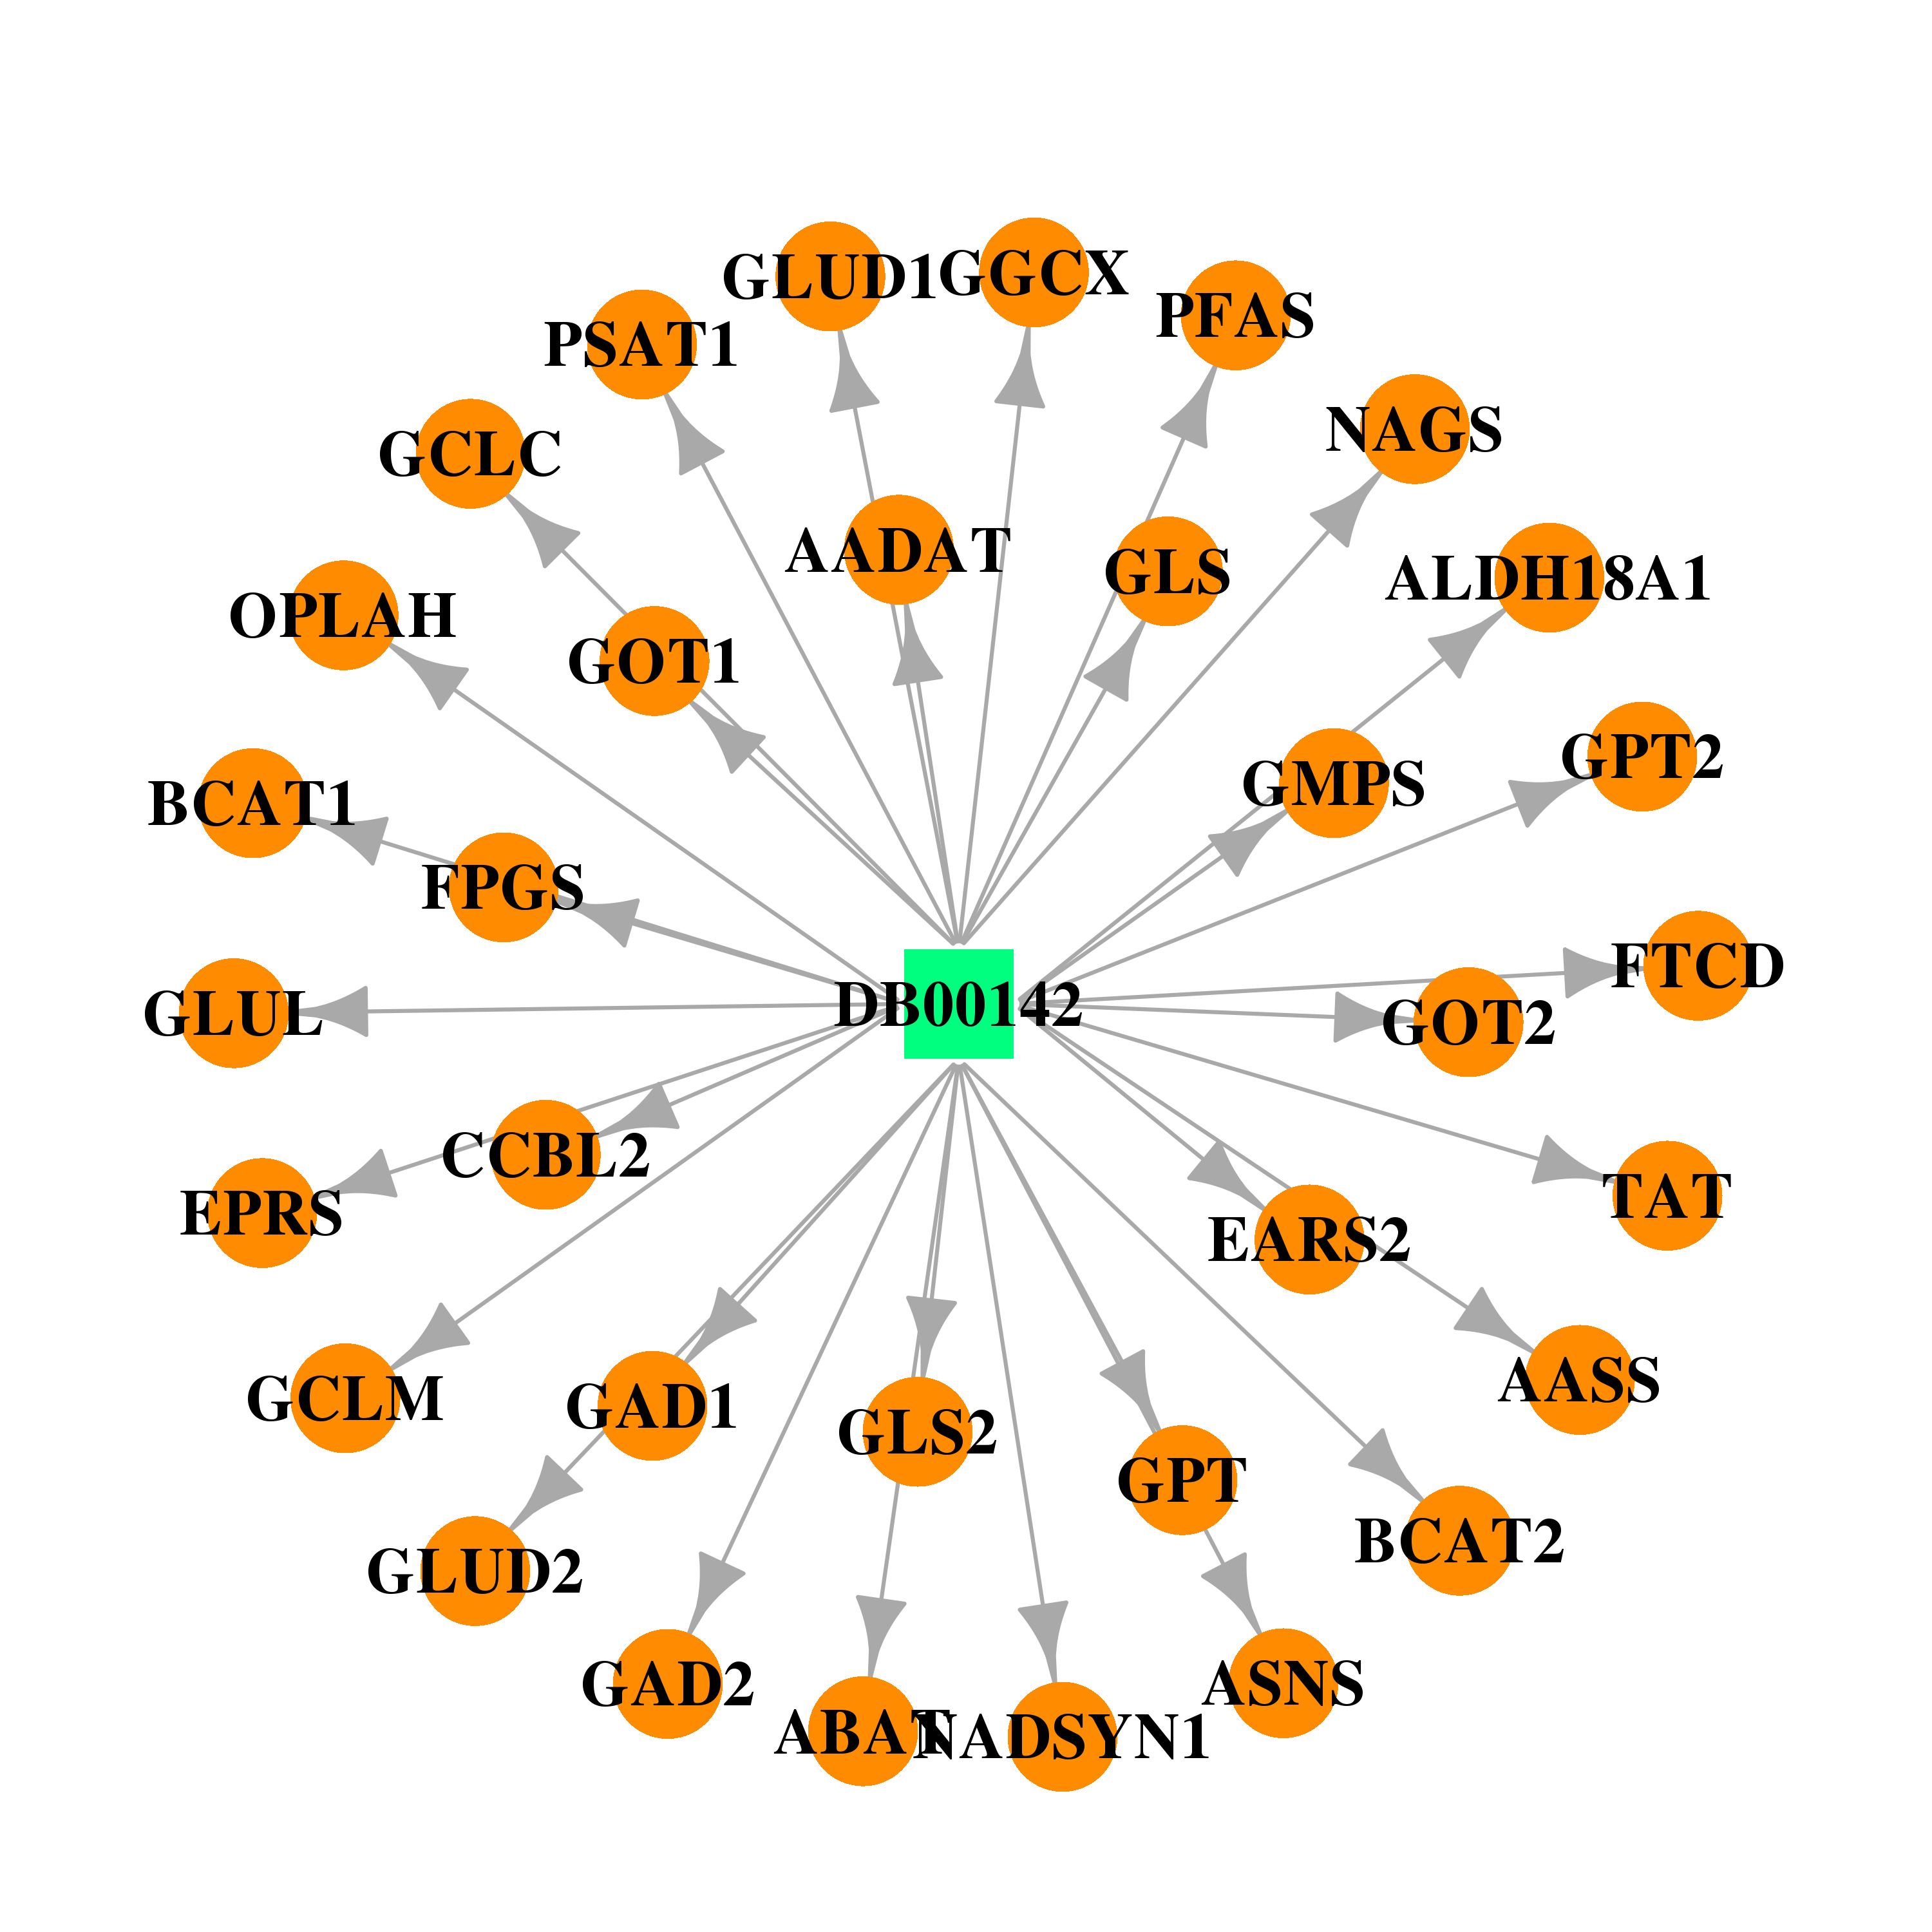 | 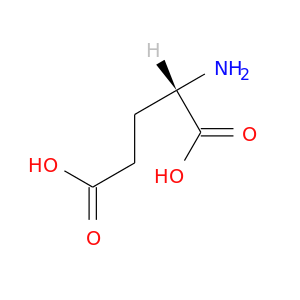 |
| DB02212 | guanine monphosphate synthase | experimental | Pyrophosphate 2- | 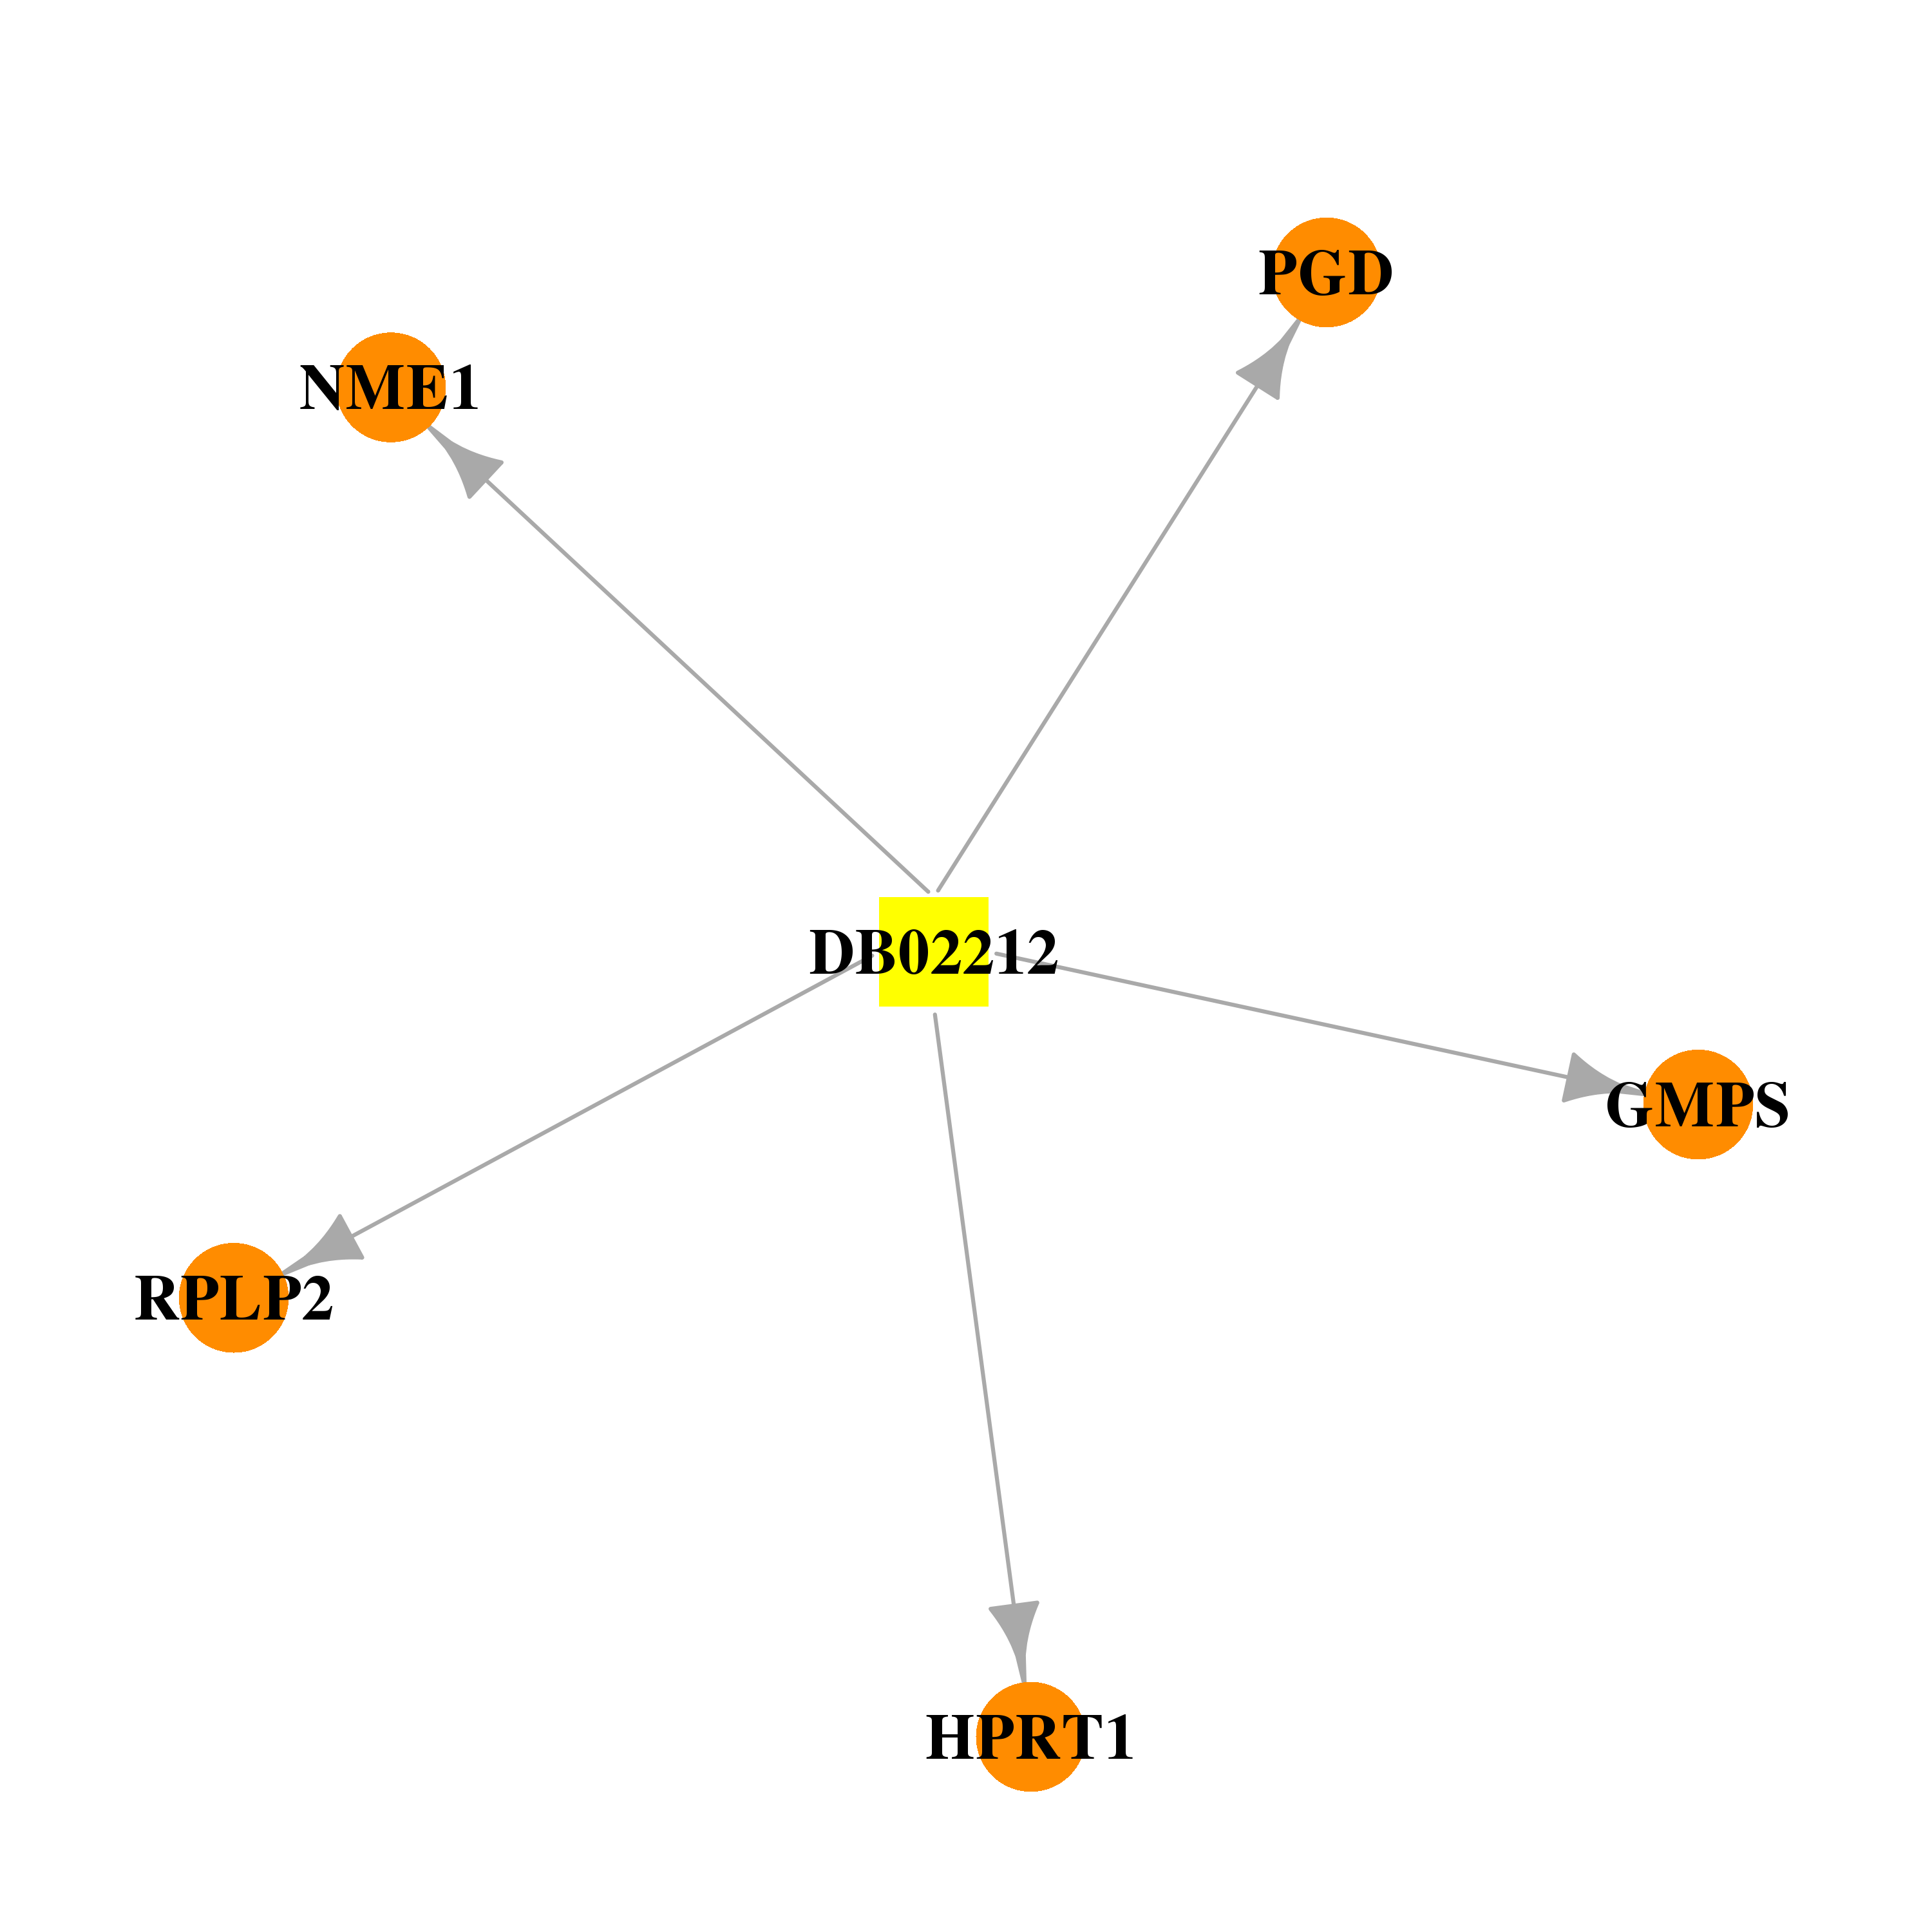 | 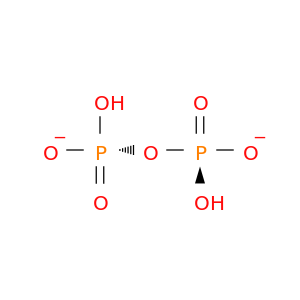 |
| DB04272 | guanine monphosphate synthase | experimental | Citric Acid | 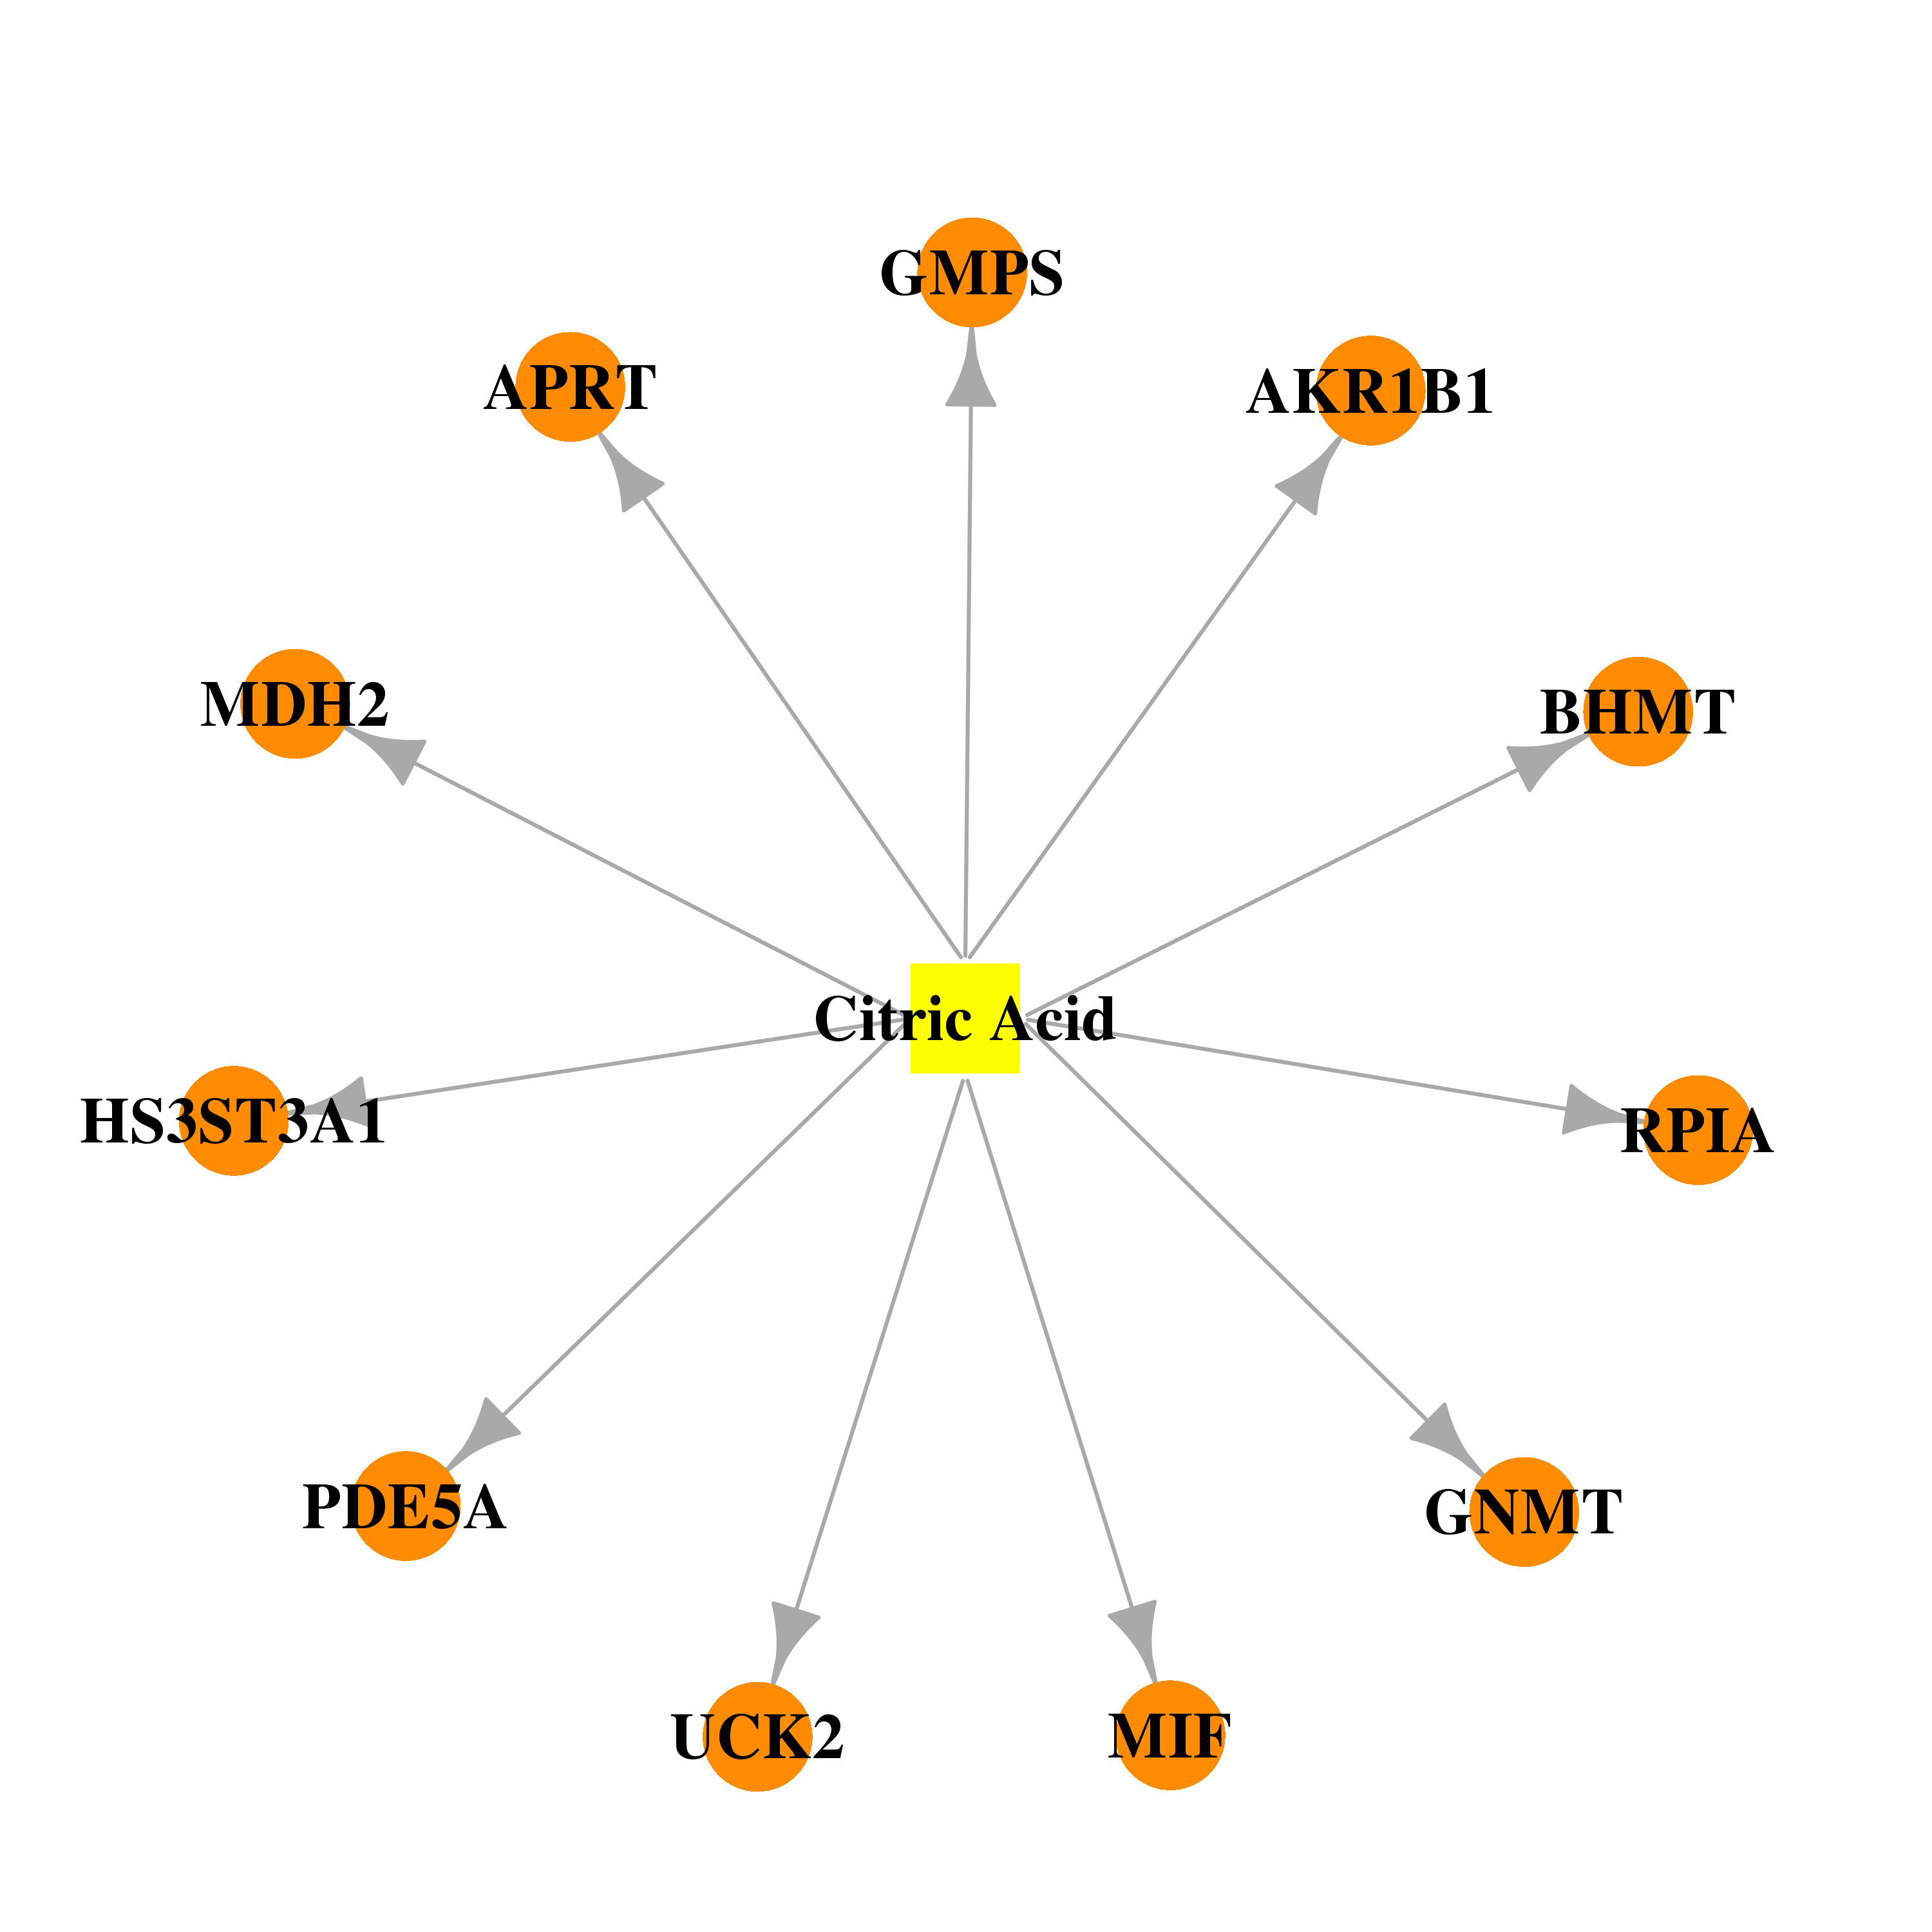 | 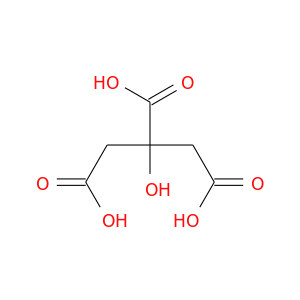 |
| DB00130 | guanine monphosphate synthase | approved; nutraceutical; investigational | L-Glutamine |  |  |
| Top |
| Cross referenced IDs for GMPS |
| * We obtained these cross-references from Uniprot database. It covers 150 different DBs, 18 categories. http://www.uniprot.org/help/cross_references_section |
: Open all cross reference information
|
Copyright © 2016-Present - The Univsersity of Texas Health Science Center at Houston @ |