|
||||||||||||||||||||
| |
| Phenotypic Information (metabolism pathway, cancer, disease, phenome) |
| |
| |
| Gene-Gene Network Information: Co-Expression Network, Interacting Genes & KEGG |
| |
|


| Gene Summary for EIF2B2 |
| Basic gene info. | Gene symbol | EIF2B2 |
| Gene name | eukaryotic translation initiation factor 2B, subunit 2 beta, 39kDa | |
| Synonyms | EIF-2Bbeta|EIF2B | |
| Cytomap | UCSC genome browser: 14q24.3 | |
| Genomic location | chr14 :75469611-75476294 | |
| Type of gene | protein-coding | |
| RefGenes | NM_014239.3, | |
| Ensembl id | ENSG00000119718 | |
| Description | S20I15S20III15eIF-2B GDP-GTP exchange factor subunit betatranslation initiation factor eIF-2B subunit beta | |
| Modification date | 20141219 | |
| dbXrefs | MIM : 606454 | |
| HGNC : HGNC | ||
| HPRD : 05923 | ||
| Protein | UniProt: P49770 go to UniProt's Cross Reference DB Table | |
| Expression | CleanEX: HS_EIF2B2 | |
| BioGPS: 8892 | ||
| Gene Expression Atlas: ENSG00000119718 | ||
| The Human Protein Atlas: ENSG00000119718 | ||
| Pathway | NCI Pathway Interaction Database: EIF2B2 | |
| KEGG: EIF2B2 | ||
| REACTOME: EIF2B2 | ||
| ConsensusPathDB | ||
| Pathway Commons: EIF2B2 | ||
| Metabolism | MetaCyc: EIF2B2 | |
| HUMANCyc: EIF2B2 | ||
| Regulation | Ensembl's Regulation: ENSG00000119718 | |
| miRBase: chr14 :75,469,611-75,476,294 | ||
| TargetScan: NM_014239 | ||
| cisRED: ENSG00000119718 | ||
| Context | iHOP: EIF2B2 | |
| cancer metabolism search in PubMed: EIF2B2 | ||
| UCL Cancer Institute: EIF2B2 | ||
| Assigned class in ccmGDB | A - This gene has a literature evidence and it belongs to cancer gene. | |
| References showing role of EIF2B2 in cancer cell metabolism | 1. Gallagher JW, Kubica N, Kimball SR, Jefferson LS (2008) Reduced eukaryotic initiation factor 2Bepsilon-subunit expression suppresses the transformed phenotype of cells overexpressing the protein. Cancer Res 68: 8752-8760. doi: 10.1158/0008-5472.CAN-08-1042. pmid: 2664734. go to article | |
| Top |
| Phenotypic Information for EIF2B2(metabolism pathway, cancer, disease, phenome) |
| Cancer | CGAP: EIF2B2 |
| Familial Cancer Database: EIF2B2 | |
| * This gene is included in those cancer gene databases. |
|
|
|
|
|
| . | ||||||||||||||
Oncogene 1 | Significant driver gene in | |||||||||||||||||||
| cf) number; DB name 1 Oncogene; http://nar.oxfordjournals.org/content/35/suppl_1/D721.long, 2 Tumor Suppressor gene; https://bioinfo.uth.edu/TSGene/, 3 Cancer Gene Census; http://www.nature.com/nrc/journal/v4/n3/abs/nrc1299.html, 4 CancerGenes; http://nar.oxfordjournals.org/content/35/suppl_1/D721.long, 5 Network of Cancer Gene; http://ncg.kcl.ac.uk/index.php, 1Therapeutic Vulnerabilities in Cancer; http://cbio.mskcc.org/cancergenomics/statius/ |
| REACTOME_METABOLISM_OF_PROTEINS | |
| OMIM | 603896; phenotype. 606454; gene. |
| Orphanet | 157713; Congenital or early infantile CACH syndrome. 157716; Late infantile CACH syndrome. 157719; Juvenile or adult CACH syndrome. 99853; Ovarioleukodystrophy. 99854; Cree leukoencephalopathy. |
| Disease | KEGG Disease: EIF2B2 |
| MedGen: EIF2B2 (Human Medical Genetics with Condition) | |
| ClinVar: EIF2B2 | |
| Phenotype | MGI: EIF2B2 (International Mouse Phenotyping Consortium) |
| PhenomicDB: EIF2B2 | |
| Mutations for EIF2B2 |
| * Under tables are showing count per each tissue to give us broad intuition about tissue specific mutation patterns.You can go to the detailed page for each mutation database's web site. |
| There's no structural variation information in COSMIC data for this gene. |
| * From mRNA Sanger sequences, Chitars2.0 arranged chimeric transcripts. This table shows EIF2B2 related fusion information. |
| ID | Head Gene | Tail Gene | Accession | Gene_a | qStart_a | qEnd_a | Chromosome_a | tStart_a | tEnd_a | Gene_a | qStart_a | qEnd_a | Chromosome_a | tStart_a | tEnd_a |
| CA945040 | EIF2B2 | 19 | 201 | 14 | 75476110 | 75476292 | EIF2B2 | 202 | 263 | 14 | 75476072 | 75476133 | |
| Top |
| There's no copy number variation information in COSMIC data for this gene. |
| Top |
|
 |
| Top |
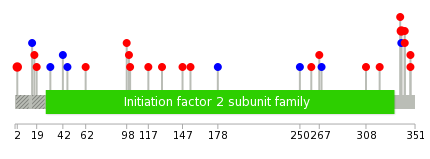
| Stat. for Non-Synonymous SNVs (# total SNVs=15) | (# total SNVs=6) |
 |  |
(# total SNVs=0) | (# total SNVs=0) |
| Top |
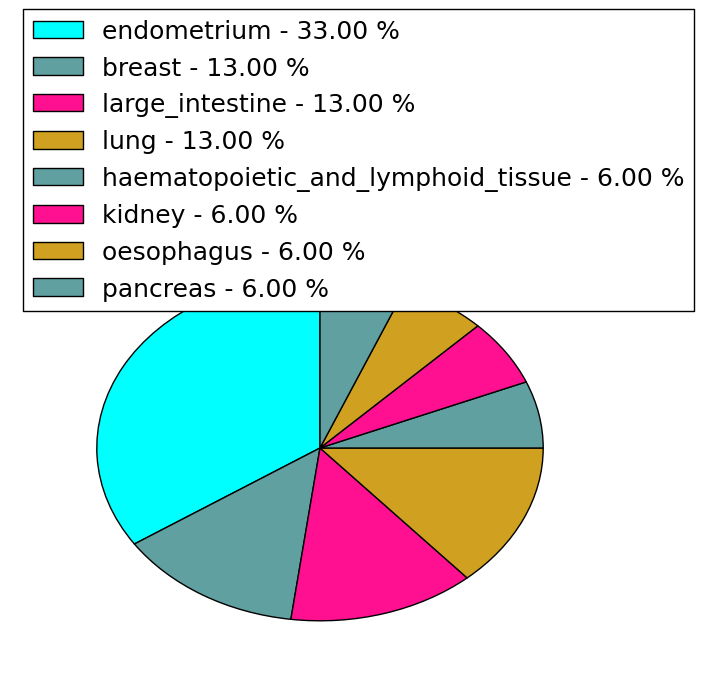
| * When you move the cursor on each content, you can see more deailed mutation information on the Tooltip. Those are primary_site,primary_histology,mutation(aa),pubmedID. |
| GRCh37 position | Mutation(aa) | Unique sampleID count |
| chr14:75475851-75475851 | p.L339P | 2 |
| chr14:75469697-75469697 | p.P2S | 2 |
| chr14:75469744-75469744 | p.S17R | 1 |
| chr14:75470319-75470319 | p.G117D | 1 |
| chr14:75475794-75475794 | p.L320P | 1 |
| chr14:75469748-75469748 | p.V19M | 1 |
| chr14:75470355-75470355 | p.L129R | 1 |
| chr14:75475847-75475847 | p.R338G | 1 |
| chr14:75469786-75469786 | p.S31S | 1 |
| chr14:75471446-75471446 | p.T147I | 1 |
| Top |
|
 |
| Point Mutation/ Tissue ID | 1 | 2 | 3 | 4 | 5 | 6 | 7 | 8 | 9 | 10 | 11 | 12 | 13 | 14 | 15 | 16 | 17 | 18 | 19 | 20 |
| # sample | 2 | 1 | 3 | 2 | 1 | 4 | 2 | 2 | 2 | 3 | 6 | |||||||||
| # mutation | 3 | 1 | 2 | 2 | 1 | 5 | 2 | 2 | 2 | 3 | 6 | |||||||||
| nonsynonymous SNV | 2 | 1 | 2 | 1 | 1 | 3 | 1 | 1 | 1 | 3 | 5 | |||||||||
| synonymous SNV | 1 | 1 | 2 | 1 | 1 | 1 | 1 |
| cf) Tissue ID; Tissue type (1; BLCA[Bladder Urothelial Carcinoma], 2; BRCA[Breast invasive carcinoma], 3; CESC[Cervical squamous cell carcinoma and endocervical adenocarcinoma], 4; COAD[Colon adenocarcinoma], 5; GBM[Glioblastoma multiforme], 6; Glioma Low Grade, 7; HNSC[Head and Neck squamous cell carcinoma], 8; KICH[Kidney Chromophobe], 9; KIRC[Kidney renal clear cell carcinoma], 10; KIRP[Kidney renal papillary cell carcinoma], 11; LAML[Acute Myeloid Leukemia], 12; LUAD[Lung adenocarcinoma], 13; LUSC[Lung squamous cell carcinoma], 14; OV[Ovarian serous cystadenocarcinoma ], 15; PAAD[Pancreatic adenocarcinoma], 16; PRAD[Prostate adenocarcinoma], 17; SKCM[Skin Cutaneous Melanoma], 18:STAD[Stomach adenocarcinoma], 19:THCA[Thyroid carcinoma], 20:UCEC[Uterine Corpus Endometrial Carcinoma]) |
| Top |
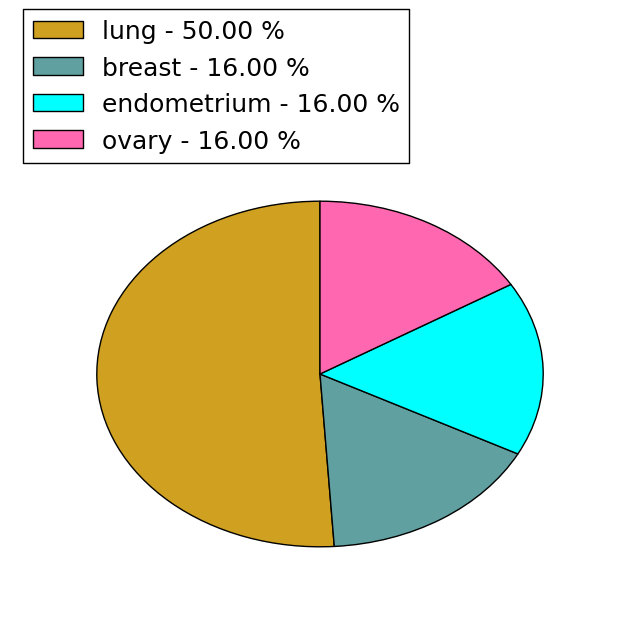
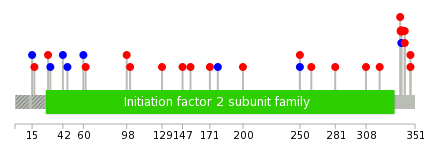
| * We represented just top 10 SNVs. When you move the cursor on each content, you can see more deailed mutation information on the Tooltip. Those are primary_site, primary_histology, mutation(aa), pubmedID. |
| Genomic Position | Mutation(aa) | Unique sampleID count |
| chr14:75475851 | p.L339P | 2 |
| chr14:75469779 | p.G250G | 1 |
| chr14:75471517 | p.S17R | 1 |
| chr14:75475852 | p.H260Q | 1 |
| chr14:75469786 | p.R29H | 1 |
| chr14:75471540 | p.E281K | 1 |
| chr14:75475859 | p.S31S | 1 |
| chr14:75469819 | p.V308M | 1 |
| chr14:75472569 | p.L42L | 1 |
| chr14:75475861 | p.L320P | 1 |
| * Copy number data were extracted from TCGA using R package TCGA-Assembler. The URLs of all public data files on TCGA DCC data server were gathered on Jan-05-2015. Function ProcessCNAData in TCGA-Assembler package was used to obtain gene-level copy number value which is calculated as the average copy number of the genomic region of a gene. |
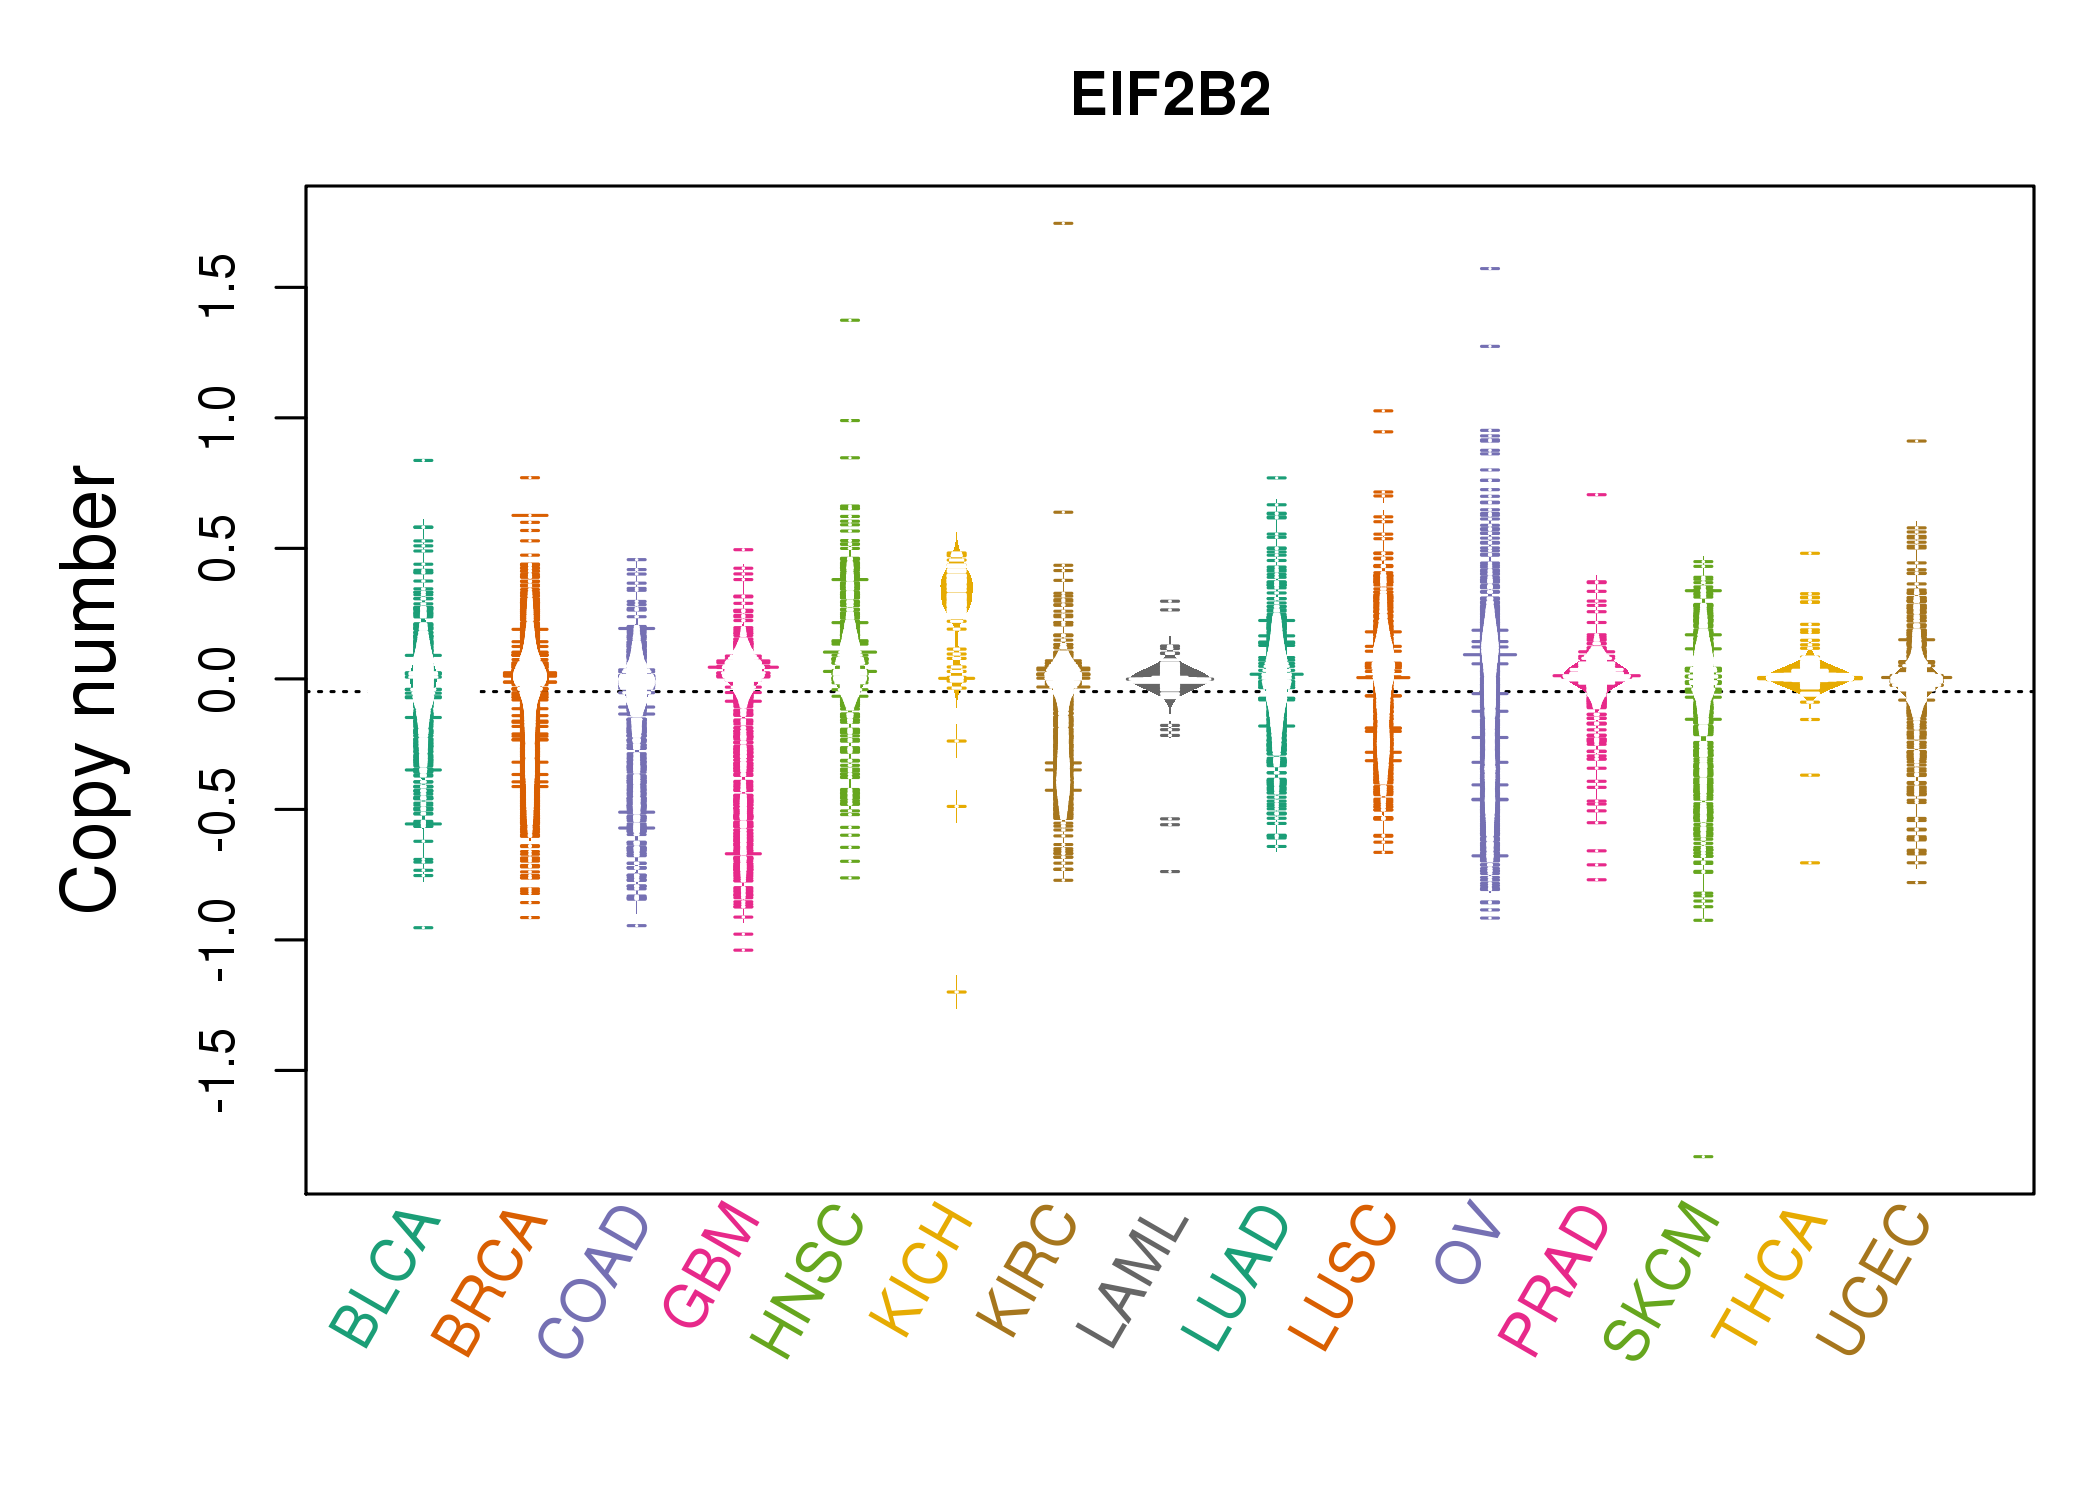 |
| cf) Tissue ID[Tissue type]: BLCA[Bladder Urothelial Carcinoma], BRCA[Breast invasive carcinoma], CESC[Cervical squamous cell carcinoma and endocervical adenocarcinoma], COAD[Colon adenocarcinoma], GBM[Glioblastoma multiforme], Glioma Low Grade, HNSC[Head and Neck squamous cell carcinoma], KICH[Kidney Chromophobe], KIRC[Kidney renal clear cell carcinoma], KIRP[Kidney renal papillary cell carcinoma], LAML[Acute Myeloid Leukemia], LUAD[Lung adenocarcinoma], LUSC[Lung squamous cell carcinoma], OV[Ovarian serous cystadenocarcinoma ], PAAD[Pancreatic adenocarcinoma], PRAD[Prostate adenocarcinoma], SKCM[Skin Cutaneous Melanoma], STAD[Stomach adenocarcinoma], THCA[Thyroid carcinoma], UCEC[Uterine Corpus Endometrial Carcinoma] |
| Top |
| Gene Expression for EIF2B2 |
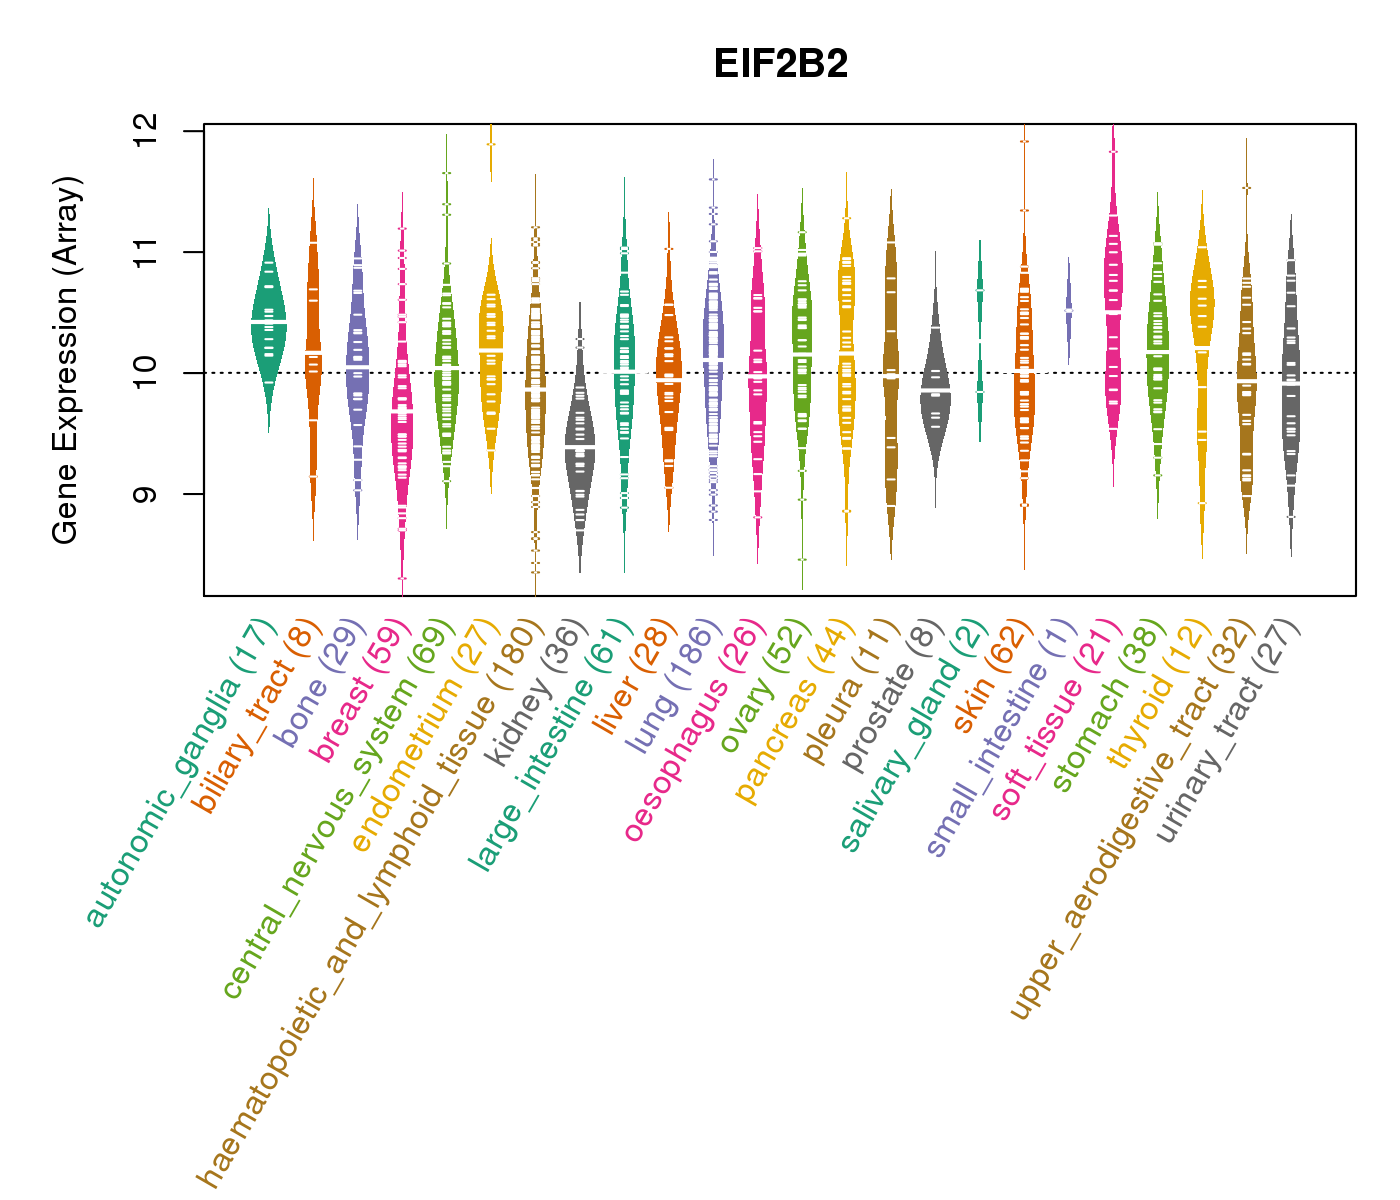
| * CCLE gene expression data were extracted from CCLE_Expression_Entrez_2012-10-18.res: Gene-centric RMA-normalized mRNA expression data. |
 |
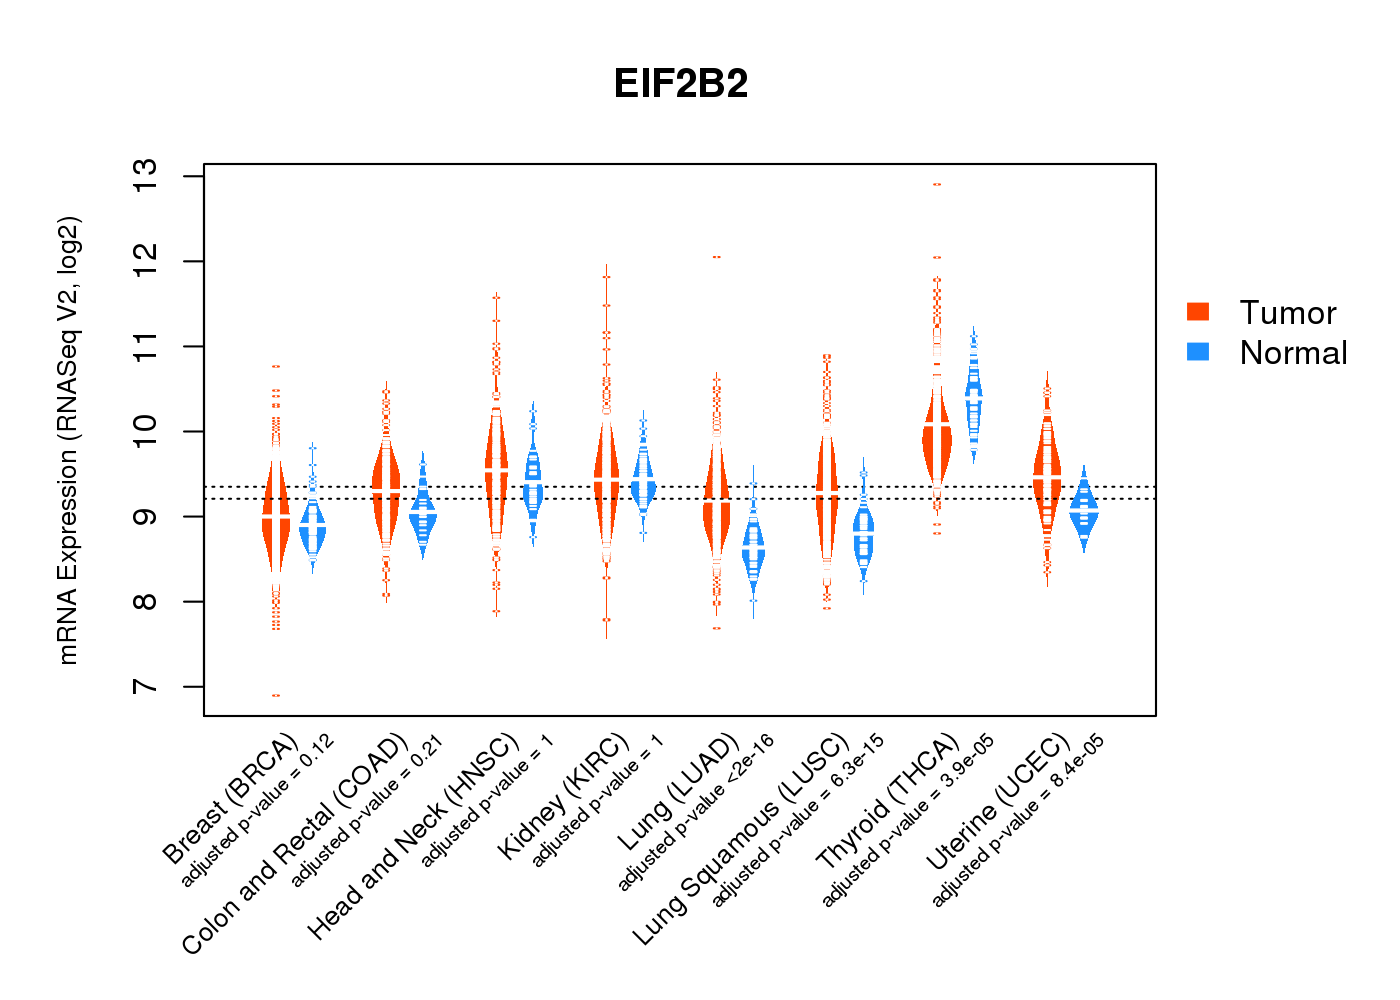
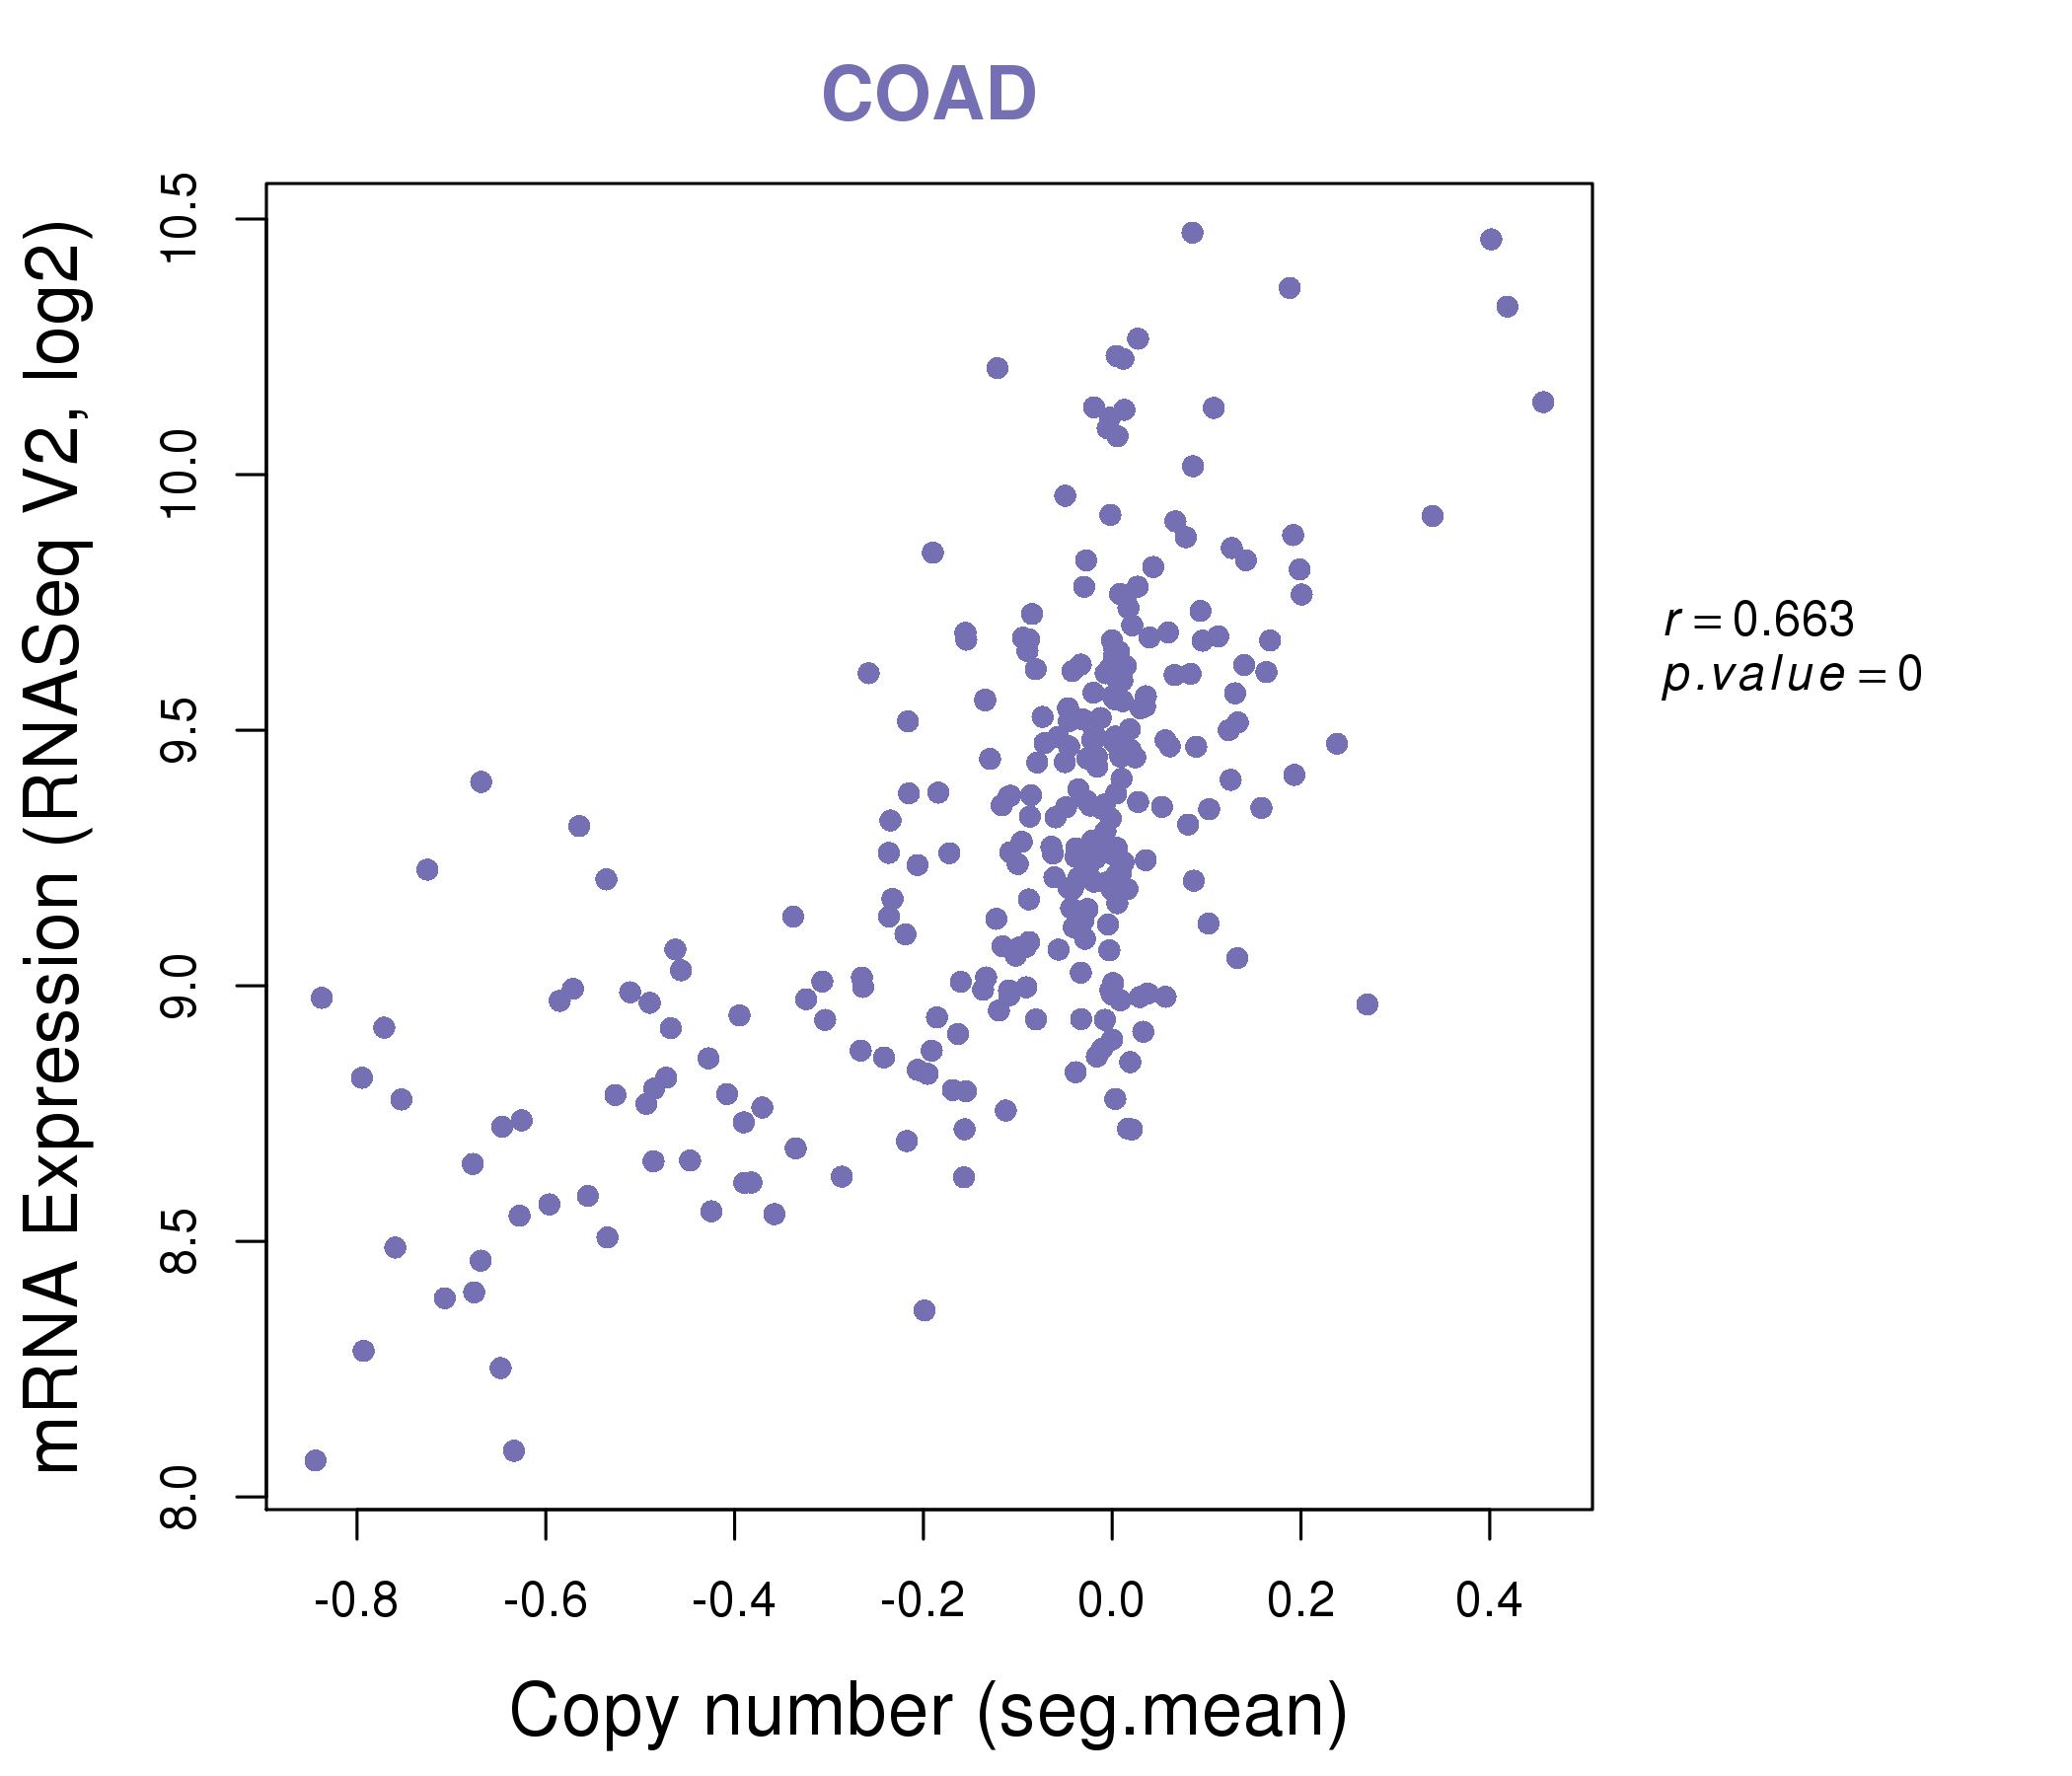
| * Normalized gene expression data of RNASeqV2 was extracted from TCGA using R package TCGA-Assembler. The URLs of all public data files on TCGA DCC data server were gathered at Jan-05-2015. Only eight cancer types have enough normal control samples for differential expression analysis. (t test, adjusted p<0.05 (using Benjamini-Hochberg FDR)) |
 |
| Top |
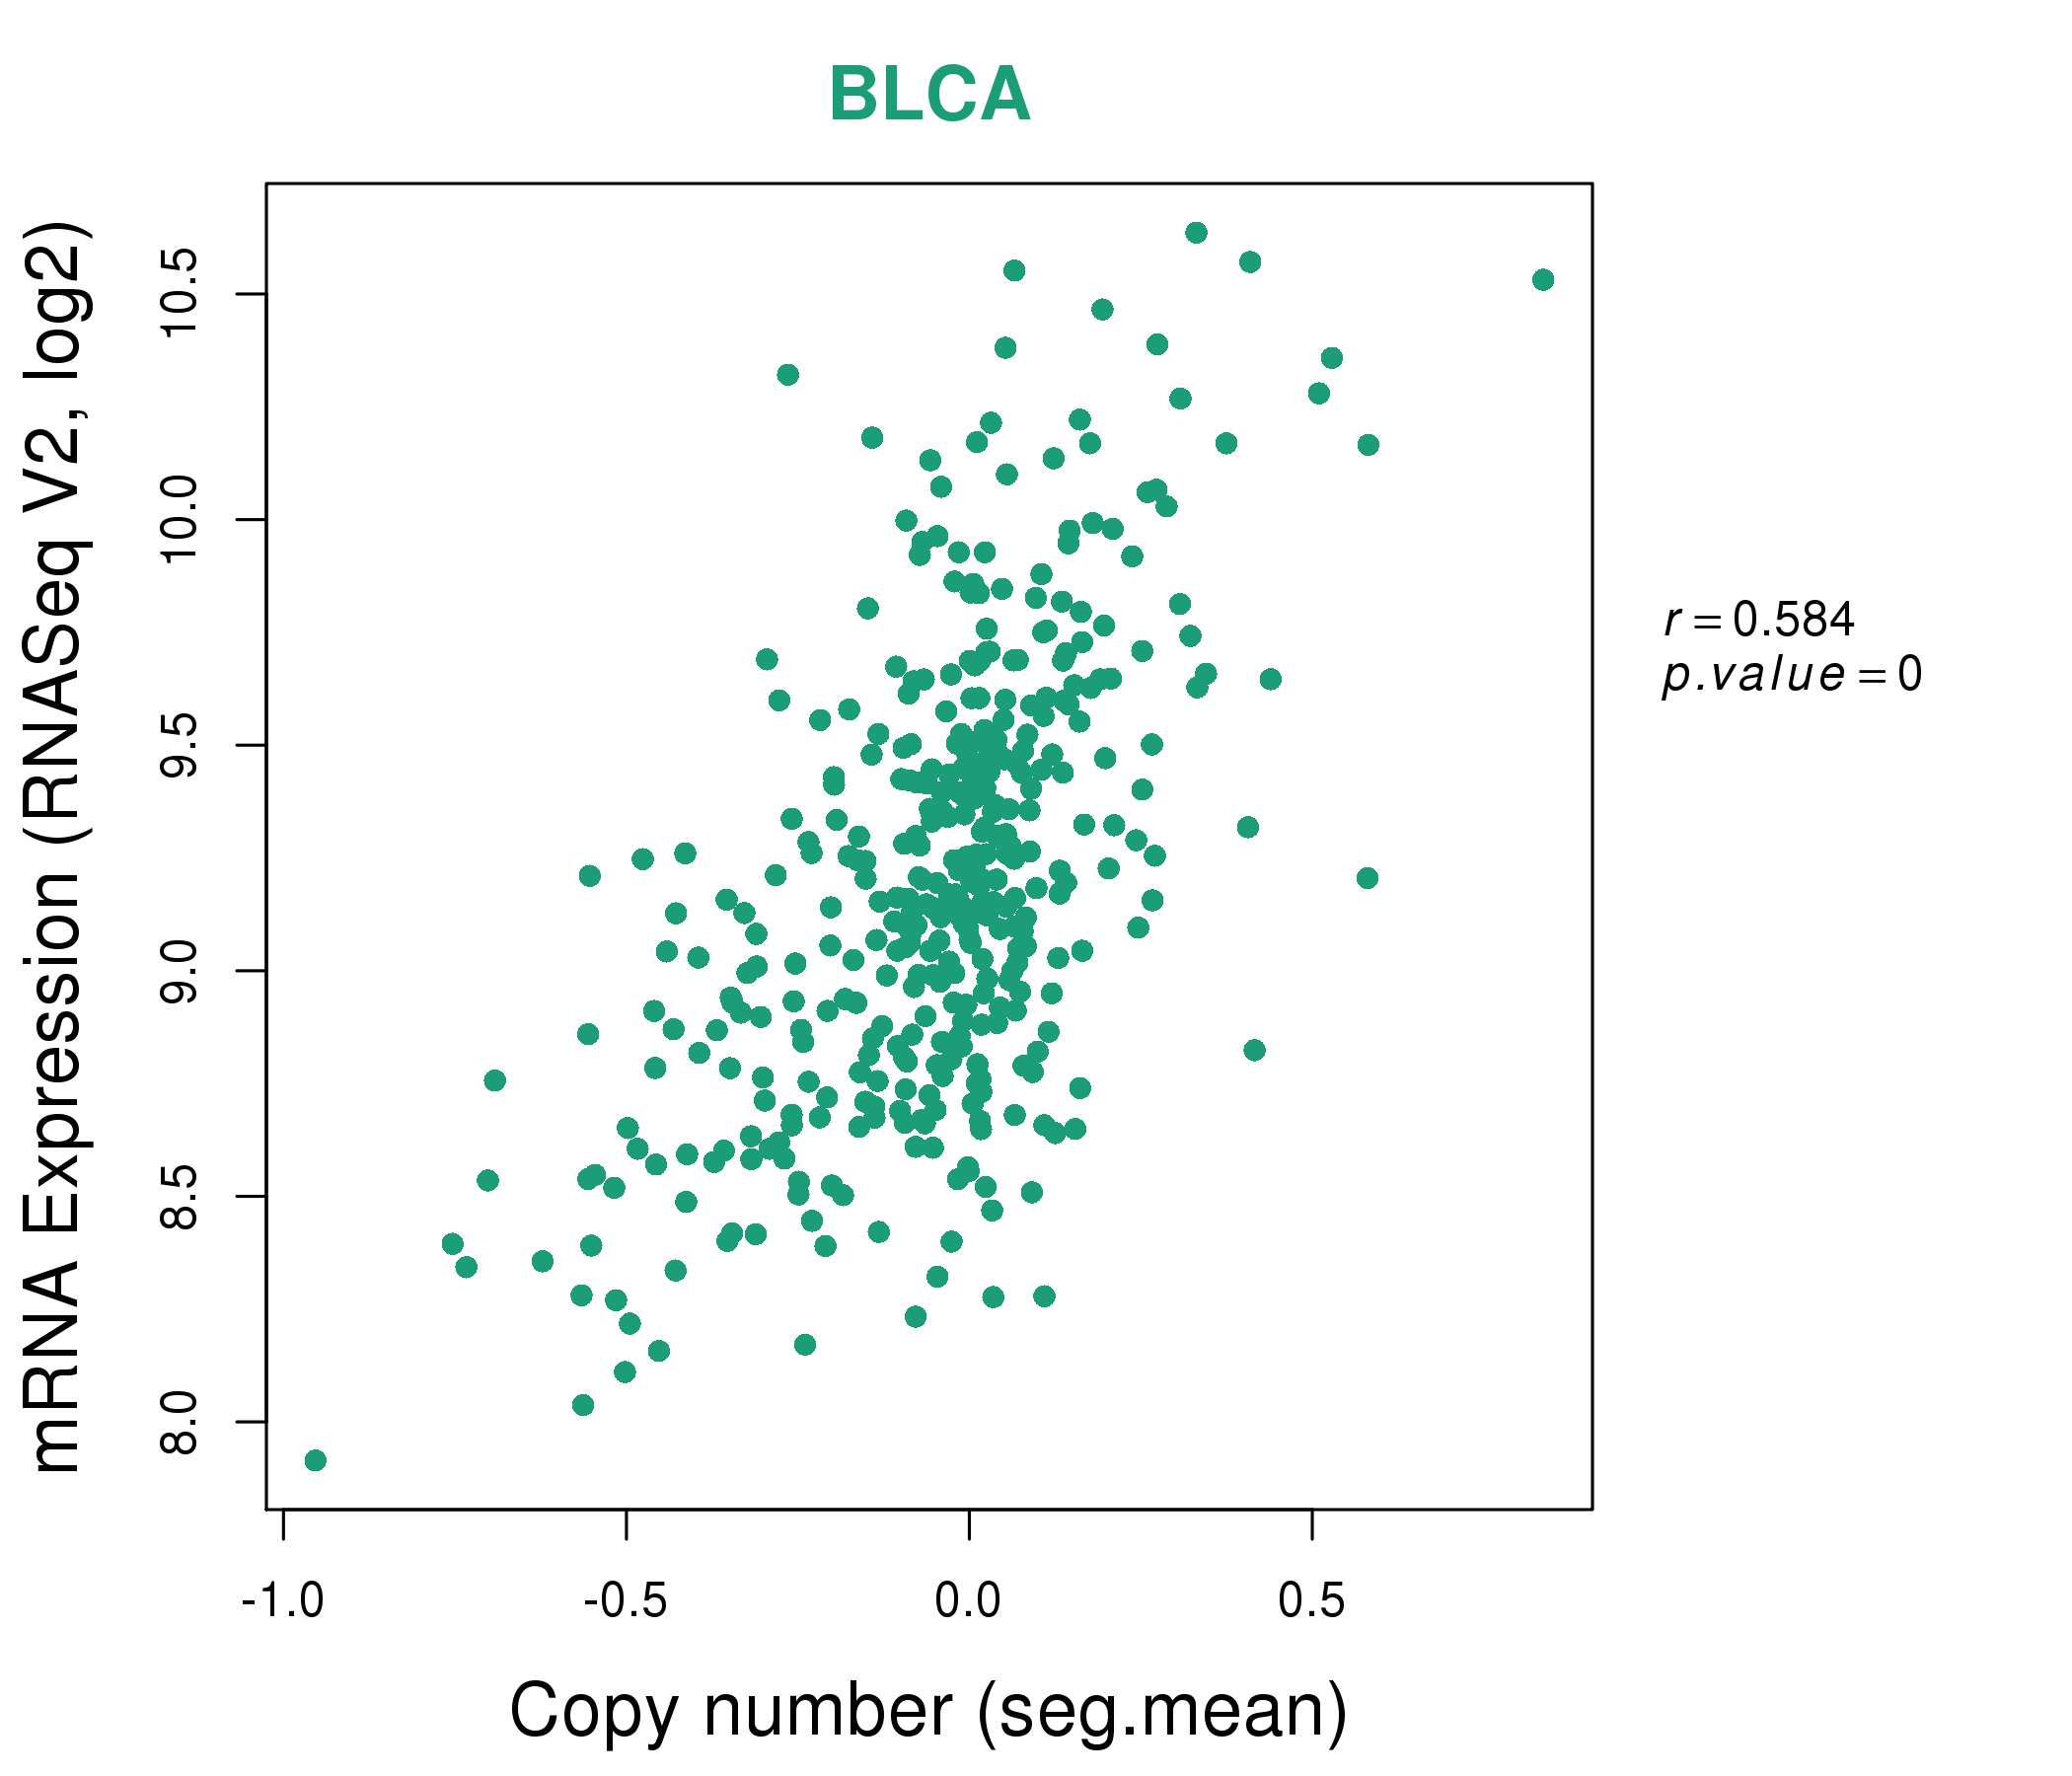
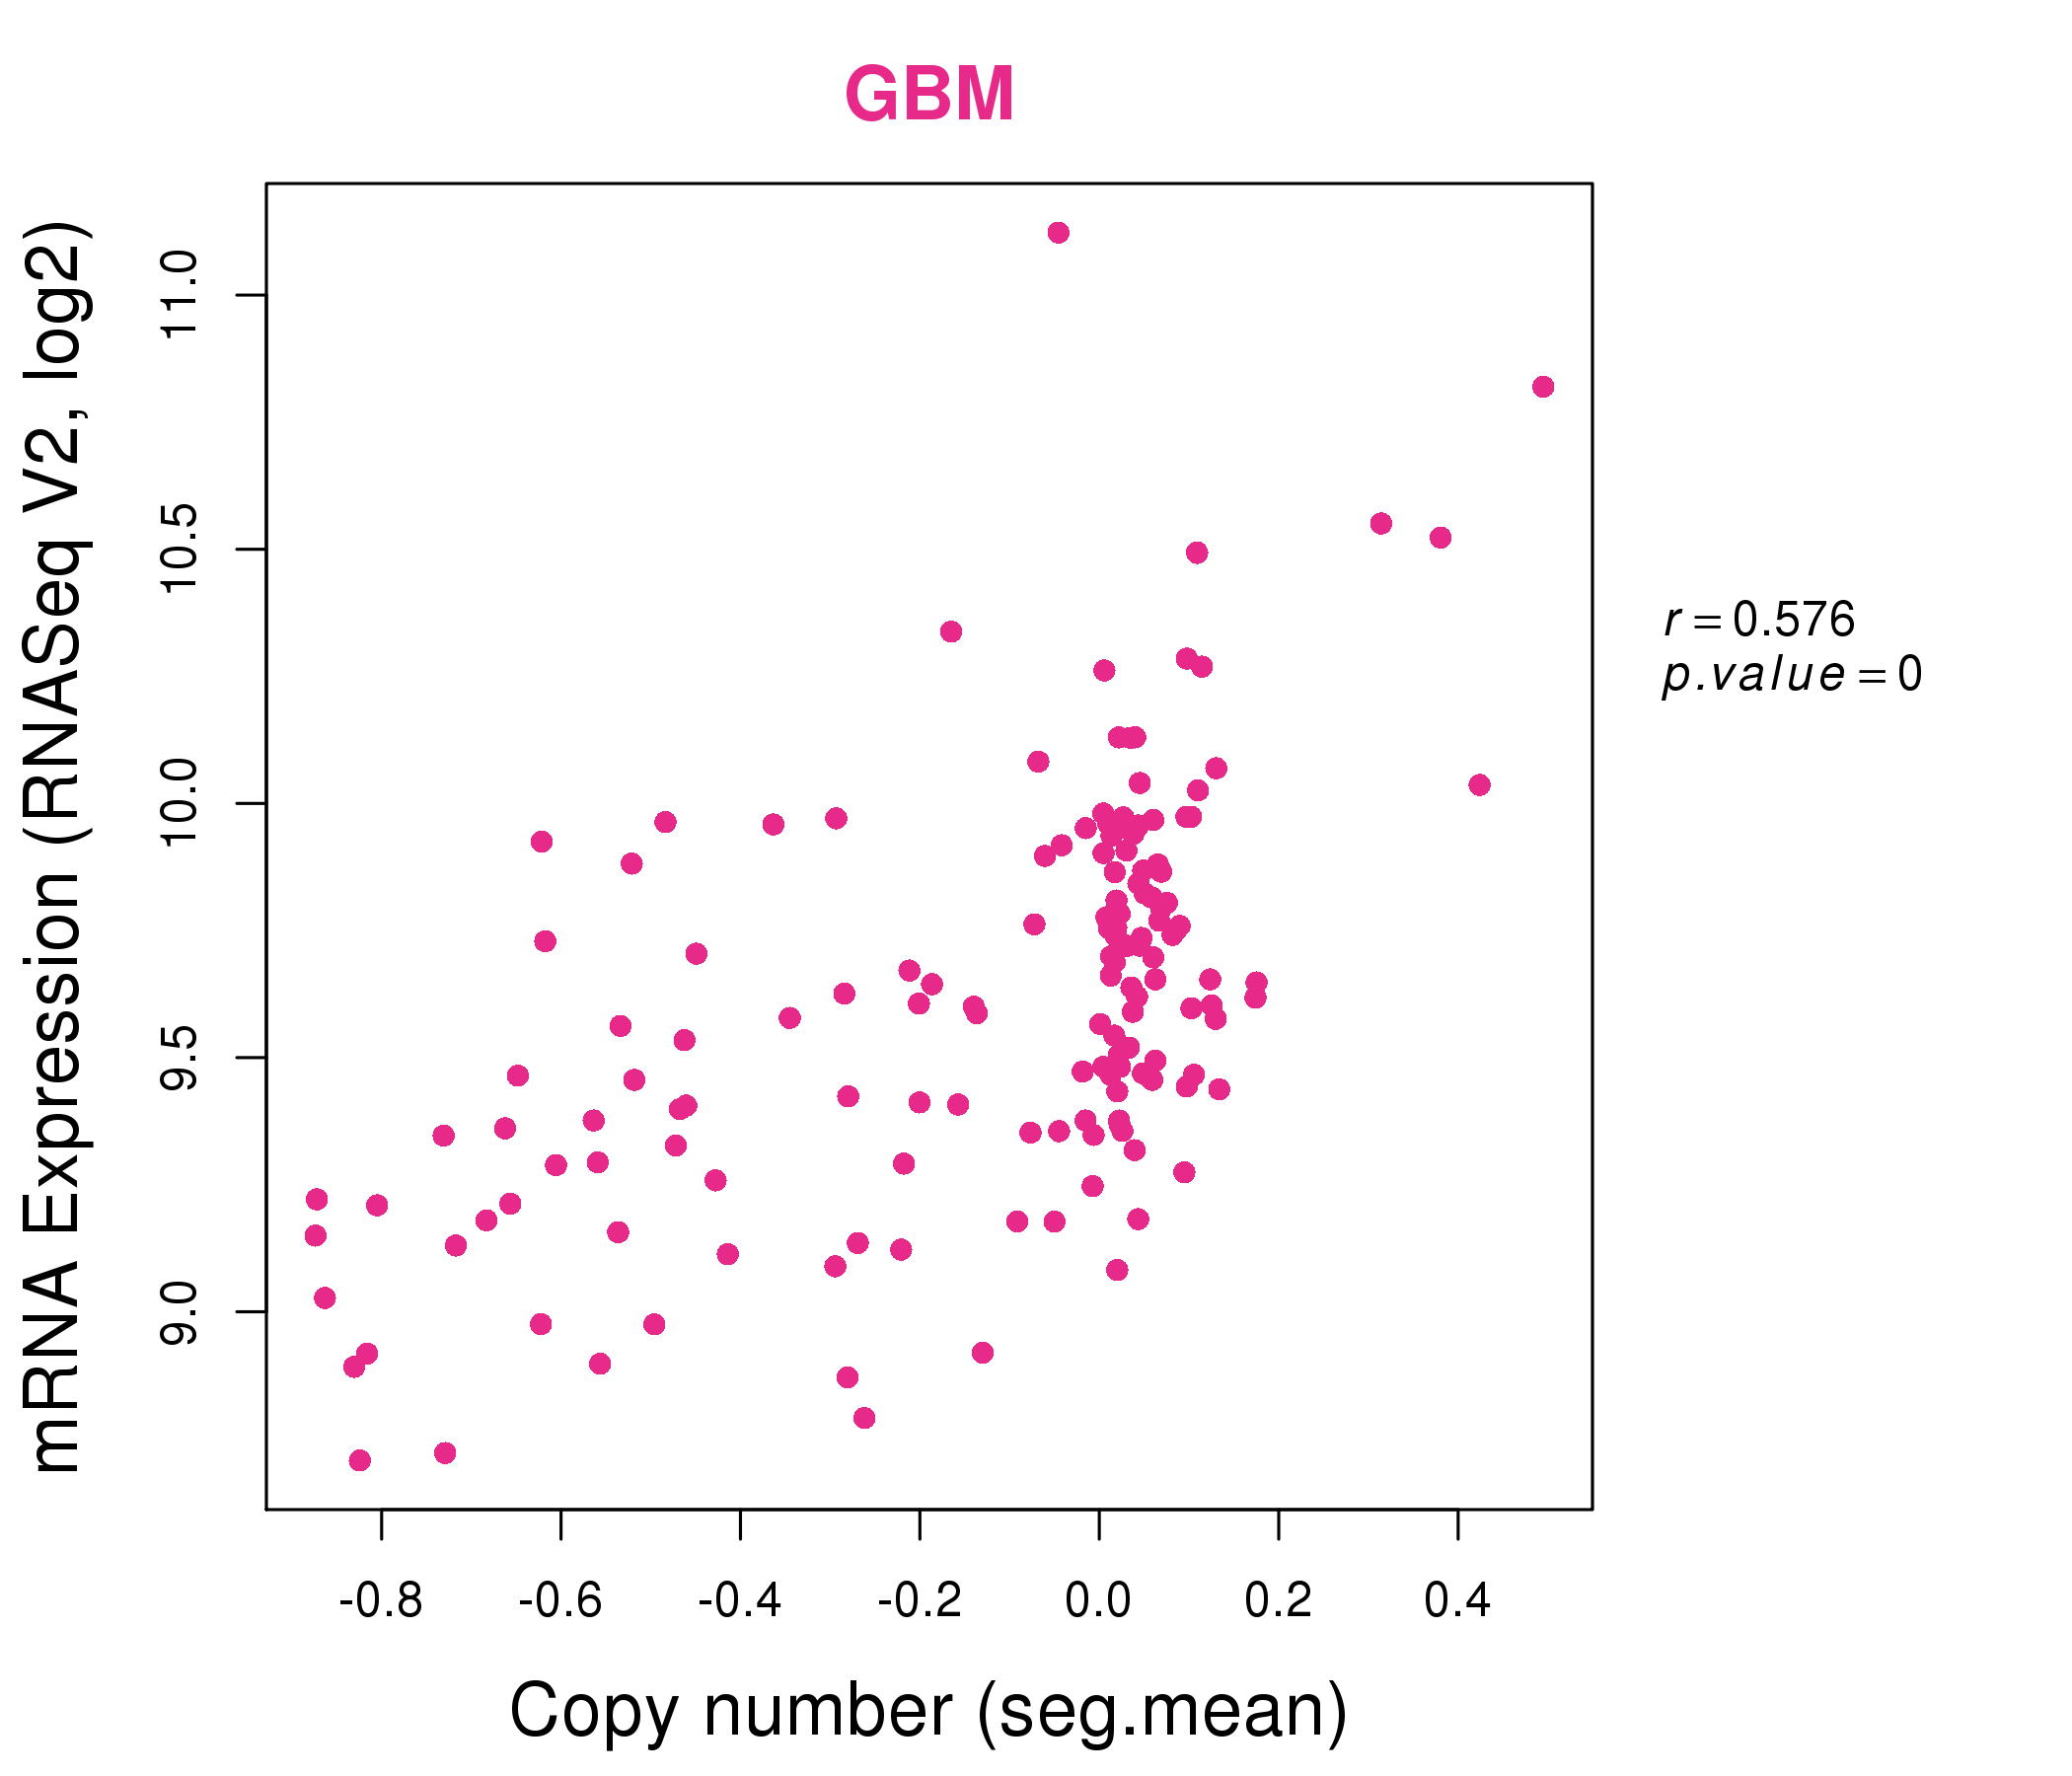
| * This plots show the correlation between CNV and gene expression. |
: Open all plots for all cancer types
 |
|
 |
|

| Top |
| Gene-Gene Network Information |
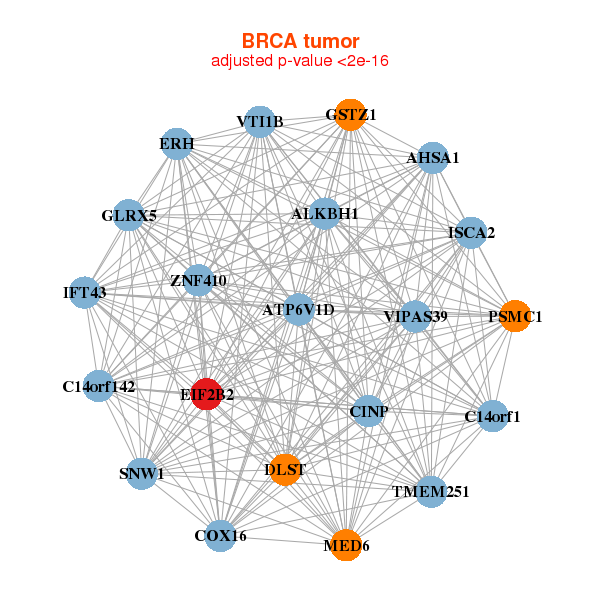
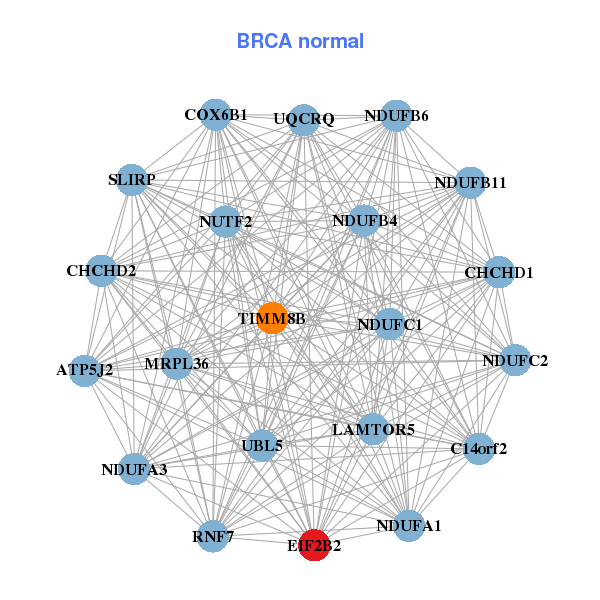
| * Co-Expression network figures were drawn using R package igraph. Only the top 20 genes with the highest correlations were shown. Red circle: input gene, orange circle: cell metabolism gene, sky circle: other gene |
: Open all plots for all cancer types
 |
|
| AHSA1,ALKBH1,ATP6V1D,TMEM251,C14orf1,C14orf142,IFT43, CINP,COX16,DLST,EIF2B2,ERH,GLRX5,GSTZ1, ISCA2,MED6,PSMC1,SNW1,VIPAS39,VTI1B,ZNF410 | ATP5J2,SLIRP,C14orf2,CHCHD1,CHCHD2,COX6B1,EIF2B2, LAMTOR5,MRPL36,NDUFA1,NDUFA3,NDUFB11,NDUFB4,NDUFB6, NDUFC1,NDUFC2,NUTF2,RNF7,TIMM8B,UBL5,UQCRQ |
 |
|
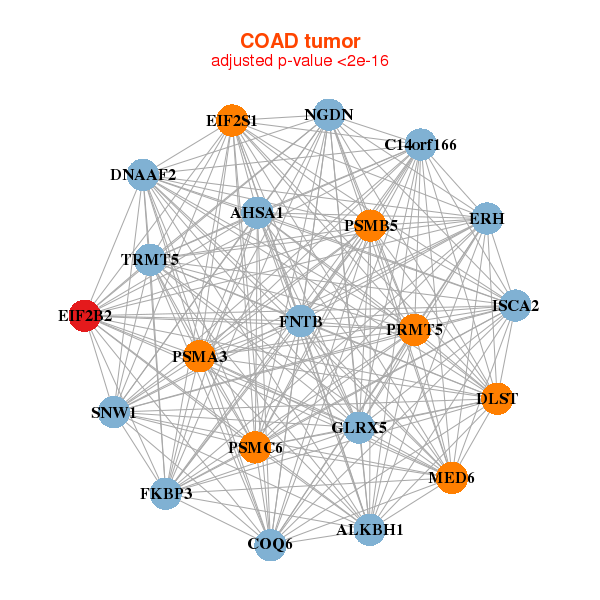
| AHSA1,ALKBH1,DNAAF2,C14orf166,COQ6,DLST,EIF2B2, EIF2S1,ERH,FKBP3,FNTB,GLRX5,ISCA2,MED6, NGDN,PRMT5,PSMA3,PSMB5,PSMC6,SNW1,TRMT5 | HYPK,C19orf10,DTD1,EIF2B2,EIF2S2,EIF3I,EIF4A1, EIF5AL1,EXOSC3,GTF2E2,MANF,NME1,PDIA6,PFDN2, PPIB,PSMB5,RAN,RPL26L1,SDF2L1,SEC61B,TIMM17A |
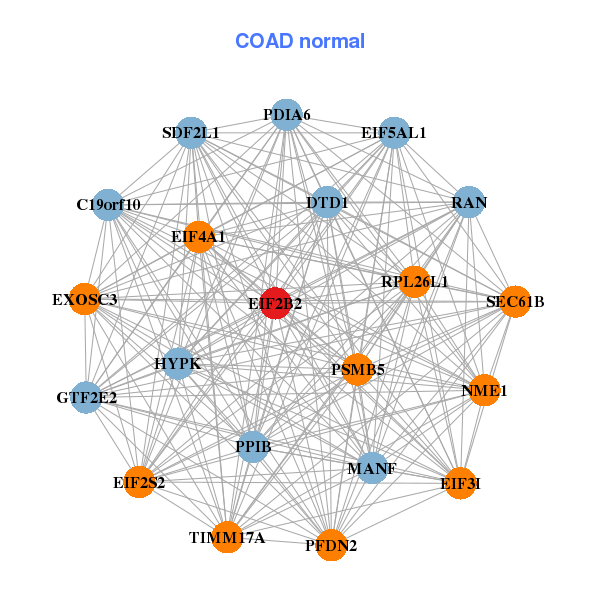
| * Co-Expression network figures were drawn using R package igraph. Only the top 20 genes with the highest correlations were shown. Red circle: input gene, orange circle: cell metabolism gene, sky circle: other gene |
: Open all plots for all cancer types
| Top |
: Open all interacting genes' information including KEGG pathway for all interacting genes from DAVID
| Top |
| Pharmacological Information for EIF2B2 |
| There's no related Drug. |
| Top |
| Cross referenced IDs for EIF2B2 |
| * We obtained these cross-references from Uniprot database. It covers 150 different DBs, 18 categories. http://www.uniprot.org/help/cross_references_section |
: Open all cross reference information
|
Copyright © 2016-Present - The Univsersity of Texas Health Science Center at Houston @ |