|
|||||||||||||||||||||||||||||||||||||||||||||||||||||||||||||||||||||||||||||||||||||||||||||||||||||||||||||||||||||||||||||||||||||||||||||||||||||||||||||||||||||||||||||||||||||||||||||||||||||||||||||||||||||||||||||||||||||||||||||||||||||||||||||||||||||||||||||||||||||||||||||||||||||||||||||||||||||||||||||||||||||||||||||||||||
| |
| Phenotypic Information (metabolism pathway, cancer, disease, phenome) |
| |
| |
| Gene-Gene Network Information: Co-Expression Network, Interacting Genes & KEGG |
| |
|


| Gene Summary for EIF2S2 |
| Basic gene info. | Gene symbol | EIF2S2 |
| Gene name | eukaryotic translation initiation factor 2, subunit 2 beta, 38kDa | |
| Synonyms | EIF2|EIF2B|EIF2beta|PPP1R67|eIF-2-beta | |
| Cytomap | UCSC genome browser: 20q11.2 | |
| Genomic location | chr20 :32676114-32700085 | |
| Type of gene | protein-coding | |
| RefGenes | NM_003908.3, | |
| Ensembl id | ENSG00000125977 | |
| Description | eukaryotic translation initiation factor 2 subunit 2eukaryotic translation initiation factor 2 subunit betaprotein phosphatase 1, regulatory subunit 67 | |
| Modification date | 20141207 | |
| dbXrefs | MIM : 603908 | |
| HGNC : HGNC | ||
| Ensembl : ENSG00000125977 | ||
| HPRD : 04882 | ||
| Vega : OTTHUMG00000032287 | ||
| Protein | UniProt: P20042 go to UniProt's Cross Reference DB Table | |
| Expression | CleanEX: HS_EIF2S2 | |
| BioGPS: 8894 | ||
| Gene Expression Atlas: ENSG00000125977 | ||
| The Human Protein Atlas: ENSG00000125977 | ||
| Pathway | NCI Pathway Interaction Database: EIF2S2 | |
| KEGG: EIF2S2 | ||
| REACTOME: EIF2S2 | ||
| ConsensusPathDB | ||
| Pathway Commons: EIF2S2 | ||
| Metabolism | MetaCyc: EIF2S2 | |
| HUMANCyc: EIF2S2 | ||
| Regulation | Ensembl's Regulation: ENSG00000125977 | |
| miRBase: chr20 :32,676,114-32,700,085 | ||
| TargetScan: NM_003908 | ||
| cisRED: ENSG00000125977 | ||
| Context | iHOP: EIF2S2 | |
| cancer metabolism search in PubMed: EIF2S2 | ||
| UCL Cancer Institute: EIF2S2 | ||
| Assigned class in ccmGDB | A - This gene has a literature evidence and it belongs to cancer gene. | |
| References showing role of EIF2S2 in cancer cell metabolism | 1. Heaney JD, Michelson MV, Youngren KK, Lam MY, Nadeau JH (2009) Deletion of eIF2beta suppresses testicular cancer incidence and causes recessive lethality in agouti-yellow mice. Hum Mol Genet 18: 1395-1404. doi: 10.1093/hmg/ddp045. pmid: 2664146. go to article | |
| Top |
| Phenotypic Information for EIF2S2(metabolism pathway, cancer, disease, phenome) |
| Cancer | CGAP: EIF2S2 |
| Familial Cancer Database: EIF2S2 | |
| * This gene is included in those cancer gene databases. |
|
|
|
|
|
| . | |||||||||||||||||||||||||||||||||||||||||||||||||||||||||||||||||||||||||||||||||||||||||||||||||||||||||||||||||||||||||||||||||||||||||||||||||||||||||||||||||||||||||||||||||||||||||||||||||||||||||||||||||||||||||||||||||||||||||||||||||||||||||||||||||||||||||||||||||||||||||||||||||||||||||||||||||||||||||||||||||||||||||||||
Oncogene 1 | Significant driver gene in UCEC 6, | ||||||||||||||||||||||||||||||||||||||||||||||||||||||||||||||||||||||||||||||||||||||||||||||||||||||||||||||||||||||||||||||||||||||||||||||||||||||||||||||||||||||||||||||||||||||||||||||||||||||||||||||||||||||||||||||||||||||||||||||||||||||||||||||||||||||||||||||||||||||||||||||||||||||||||||||||||||||||||||||||||||||||||||||||||
| cf) number; DB name 1 Oncogene; http://nar.oxfordjournals.org/content/35/suppl_1/D721.long, 2 Tumor Suppressor gene; https://bioinfo.uth.edu/TSGene/, 3 Cancer Gene Census; http://www.nature.com/nrc/journal/v4/n3/abs/nrc1299.html, 4 CancerGenes; http://nar.oxfordjournals.org/content/35/suppl_1/D721.long, 5 Network of Cancer Gene; http://ncg.kcl.ac.uk/index.php, 6 http://www.nature.com/nature/journal/v497/n7447/full/nature12113.html, 7Therapeutic Vulnerabilities in Cancer; http://cbio.mskcc.org/cancergenomics/statius/ |
| REACTOME_METABOLISM_OF_PROTEINS | |
| OMIM | 603908; gene. |
| Orphanet | |
| Disease | KEGG Disease: EIF2S2 |
| MedGen: EIF2S2 (Human Medical Genetics with Condition) | |
| ClinVar: EIF2S2 | |
| Phenotype | MGI: EIF2S2 (International Mouse Phenotyping Consortium) |
| PhenomicDB: EIF2S2 | |
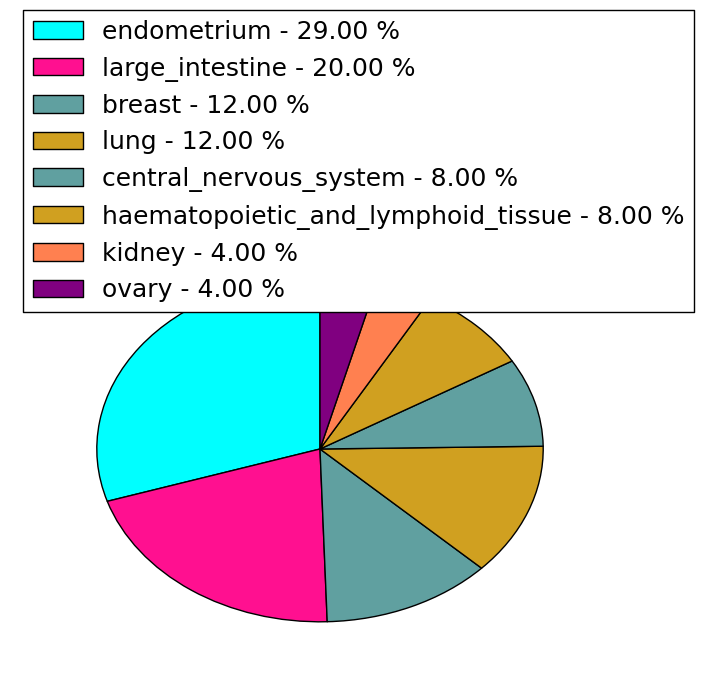
| Mutations for EIF2S2 |
| * Under tables are showing count per each tissue to give us broad intuition about tissue specific mutation patterns.You can go to the detailed page for each mutation database's web site. |
| - Statistics for Tissue and Mutation type | Top |
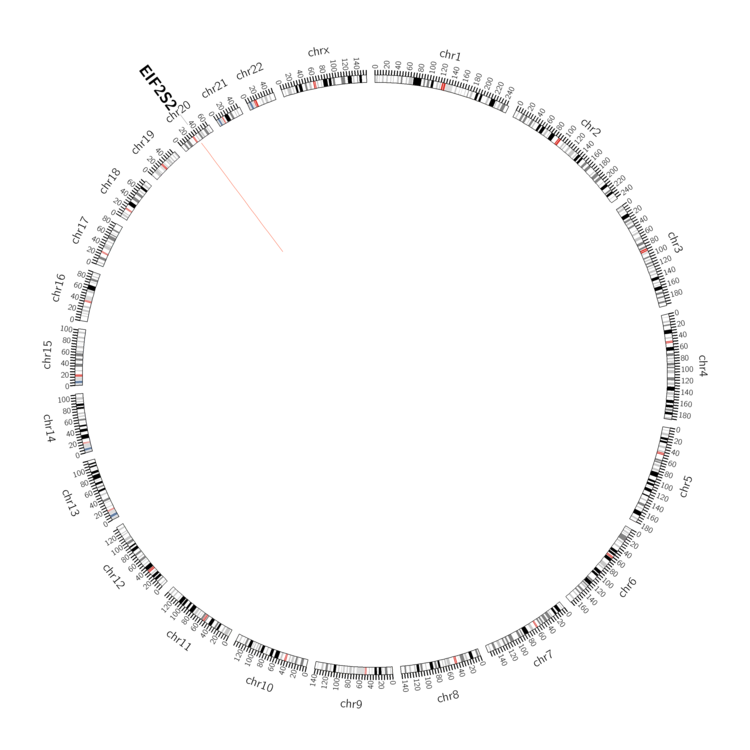 |
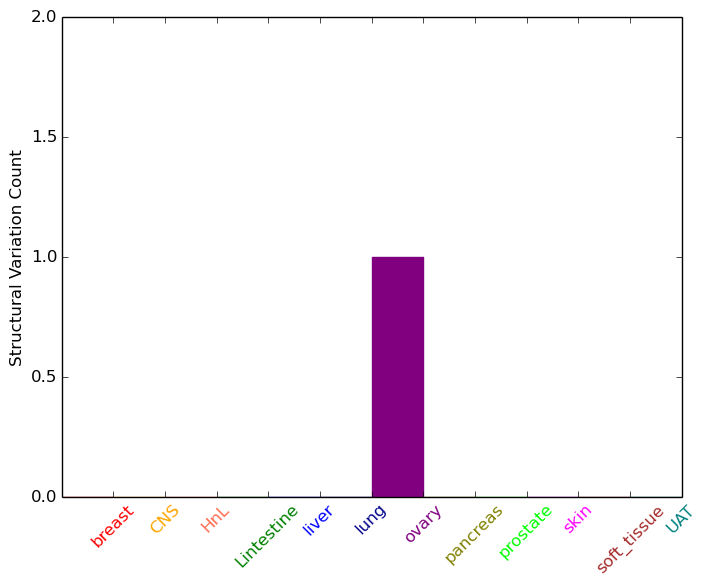
| - For Inter-chromosomal Variations |
| There's no inter-chromosomal structural variation. |
| - For Intra-chromosomal Variations |
| * Intra-chromosomal variantions includes 'intrachromosomal amplicon to amplicon', 'intrachromosomal amplicon to non-amplified dna', 'intrachromosomal deletion', 'intrachromosomal fold-back inversion', 'intrachromosomal inversion', 'intrachromosomal tandem duplication', 'Intrachromosomal unknown type', 'intrachromosomal with inverted orientation', 'intrachromosomal with non-inverted orientation'. |
 |
| Sample | Symbol_a | Chr_a | Start_a | End_a | Symbol_b | Chr_b | Start_b | End_b |
| ovary | EIF2S2 | chr20 | 32689346 | 32689366 | EIF2S2 | chr20 | 32695252 | 32695272 |
| cf) Tissue number; Tissue name (1;Breast, 2;Central_nervous_system, 3;Haematopoietic_and_lymphoid_tissue, 4;Large_intestine, 5;Liver, 6;Lung, 7;Ovary, 8;Pancreas, 9;Prostate, 10;Skin, 11;Soft_tissue, 12;Upper_aerodigestive_tract) |
| * From mRNA Sanger sequences, Chitars2.0 arranged chimeric transcripts. This table shows EIF2S2 related fusion information. |
| ID | Head Gene | Tail Gene | Accession | Gene_a | qStart_a | qEnd_a | Chromosome_a | tStart_a | tEnd_a | Gene_a | qStart_a | qEnd_a | Chromosome_a | tStart_a | tEnd_a |
| BM837359 | EIF2S2 | 1 | 250 | 20 | 32693234 | 32700033 | TP53I11 | 247 | 689 | 11 | 44955863 | 44956305 | |
| BU543690 | APLP2 | 1 | 694 | 11 | 129939810 | 129991623 | EIF2S2 | 691 | 880 | 20 | 32691291 | 32693280 | |
| Top |
| Mutation type/ Tissue ID | brca | cns | cerv | endome | haematopo | kidn | Lintest | liver | lung | ns | ovary | pancre | prost | skin | stoma | thyro | urina | |||
| Total # sample | 2 | 1 | 1 | 1 | ||||||||||||||||
| GAIN (# sample) | 2 | 1 | 1 | 1 | ||||||||||||||||
| LOSS (# sample) |
| cf) Tissue ID; Tissue type (1; Breast, 2; Central_nervous_system, 3; Cervix, 4; Endometrium, 5; Haematopoietic_and_lymphoid_tissue, 6; Kidney, 7; Large_intestine, 8; Liver, 9; Lung, 10; NS, 11; Ovary, 12; Pancreas, 13; Prostate, 14; Skin, 15; Stomach, 16; Thyroid, 17; Urinary_tract) |
| Top |
|
 |
| Top |
| Stat. for Non-Synonymous SNVs (# total SNVs=24) | (# total SNVs=3) |
 |  |
(# total SNVs=1) | (# total SNVs=0) |
 |
| Top |
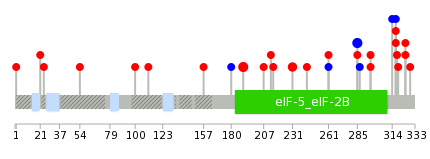
| * When you move the cursor on each content, you can see more deailed mutation information on the Tooltip. Those are primary_site,primary_histology,mutation(aa),pubmedID. |
| GRCh37 position | Mutation(aa) | Unique sampleID count |
| chr20:32684576-32684576 | p.K190N | 3 |
| chr20:32677685-32677685 | p.R285R | 3 |
| chr20:32681530-32681530 | p.R231C | 2 |
| chr20:32677589-32677589 | p.G317C | 2 |
| chr20:32693273-32693273 | p.Q32fs*39 | 2 |
| chr20:32693352-32693352 | p.? | 2 |
| chr20:32677564-32677564 | p.R325Q | 2 |
| chr20:32677587-32677587 | p.G317G | 1 |
| chr20:32693249-32693249 | p.E40* | 1 |
| chr20:32684501-32684501 | p.K215N | 1 |
| Top |
|
 |
| Point Mutation/ Tissue ID | 1 | 2 | 3 | 4 | 5 | 6 | 7 | 8 | 9 | 10 | 11 | 12 | 13 | 14 | 15 | 16 | 17 | 18 | 19 | 20 |
| # sample | 2 | 1 | 1 | 1 | 1 | 1 | 1 | 1 | 4 | 1 | 6 | |||||||||
| # mutation | 2 | 1 | 1 | 1 | 1 | 1 | 1 | 1 | 4 | 1 | 5 | |||||||||
| nonsynonymous SNV | 2 | 1 | 1 | 1 | 1 | 1 | 1 | 3 | 1 | 5 | ||||||||||
| synonymous SNV | 1 | 1 |
| cf) Tissue ID; Tissue type (1; BLCA[Bladder Urothelial Carcinoma], 2; BRCA[Breast invasive carcinoma], 3; CESC[Cervical squamous cell carcinoma and endocervical adenocarcinoma], 4; COAD[Colon adenocarcinoma], 5; GBM[Glioblastoma multiforme], 6; Glioma Low Grade, 7; HNSC[Head and Neck squamous cell carcinoma], 8; KICH[Kidney Chromophobe], 9; KIRC[Kidney renal clear cell carcinoma], 10; KIRP[Kidney renal papillary cell carcinoma], 11; LAML[Acute Myeloid Leukemia], 12; LUAD[Lung adenocarcinoma], 13; LUSC[Lung squamous cell carcinoma], 14; OV[Ovarian serous cystadenocarcinoma ], 15; PAAD[Pancreatic adenocarcinoma], 16; PRAD[Prostate adenocarcinoma], 17; SKCM[Skin Cutaneous Melanoma], 18:STAD[Stomach adenocarcinoma], 19:THCA[Thyroid carcinoma], 20:UCEC[Uterine Corpus Endometrial Carcinoma]) |
| Top |
| * We represented just top 10 SNVs. When you move the cursor on each content, you can see more deailed mutation information on the Tooltip. Those are primary_site, primary_histology, mutation(aa), pubmedID. |
| Genomic Position | Mutation(aa) | Unique sampleID count |
| chr20:32684576 | p.K190N | 3 |
| chr20:32677564 | p.R325Q | 2 |
| chr20:32677652 | p.Q319R | 1 |
| chr20:32693295 | p.F318L | 1 |
| chr20:32677677 | p.R296Q | 1 |
| chr20:32699916 | p.R296G | 1 |
| chr20:32677684 | p.P287P | 1 |
| chr20:32678367 | p.R285L | 1 |
| chr20:32681530 | p.R261K | 1 |
| chr20:32684501 | p.R231C | 1 |
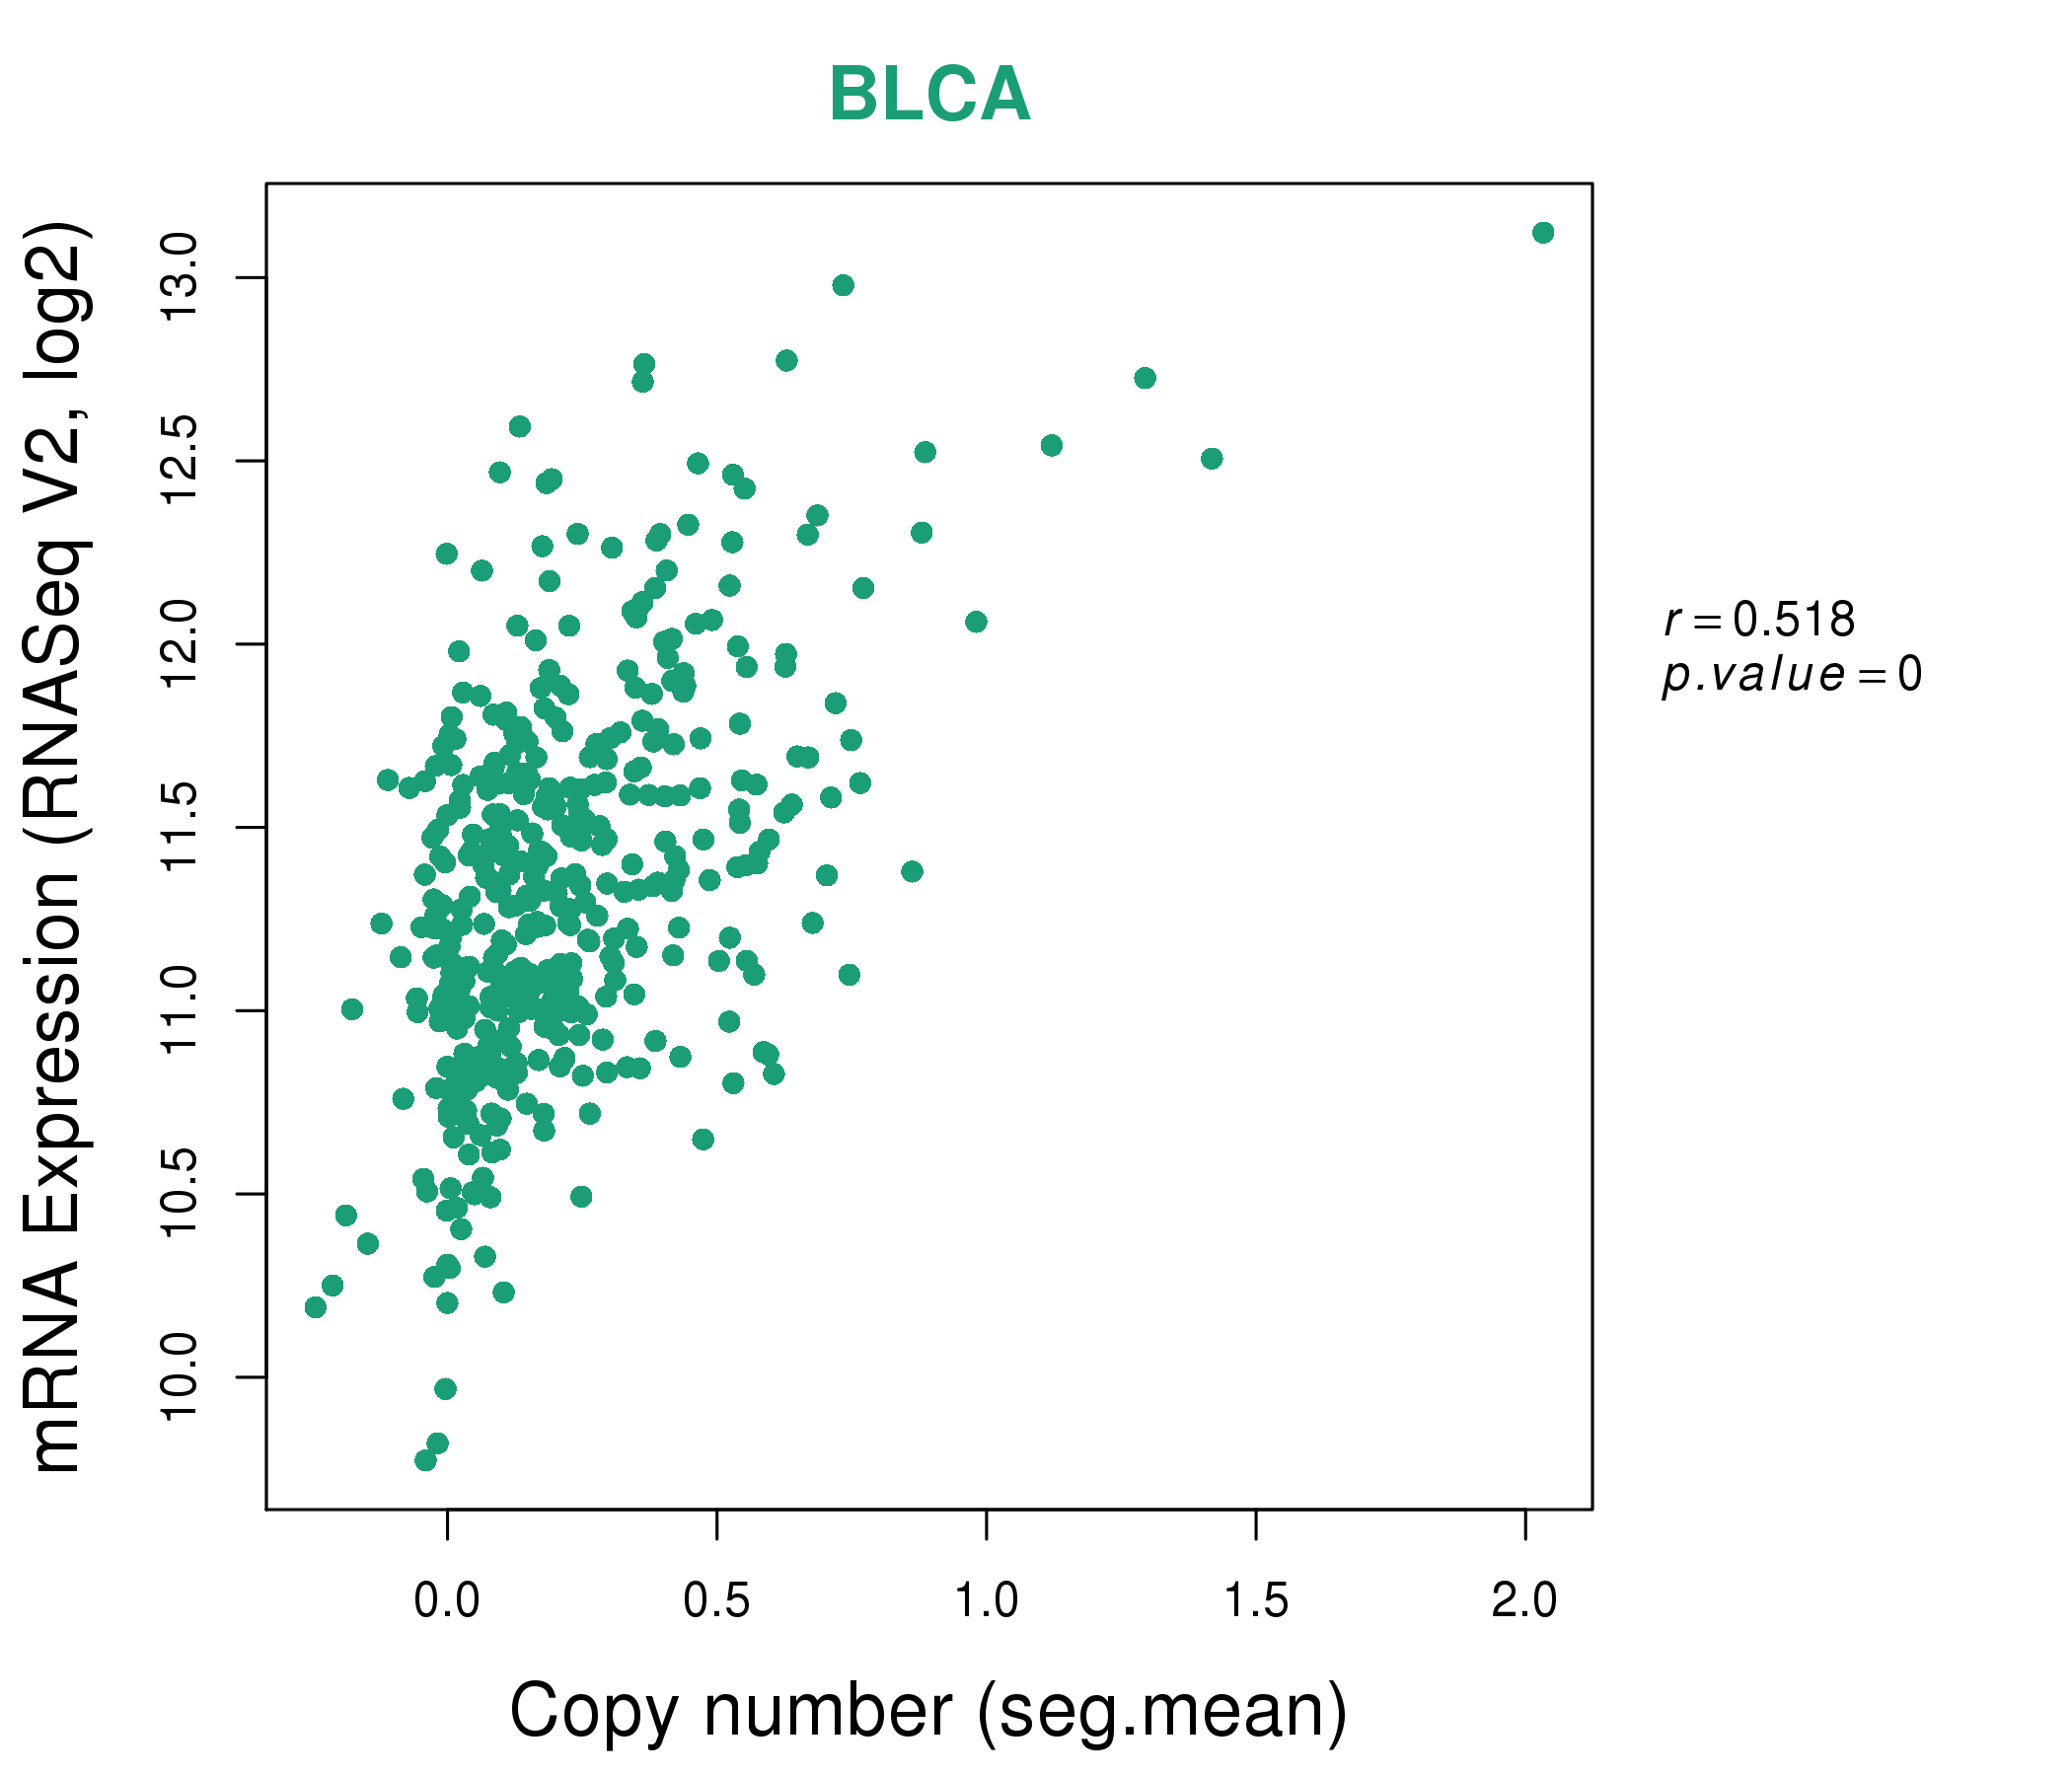
| * Copy number data were extracted from TCGA using R package TCGA-Assembler. The URLs of all public data files on TCGA DCC data server were gathered on Jan-05-2015. Function ProcessCNAData in TCGA-Assembler package was used to obtain gene-level copy number value which is calculated as the average copy number of the genomic region of a gene. |
 |
| cf) Tissue ID[Tissue type]: BLCA[Bladder Urothelial Carcinoma], BRCA[Breast invasive carcinoma], CESC[Cervical squamous cell carcinoma and endocervical adenocarcinoma], COAD[Colon adenocarcinoma], GBM[Glioblastoma multiforme], Glioma Low Grade, HNSC[Head and Neck squamous cell carcinoma], KICH[Kidney Chromophobe], KIRC[Kidney renal clear cell carcinoma], KIRP[Kidney renal papillary cell carcinoma], LAML[Acute Myeloid Leukemia], LUAD[Lung adenocarcinoma], LUSC[Lung squamous cell carcinoma], OV[Ovarian serous cystadenocarcinoma ], PAAD[Pancreatic adenocarcinoma], PRAD[Prostate adenocarcinoma], SKCM[Skin Cutaneous Melanoma], STAD[Stomach adenocarcinoma], THCA[Thyroid carcinoma], UCEC[Uterine Corpus Endometrial Carcinoma] |
| Top |
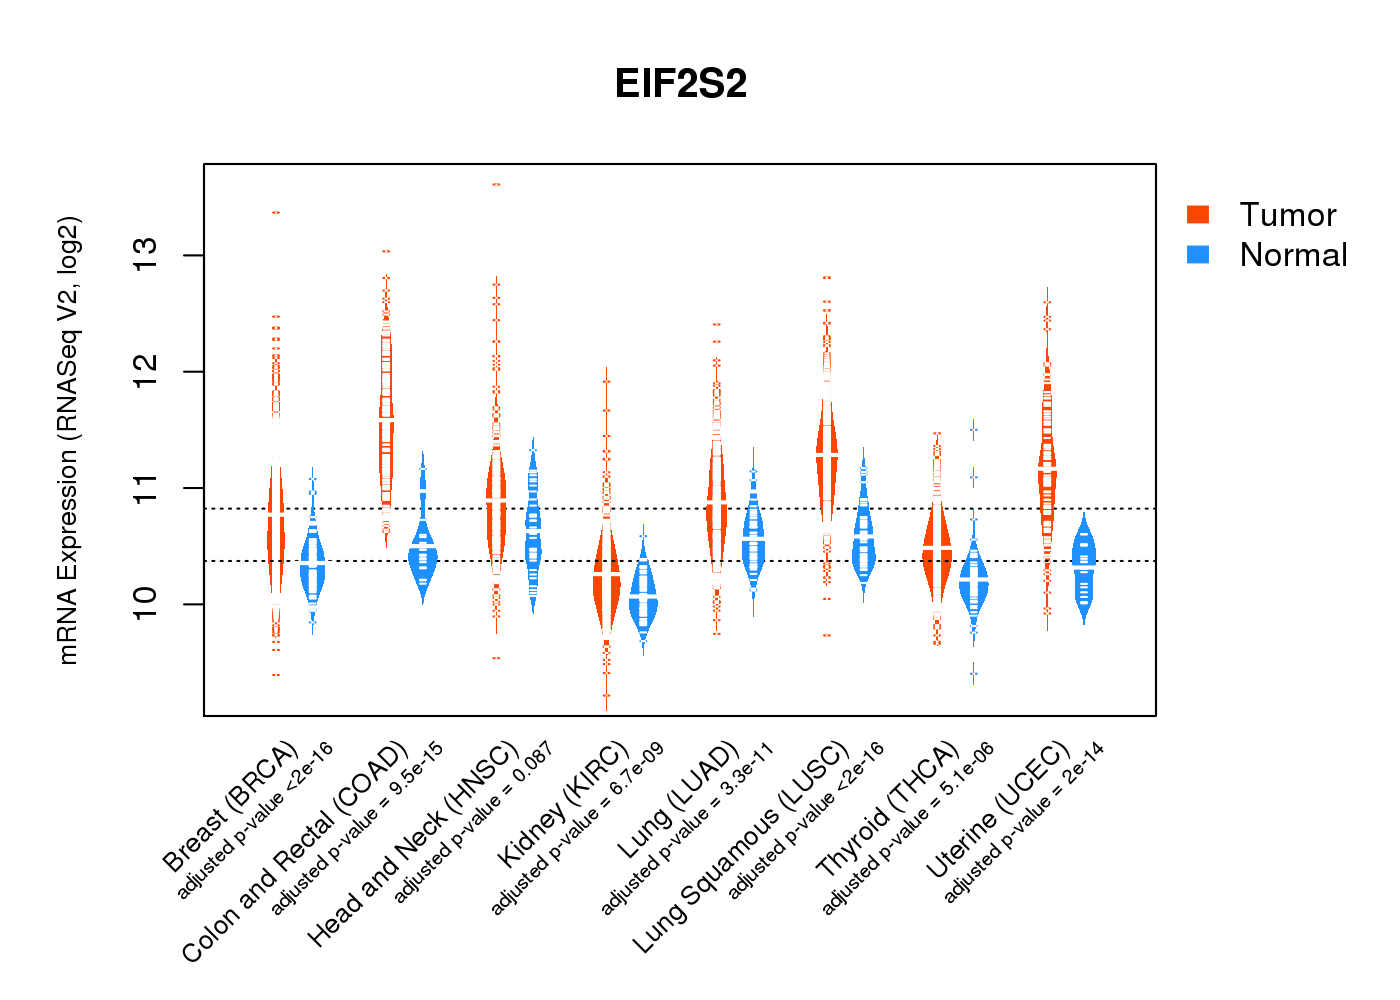
| Gene Expression for EIF2S2 |
| * CCLE gene expression data were extracted from CCLE_Expression_Entrez_2012-10-18.res: Gene-centric RMA-normalized mRNA expression data. |
 |
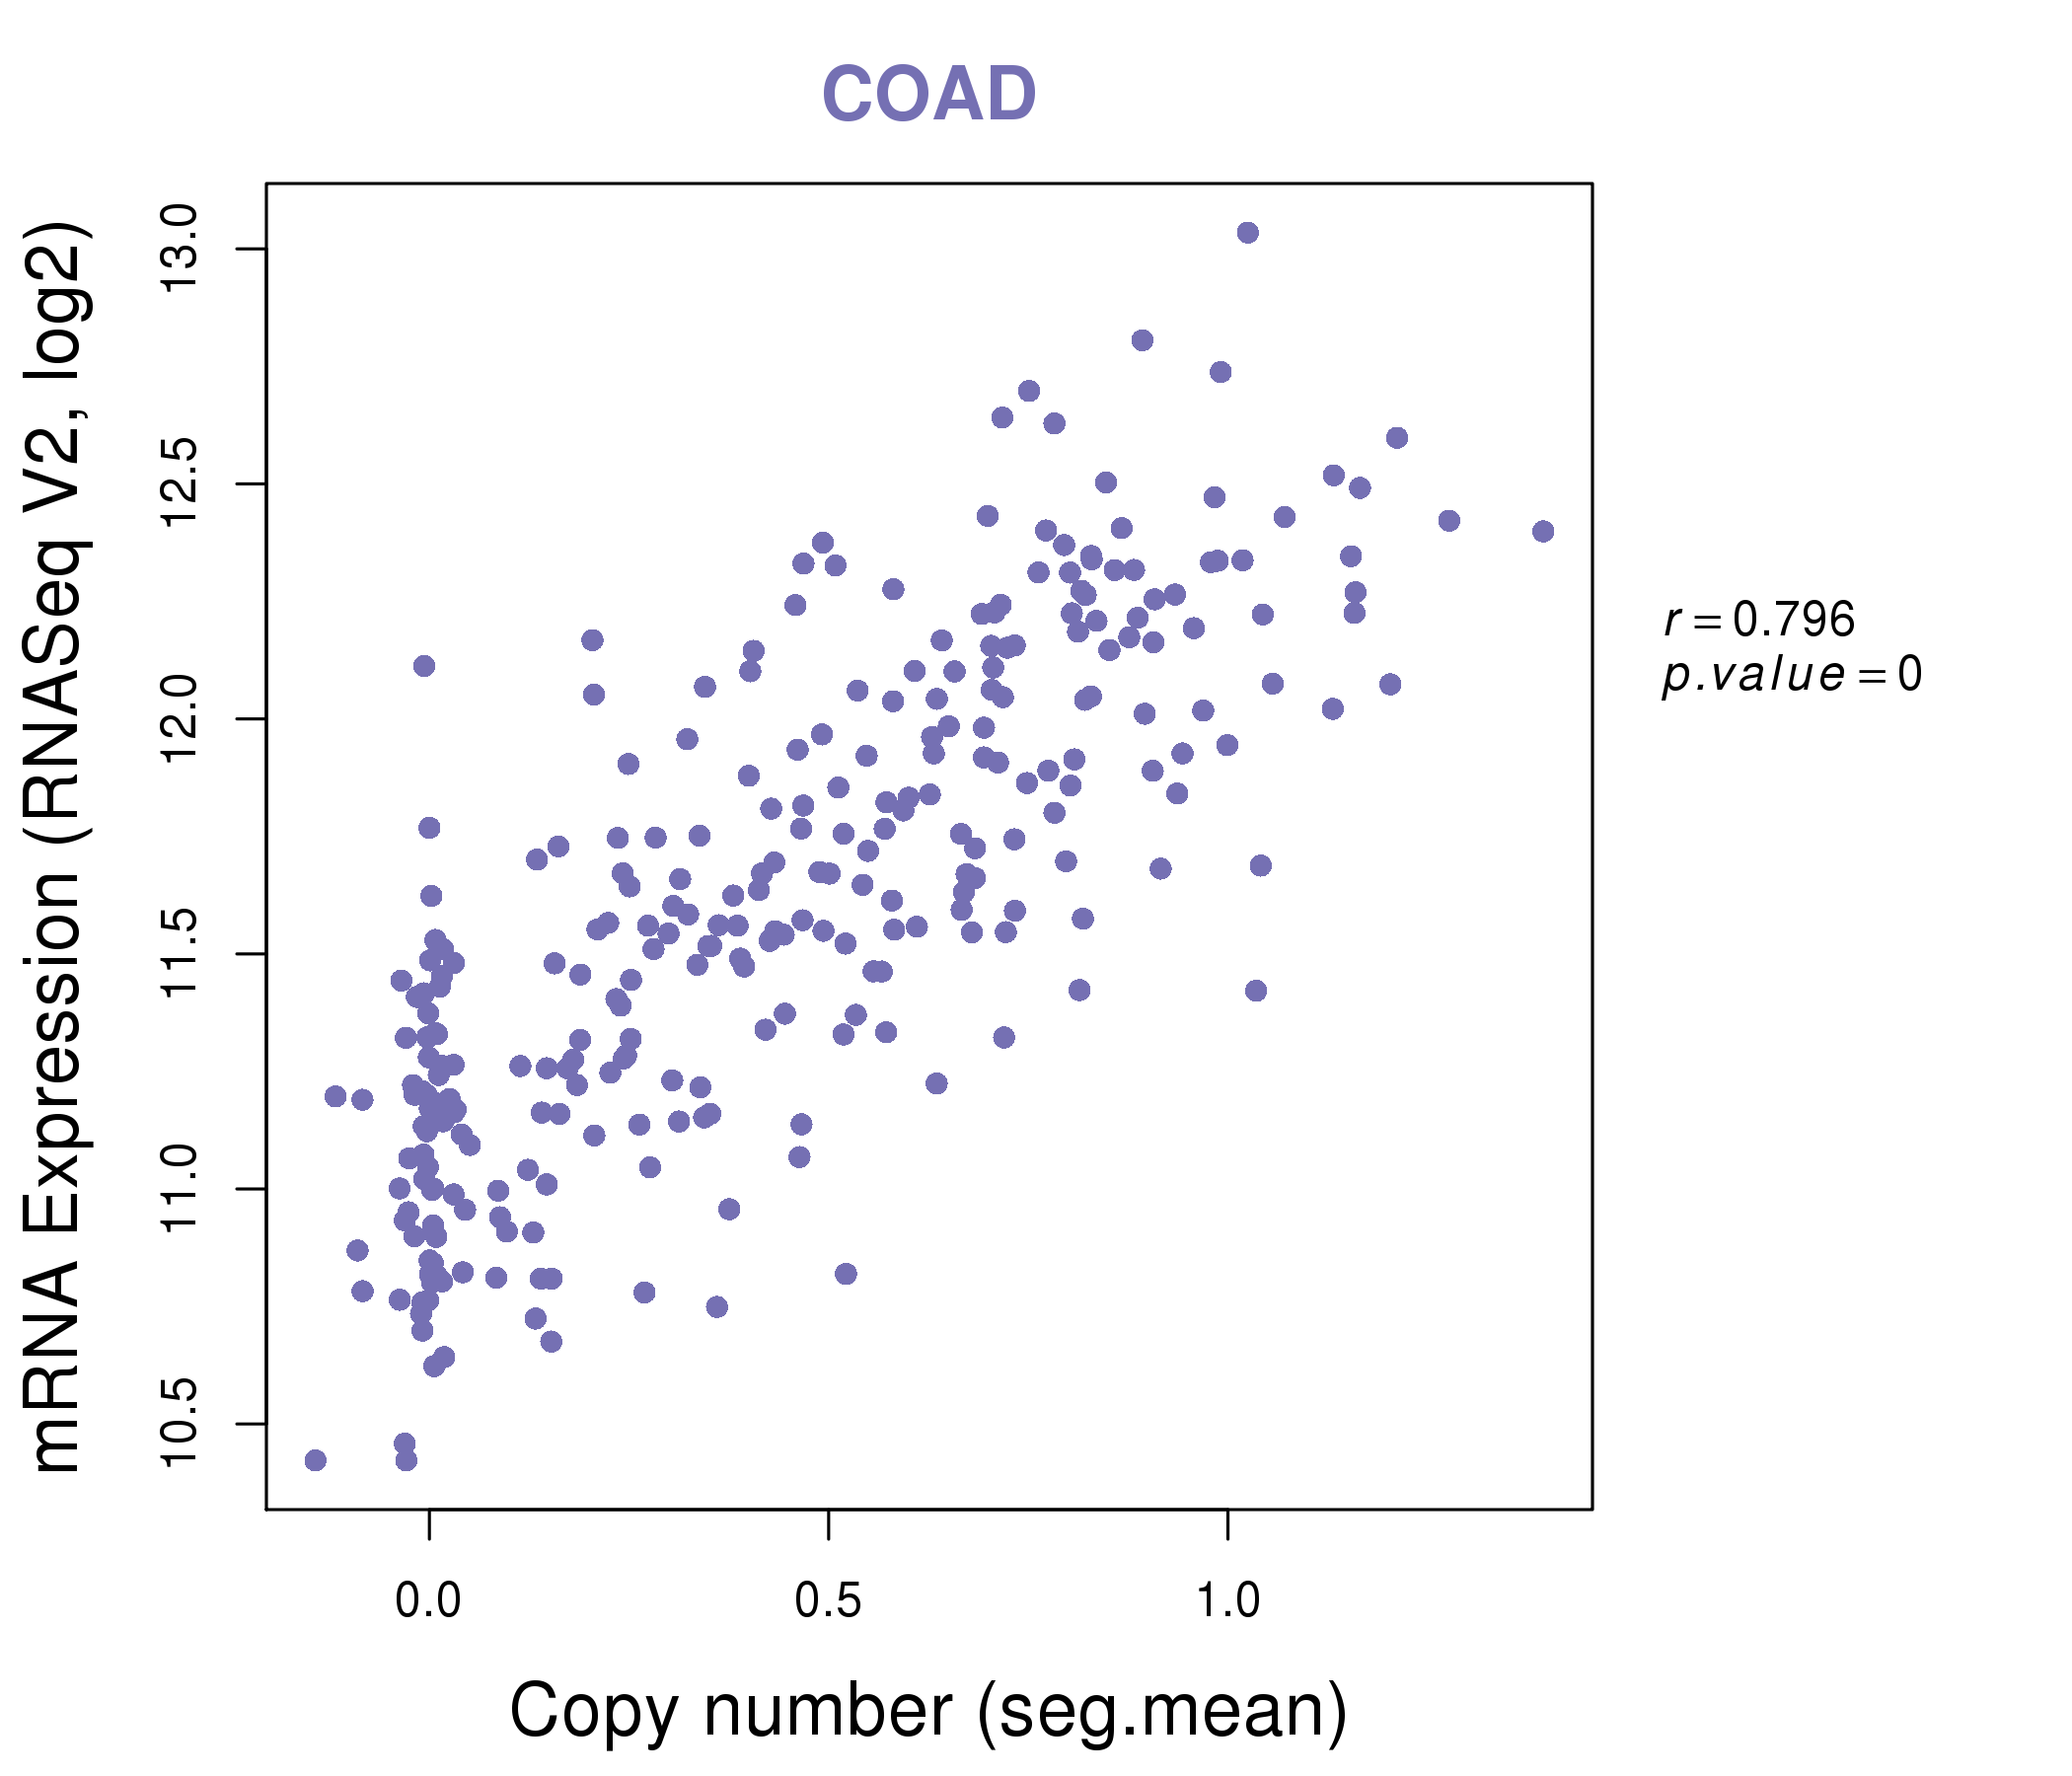
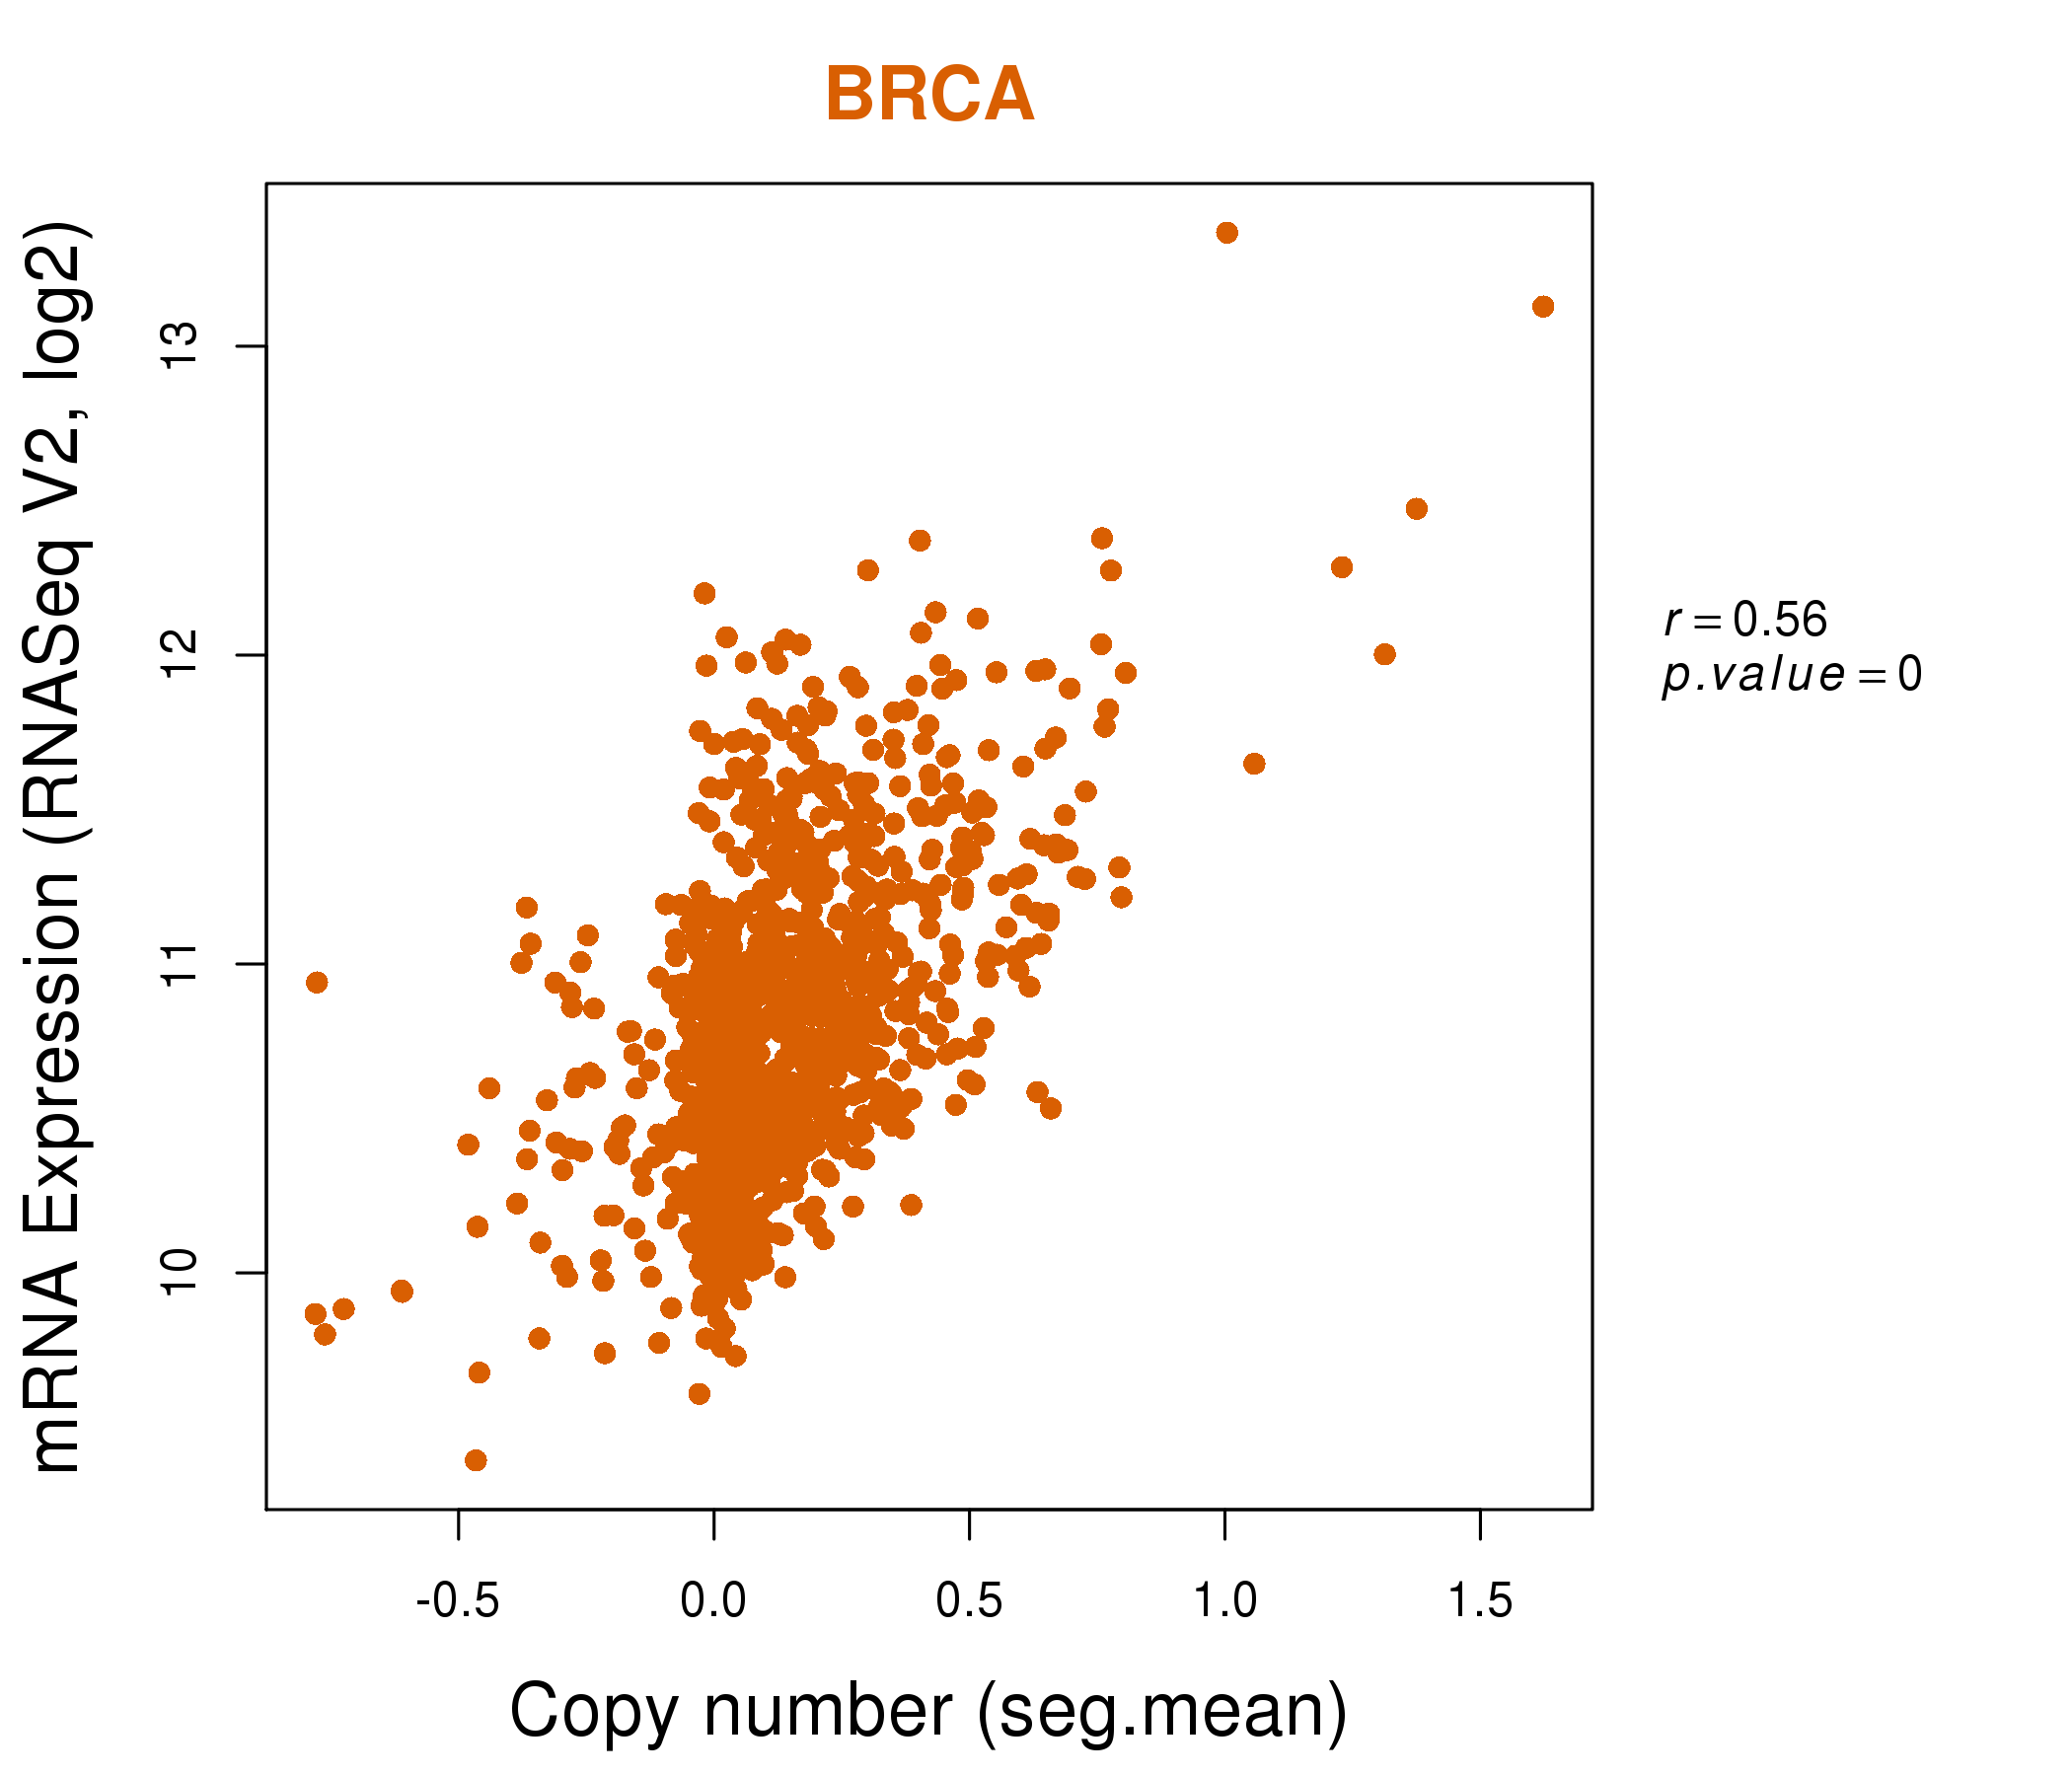
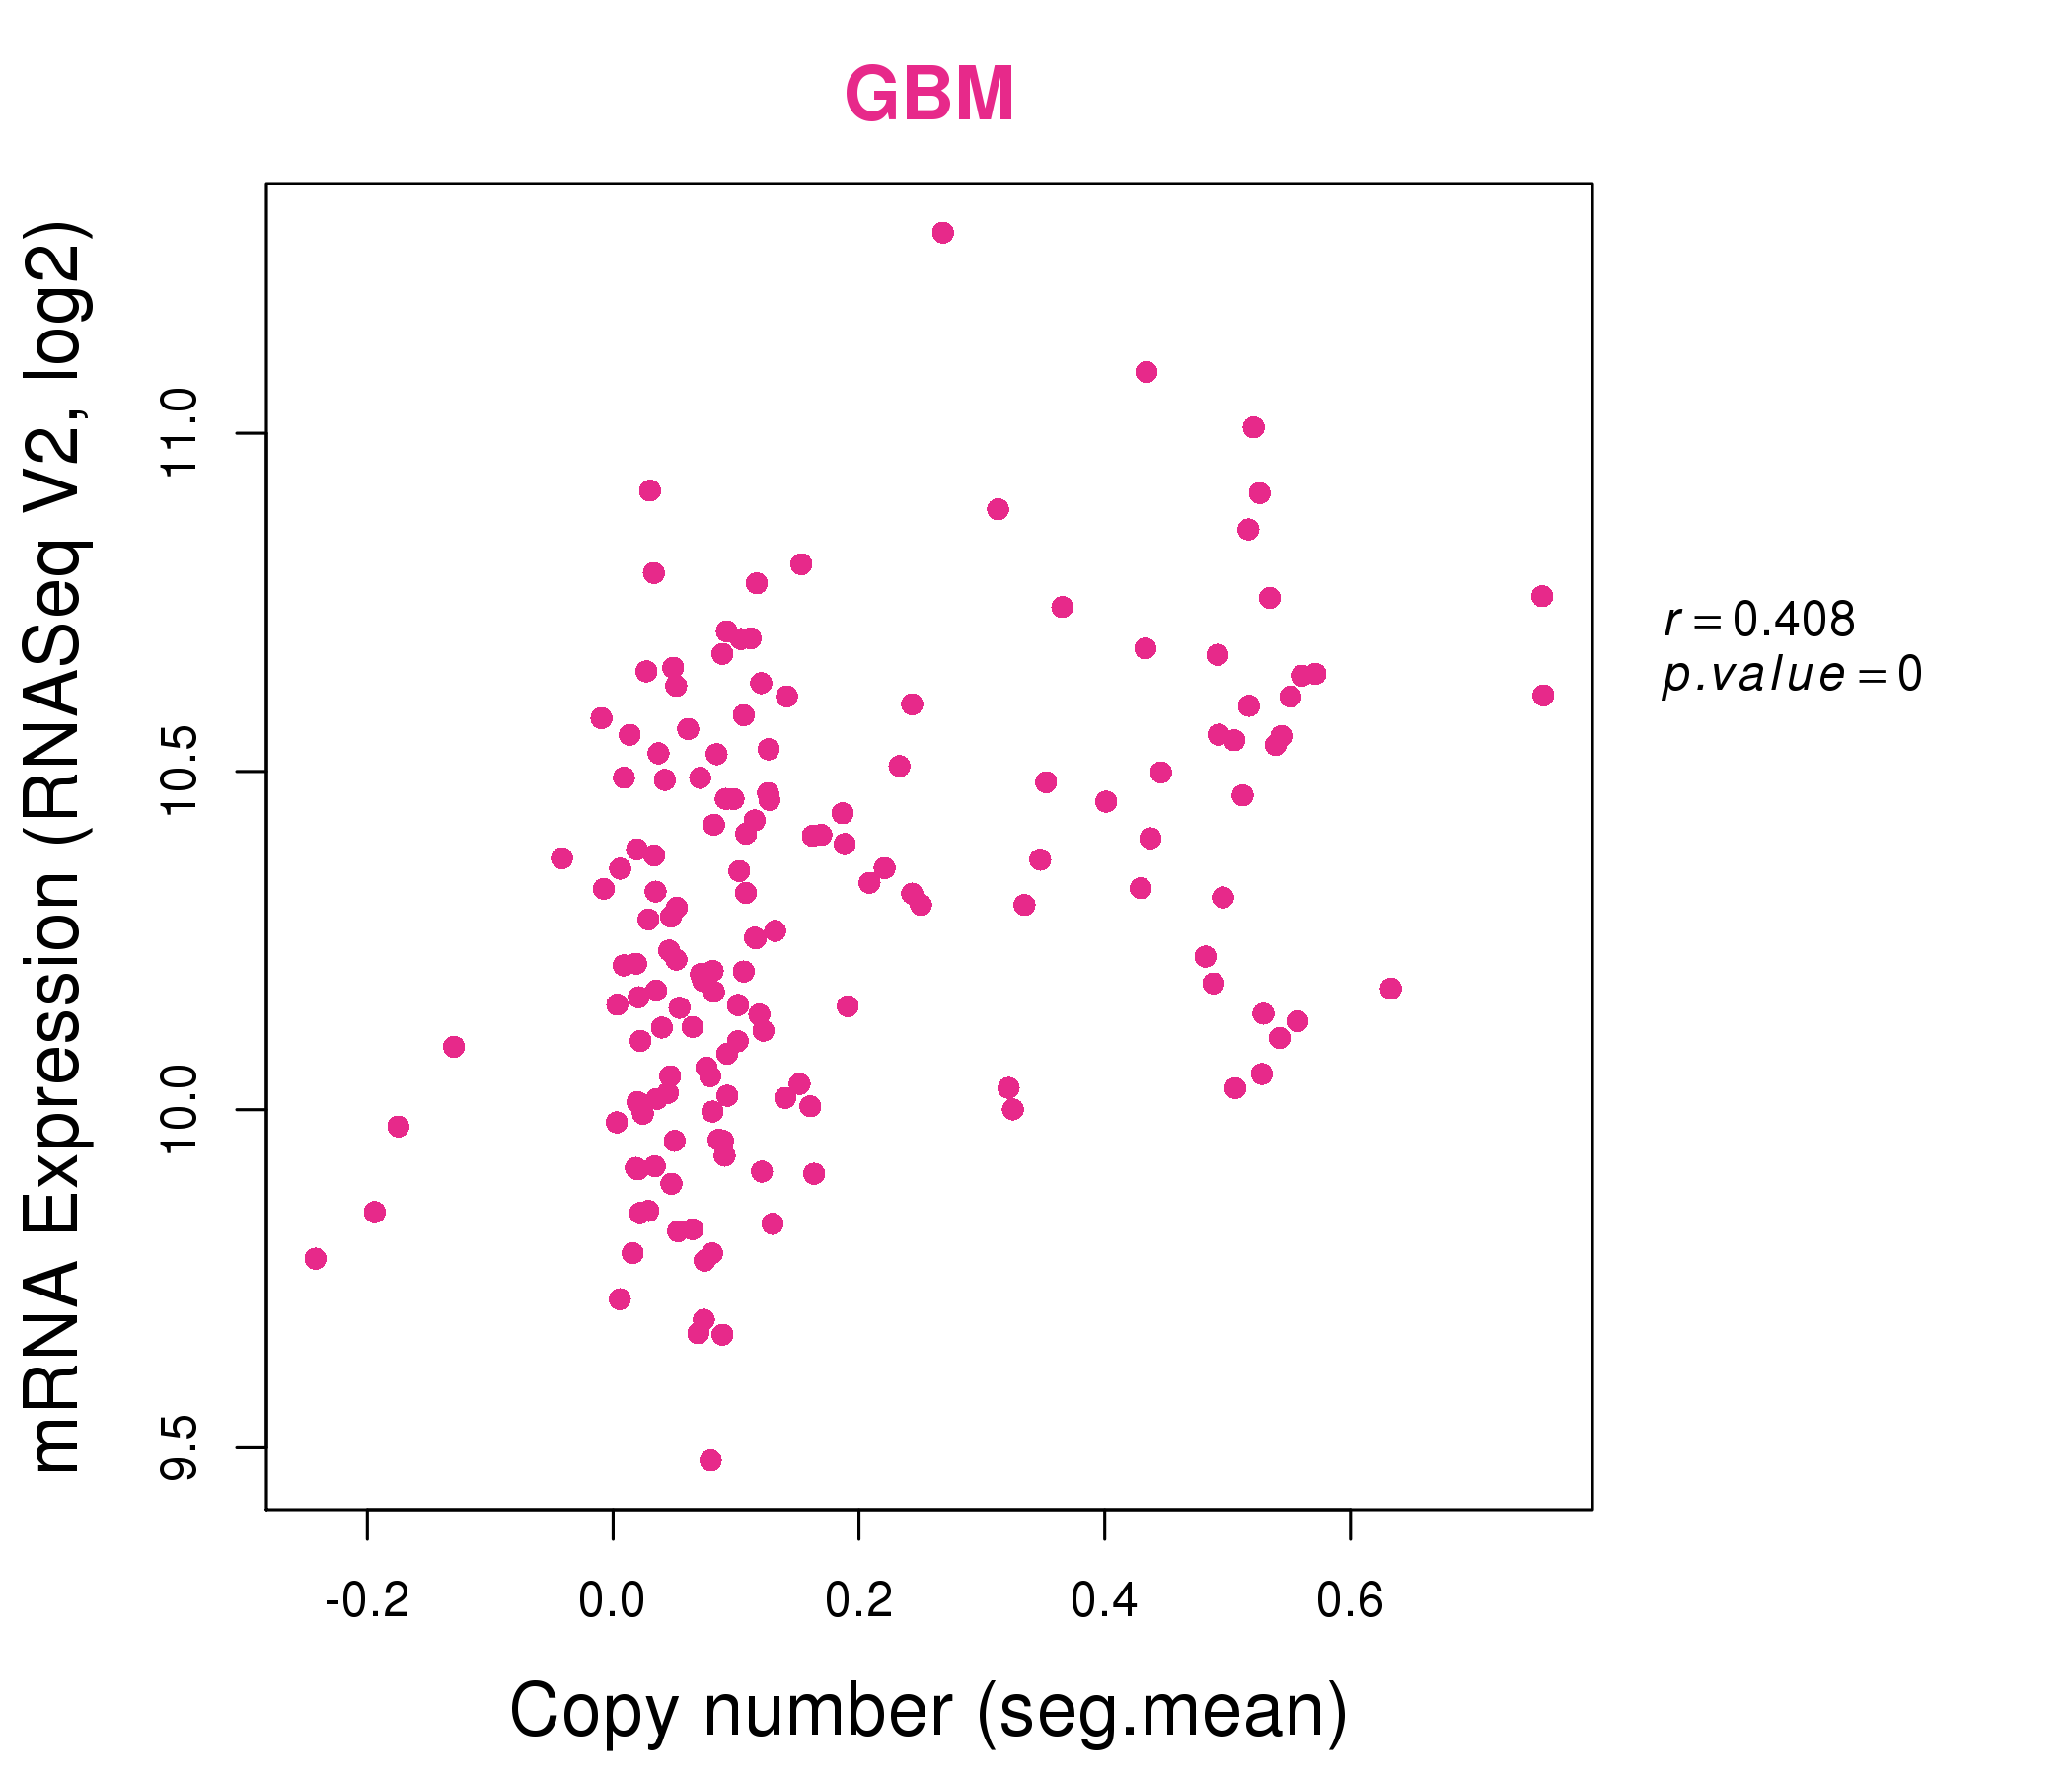
| * Normalized gene expression data of RNASeqV2 was extracted from TCGA using R package TCGA-Assembler. The URLs of all public data files on TCGA DCC data server were gathered at Jan-05-2015. Only eight cancer types have enough normal control samples for differential expression analysis. (t test, adjusted p<0.05 (using Benjamini-Hochberg FDR)) |
 |
| Top |
| * This plots show the correlation between CNV and gene expression. |
: Open all plots for all cancer types
 |
|
 |
|
| Top |
| Gene-Gene Network Information |
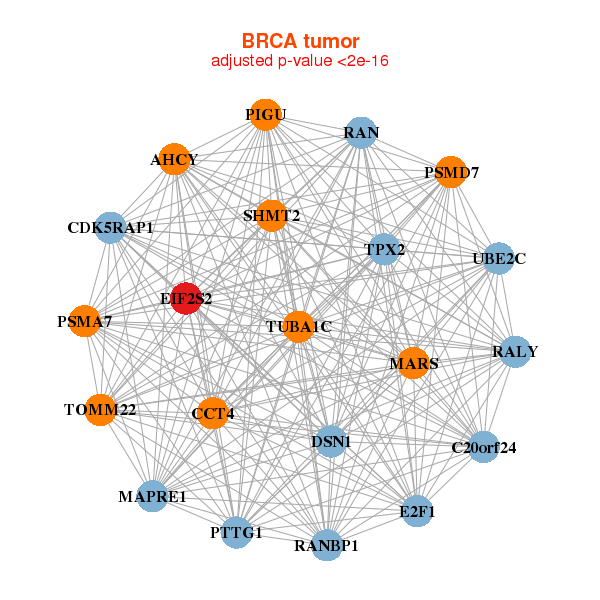
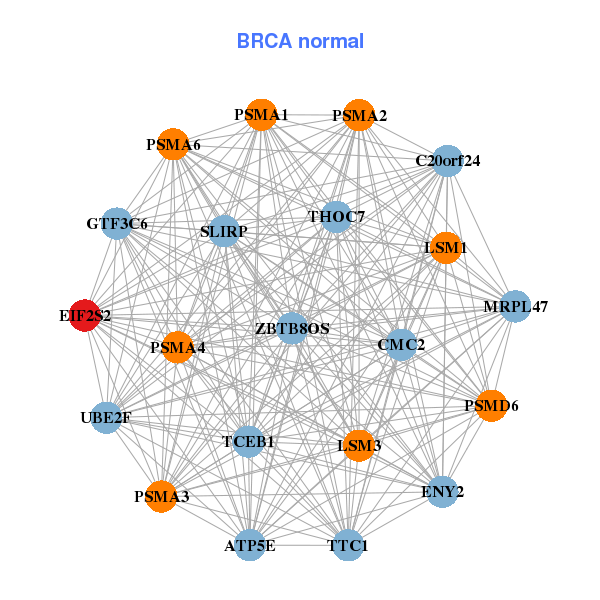
| * Co-Expression network figures were drawn using R package igraph. Only the top 20 genes with the highest correlations were shown. Red circle: input gene, orange circle: cell metabolism gene, sky circle: other gene |
: Open all plots for all cancer types
 |
| ||||
| AHCY,C20orf24,CCT4,CDK5RAP1,DSN1,E2F1,EIF2S2, MAPRE1,MARS,PIGU,PSMA7,PSMD7,PTTG1,RALY, RAN,RANBP1,SHMT2,TOMM22,TPX2,TUBA1C,UBE2C | ATP5E,SLIRP,CMC2,C20orf24,EIF2S2,ENY2,GTF3C6, LSM1,LSM3,MRPL47,PSMA1,PSMA2,PSMA3,PSMA4, PSMA6,PSMD6,TCEB1,THOC7,TTC1,UBE2F,ZBTB8OS | ||||
 |
| ||||
| C20orf24,AAR2,CDK5RAP1,CSE1L,CTNNBL1,DPM1,DSN1, EIF2S2,EIF6,TTI1,MAPRE1,MOCS3,PDRG1,PIGU, PSMA7,RAE1,RALY,NELFCD,TP53RK,UBE2V1,UQCC1 | DCUN1D5,EEF1E1,EIF2S2,EIF3I,EIF4A1,EIF5AL1,H2AFZ, HAT1,MAGOHB,MORF4L2,PFDN2,PSMB5,PSMC2,PSMD14, PSMD7,RAN,SNRPB2,SNRPD1,SNRPE,SSBP1,TIMM17A |
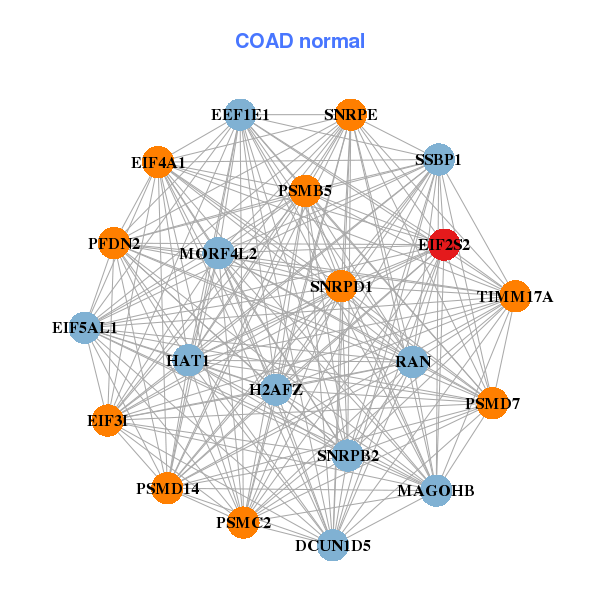
| * Co-Expression network figures were drawn using R package igraph. Only the top 20 genes with the highest correlations were shown. Red circle: input gene, orange circle: cell metabolism gene, sky circle: other gene |
: Open all plots for all cancer types
| Top |
: Open all interacting genes' information including KEGG pathway for all interacting genes from DAVID
| Top |
| Pharmacological Information for EIF2S2 |
| DB Category | DB Name | DB's ID and Url link |
| Organism-specific databases | PharmGKB | PA27696; -. |
| Organism-specific databases | CTD | 8894; -. |
| * Gene Centered Interaction Network. |
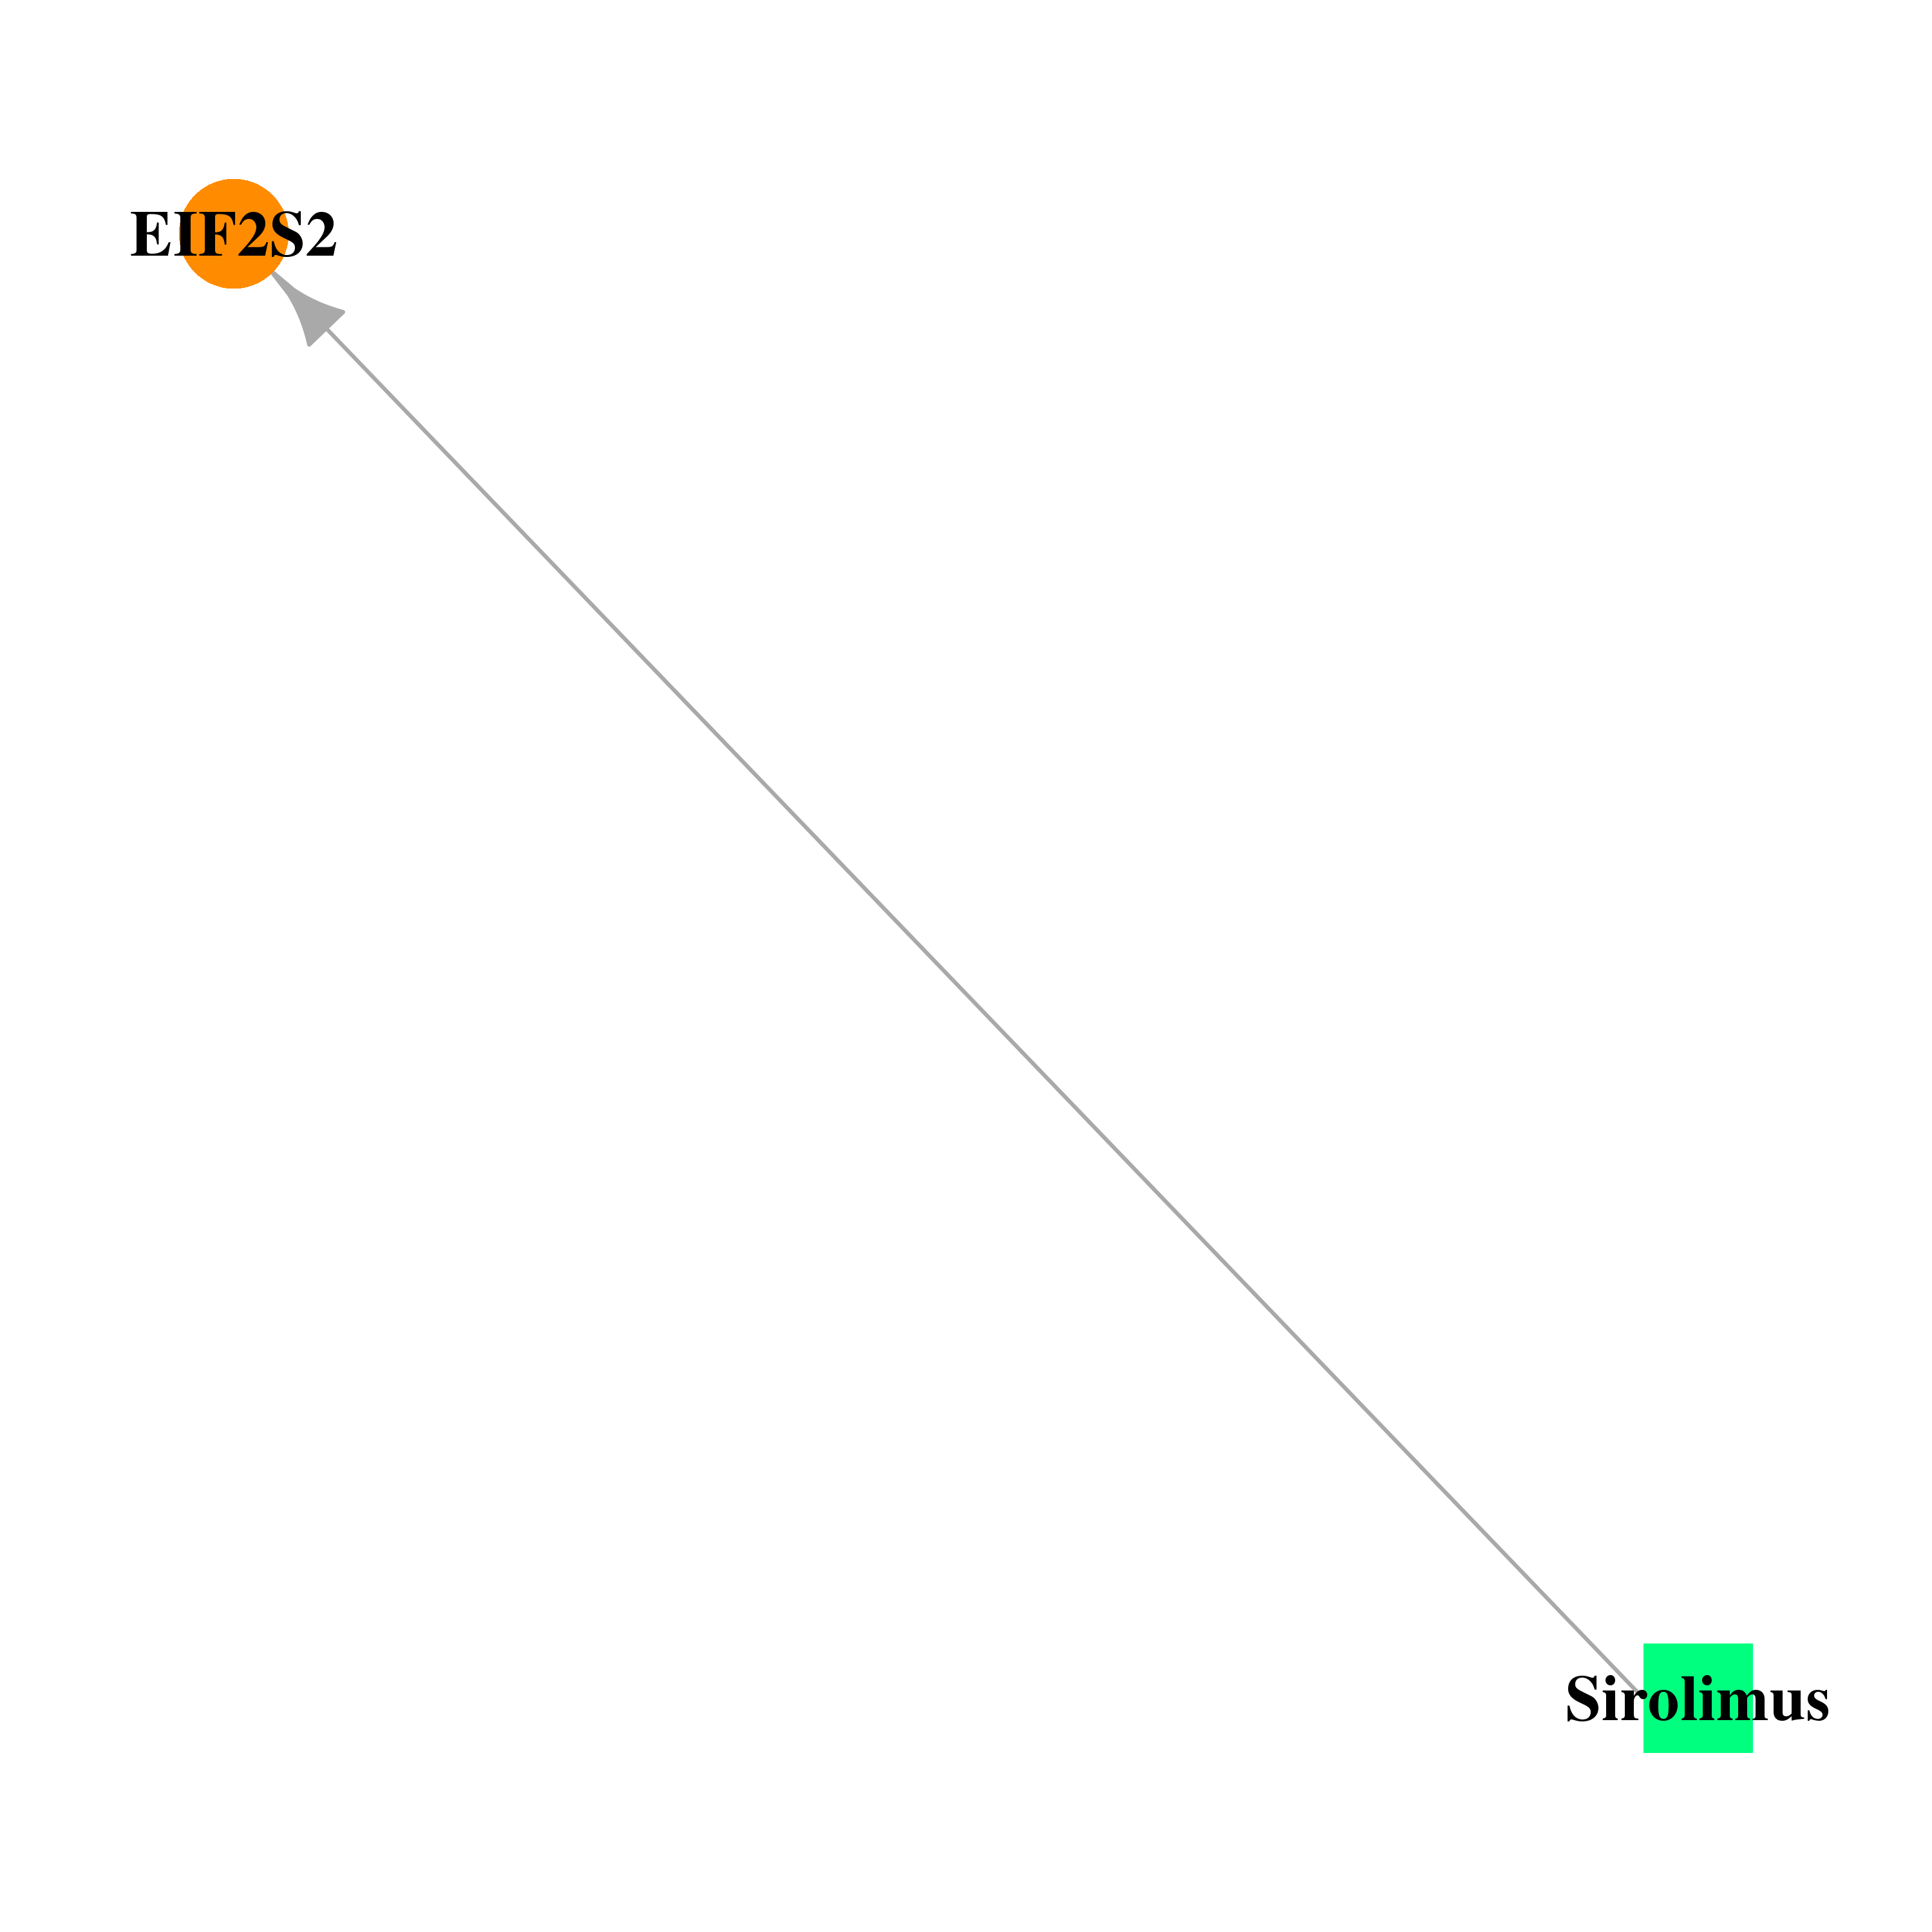 |
| * Drug Centered Interaction Network. |
| DrugBank ID | Target Name | Drug Groups | Generic Name | Drug Centered Network | Drug Structure |
| DB00877 | eukaryotic translation initiation factor 2, subunit 2 beta, 38kDa | approved; investigational | Sirolimus | 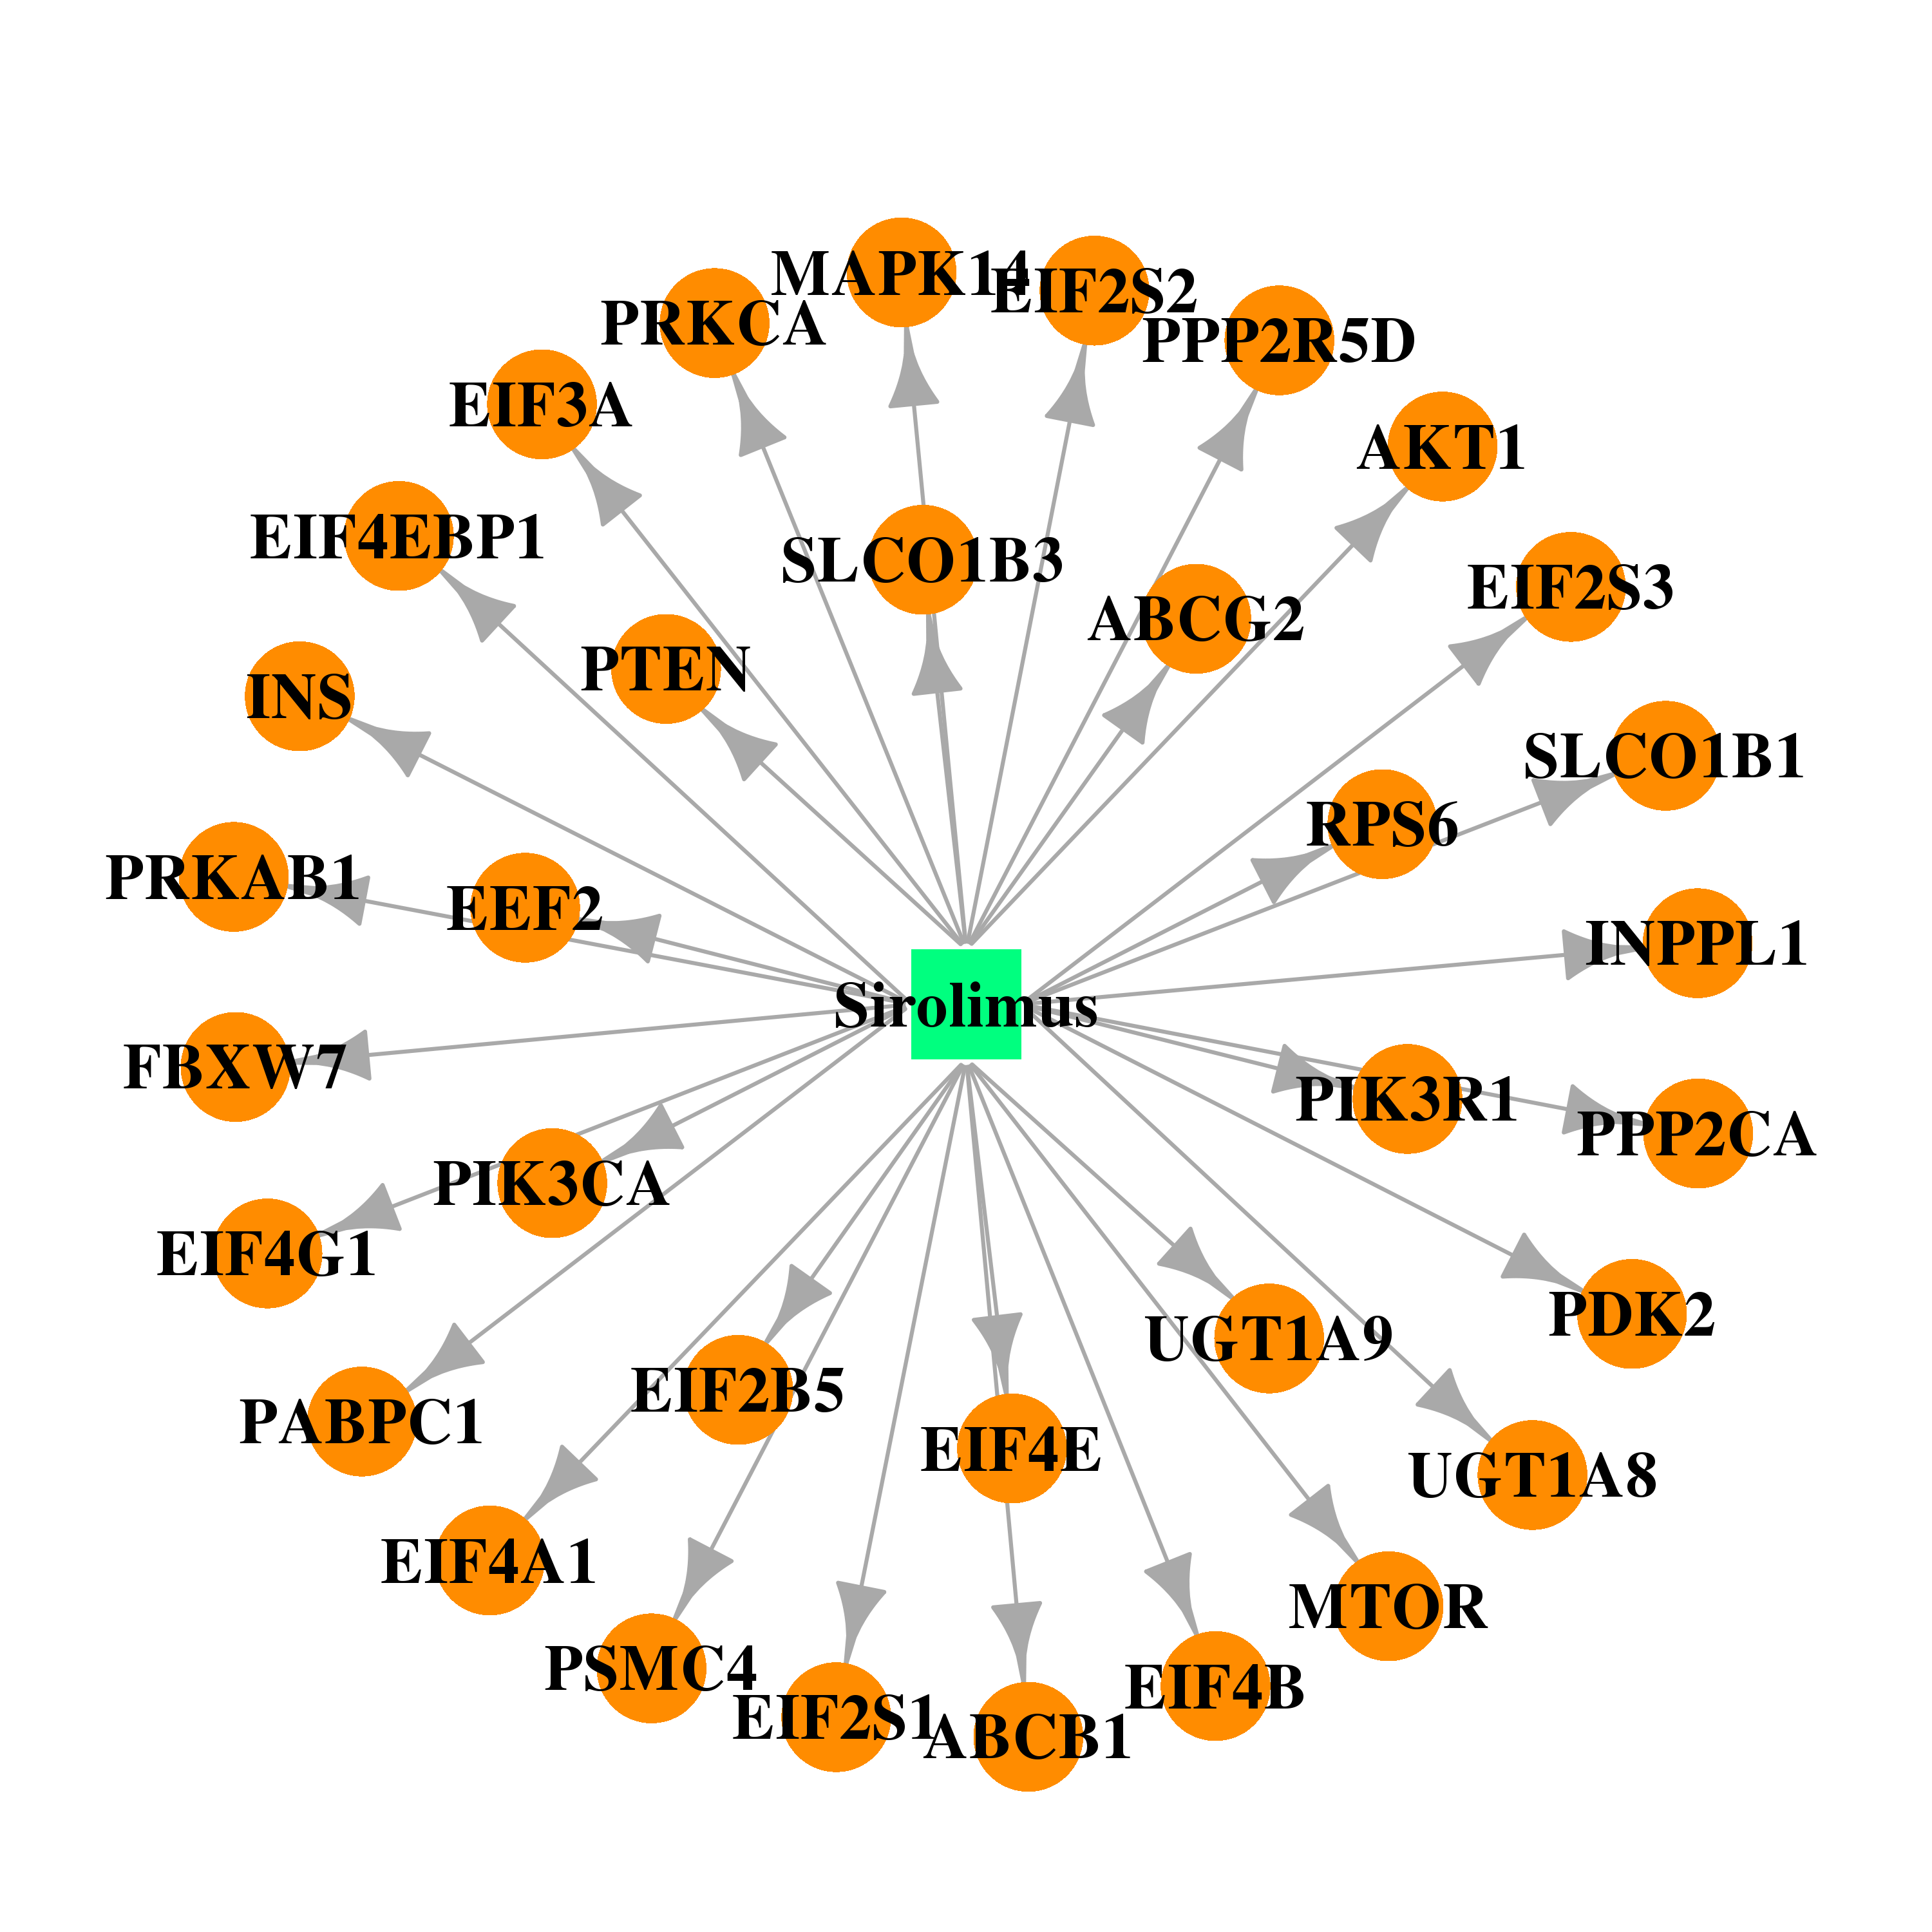 | 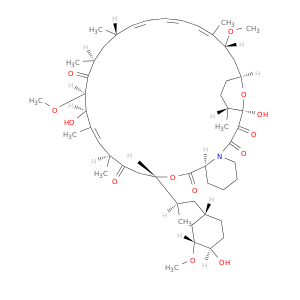 |
| Top |
| Cross referenced IDs for EIF2S2 |
| * We obtained these cross-references from Uniprot database. It covers 150 different DBs, 18 categories. http://www.uniprot.org/help/cross_references_section |
: Open all cross reference information
|
Copyright © 2016-Present - The Univsersity of Texas Health Science Center at Houston @ |