|
||||||||||||||||||||||||||||||||||||||||||||||||||||||||||||||||||||||||||||||||||||||||||||||||||||||||||||||||||||||||||||||||||||||||||||||||||||||||||||||||||||||||||||||||||||||||||||||||||||||||||||||||||||||||||||||||||||||||||||||||||||||||||||||||||||||||||||||||||||||||||||||||||||||||||||||||||||||||||
| |
| Phenotypic Information (metabolism pathway, cancer, disease, phenome) |
| |
| |
| Gene-Gene Network Information: Co-Expression Network, Interacting Genes & KEGG |
| |
|


| Gene Summary for MTMR3 |
| Basic gene info. | Gene symbol | MTMR3 |
| Gene name | myotubularin related protein 3 | |
| Synonyms | FYVE-DSP1|ZFYVE10 | |
| Cytomap | UCSC genome browser: 22q12.2 | |
| Genomic location | chr22 :30279157-30426857 | |
| Type of gene | protein-coding | |
| RefGenes | NM_021090.3, NM_153050.2,NM_153051.2,NM_001013676.1, | |
| Ensembl id | ENSG00000100330 | |
| Description | FYVE (Fab1 YGLO23 Vsp27 EEA1 domain) dual-specificity protein phosphataseFYVE domain-containing dual specificity protein phosphatase 1myotubularin-related protein 3phosphatidylinositol-3,5-bisphosphate 3-phosphatasephosphatidylinositol-3-phosphate pho | |
| Modification date | 20141207 | |
| dbXrefs | MIM : 603558 | |
| HGNC : HGNC | ||
| Ensembl : ENSG00000100330 | ||
| HPRD : 09151 | ||
| Protein | UniProt: go to UniProt's Cross Reference DB Table | |
| Expression | CleanEX: HS_MTMR3 | |
| BioGPS: 8897 | ||
| Gene Expression Atlas: ENSG00000100330 | ||
| The Human Protein Atlas: ENSG00000100330 | ||
| Pathway | NCI Pathway Interaction Database: MTMR3 | |
| KEGG: MTMR3 | ||
| REACTOME: MTMR3 | ||
| ConsensusPathDB | ||
| Pathway Commons: MTMR3 | ||
| Metabolism | MetaCyc: MTMR3 | |
| HUMANCyc: MTMR3 | ||
| Regulation | Ensembl's Regulation: ENSG00000100330 | |
| miRBase: chr22 :30,279,157-30,426,857 | ||
| TargetScan: NM_021090 | ||
| cisRED: ENSG00000100330 | ||
| Context | iHOP: MTMR3 | |
| cancer metabolism search in PubMed: MTMR3 | ||
| UCL Cancer Institute: MTMR3 | ||
| Assigned class in ccmGDB | C | |
| Top |
| Phenotypic Information for MTMR3(metabolism pathway, cancer, disease, phenome) |
| Cancer | CGAP: MTMR3 |
| Familial Cancer Database: MTMR3 | |
| * This gene is included in those cancer gene databases. |
|
|
|
|
|
|
| ||||||||||||||||||||||||||||||||||||||||||||||||||||||||||||||||||||||||||||||||||||||||||||||||||||||||||||||||||||||||||||||||||||||||||||||||||||||||||||||||||||||||||||||||||||||||||||||||||||||||||||||||||||||||||||||||||||||||||||||||||||||||||||||||||||||||||||||||||||||||||||||||||||||||||||||||||||
Oncogene 1 | Significant driver gene in | |||||||||||||||||||||||||||||||||||||||||||||||||||||||||||||||||||||||||||||||||||||||||||||||||||||||||||||||||||||||||||||||||||||||||||||||||||||||||||||||||||||||||||||||||||||||||||||||||||||||||||||||||||||||||||||||||||||||||||||||||||||||||||||||||||||||||||||||||||||||||||||||||||||||||||||||||||||||||
| cf) number; DB name 1 Oncogene; http://nar.oxfordjournals.org/content/35/suppl_1/D721.long, 2 Tumor Suppressor gene; https://bioinfo.uth.edu/TSGene/, 3 Cancer Gene Census; http://www.nature.com/nrc/journal/v4/n3/abs/nrc1299.html, 4 CancerGenes; http://nar.oxfordjournals.org/content/35/suppl_1/D721.long, 5 Network of Cancer Gene; http://ncg.kcl.ac.uk/index.php, 1Therapeutic Vulnerabilities in Cancer; http://cbio.mskcc.org/cancergenomics/statius/ |
| REACTOME_PHOSPHOLIPID_METABOLISM REACTOME_PI_METABOLISM REACTOME_METABOLISM_OF_LIPIDS_AND_LIPOPROTEINS | |
| OMIM | |
| Orphanet | |
| Disease | KEGG Disease: MTMR3 |
| MedGen: MTMR3 (Human Medical Genetics with Condition) | |
| ClinVar: MTMR3 | |
| Phenotype | MGI: MTMR3 (International Mouse Phenotyping Consortium) |
| PhenomicDB: MTMR3 | |
| Mutations for MTMR3 |
| * Under tables are showing count per each tissue to give us broad intuition about tissue specific mutation patterns.You can go to the detailed page for each mutation database's web site. |
| - Statistics for Tissue and Mutation type | Top |
 |
| - For Inter-chromosomal Variations |
| There's no inter-chromosomal structural variation. |
| - For Intra-chromosomal Variations |
| * Intra-chromosomal variantions includes 'intrachromosomal amplicon to amplicon', 'intrachromosomal amplicon to non-amplified dna', 'intrachromosomal deletion', 'intrachromosomal fold-back inversion', 'intrachromosomal inversion', 'intrachromosomal tandem duplication', 'Intrachromosomal unknown type', 'intrachromosomal with inverted orientation', 'intrachromosomal with non-inverted orientation'. |
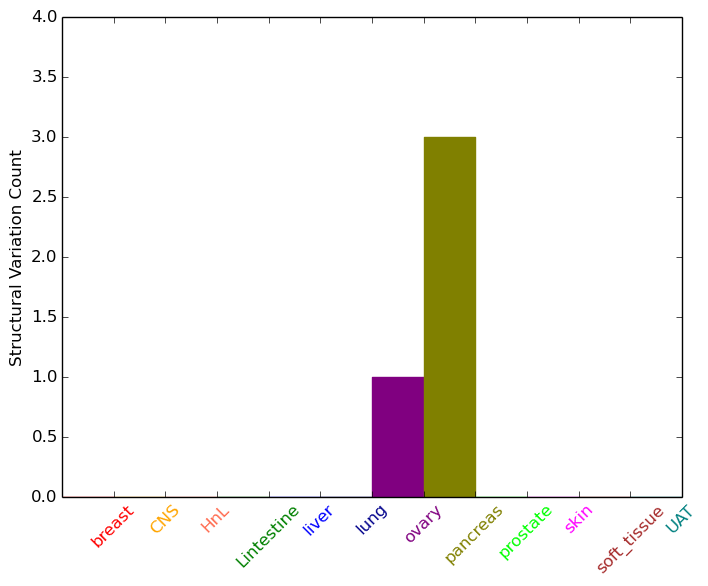 |
| Sample | Symbol_a | Chr_a | Start_a | End_a | Symbol_b | Chr_b | Start_b | End_b |
| ovary | MTMR3 | chr22 | 30374137 | 30374157 | MTMR3 | chr22 | 30370943 | 30370963 |
| pancreas | MTMR3 | chr22 | 30287505 | 30287705 | chr22 | 35999595 | 35999795 | |
| pancreas | MTMR3 | chr22 | 30301243 | 30301263 | NF2 | chr22 | 30058981 | 30059001 |
| pancreas | MTMR3 | chr22 | 30335572 | 30335592 | NEFH | chr22 | 29879547 | 29879567 |
| cf) Tissue number; Tissue name (1;Breast, 2;Central_nervous_system, 3;Haematopoietic_and_lymphoid_tissue, 4;Large_intestine, 5;Liver, 6;Lung, 7;Ovary, 8;Pancreas, 9;Prostate, 10;Skin, 11;Soft_tissue, 12;Upper_aerodigestive_tract) |
| * From mRNA Sanger sequences, Chitars2.0 arranged chimeric transcripts. This table shows MTMR3 related fusion information. |
| ID | Head Gene | Tail Gene | Accession | Gene_a | qStart_a | qEnd_a | Chromosome_a | tStart_a | tEnd_a | Gene_a | qStart_a | qEnd_a | Chromosome_a | tStart_a | tEnd_a |
| BG469920 | MTMR3 | 2 | 124 | 22 | 30279226 | 30279348 | APOH | 124 | 873 | 17 | 64212981 | 64225541 | |
| BG824141 | MTMR3 | 2 | 178 | 22 | 30279172 | 30279348 | APOH | 178 | 827 | 17 | 64216676 | 64225541 | |
| BE764648 | LOC286467 | 15 | 95 | X | 130942349 | 130942428 | MTMR3 | 88 | 262 | 22 | 30423444 | 30423618 | |
| T05096 | MTMR3 | 1 | 105 | 22 | 30304242 | 30304346 | BRWD1 | 105 | 373 | 21 | 40560343 | 40560610 | |
| Top |
| Mutation type/ Tissue ID | brca | cns | cerv | endome | haematopo | kidn | Lintest | liver | lung | ns | ovary | pancre | prost | skin | stoma | thyro | urina | |||
| Total # sample | 1 | 2 | 1 | 1 | 1 | |||||||||||||||
| GAIN (# sample) | 1 | 1 | 1 | 1 | 1 | |||||||||||||||
| LOSS (# sample) | 1 |
| cf) Tissue ID; Tissue type (1; Breast, 2; Central_nervous_system, 3; Cervix, 4; Endometrium, 5; Haematopoietic_and_lymphoid_tissue, 6; Kidney, 7; Large_intestine, 8; Liver, 9; Lung, 10; NS, 11; Ovary, 12; Pancreas, 13; Prostate, 14; Skin, 15; Stomach, 16; Thyroid, 17; Urinary_tract) |
| Top |
|
 |
| Top |
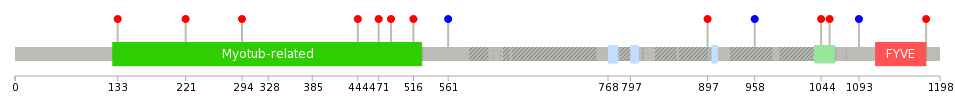
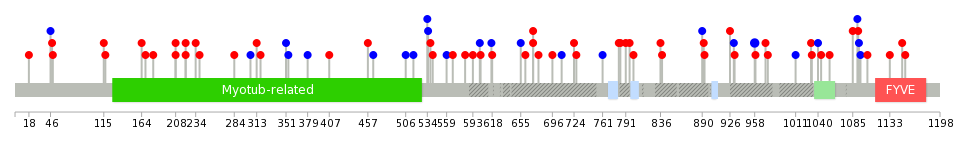
| Stat. for Non-Synonymous SNVs (# total SNVs=3) | (# total SNVs=2) |
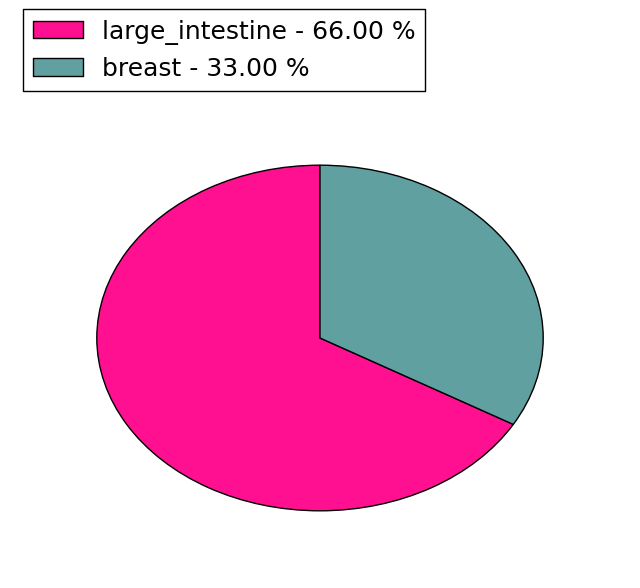 | 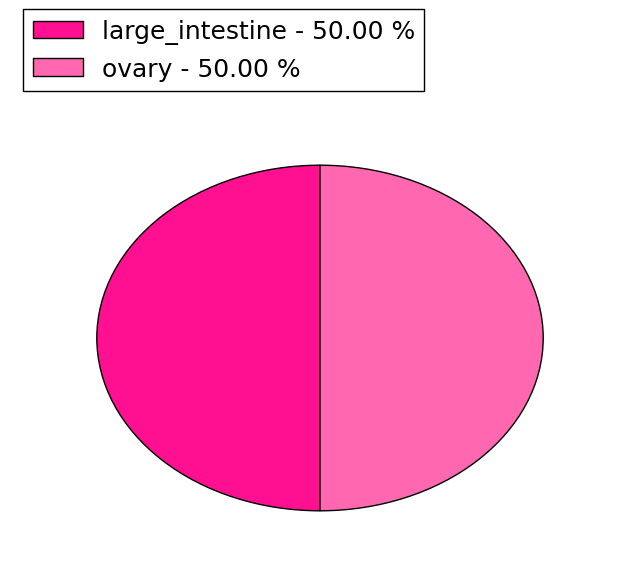 |
(# total SNVs=1) | (# total SNVs=2) |
 |  |
| Top |
| * When you move the cursor on each content, you can see more deailed mutation information on the Tooltip. Those are primary_site,primary_histology,mutation(aa),pubmedID. |
| GRCh37 position | Mutation(aa) | Unique sampleID count |
| chr22:30416328-30416329 | p.Q894fs*8 | 2 |
| chr22:30409486-30409486 | p.Q487K | 1 |
| chr22:30412561-30412561 | p.F516L | 1 |
| chr22:30413924-30413924 | p.Y561Y | 1 |
| chr22:30416336-30416338 | p.S897delS | 1 |
| chr22:30387596-30387596 | p.H133Y | 1 |
| chr22:30416522-30416522 | p.C958C | 1 |
| chr22:30398972-30398972 | p.V221L | 1 |
| chr22:30416779-30416779 | p.T1044I | 1 |
| chr22:30403266-30403266 | p.R279* | 1 |
| Top |
|
 |
| Point Mutation/ Tissue ID | 1 | 2 | 3 | 4 | 5 | 6 | 7 | 8 | 9 | 10 | 11 | 12 | 13 | 14 | 15 | 16 | 17 | 18 | 19 | 20 |
| # sample | 5 | 3 | 11 | 1 | 1 | 3 | 1 | 1 | 4 | 7 | 1 | 12 | 13 | 1 | 7 | |||||
| # mutation | 5 | 3 | 12 | 1 | 1 | 3 | 1 | 1 | 6 | 7 | 1 | 14 | 13 | 1 | 9 | |||||
| nonsynonymous SNV | 5 | 3 | 8 | 1 | 1 | 1 | 4 | 7 | 10 | 9 | 1 | 5 | ||||||||
| synonymous SNV | 4 | 1 | 2 | 1 | 2 | 1 | 4 | 4 | 4 |
| cf) Tissue ID; Tissue type (1; BLCA[Bladder Urothelial Carcinoma], 2; BRCA[Breast invasive carcinoma], 3; CESC[Cervical squamous cell carcinoma and endocervical adenocarcinoma], 4; COAD[Colon adenocarcinoma], 5; GBM[Glioblastoma multiforme], 6; Glioma Low Grade, 7; HNSC[Head and Neck squamous cell carcinoma], 8; KICH[Kidney Chromophobe], 9; KIRC[Kidney renal clear cell carcinoma], 10; KIRP[Kidney renal papillary cell carcinoma], 11; LAML[Acute Myeloid Leukemia], 12; LUAD[Lung adenocarcinoma], 13; LUSC[Lung squamous cell carcinoma], 14; OV[Ovarian serous cystadenocarcinoma ], 15; PAAD[Pancreatic adenocarcinoma], 16; PRAD[Prostate adenocarcinoma], 17; SKCM[Skin Cutaneous Melanoma], 18:STAD[Stomach adenocarcinoma], 19:THCA[Thyroid carcinoma], 20:UCEC[Uterine Corpus Endometrial Carcinoma]) |
| Top |
| * We represented just top 10 SNVs. When you move the cursor on each content, you can see more deailed mutation information on the Tooltip. Those are primary_site, primary_histology, mutation(aa), pubmedID. |
| Genomic Position | Mutation(aa) | Unique sampleID count |
| chr22:30416522 | p.R671K,MTMR3 | 2 |
| chr22:30415660 | p.S208T,MTMR3 | 2 |
| chr22:30398934 | p.C958C,MTMR3 | 2 |
| chr22:30403950 | p.Y593S,MTMR3 | 1 |
| chr22:30416000 | p.V791F,MTMR3 | 1 |
| chr22:30412618 | p.L1031M,MTMR3 | 1 |
| chr22:30416442 | p.G46G,MTMR3 | 1 |
| chr22:30394779 | p.R318H,MTMR3 | 1 |
| chr22:30415613 | p.D602D,MTMR3 | 1 |
| chr22:30418045 | p.F796S,MTMR3 | 1 |
| * Copy number data were extracted from TCGA using R package TCGA-Assembler. The URLs of all public data files on TCGA DCC data server were gathered on Jan-05-2015. Function ProcessCNAData in TCGA-Assembler package was used to obtain gene-level copy number value which is calculated as the average copy number of the genomic region of a gene. |
 |
| cf) Tissue ID[Tissue type]: BLCA[Bladder Urothelial Carcinoma], BRCA[Breast invasive carcinoma], CESC[Cervical squamous cell carcinoma and endocervical adenocarcinoma], COAD[Colon adenocarcinoma], GBM[Glioblastoma multiforme], Glioma Low Grade, HNSC[Head and Neck squamous cell carcinoma], KICH[Kidney Chromophobe], KIRC[Kidney renal clear cell carcinoma], KIRP[Kidney renal papillary cell carcinoma], LAML[Acute Myeloid Leukemia], LUAD[Lung adenocarcinoma], LUSC[Lung squamous cell carcinoma], OV[Ovarian serous cystadenocarcinoma ], PAAD[Pancreatic adenocarcinoma], PRAD[Prostate adenocarcinoma], SKCM[Skin Cutaneous Melanoma], STAD[Stomach adenocarcinoma], THCA[Thyroid carcinoma], UCEC[Uterine Corpus Endometrial Carcinoma] |
| Top |
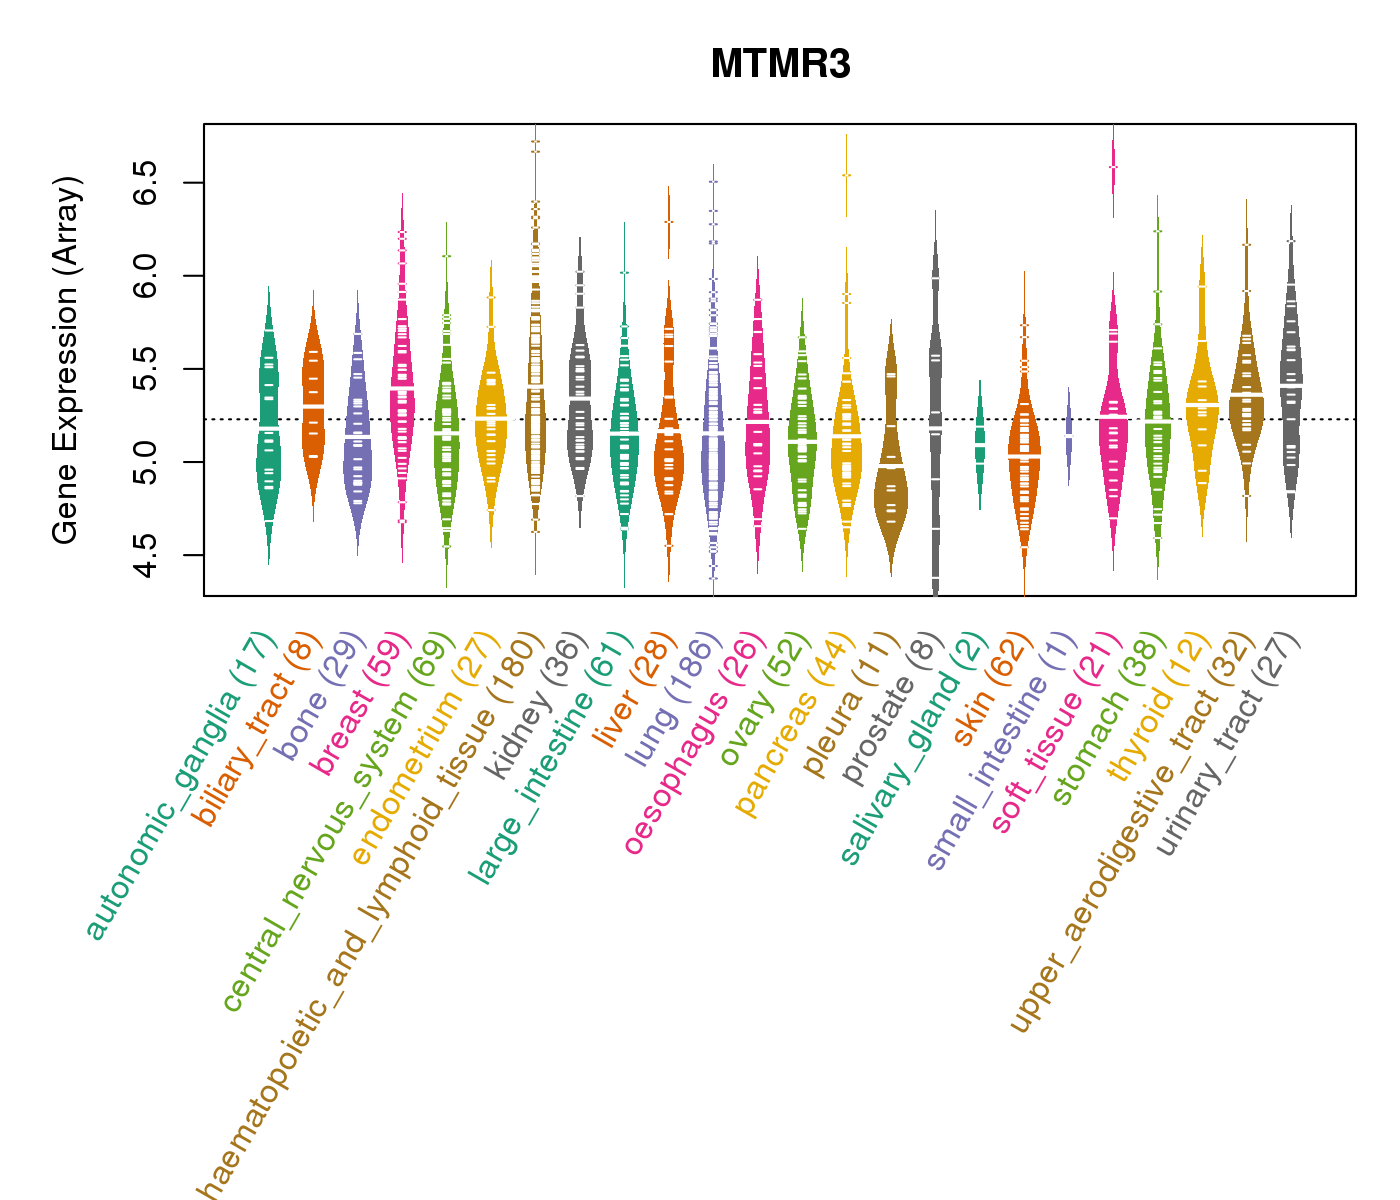
| Gene Expression for MTMR3 |
| * CCLE gene expression data were extracted from CCLE_Expression_Entrez_2012-10-18.res: Gene-centric RMA-normalized mRNA expression data. |
 |
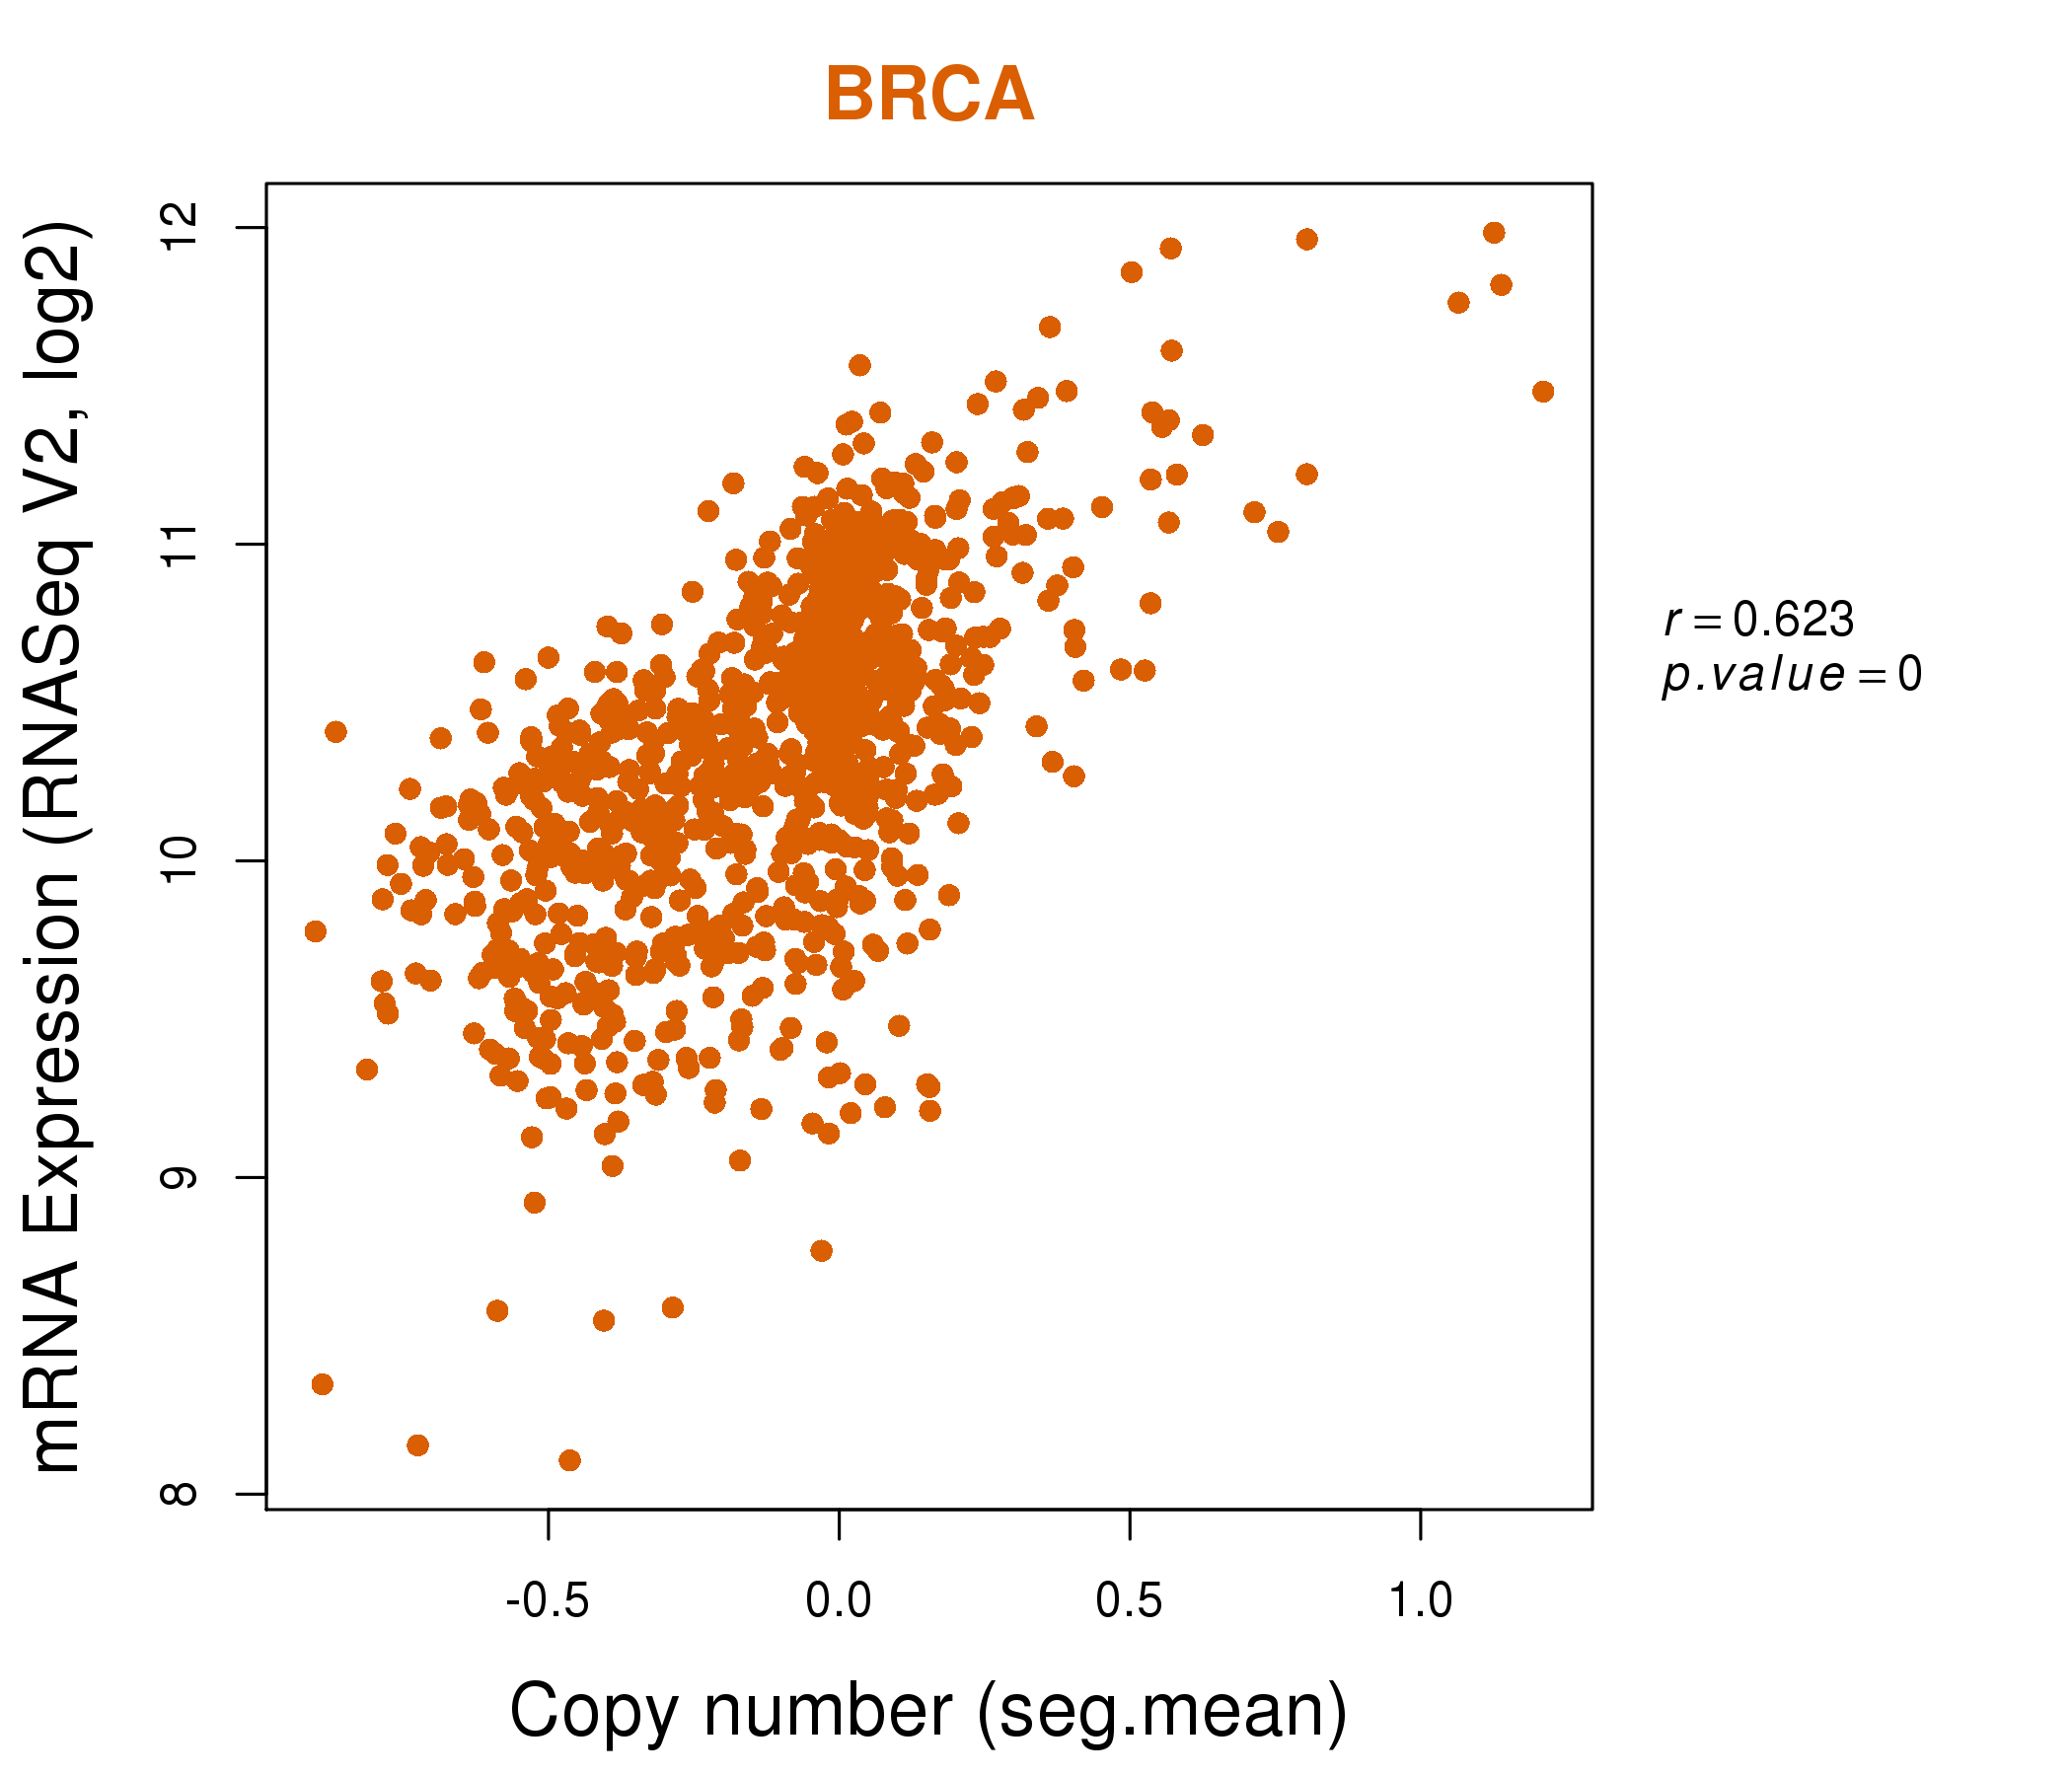
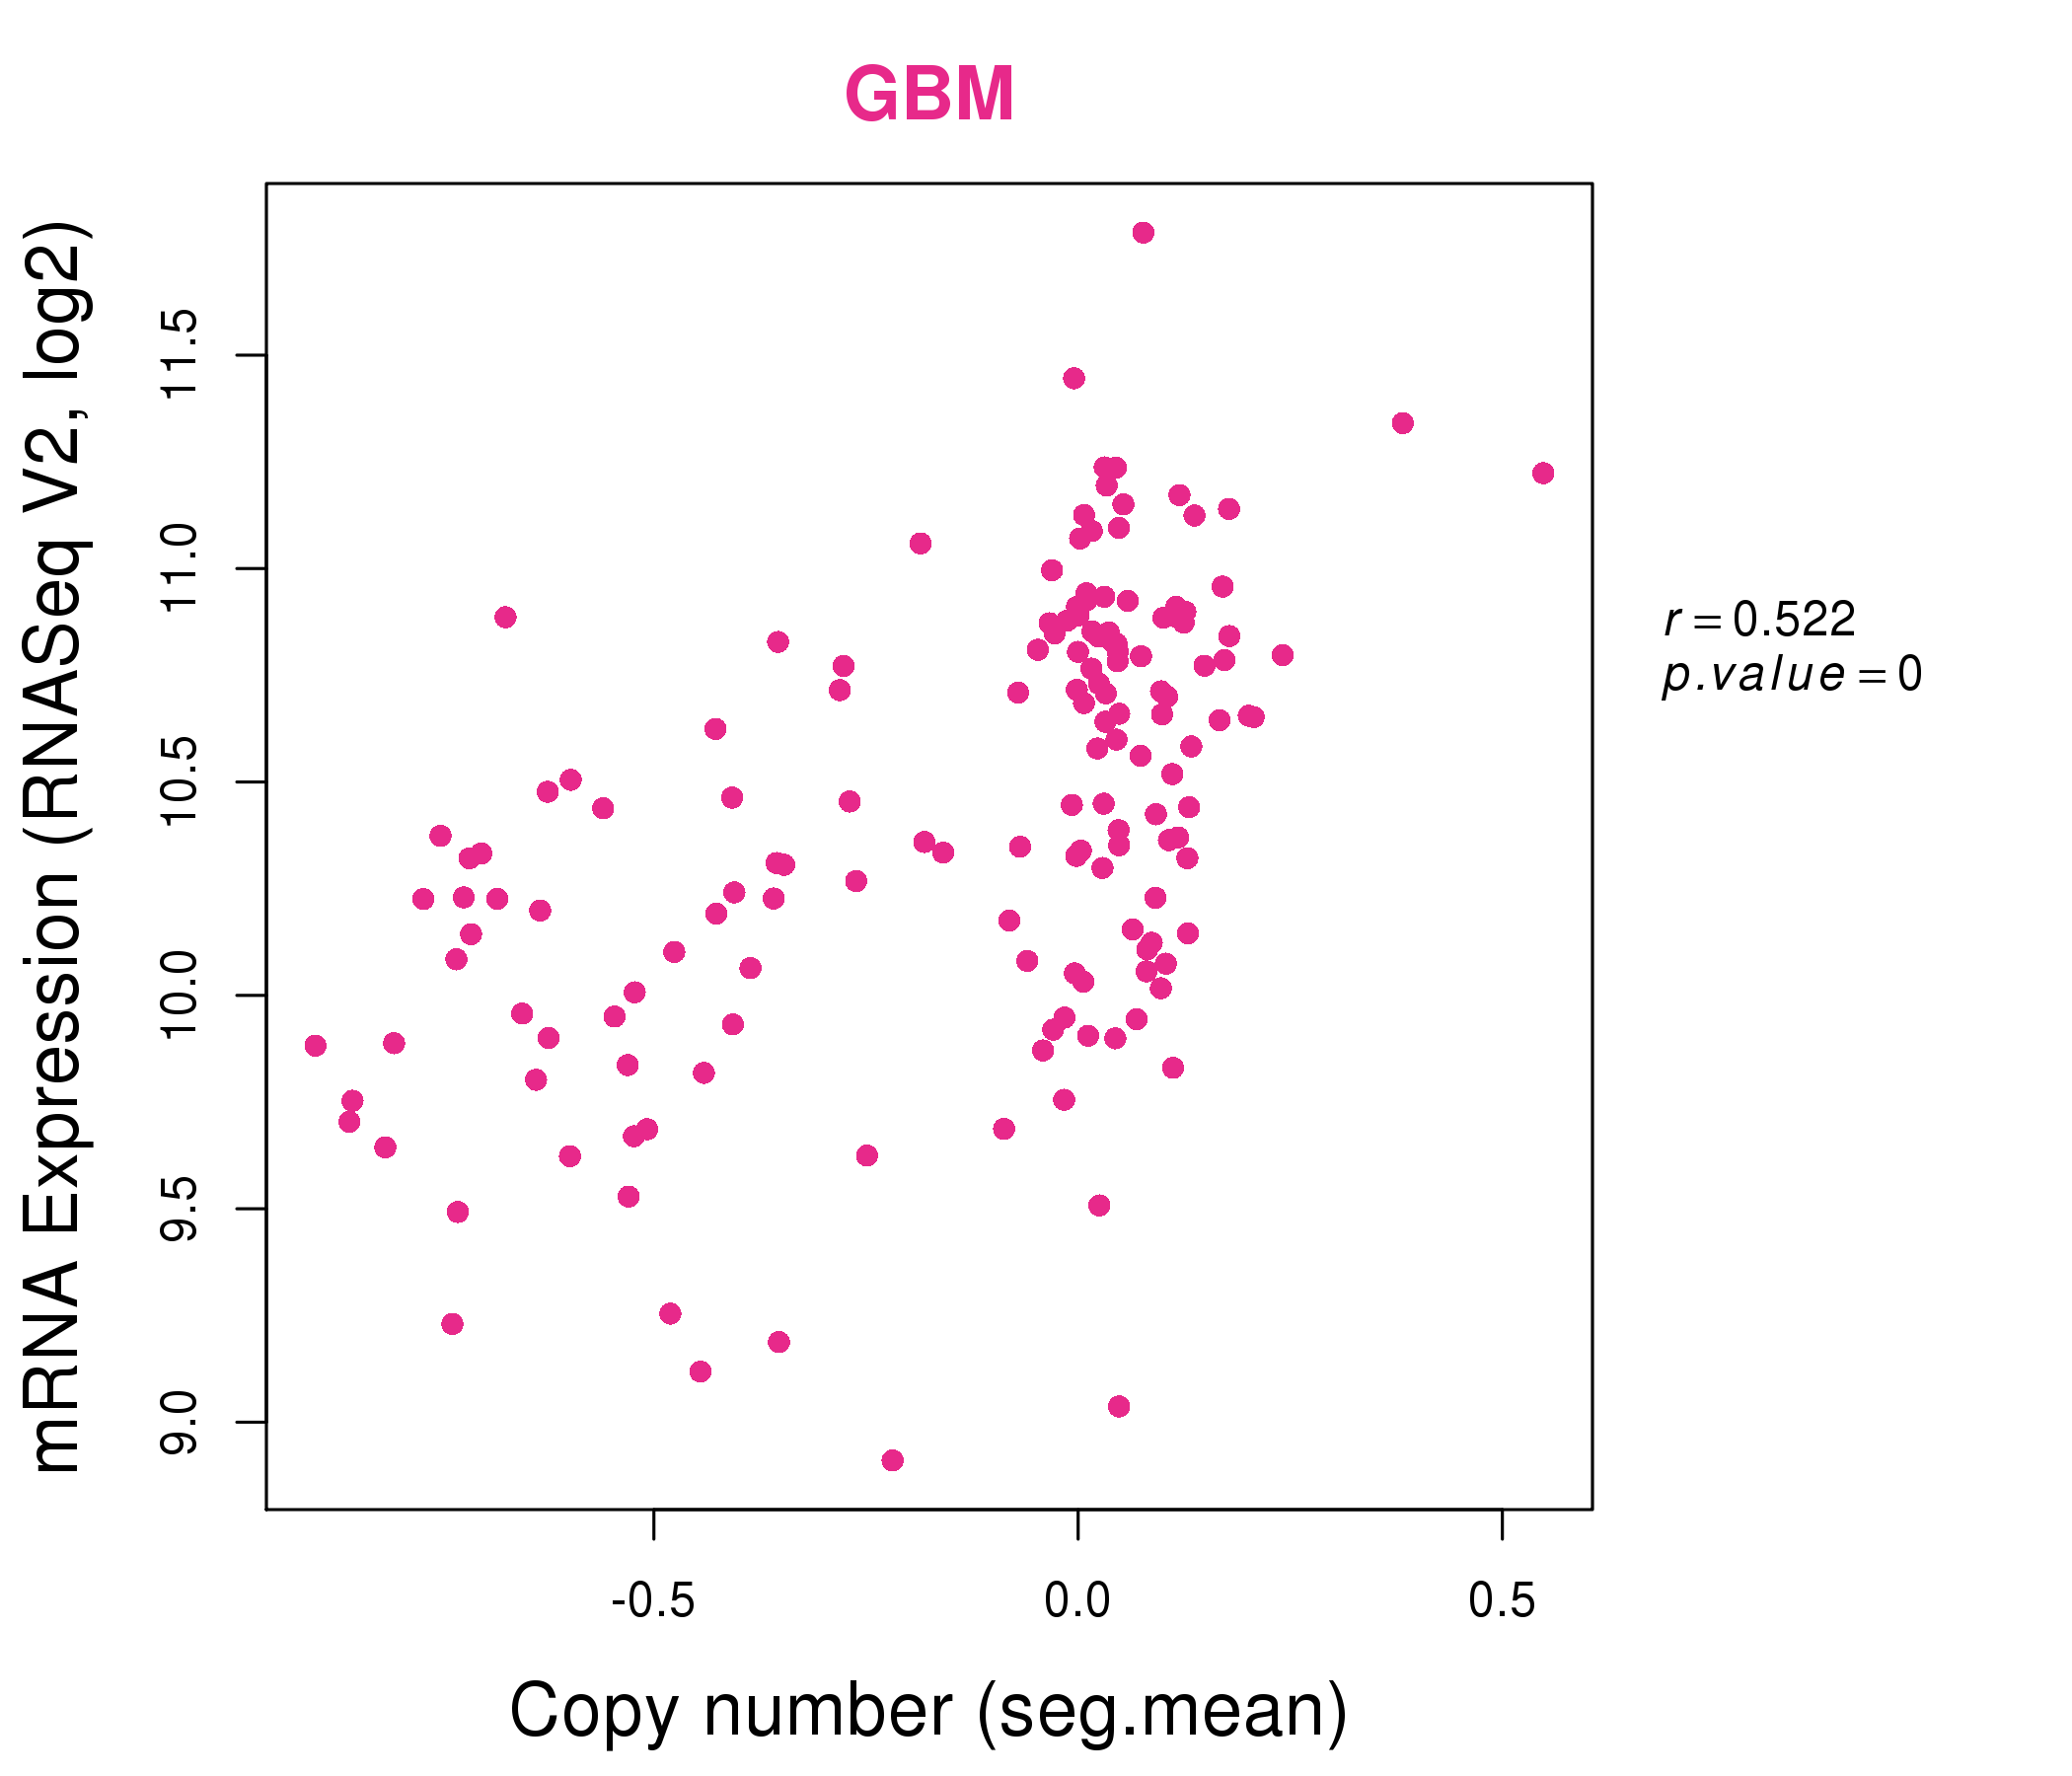
| * Normalized gene expression data of RNASeqV2 was extracted from TCGA using R package TCGA-Assembler. The URLs of all public data files on TCGA DCC data server were gathered at Jan-05-2015. Only eight cancer types have enough normal control samples for differential expression analysis. (t test, adjusted p<0.05 (using Benjamini-Hochberg FDR)) |
 |
| Top |
| * This plots show the correlation between CNV and gene expression. |
: Open all plots for all cancer types
 |
|
 |
|
| Top |
| Gene-Gene Network Information |
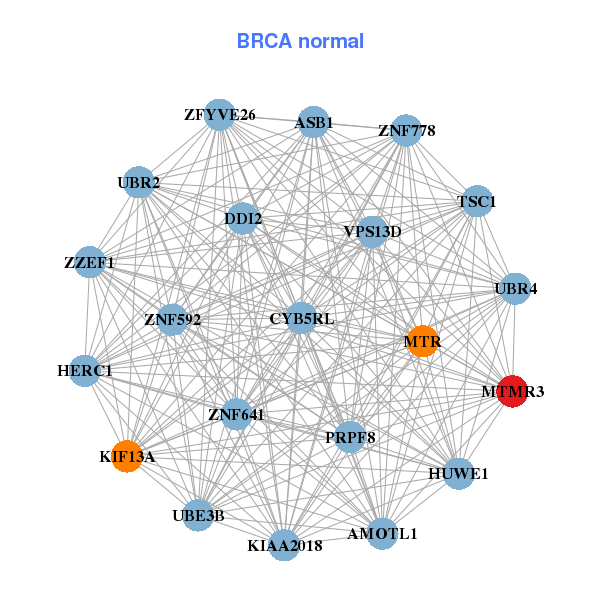
| * Co-Expression network figures were drawn using R package igraph. Only the top 20 genes with the highest correlations were shown. Red circle: input gene, orange circle: cell metabolism gene, sky circle: other gene |
: Open all plots for all cancer types
 |
|
| PRR14L,CBX6,CRKL,SPECC1L,DEPDC5,DUSP18,EIF4ENIF1, EP300,HMGXB4,HPS4,KIAA1671,MAPK1,MTMR3,PEX26, PI4KA,RNF185,SF3A1,TNRC6B,TUG1,ZC3H7B,ZNF70 | AMOTL1,ASB1,CYB5RL,DDI2,HERC1,HUWE1,KIAA2018, KIF13A,MTMR3,MTR,PRPF8,TSC1,UBE3B,UBR2, UBR4,VPS13D,ZFYVE26,ZNF592,ZNF641,ZNF778,ZZEF1 |
 |
|
| AKAP13,BRD1,HECTD4,PRR14L,CRKL,SPECC1L,EP300, HERC1,LZTR1,MICAL3,MKL1,MTMR3,MYH9,PI4KA, RAPGEF1,SSH2,SUN2,TFIP11,TNRC6B,VPS13D,ZNF70 | ATP9A,BTBD9,CCDC93,DGCR2,FOXJ3,FOXO3,FOXO3B, IGF2R,INSR,KDM4B,KHNYN,MAGI1,MAML3,MICAL3, MTMR3,PDPK1,SRGAP1,TLE3,TOM1L2,USP19,ZNF687 |

| * Co-Expression network figures were drawn using R package igraph. Only the top 20 genes with the highest correlations were shown. Red circle: input gene, orange circle: cell metabolism gene, sky circle: other gene |
: Open all plots for all cancer types
| Top |
: Open all interacting genes' information including KEGG pathway for all interacting genes from DAVID
| Top |
| Pharmacological Information for MTMR3 |
| There's no related Drug. |
| Top |
| Cross referenced IDs for MTMR3 |
| * We obtained these cross-references from Uniprot database. It covers 150 different DBs, 18 categories. http://www.uniprot.org/help/cross_references_section |
: Open all cross reference information
|
Copyright © 2016-Present - The Univsersity of Texas Health Science Center at Houston @ |