|
||||||||||||||||||||
| |
| Phenotypic Information (metabolism pathway, cancer, disease, phenome) |
| |
| |
| Gene-Gene Network Information: Co-Expression Network, Interacting Genes & KEGG |
| |
|


| Gene Summary for GYG2 |
| Top |
| Phenotypic Information for GYG2(metabolism pathway, cancer, disease, phenome) |
| Cancer | CGAP: GYG2 |
| Familial Cancer Database: GYG2 | |
| * This gene is included in those cancer gene databases. |
|
|
|
|
|
|
| ||||||||||||||
Oncogene 1 | Significant driver gene in | |||||||||||||||||||
| cf) number; DB name 1 Oncogene; http://nar.oxfordjournals.org/content/35/suppl_1/D721.long, 2 Tumor Suppressor gene; https://bioinfo.uth.edu/TSGene/, 3 Cancer Gene Census; http://www.nature.com/nrc/journal/v4/n3/abs/nrc1299.html, 4 CancerGenes; http://nar.oxfordjournals.org/content/35/suppl_1/D721.long, 5 Network of Cancer Gene; http://ncg.kcl.ac.uk/index.php, 1Therapeutic Vulnerabilities in Cancer; http://cbio.mskcc.org/cancergenomics/statius/ |
| REACTOME_METABOLISM_OF_CARBOHYDRATES REACTOME_GLUCOSE_METABOLISM | |
| OMIM | |
| Orphanet | |
| Disease | KEGG Disease: GYG2 |
| MedGen: GYG2 (Human Medical Genetics with Condition) | |
| ClinVar: GYG2 | |
| Phenotype | MGI: GYG2 (International Mouse Phenotyping Consortium) |
| PhenomicDB: GYG2 | |
| Mutations for GYG2 |
| * Under tables are showing count per each tissue to give us broad intuition about tissue specific mutation patterns.You can go to the detailed page for each mutation database's web site. |
| There's no structural variation information in COSMIC data for this gene. |
| * From mRNA Sanger sequences, Chitars2.0 arranged chimeric transcripts. This table shows GYG2 related fusion information. |
| ID | Head Gene | Tail Gene | Accession | Gene_a | qStart_a | qEnd_a | Chromosome_a | tStart_a | tEnd_a | Gene_a | qStart_a | qEnd_a | Chromosome_a | tStart_a | tEnd_a |
| BF309900 | GYG2 | 2 | 75 | X | 2761351 | 2772049 | GYG2 | 66 | 678 | X | 2772129 | 2779598 | |
| U94359 | EMB | 1 | 2646 | 5 | 49693861 | 49707829 | GYG2 | 2640 | 4066 | X | 2798741 | 2800155 | |
| Top |
| There's no copy number variation information in COSMIC data for this gene. |
| Top |
|
 |
| Top |
| Stat. for Non-Synonymous SNVs (# total SNVs=36) | (# total SNVs=13) |
 |  |
(# total SNVs=1) | (# total SNVs=0) |
 |
| Top |
| * When you move the cursor on each content, you can see more deailed mutation information on the Tooltip. Those are primary_site,primary_histology,mutation(aa),pubmedID. |
| GRCh37 position | Mutation(aa) | Unique sampleID count |
| chr23:2795286-2795286 | p.E428K | 3 |
| chr23:2773087-2773087 | p.P157P | 2 |
| chr23:2761050-2761050 | p.H7Y | 2 |
| chr23:2778030-2778030 | p.T285M | 2 |
| chr23:2772118-2772118 | p.G114R | 2 |
| chr23:2795308-2795308 | p.A435D | 2 |
| chr23:2761348-2761348 | p.T65T | 2 |
| chr23:2773080-2773080 | p.A155V | 1 |
| chr23:2799186-2799186 | p.R480C | 1 |
| chr23:2777918-2777918 | p.G248R | 1 |
| Top |
|
 |
| Point Mutation/ Tissue ID | 1 | 2 | 3 | 4 | 5 | 6 | 7 | 8 | 9 | 10 | 11 | 12 | 13 | 14 | 15 | 16 | 17 | 18 | 19 | 20 |
| # sample | 3 | 7 | 2 | 1 | 1 | 2 | 4 | 1 | 2 | 2 | 5 | |||||||||
| # mutation | 3 | 8 | 2 | 1 | 1 | 2 | 4 | 1 | 2 | 2 | 5 | |||||||||
| nonsynonymous SNV | 2 | 5 | 1 | 1 | 2 | 3 | 1 | 1 | 2 | 4 | ||||||||||
| synonymous SNV | 1 | 3 | 2 | 1 | 1 | 1 |
| cf) Tissue ID; Tissue type (1; BLCA[Bladder Urothelial Carcinoma], 2; BRCA[Breast invasive carcinoma], 3; CESC[Cervical squamous cell carcinoma and endocervical adenocarcinoma], 4; COAD[Colon adenocarcinoma], 5; GBM[Glioblastoma multiforme], 6; Glioma Low Grade, 7; HNSC[Head and Neck squamous cell carcinoma], 8; KICH[Kidney Chromophobe], 9; KIRC[Kidney renal clear cell carcinoma], 10; KIRP[Kidney renal papillary cell carcinoma], 11; LAML[Acute Myeloid Leukemia], 12; LUAD[Lung adenocarcinoma], 13; LUSC[Lung squamous cell carcinoma], 14; OV[Ovarian serous cystadenocarcinoma ], 15; PAAD[Pancreatic adenocarcinoma], 16; PRAD[Prostate adenocarcinoma], 17; SKCM[Skin Cutaneous Melanoma], 18:STAD[Stomach adenocarcinoma], 19:THCA[Thyroid carcinoma], 20:UCEC[Uterine Corpus Endometrial Carcinoma]) |
| Top |
| * We represented just top 10 SNVs. When you move the cursor on each content, you can see more deailed mutation information on the Tooltip. Those are primary_site, primary_histology, mutation(aa), pubmedID. |
| Genomic Position | Mutation(aa) | Unique sampleID count |
| chrX:2761348 | p.T34T,GYG2 | 2 |
| chrX:2772118 | p.G83R,GYG2 | 2 |
| chrX:2777918 | p.V138L,GYG2 | 1 |
| chrX:2799206 | p.R223C,GYG2 | 1 |
| chrX:2773036 | p.T147M,GYG2 | 1 |
| chrX:2777919 | p.K229K,GYG2 | 1 |
| chrX:2799210 | p.G8W,GYG2 | 1 |
| chrX:2773049 | p.A231T,GYG2 | 1 |
| chrX:2777964 | p.F17L,GYG2 | 1 |
| chrX:2773080 | p.G20G,GYG2 | 1 |
| * Copy number data were extracted from TCGA using R package TCGA-Assembler. The URLs of all public data files on TCGA DCC data server were gathered on Jan-05-2015. Function ProcessCNAData in TCGA-Assembler package was used to obtain gene-level copy number value which is calculated as the average copy number of the genomic region of a gene. |
 |
| cf) Tissue ID[Tissue type]: BLCA[Bladder Urothelial Carcinoma], BRCA[Breast invasive carcinoma], CESC[Cervical squamous cell carcinoma and endocervical adenocarcinoma], COAD[Colon adenocarcinoma], GBM[Glioblastoma multiforme], Glioma Low Grade, HNSC[Head and Neck squamous cell carcinoma], KICH[Kidney Chromophobe], KIRC[Kidney renal clear cell carcinoma], KIRP[Kidney renal papillary cell carcinoma], LAML[Acute Myeloid Leukemia], LUAD[Lung adenocarcinoma], LUSC[Lung squamous cell carcinoma], OV[Ovarian serous cystadenocarcinoma ], PAAD[Pancreatic adenocarcinoma], PRAD[Prostate adenocarcinoma], SKCM[Skin Cutaneous Melanoma], STAD[Stomach adenocarcinoma], THCA[Thyroid carcinoma], UCEC[Uterine Corpus Endometrial Carcinoma] |
| Top |
| Gene Expression for GYG2 |
| * CCLE gene expression data were extracted from CCLE_Expression_Entrez_2012-10-18.res: Gene-centric RMA-normalized mRNA expression data. |
 |
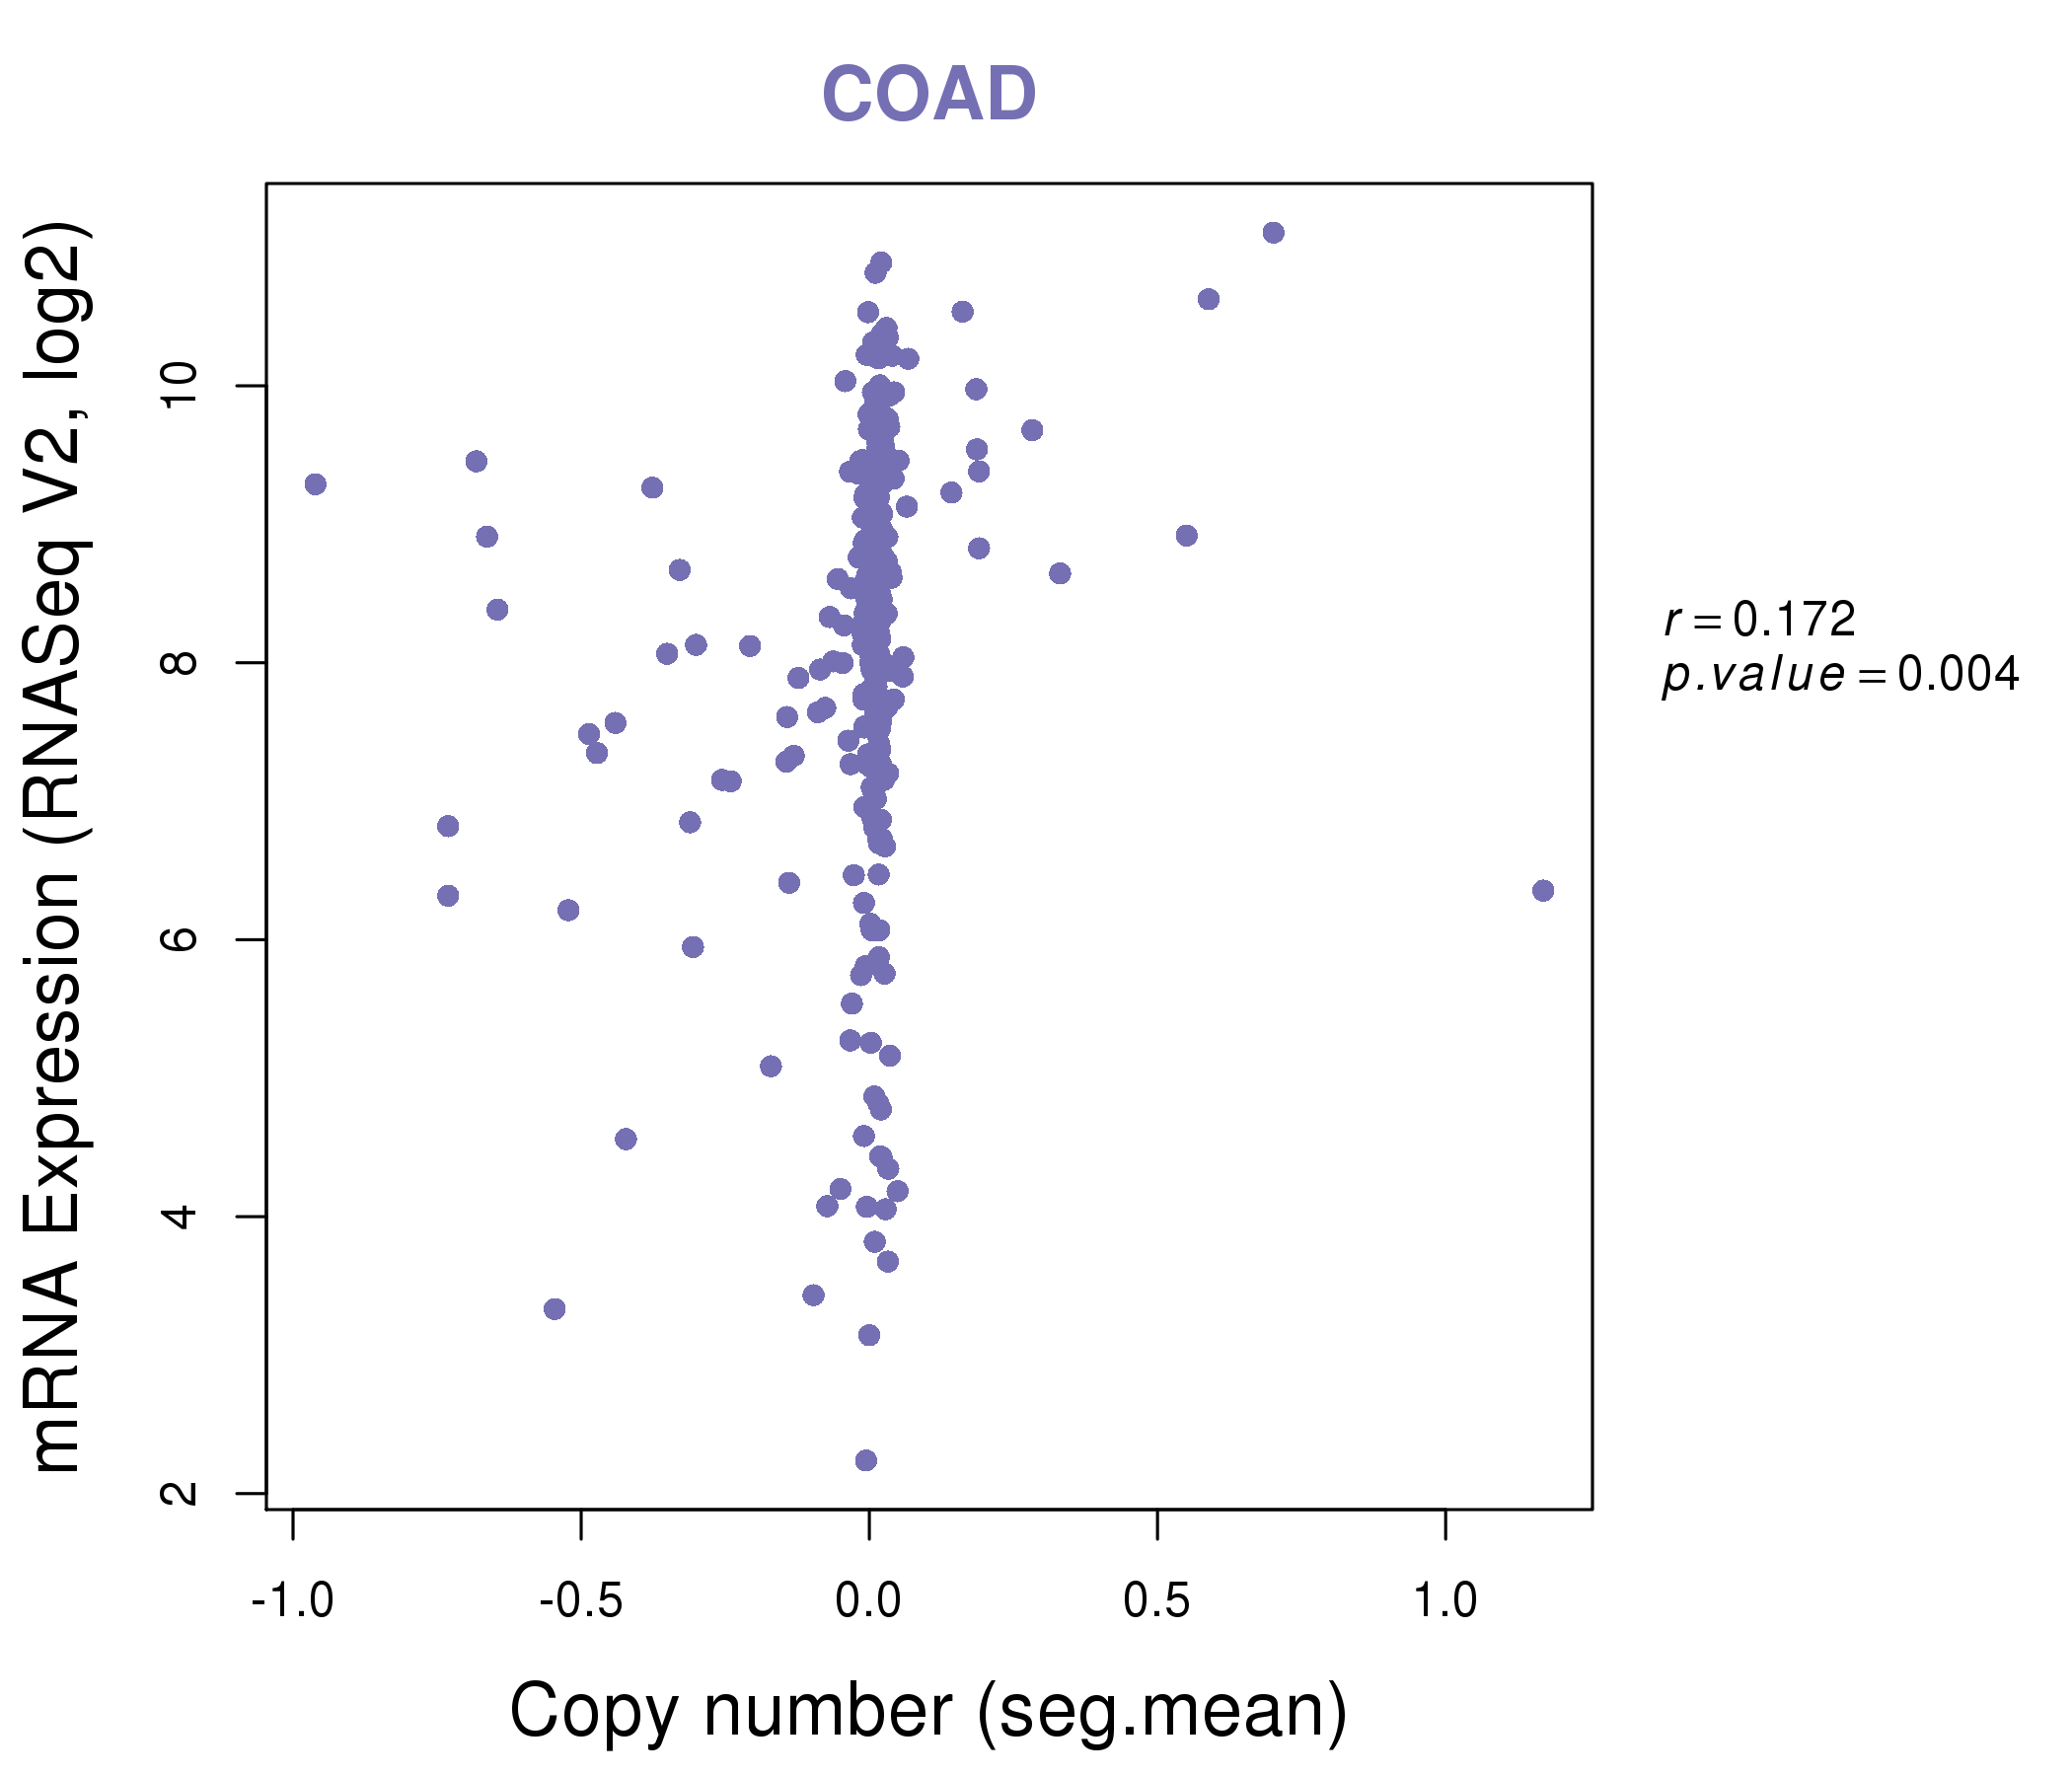
| * Normalized gene expression data of RNASeqV2 was extracted from TCGA using R package TCGA-Assembler. The URLs of all public data files on TCGA DCC data server were gathered at Jan-05-2015. Only eight cancer types have enough normal control samples for differential expression analysis. (t test, adjusted p<0.05 (using Benjamini-Hochberg FDR)) |
 |
| Top |
| * This plots show the correlation between CNV and gene expression. |
: Open all plots for all cancer types
 |
|
 |
|


| Top |
| Gene-Gene Network Information |
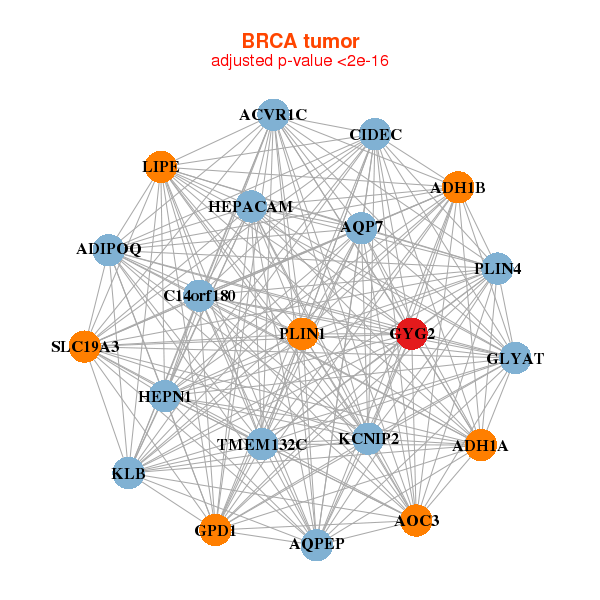
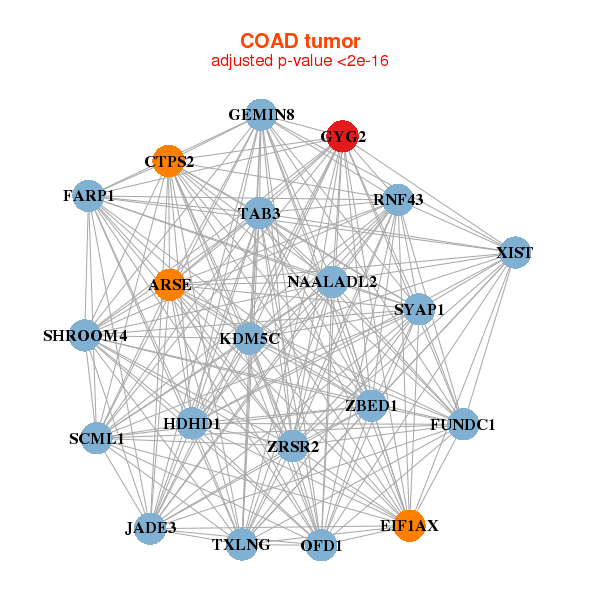
| * Co-Expression network figures were drawn using R package igraph. Only the top 20 genes with the highest correlations were shown. Red circle: input gene, orange circle: cell metabolism gene, sky circle: other gene |
: Open all plots for all cancer types
 |
|
| ACVR1C,ADH1A,ADH1B,ADIPOQ,AOC3,AQP7,AQPEP, C14orf180,CIDEC,GLYAT,GPD1,GYG2,HEPACAM,HEPN1, KCNIP2,KLB,LIPE,PLIN1,PLIN4,SLC19A3,TMEM132C | ABHD15,ACO1,FAM213A,CIDEC,ESYT1,FAM89A,FBXO27, GNAI1,GYG2,HEPACAM,HRASLS5,KCNIP2,LPL,MARC1, PDE3B,PECR,PEX19,PLIN1,PPARG,SIK2,TYRO3 |
 |
|
| ARSE,CTPS2,EIF1AX,FARP1,FUNDC1,GEMIN8,GYG2, HDHD1,KDM5C,NAALADL2,OFD1,JADE3,RNF43,SCML1, SHROOM4,SYAP1,TAB3,TXLNG,XIST,ZBED1,ZRSR2 | CDC25B,CHI3L1,CLEC4GP1,CPXM1,CST11,DPPA3,DPYS, GYG2,LOC55908,LOC728723,LPL,MARCO,NKX6-2,PCSK9, PLTP,REG1A,REG1B,RNASE2,SCD,SLC7A10,THRSP |
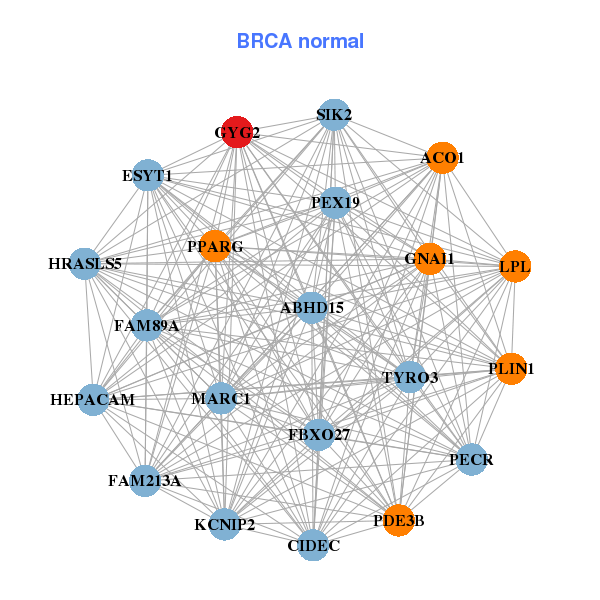
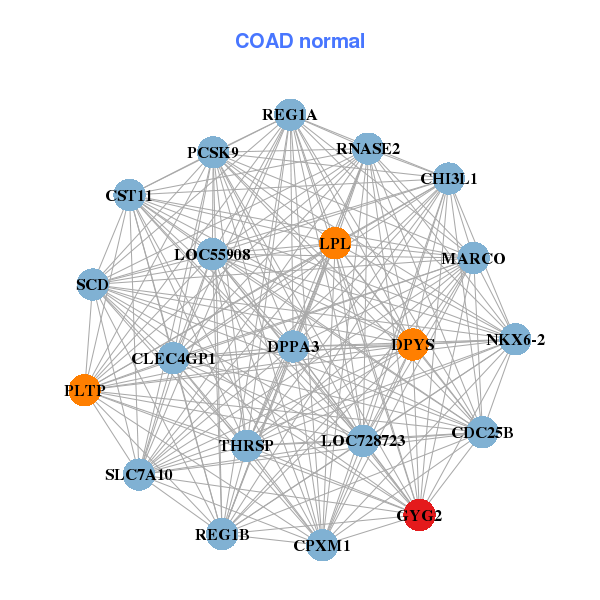
| * Co-Expression network figures were drawn using R package igraph. Only the top 20 genes with the highest correlations were shown. Red circle: input gene, orange circle: cell metabolism gene, sky circle: other gene |
: Open all plots for all cancer types
| Top |
: Open all interacting genes' information including KEGG pathway for all interacting genes from DAVID
| Top |
| Pharmacological Information for GYG2 |
| There's no related Drug. |
| Top |
| Cross referenced IDs for GYG2 |
| * We obtained these cross-references from Uniprot database. It covers 150 different DBs, 18 categories. http://www.uniprot.org/help/cross_references_section |
: Open all cross reference information
|
Copyright © 2016-Present - The Univsersity of Texas Health Science Center at Houston @ |