|
||||||||||||||||||||||||||||||||||||||||||||||||||||||||||||||||||||||||||||||||||||||||||||||||||||||||||||||||||||||||||||||||||||||||||||||||||||||||||||||||||||||||||||||||||||||||||||||||||||||||||||||||||||||||||||||||||||||||||||||||||||||||||||||||||||||||||||||||||||||||||||
| |
| Phenotypic Information (metabolism pathway, cancer, disease, phenome) |
| |
| |
| Gene-Gene Network Information: Co-Expression Network, Interacting Genes & KEGG |
| |
|


| Gene Summary for CCNC |
| Basic gene info. | Gene symbol | CCNC |
| Gene name | cyclin C | |
| Synonyms | CycC | |
| Cytomap | UCSC genome browser: 6q21 | |
| Genomic location | chr6 :99990262-100016690 | |
| Type of gene | protein-coding | |
| RefGenes | NM_001013399.1, NM_005190.3, | |
| Ensembl id | ENSG00000112237 | |
| Description | SRB11 homologcyclin-ChSRB11 | |
| Modification date | 20141207 | |
| dbXrefs | MIM : 123838 | |
| HGNC : HGNC | ||
| Ensembl : ENSG00000112237 | ||
| HPRD : 00456 | ||
| Vega : OTTHUMG00000015268 | ||
| Protein | UniProt: P24863 go to UniProt's Cross Reference DB Table | |
| Expression | CleanEX: HS_CCNC | |
| BioGPS: 892 | ||
| Gene Expression Atlas: ENSG00000112237 | ||
| The Human Protein Atlas: ENSG00000112237 | ||
| Pathway | NCI Pathway Interaction Database: CCNC | |
| KEGG: CCNC | ||
| REACTOME: CCNC | ||
| ConsensusPathDB | ||
| Pathway Commons: CCNC | ||
| Metabolism | MetaCyc: CCNC | |
| HUMANCyc: CCNC | ||
| Regulation | Ensembl's Regulation: ENSG00000112237 | |
| miRBase: chr6 :99,990,262-100,016,690 | ||
| TargetScan: NM_001013399 | ||
| cisRED: ENSG00000112237 | ||
| Context | iHOP: CCNC | |
| cancer metabolism search in PubMed: CCNC | ||
| UCL Cancer Institute: CCNC | ||
| Assigned class in ccmGDB | A - This gene has a literature evidence and it belongs to cancer gene. | |
| References showing role of CCNC in cancer cell metabolism | 1. Sinclair PB, Sorour A, Martineau M, Harrison CJ, Mitchell WA, et al. (2004) A fluorescence in situ hybridization map of 6q deletions in acute lymphocytic leukemia: identification and analysis of a candidate tumor suppressor gene. Cancer Res 64: 4089-4098. doi: 10.1158/0008-5472.CAN-03-1871. go to article 2. Miyata Y, Liu Y, Jankovic V, Sashida G, Lee JM, et al. (2010) Cyclin C regulates human hematopoietic stem/progenitor cell quiescence. Stem Cells 28: 308-317. doi: 10.1002/stem.270. pmid: 3144254. go to article 3. Li N, Fassl A, Chick J, Inuzuka H, Li X, et al. (2014) Cyclin C is a haploinsufficient tumour suppressor. Nat Cell Biol 16: 1080-1091. doi: 10.1038/ncb3046. pmid: 4235773. go to article | |
| Top |
| Phenotypic Information for CCNC(metabolism pathway, cancer, disease, phenome) |
| Cancer | CGAP: CCNC |
| Familial Cancer Database: CCNC | |
| * This gene is included in those cancer gene databases. |
|
|
|
|
|
| . | ||||||||||||||||||||||||||||||||||||||||||||||||||||||||||||||||||||||||||||||||||||||||||||||||||||||||||||||||||||||||||||||||||||||||||||||||||||||||||||||||||||||||||||||||||||||||||||||||||||||||||||||||||||||||||||||||||||||||||||||||||||||||||||||||||||||||||||||||||||||
Oncogene 1 | Significant driver gene in | |||||||||||||||||||||||||||||||||||||||||||||||||||||||||||||||||||||||||||||||||||||||||||||||||||||||||||||||||||||||||||||||||||||||||||||||||||||||||||||||||||||||||||||||||||||||||||||||||||||||||||||||||||||||||||||||||||||||||||||||||||||||||||||||||||||||||||||||||||||||||||
| cf) number; DB name 1 Oncogene; http://nar.oxfordjournals.org/content/35/suppl_1/D721.long, 2 Tumor Suppressor gene; https://bioinfo.uth.edu/TSGene/, 3 Cancer Gene Census; http://www.nature.com/nrc/journal/v4/n3/abs/nrc1299.html, 4 CancerGenes; http://nar.oxfordjournals.org/content/35/suppl_1/D721.long, 5 Network of Cancer Gene; http://ncg.kcl.ac.uk/index.php, 1Therapeutic Vulnerabilities in Cancer; http://cbio.mskcc.org/cancergenomics/statius/ |
| REACTOME_METABOLISM_OF_LIPIDS_AND_LIPOPROTEINS | |
| OMIM | 123838; gene. |
| Orphanet | |
| Disease | KEGG Disease: CCNC |
| MedGen: CCNC (Human Medical Genetics with Condition) | |
| ClinVar: CCNC | |
| Phenotype | MGI: CCNC (International Mouse Phenotyping Consortium) |
| PhenomicDB: CCNC | |
| Mutations for CCNC |
| * Under tables are showing count per each tissue to give us broad intuition about tissue specific mutation patterns.You can go to the detailed page for each mutation database's web site. |
| There's no structural variation information in COSMIC data for this gene. |
| * From mRNA Sanger sequences, Chitars2.0 arranged chimeric transcripts. This table shows CCNC related fusion information. |
| ID | Head Gene | Tail Gene | Accession | Gene_a | qStart_a | qEnd_a | Chromosome_a | tStart_a | tEnd_a | Gene_a | qStart_a | qEnd_a | Chromosome_a | tStart_a | tEnd_a |
| Top |
| Mutation type/ Tissue ID | brca | cns | cerv | endome | haematopo | kidn | Lintest | liver | lung | ns | ovary | pancre | prost | skin | stoma | thyro | urina | |||
| Total # sample | 1 | 2 | ||||||||||||||||||
| GAIN (# sample) | ||||||||||||||||||||
| LOSS (# sample) | 1 | 2 |
| cf) Tissue ID; Tissue type (1; Breast, 2; Central_nervous_system, 3; Cervix, 4; Endometrium, 5; Haematopoietic_and_lymphoid_tissue, 6; Kidney, 7; Large_intestine, 8; Liver, 9; Lung, 10; NS, 11; Ovary, 12; Pancreas, 13; Prostate, 14; Skin, 15; Stomach, 16; Thyroid, 17; Urinary_tract) |
| Top |
|
 |
| Top |
| Stat. for Non-Synonymous SNVs (# total SNVs=0) | (# total SNVs=0) |
(# total SNVs=0) | (# total SNVs=0) |
| Top |
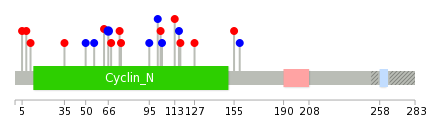
| * When you move the cursor on each content, you can see more deailed mutation information on the Tooltip. Those are primary_site,primary_histology,mutation(aa),pubmedID. |
| GRCh37 position | Mutation(aa) | Unique sampleID count |
| Top |
|
 |
| Point Mutation/ Tissue ID | 1 | 2 | 3 | 4 | 5 | 6 | 7 | 8 | 9 | 10 | 11 | 12 | 13 | 14 | 15 | 16 | 17 | 18 | 19 | 20 |
| # sample | 1 | 1 | 3 | 1 | 2 | 1 | 1 | 1 | 1 | 3 | 5 | |||||||||
| # mutation | 1 | 1 | 3 | 1 | 2 | 1 | 1 | 1 | 1 | 3 | 6 | |||||||||
| nonsynonymous SNV | 1 | 1 | 3 | 1 | 1 | 2 | 4 | |||||||||||||
| synonymous SNV | 1 | 2 | 1 | 1 | 1 | 2 |
| cf) Tissue ID; Tissue type (1; BLCA[Bladder Urothelial Carcinoma], 2; BRCA[Breast invasive carcinoma], 3; CESC[Cervical squamous cell carcinoma and endocervical adenocarcinoma], 4; COAD[Colon adenocarcinoma], 5; GBM[Glioblastoma multiforme], 6; Glioma Low Grade, 7; HNSC[Head and Neck squamous cell carcinoma], 8; KICH[Kidney Chromophobe], 9; KIRC[Kidney renal clear cell carcinoma], 10; KIRP[Kidney renal papillary cell carcinoma], 11; LAML[Acute Myeloid Leukemia], 12; LUAD[Lung adenocarcinoma], 13; LUSC[Lung squamous cell carcinoma], 14; OV[Ovarian serous cystadenocarcinoma ], 15; PAAD[Pancreatic adenocarcinoma], 16; PRAD[Prostate adenocarcinoma], 17; SKCM[Skin Cutaneous Melanoma], 18:STAD[Stomach adenocarcinoma], 19:THCA[Thyroid carcinoma], 20:UCEC[Uterine Corpus Endometrial Carcinoma]) |
| Top |
| * We represented just top 10 SNVs. When you move the cursor on each content, you can see more deailed mutation information on the Tooltip. Those are primary_site, primary_histology, mutation(aa), pubmedID. |
| Genomic Position | Mutation(aa) | Unique sampleID count |
| chr6:100009499 | p.T66T | 2 |
| chr6:99997420 | p.K56K | 1 |
| chr6:100009509 | p.A50A | 1 |
| chr6:99997424 | p.F159F,CCNC | 1 |
| chr6:100009529 | p.Q155H,CCNC | 1 |
| chr6:99997442 | p.D127H,CCNC | 1 |
| chr6:100009547 | p.L117P,CCNC | 1 |
| chr6:99998166 | p.C116C,CCNC | 1 |
| chr6:99993053 | p.A113V,CCNC | 1 |
| chr6:99999759 | p.C104C,CCNC | 1 |
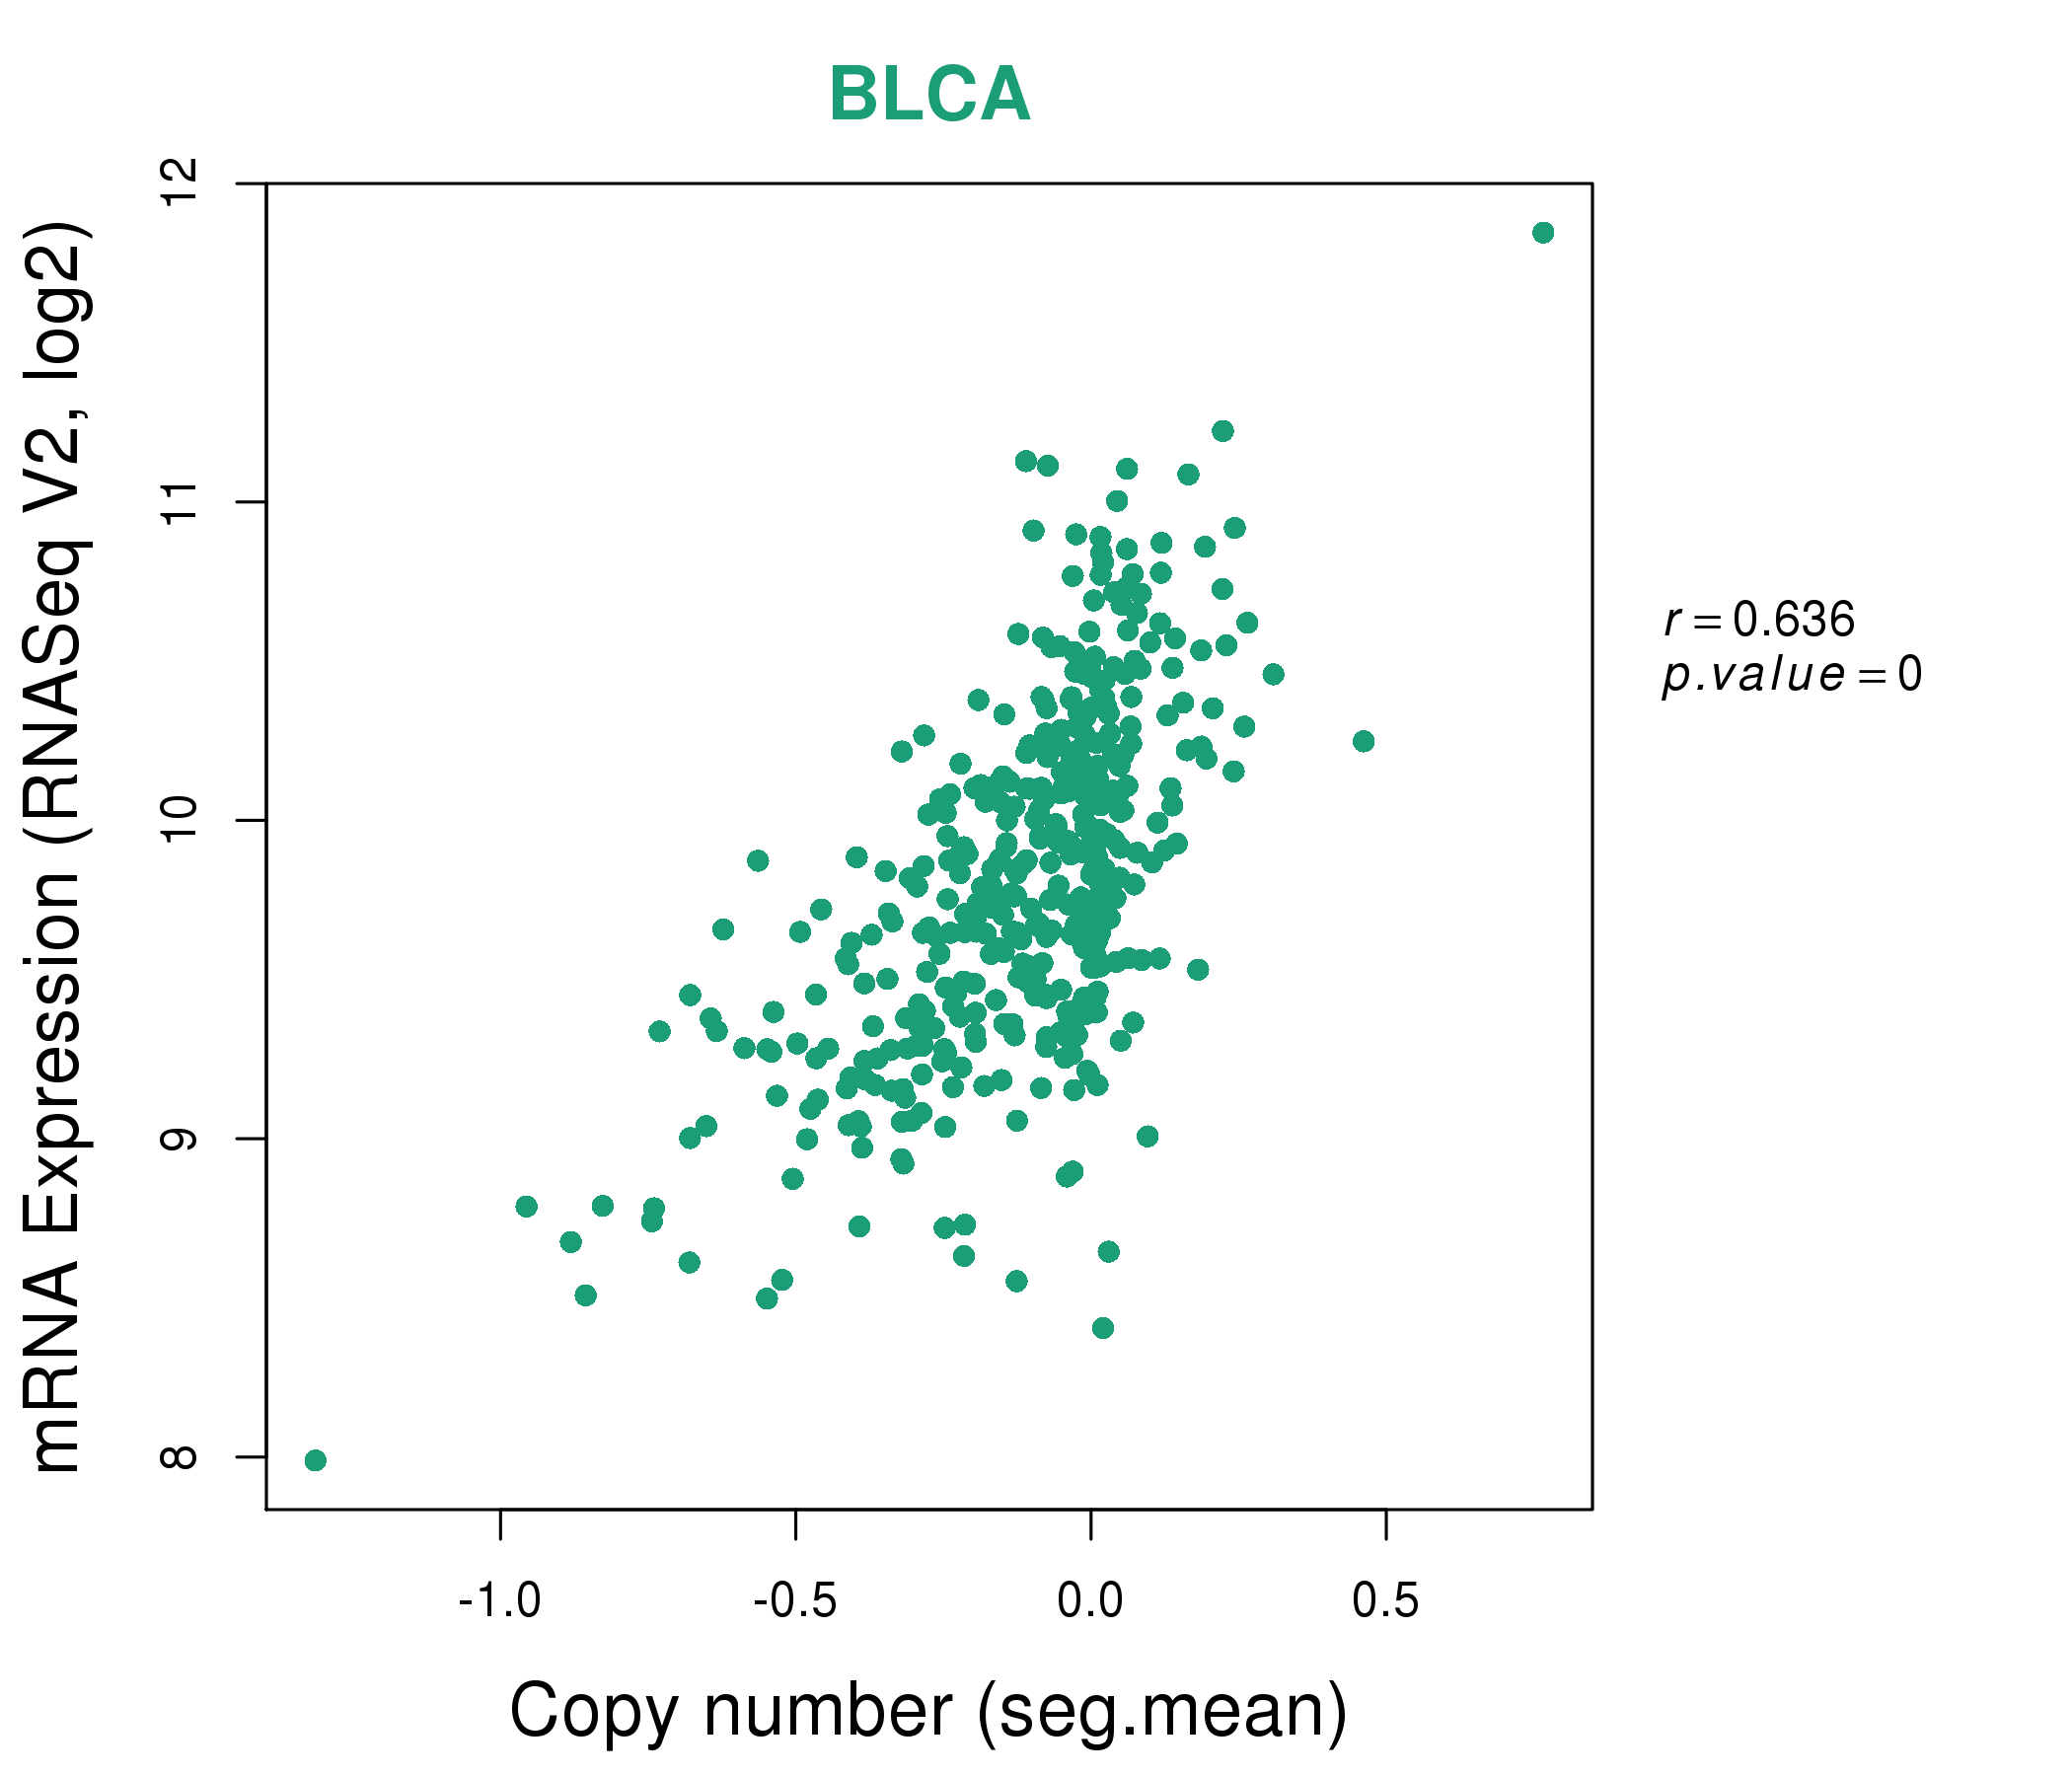
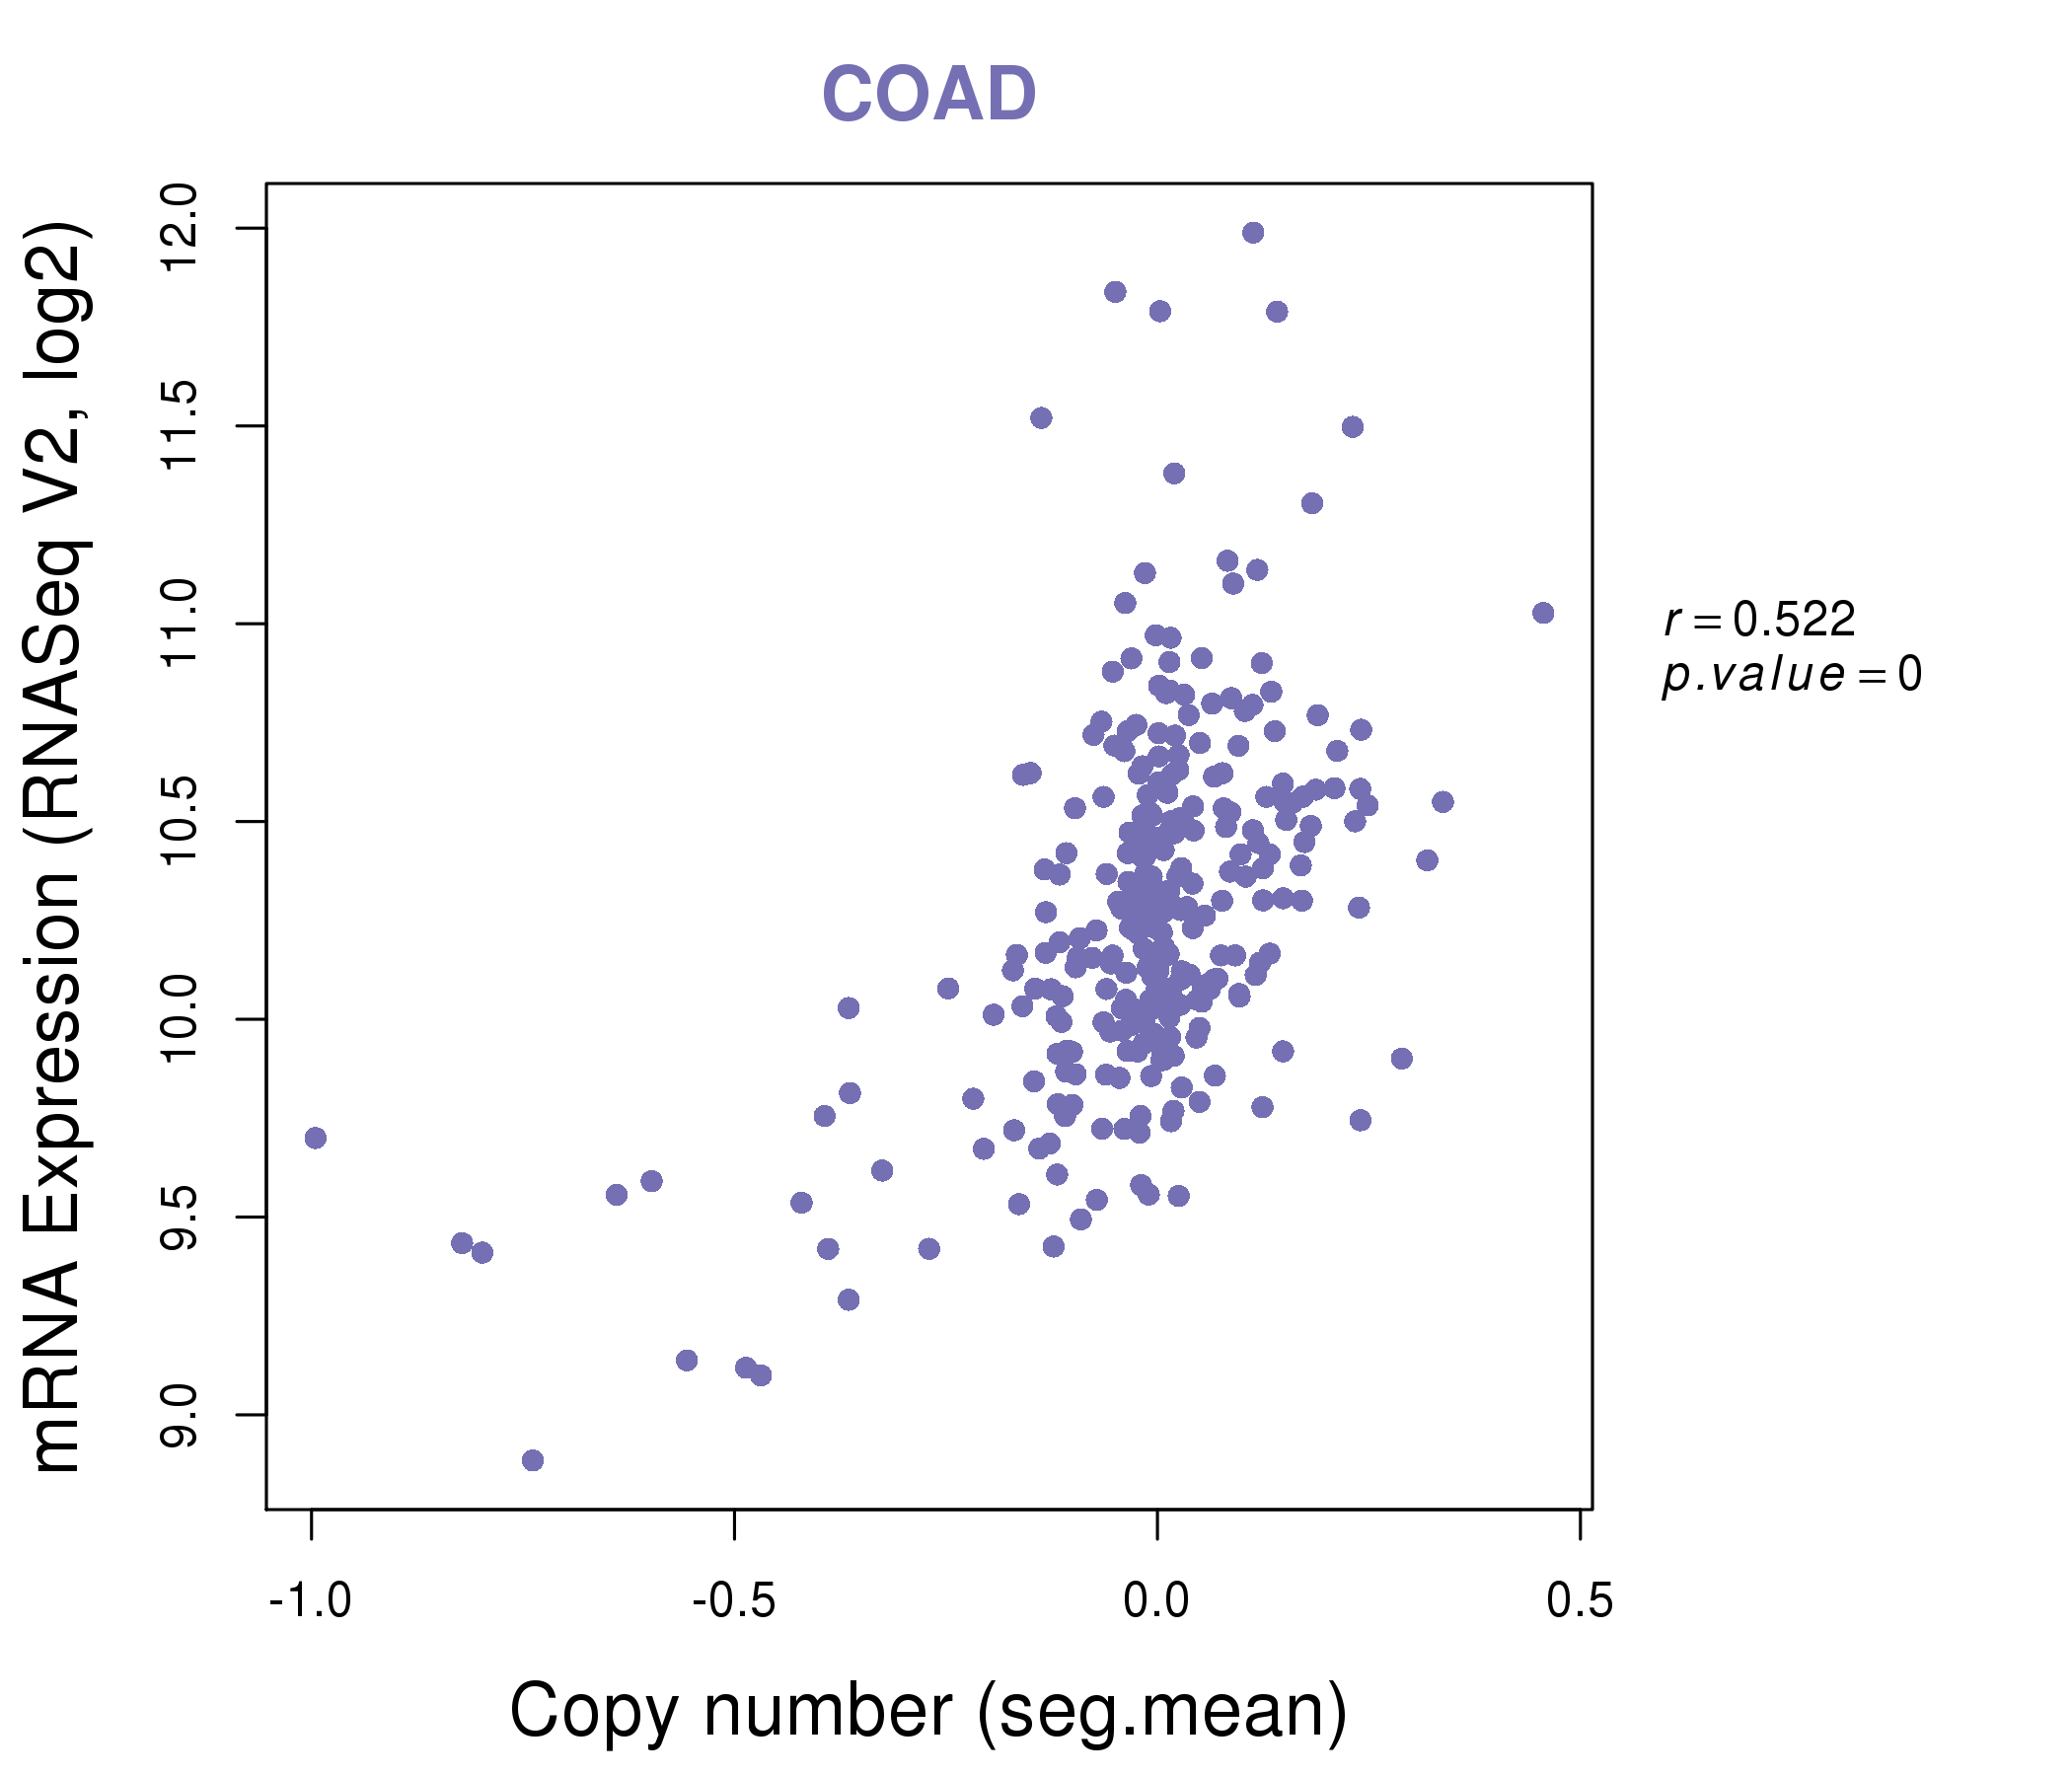
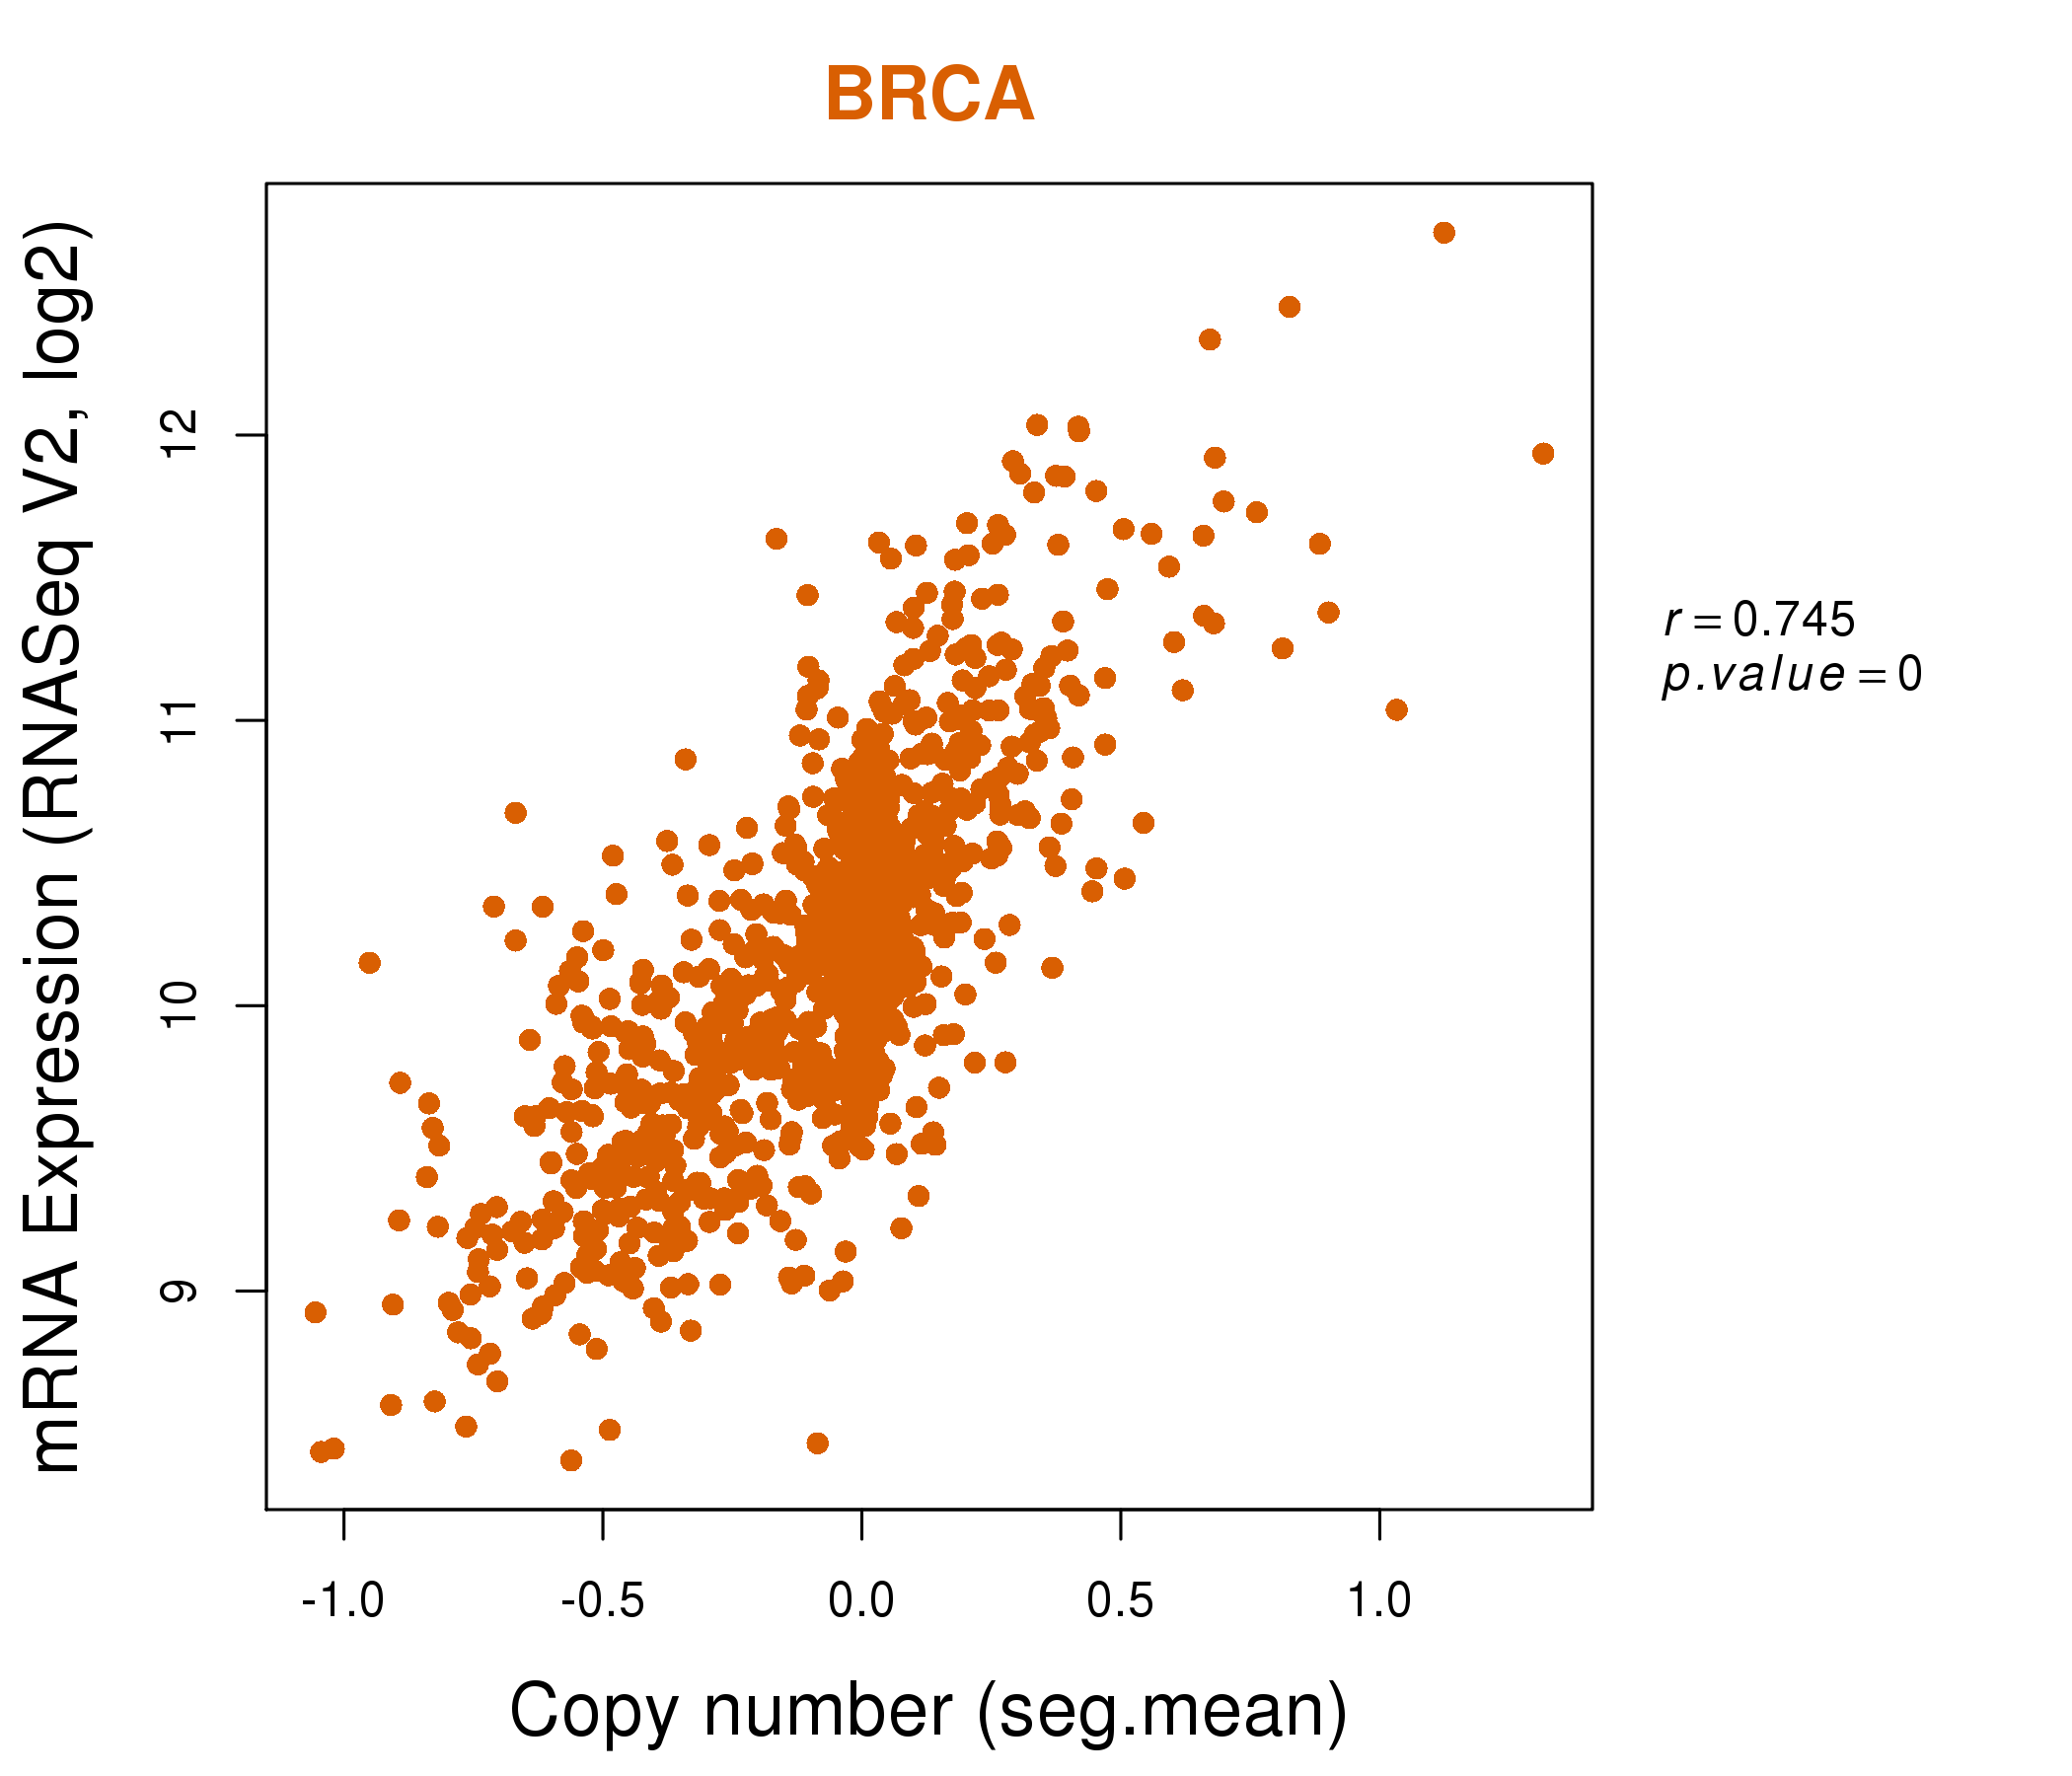
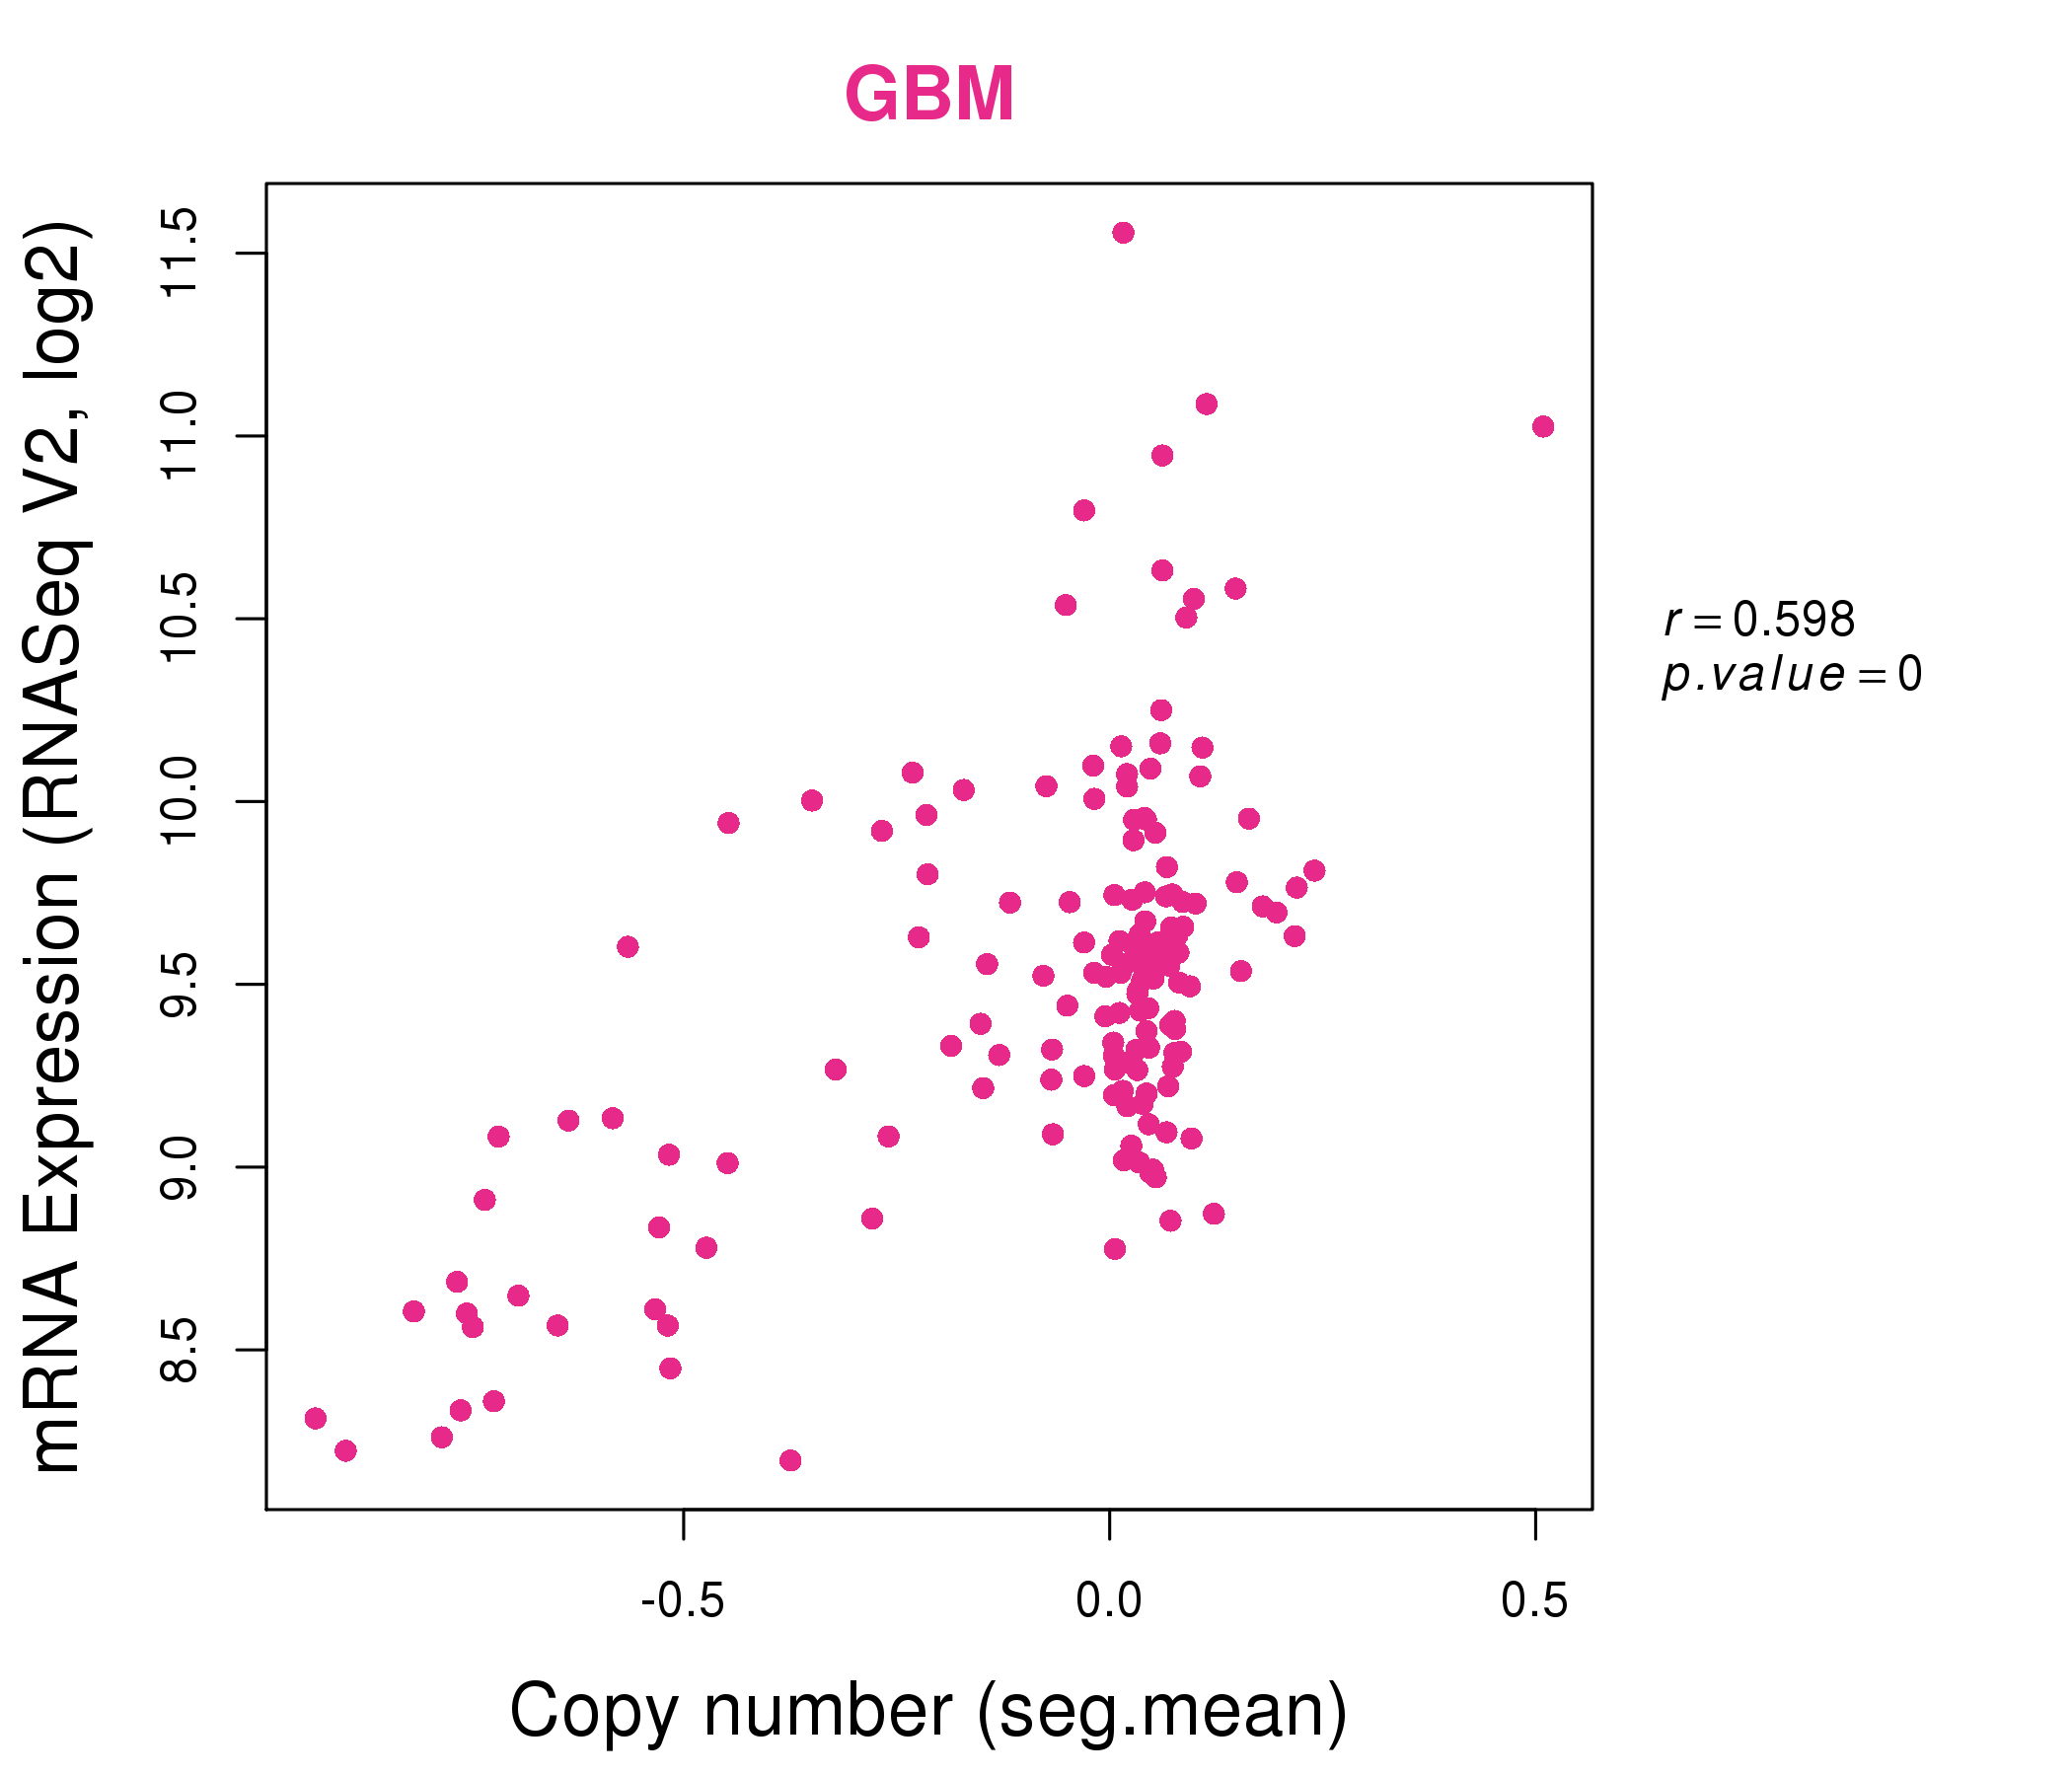
| * Copy number data were extracted from TCGA using R package TCGA-Assembler. The URLs of all public data files on TCGA DCC data server were gathered on Jan-05-2015. Function ProcessCNAData in TCGA-Assembler package was used to obtain gene-level copy number value which is calculated as the average copy number of the genomic region of a gene. |
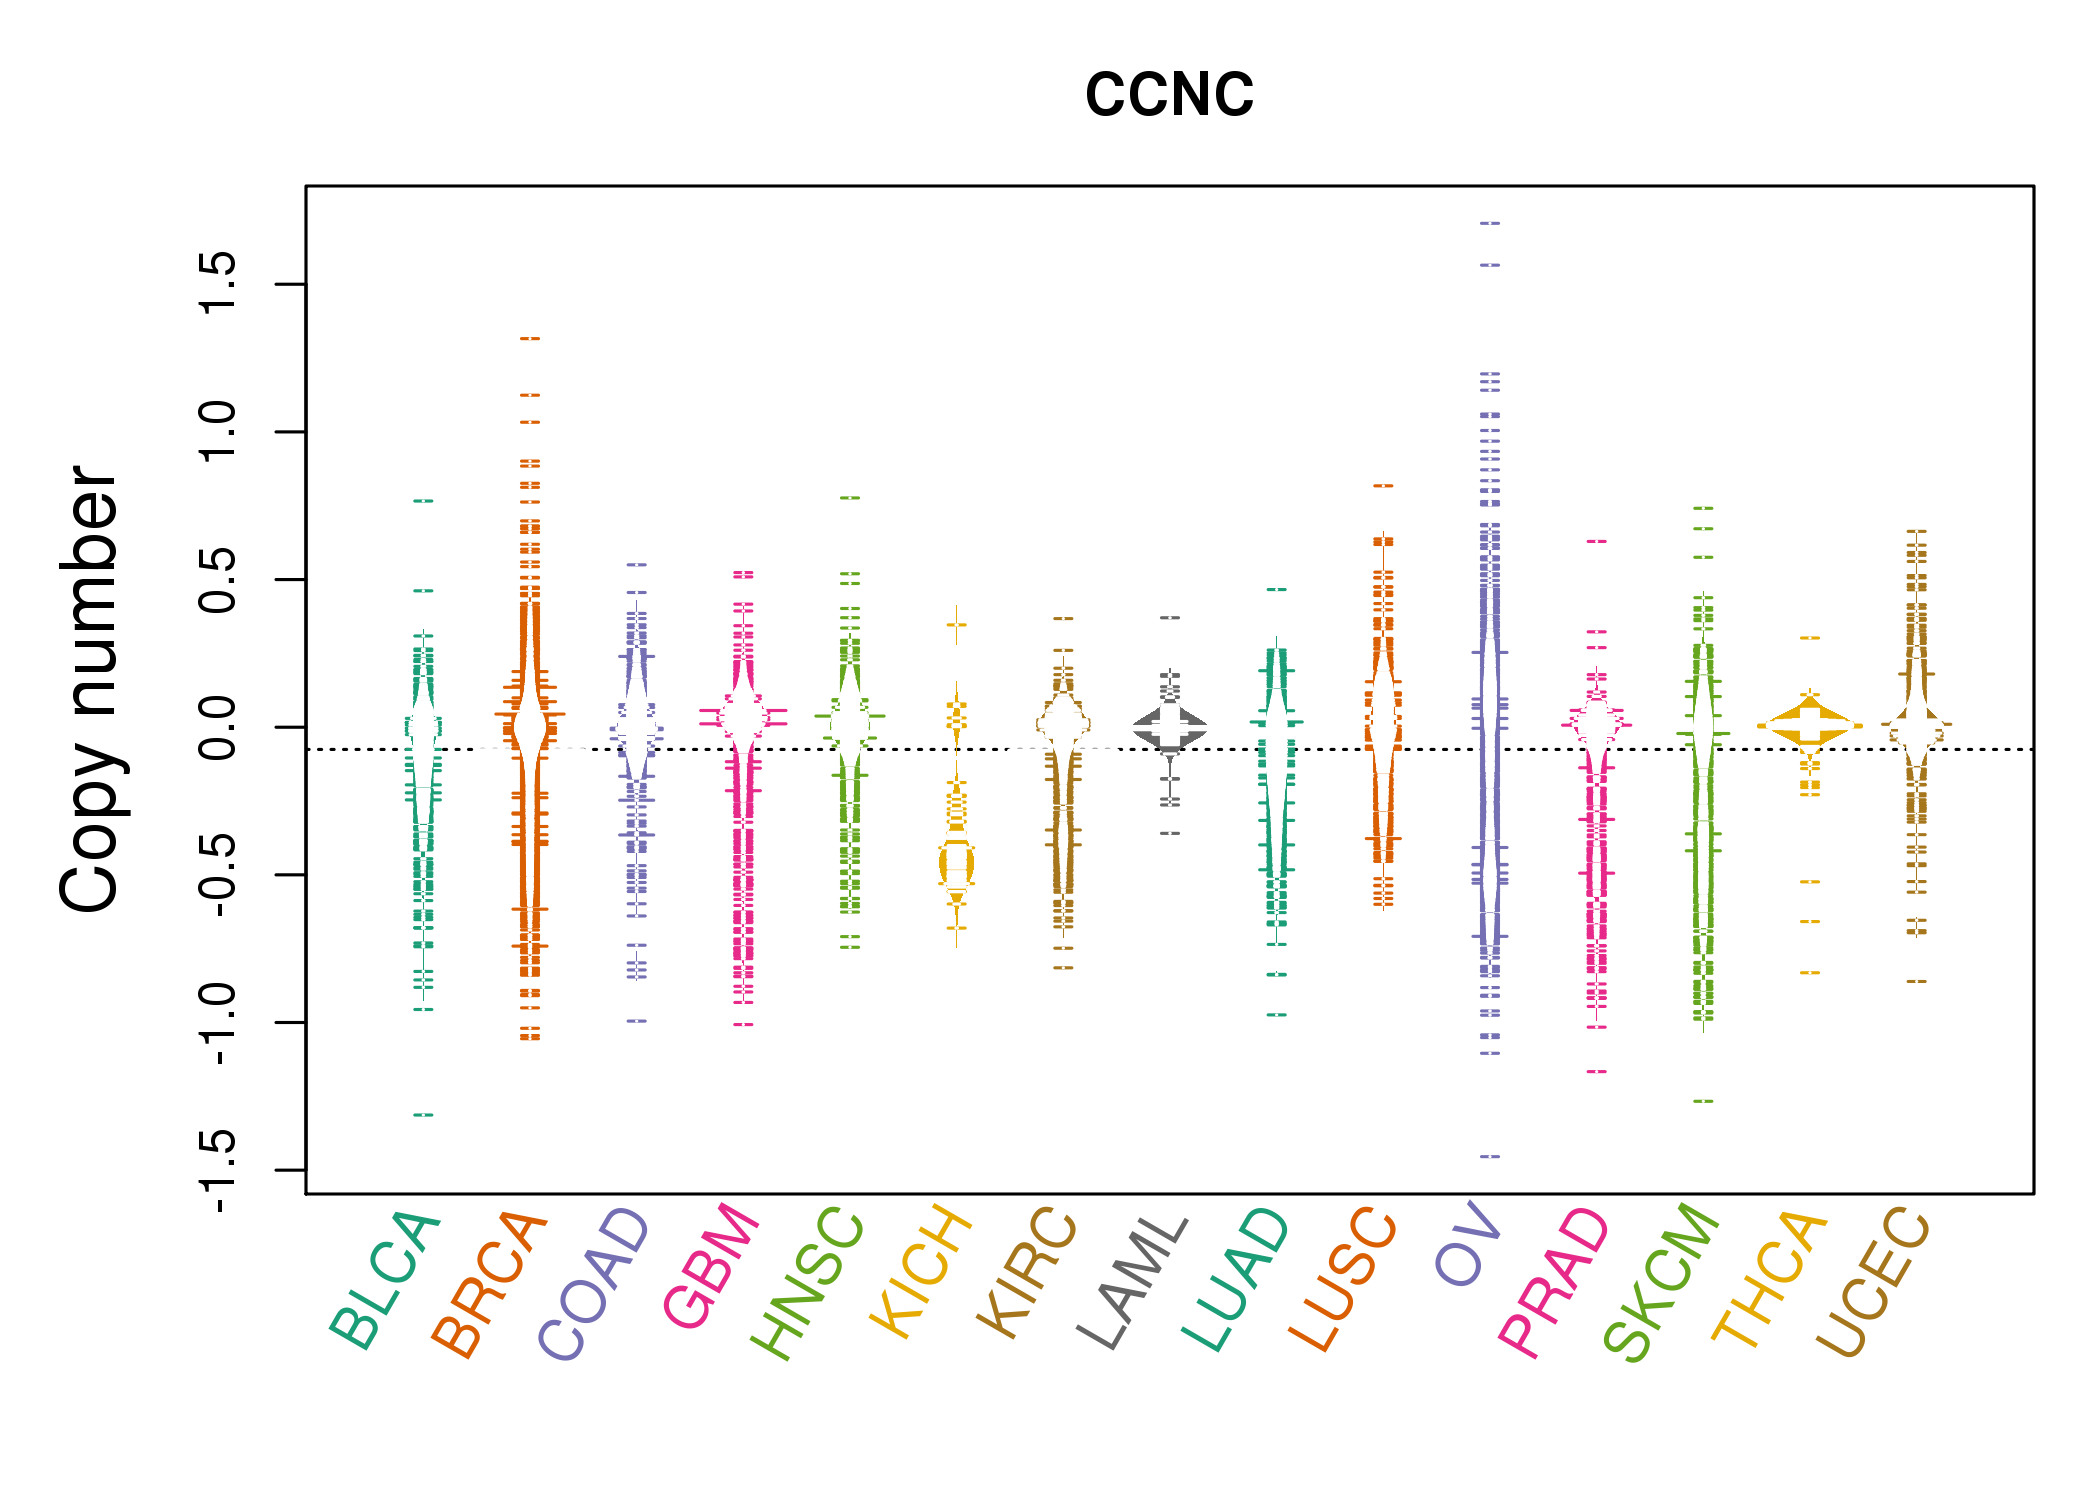 |
| cf) Tissue ID[Tissue type]: BLCA[Bladder Urothelial Carcinoma], BRCA[Breast invasive carcinoma], CESC[Cervical squamous cell carcinoma and endocervical adenocarcinoma], COAD[Colon adenocarcinoma], GBM[Glioblastoma multiforme], Glioma Low Grade, HNSC[Head and Neck squamous cell carcinoma], KICH[Kidney Chromophobe], KIRC[Kidney renal clear cell carcinoma], KIRP[Kidney renal papillary cell carcinoma], LAML[Acute Myeloid Leukemia], LUAD[Lung adenocarcinoma], LUSC[Lung squamous cell carcinoma], OV[Ovarian serous cystadenocarcinoma ], PAAD[Pancreatic adenocarcinoma], PRAD[Prostate adenocarcinoma], SKCM[Skin Cutaneous Melanoma], STAD[Stomach adenocarcinoma], THCA[Thyroid carcinoma], UCEC[Uterine Corpus Endometrial Carcinoma] |
| Top |
| Gene Expression for CCNC |
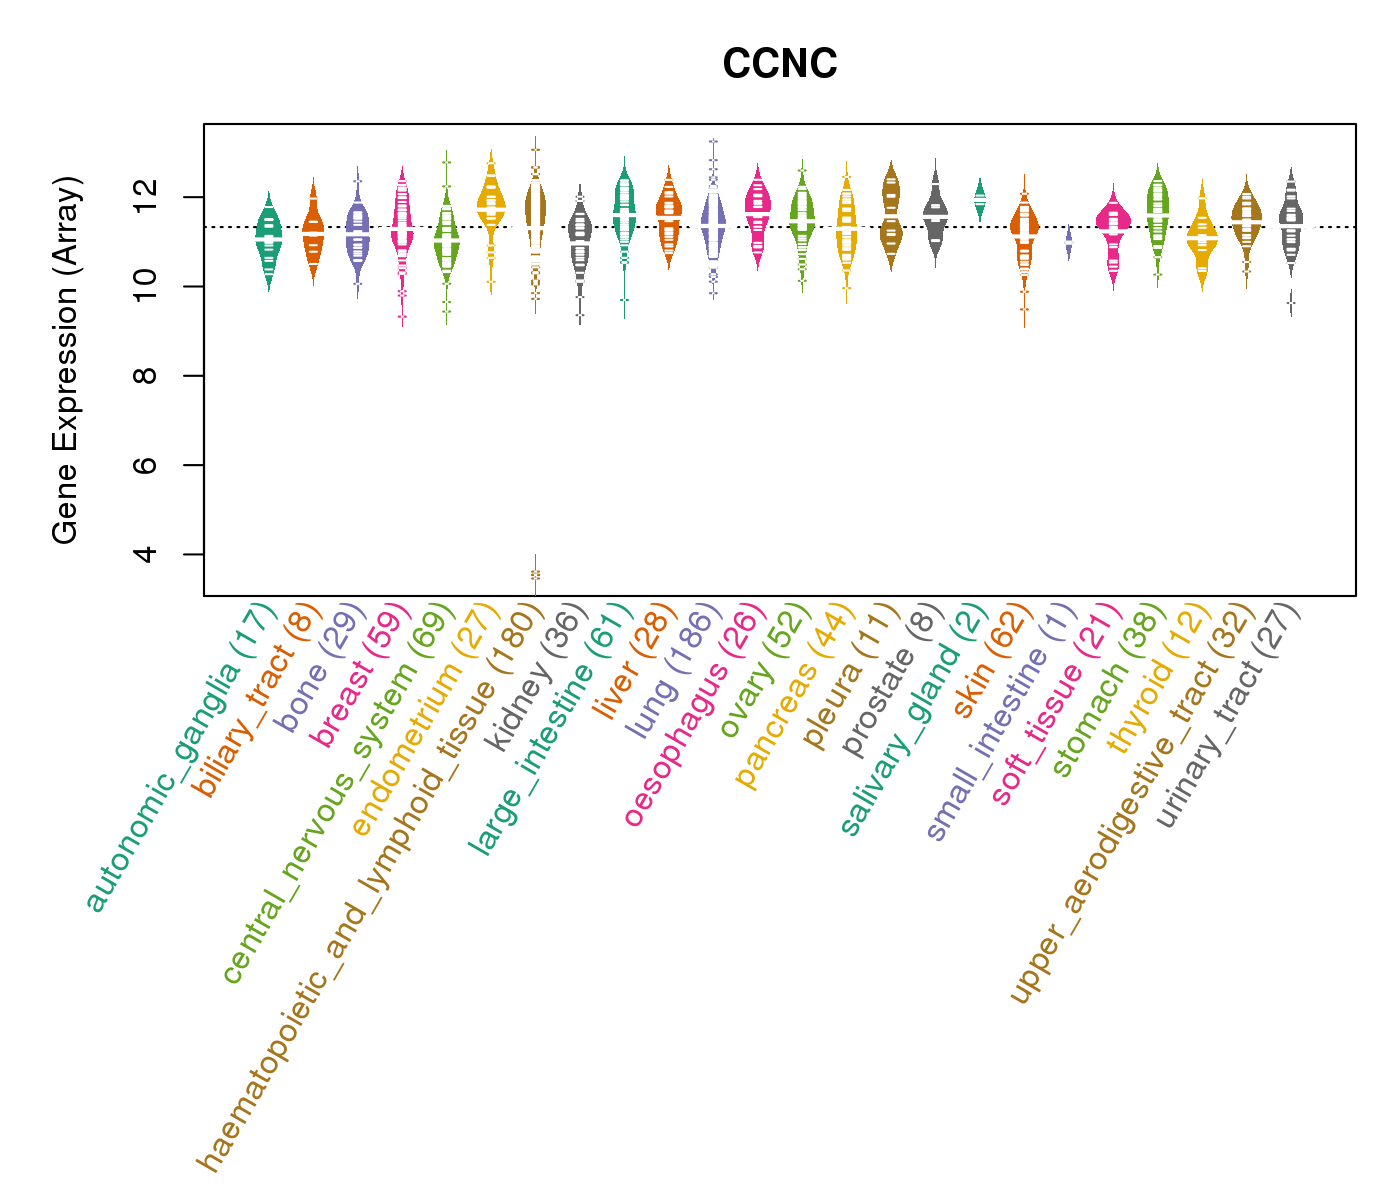
| * CCLE gene expression data were extracted from CCLE_Expression_Entrez_2012-10-18.res: Gene-centric RMA-normalized mRNA expression data. |
 |
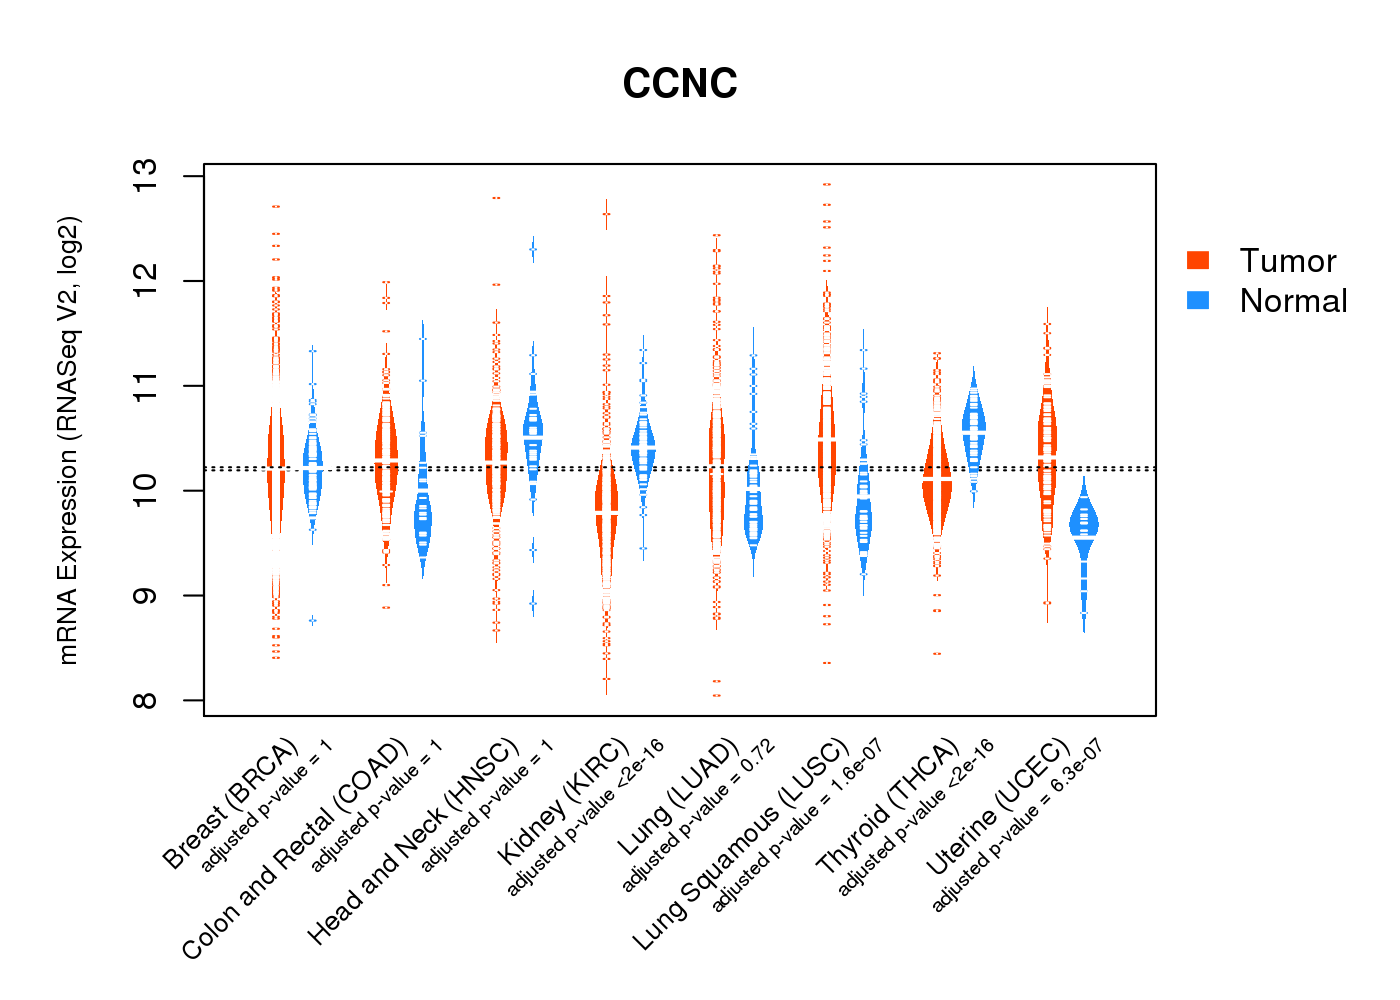
| * Normalized gene expression data of RNASeqV2 was extracted from TCGA using R package TCGA-Assembler. The URLs of all public data files on TCGA DCC data server were gathered at Jan-05-2015. Only eight cancer types have enough normal control samples for differential expression analysis. (t test, adjusted p<0.05 (using Benjamini-Hochberg FDR)) |
 |
| Top |
| * This plots show the correlation between CNV and gene expression. |
: Open all plots for all cancer types
 |
|
 |
|
| Top |
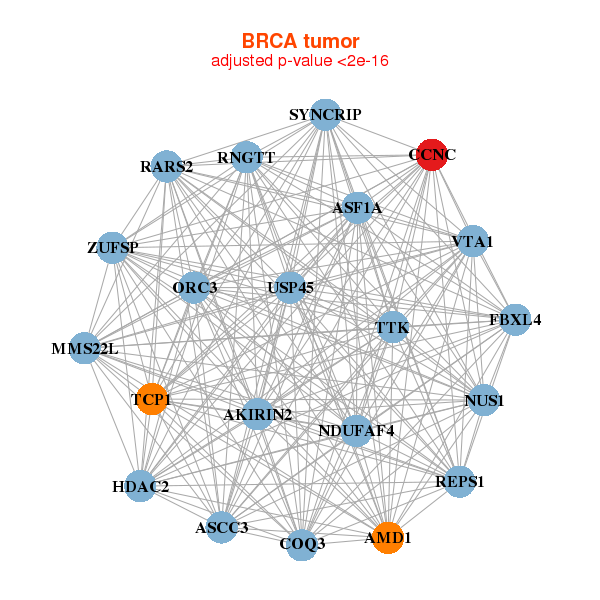
| Gene-Gene Network Information |
| * Co-Expression network figures were drawn using R package igraph. Only the top 20 genes with the highest correlations were shown. Red circle: input gene, orange circle: cell metabolism gene, sky circle: other gene |
: Open all plots for all cancer types
 |
|
| AKIRIN2,AMD1,ASCC3,ASF1A,MMS22L,CCNC,COQ3, FBXL4,HDAC2,NDUFAF4,NUS1,ORC3,RARS2,REPS1, RNGTT,SYNCRIP,TCP1,TTK,USP45,VTA1,ZUFSP | BET1,C18orf32,CCNC,GGPS1,GOLPH3,JKAMP,MARCH5, NUS1,RAB14,RAB18,SCOC,SERP1,SLMO2,SPTLC1, SRP9,SSR1,TMED2,TMED7,TMEM33,TMX1,TWF1 |
 |
|
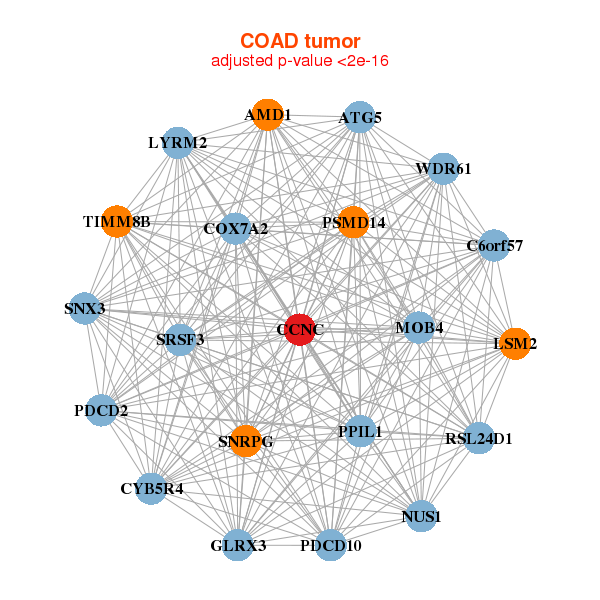
| AMD1,ATG5,C6orf57,CCNC,COX7A2,CYB5R4,GLRX3, LSM2,LYRM2,MOB4,NUS1,PDCD10,PDCD2,PPIL1, PSMD14,RSL24D1,SRSF3,SNRPG,SNX3,TIMM8B,WDR61 | ALG5,C14orf119,CCNC,CNIH1,COMMD8,GLRX3,LAMTOR5, HSBP1,LYPLA1,MED31,MRPL13,MRPL22,MRPL32,MRPL49, PHF5A,SELT,SEP15,TMEM126B,TXNDC9,VPS29,WDR61 |
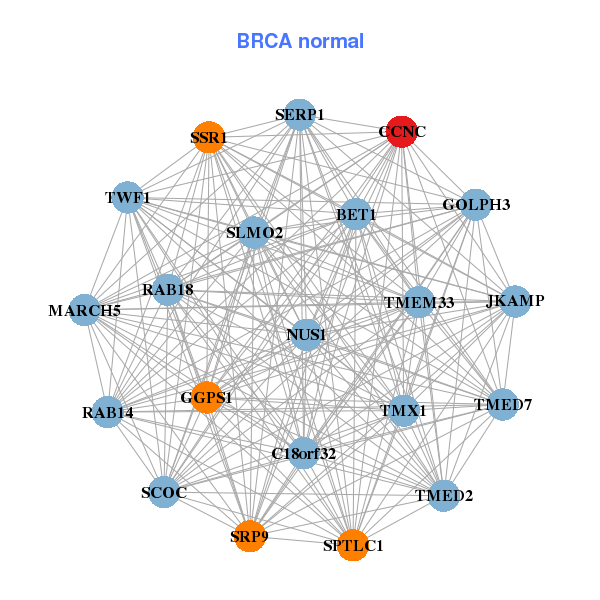
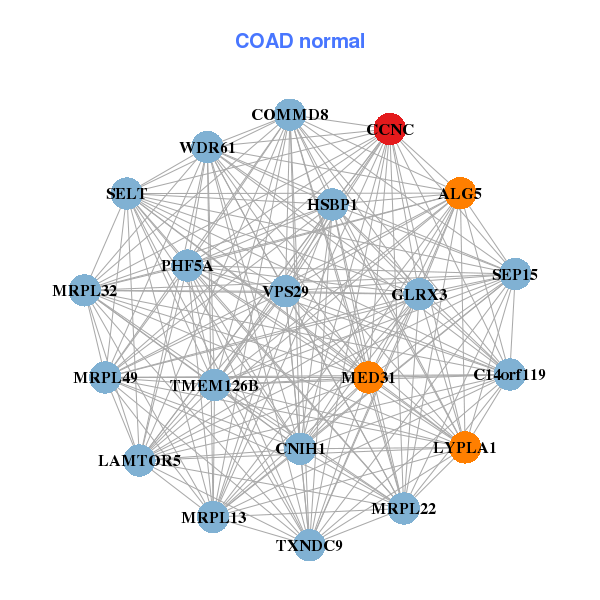
| * Co-Expression network figures were drawn using R package igraph. Only the top 20 genes with the highest correlations were shown. Red circle: input gene, orange circle: cell metabolism gene, sky circle: other gene |
: Open all plots for all cancer types
| Top |
: Open all interacting genes' information including KEGG pathway for all interacting genes from DAVID
| Top |
| Pharmacological Information for CCNC |
| There's no related Drug. |
| Top |
| Cross referenced IDs for CCNC |
| * We obtained these cross-references from Uniprot database. It covers 150 different DBs, 18 categories. http://www.uniprot.org/help/cross_references_section |
: Open all cross reference information
|
Copyright © 2016-Present - The Univsersity of Texas Health Science Center at Houston @ |