|
||||||||||||||||||||||||||||||||||||||||||||||||||||||||||||||||||||||||||||||||||||||||||||||||||||||||||||||||||||||||||||||||||||||||||||||||||||||||||||||||||||||||||||||||||||||||||||||||||||||||||||||||||||||||||||||||||||||||||||||||||||||||||||||||||||||||||||||||||||||||||||||||||||||||||||||||||||||||||
| |
| Phenotypic Information (metabolism pathway, cancer, disease, phenome) |
| |
| |
| Gene-Gene Network Information: Co-Expression Network, Interacting Genes & KEGG |
| |
|


| Gene Summary for PLCZ1 |
| Basic gene info. | Gene symbol | PLCZ1 |
| Gene name | phospholipase C, zeta 1 | |
| Synonyms | NYD-SP27|PLC-zeta-1|PLCzeta | |
| Cytomap | UCSC genome browser: 12p12.3 | |
| Genomic location | chr12 :18836115-18890918 | |
| Type of gene | protein-coding | |
| RefGenes | NM_033123.3, NR_073075.1, | |
| Ensembl id | ENSG00000139151 | |
| Description | 1-phosphatidylinositol 4,5-bisphosphate phosphodiesterase zeta-1PI-phospholipase C zeta 1PLC-zeta-1phosphoinositide phospholipase C-zeta-1testis-development related NYD-SP27 | |
| Modification date | 20141207 | |
| dbXrefs | MIM : 608075 | |
| HGNC : HGNC | ||
| Ensembl : ENSG00000139151 | ||
| HPRD : 06996 | ||
| Vega : OTTHUMG00000168937 | ||
| Protein | UniProt: go to UniProt's Cross Reference DB Table | |
| Expression | CleanEX: HS_PLCZ1 | |
| BioGPS: 89869 | ||
| Gene Expression Atlas: ENSG00000139151 | ||
| The Human Protein Atlas: ENSG00000139151 | ||
| Pathway | NCI Pathway Interaction Database: PLCZ1 | |
| KEGG: PLCZ1 | ||
| REACTOME: PLCZ1 | ||
| ConsensusPathDB | ||
| Pathway Commons: PLCZ1 | ||
| Metabolism | MetaCyc: PLCZ1 | |
| HUMANCyc: PLCZ1 | ||
| Regulation | Ensembl's Regulation: ENSG00000139151 | |
| miRBase: chr12 :18,836,115-18,890,918 | ||
| TargetScan: NM_033123 | ||
| cisRED: ENSG00000139151 | ||
| Context | iHOP: PLCZ1 | |
| cancer metabolism search in PubMed: PLCZ1 | ||
| UCL Cancer Institute: PLCZ1 | ||
| Assigned class in ccmGDB | C | |
| Top |
| Phenotypic Information for PLCZ1(metabolism pathway, cancer, disease, phenome) |
| Cancer | CGAP: PLCZ1 |
| Familial Cancer Database: PLCZ1 | |
| * This gene is included in those cancer gene databases. |
|
|
|
|
|
| . | ||||||||||||||||||||||||||||||||||||||||||||||||||||||||||||||||||||||||||||||||||||||||||||||||||||||||||||||||||||||||||||||||||||||||||||||||||||||||||||||||||||||||||||||||||||||||||||||||||||||||||||||||||||||||||||||||||||||||||||||||||||||||||||||||||||||||||||||||||||||||||||||||||||||||||||||||||||
Oncogene 1 | Significant driver gene in | |||||||||||||||||||||||||||||||||||||||||||||||||||||||||||||||||||||||||||||||||||||||||||||||||||||||||||||||||||||||||||||||||||||||||||||||||||||||||||||||||||||||||||||||||||||||||||||||||||||||||||||||||||||||||||||||||||||||||||||||||||||||||||||||||||||||||||||||||||||||||||||||||||||||||||||||||||||||||
| cf) number; DB name 1 Oncogene; http://nar.oxfordjournals.org/content/35/suppl_1/D721.long, 2 Tumor Suppressor gene; https://bioinfo.uth.edu/TSGene/, 3 Cancer Gene Census; http://www.nature.com/nrc/journal/v4/n3/abs/nrc1299.html, 4 CancerGenes; http://nar.oxfordjournals.org/content/35/suppl_1/D721.long, 5 Network of Cancer Gene; http://ncg.kcl.ac.uk/index.php, 1Therapeutic Vulnerabilities in Cancer; http://cbio.mskcc.org/cancergenomics/statius/ |
| KEGG_INOSITOL_PHOSPHATE_METABOLISM | |
| OMIM | |
| Orphanet | |
| Disease | KEGG Disease: PLCZ1 |
| MedGen: PLCZ1 (Human Medical Genetics with Condition) | |
| ClinVar: PLCZ1 | |
| Phenotype | MGI: PLCZ1 (International Mouse Phenotyping Consortium) |
| PhenomicDB: PLCZ1 | |
| Mutations for PLCZ1 |
| * Under tables are showing count per each tissue to give us broad intuition about tissue specific mutation patterns.You can go to the detailed page for each mutation database's web site. |
| - Statistics for Tissue and Mutation type | Top |
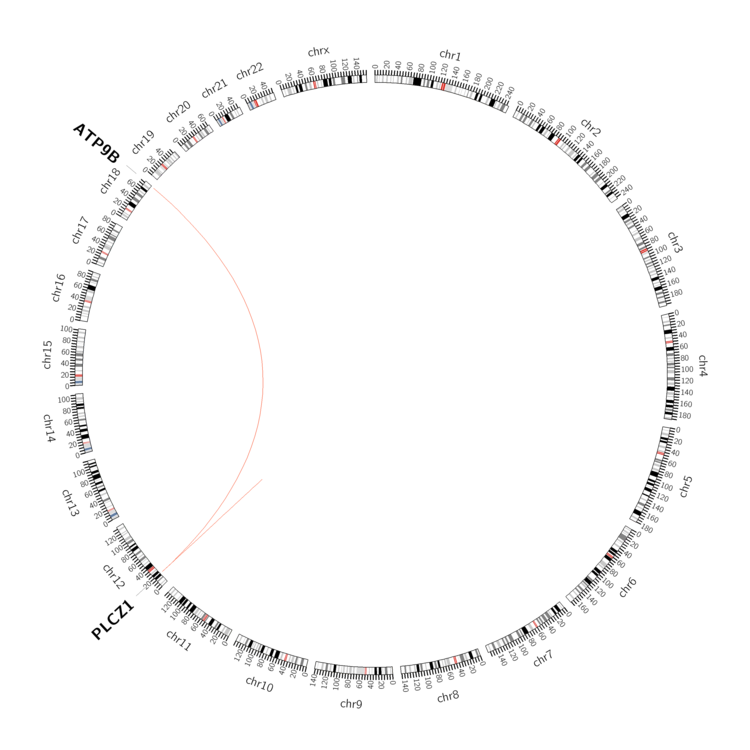 |
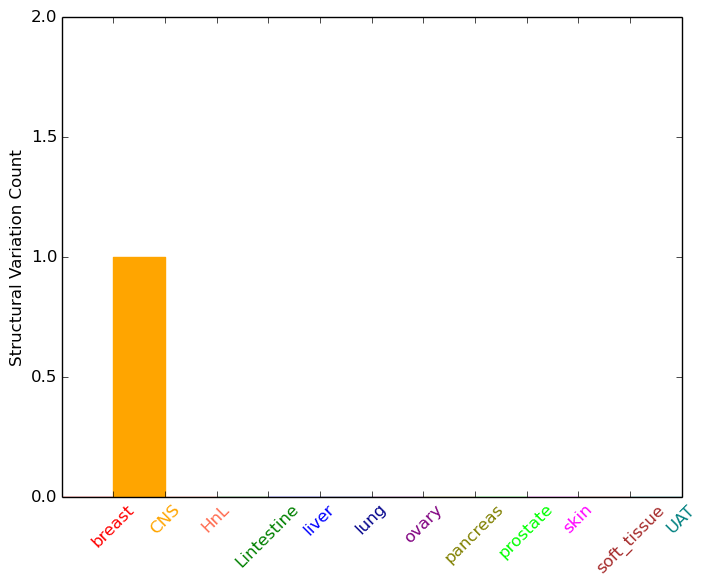
| - For Inter-chromosomal Variations |
| * Inter-chromosomal variantions includes 'interchromosomal amplicon to amplicon', 'interchromosomal amplicon to non-amplified dna', 'interchromosomal insertion', 'Interchromosomal unknown type'. |
 |
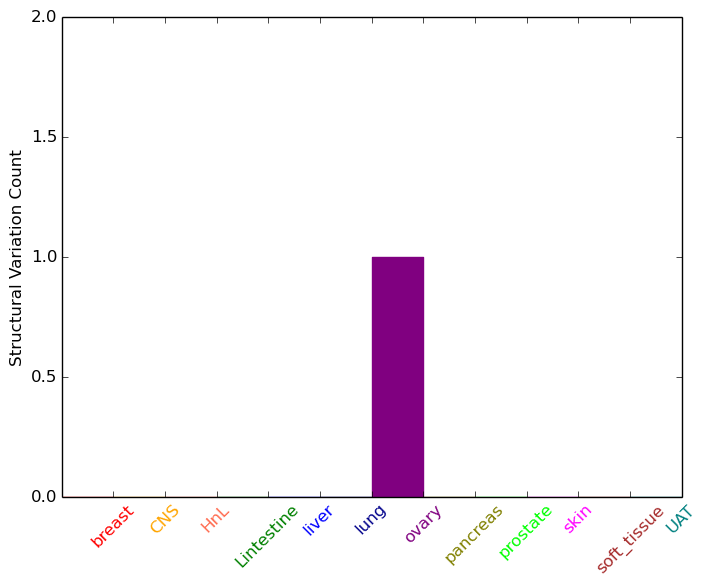
| - For Intra-chromosomal Variations |
| * Intra-chromosomal variantions includes 'intrachromosomal amplicon to amplicon', 'intrachromosomal amplicon to non-amplified dna', 'intrachromosomal deletion', 'intrachromosomal fold-back inversion', 'intrachromosomal inversion', 'intrachromosomal tandem duplication', 'Intrachromosomal unknown type', 'intrachromosomal with inverted orientation', 'intrachromosomal with non-inverted orientation'. |
 |
| Sample | Symbol_a | Chr_a | Start_a | End_a | Symbol_b | Chr_b | Start_b | End_b |
| central_nervous_system | PLCZ1 | chr12 | 18885514 | 18885514 | ATP9B | chr18 | 77018010 | 77018010 |
| ovary | PLCZ1 | chr12 | 18855621 | 18855641 | PLCZ1 | chr12 | 18851026 | 18851046 |
| cf) Tissue number; Tissue name (1;Breast, 2;Central_nervous_system, 3;Haematopoietic_and_lymphoid_tissue, 4;Large_intestine, 5;Liver, 6;Lung, 7;Ovary, 8;Pancreas, 9;Prostate, 10;Skin, 11;Soft_tissue, 12;Upper_aerodigestive_tract) |
| * From mRNA Sanger sequences, Chitars2.0 arranged chimeric transcripts. This table shows PLCZ1 related fusion information. |
| ID | Head Gene | Tail Gene | Accession | Gene_a | qStart_a | qEnd_a | Chromosome_a | tStart_a | tEnd_a | Gene_a | qStart_a | qEnd_a | Chromosome_a | tStart_a | tEnd_a |
| BU588824 | PLCZ1 | 4 | 145 | 12 | 18845685 | 18845841 | GNPTG | 137 | 328 | 16 | 1413162 | 1413353 | |
| Top |
| Mutation type/ Tissue ID | brca | cns | cerv | endome | haematopo | kidn | Lintest | liver | lung | ns | ovary | pancre | prost | skin | stoma | thyro | urina | |||
| Total # sample | 1 | 1 | ||||||||||||||||||
| GAIN (# sample) | 1 | 1 | ||||||||||||||||||
| LOSS (# sample) |
| cf) Tissue ID; Tissue type (1; Breast, 2; Central_nervous_system, 3; Cervix, 4; Endometrium, 5; Haematopoietic_and_lymphoid_tissue, 6; Kidney, 7; Large_intestine, 8; Liver, 9; Lung, 10; NS, 11; Ovary, 12; Pancreas, 13; Prostate, 14; Skin, 15; Stomach, 16; Thyroid, 17; Urinary_tract) |
| Top |
|
 |
| Top |
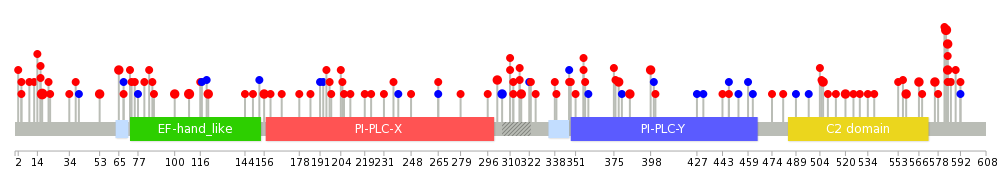
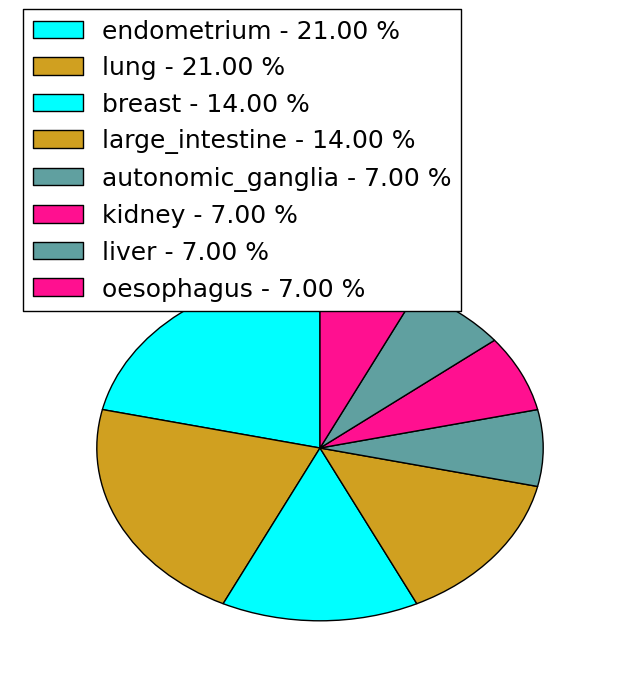
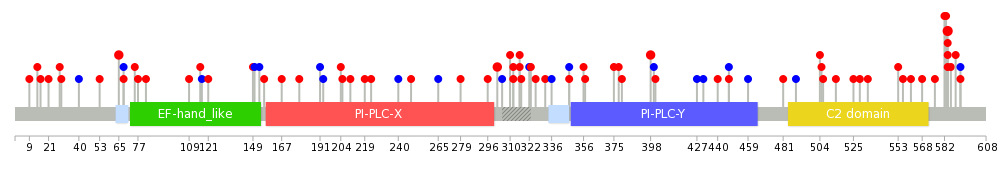
| Stat. for Non-Synonymous SNVs (# total SNVs=71) | (# total SNVs=14) |
 |  |
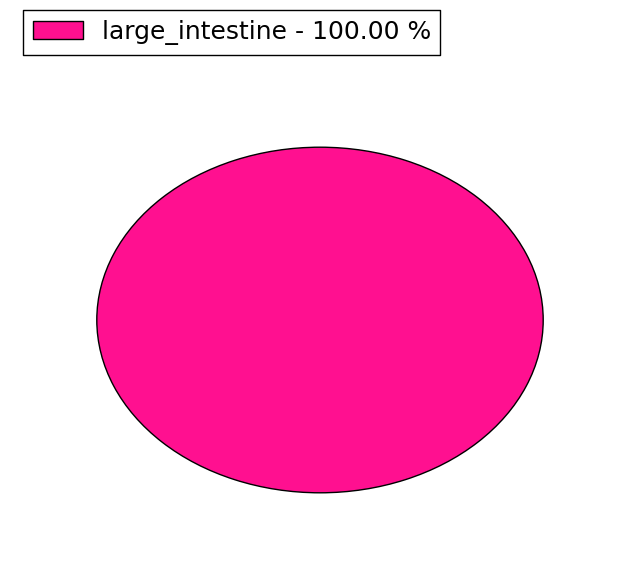
(# total SNVs=0) | (# total SNVs=2) |
 |
| Top |
| * When you move the cursor on each content, you can see more deailed mutation information on the Tooltip. Those are primary_site,primary_histology,mutation(aa),pubmedID. |
| GRCh37 position | Mutation(aa) | Unique sampleID count |
| chr12:18889240-18889240 | p.G17E | 4 |
| chr12:18876287-18876287 | p.I109F | 3 |
| chr12:18841083-18841083 | p.E511* | 3 |
| chr12:18836249-18836249 | p.R584H | 3 |
| chr12:18836250-18836250 | p.R584S | 3 |
| chr12:18836253-18836253 | p.R583C | 3 |
| chr12:18854660-18854660 | p.K305K | 2 |
| chr12:18854670-18854670 | p.G302E | 2 |
| chr12:18837079-18837079 | p.L576I | 2 |
| chr12:18889244-18889244 | p.G16S | 2 |
| Top |
|
 |
| Point Mutation/ Tissue ID | 1 | 2 | 3 | 4 | 5 | 6 | 7 | 8 | 9 | 10 | 11 | 12 | 13 | 14 | 15 | 16 | 17 | 18 | 19 | 20 |
| # sample | 2 | 5 | 14 | 1 | 4 | 1 | 1 | 9 | 5 | 1 | 25 | 3 | 11 | |||||||
| # mutation | 2 | 5 | 11 | 1 | 4 | 1 | 1 | 9 | 5 | 1 | 29 | 3 | 14 | |||||||
| nonsynonymous SNV | 2 | 3 | 10 | 1 | 3 | 1 | 8 | 4 | 1 | 20 | 2 | 11 | ||||||||
| synonymous SNV | 2 | 1 | 1 | 1 | 1 | 1 | 9 | 1 | 3 |
| cf) Tissue ID; Tissue type (1; BLCA[Bladder Urothelial Carcinoma], 2; BRCA[Breast invasive carcinoma], 3; CESC[Cervical squamous cell carcinoma and endocervical adenocarcinoma], 4; COAD[Colon adenocarcinoma], 5; GBM[Glioblastoma multiforme], 6; Glioma Low Grade, 7; HNSC[Head and Neck squamous cell carcinoma], 8; KICH[Kidney Chromophobe], 9; KIRC[Kidney renal clear cell carcinoma], 10; KIRP[Kidney renal papillary cell carcinoma], 11; LAML[Acute Myeloid Leukemia], 12; LUAD[Lung adenocarcinoma], 13; LUSC[Lung squamous cell carcinoma], 14; OV[Ovarian serous cystadenocarcinoma ], 15; PAAD[Pancreatic adenocarcinoma], 16; PRAD[Prostate adenocarcinoma], 17; SKCM[Skin Cutaneous Melanoma], 18:STAD[Stomach adenocarcinoma], 19:THCA[Thyroid carcinoma], 20:UCEC[Uterine Corpus Endometrial Carcinoma]) |
| Top |
| * We represented just top 10 SNVs. When you move the cursor on each content, you can see more deailed mutation information on the Tooltip. Those are primary_site, primary_histology, mutation(aa), pubmedID. |
| Genomic Position | Mutation(aa) | Unique sampleID count |
| chr12:18836249 | p.R584H | 4 |
| chr12:18854670 | p.H398Y | 2 |
| chr12:18849183 | p.R65Q | 2 |
| chr12:18876418 | p.G302E | 2 |
| chr12:18836250 | p.R584S | 2 |
| chr12:18849173 | p.L561V | 1 |
| chr12:18865880 | p.V431V | 1 |
| chr12:18836255 | p.K322K | 1 |
| chr12:18854458 | p.E210K | 1 |
| chr12:18876265 | p.F77L | 1 |
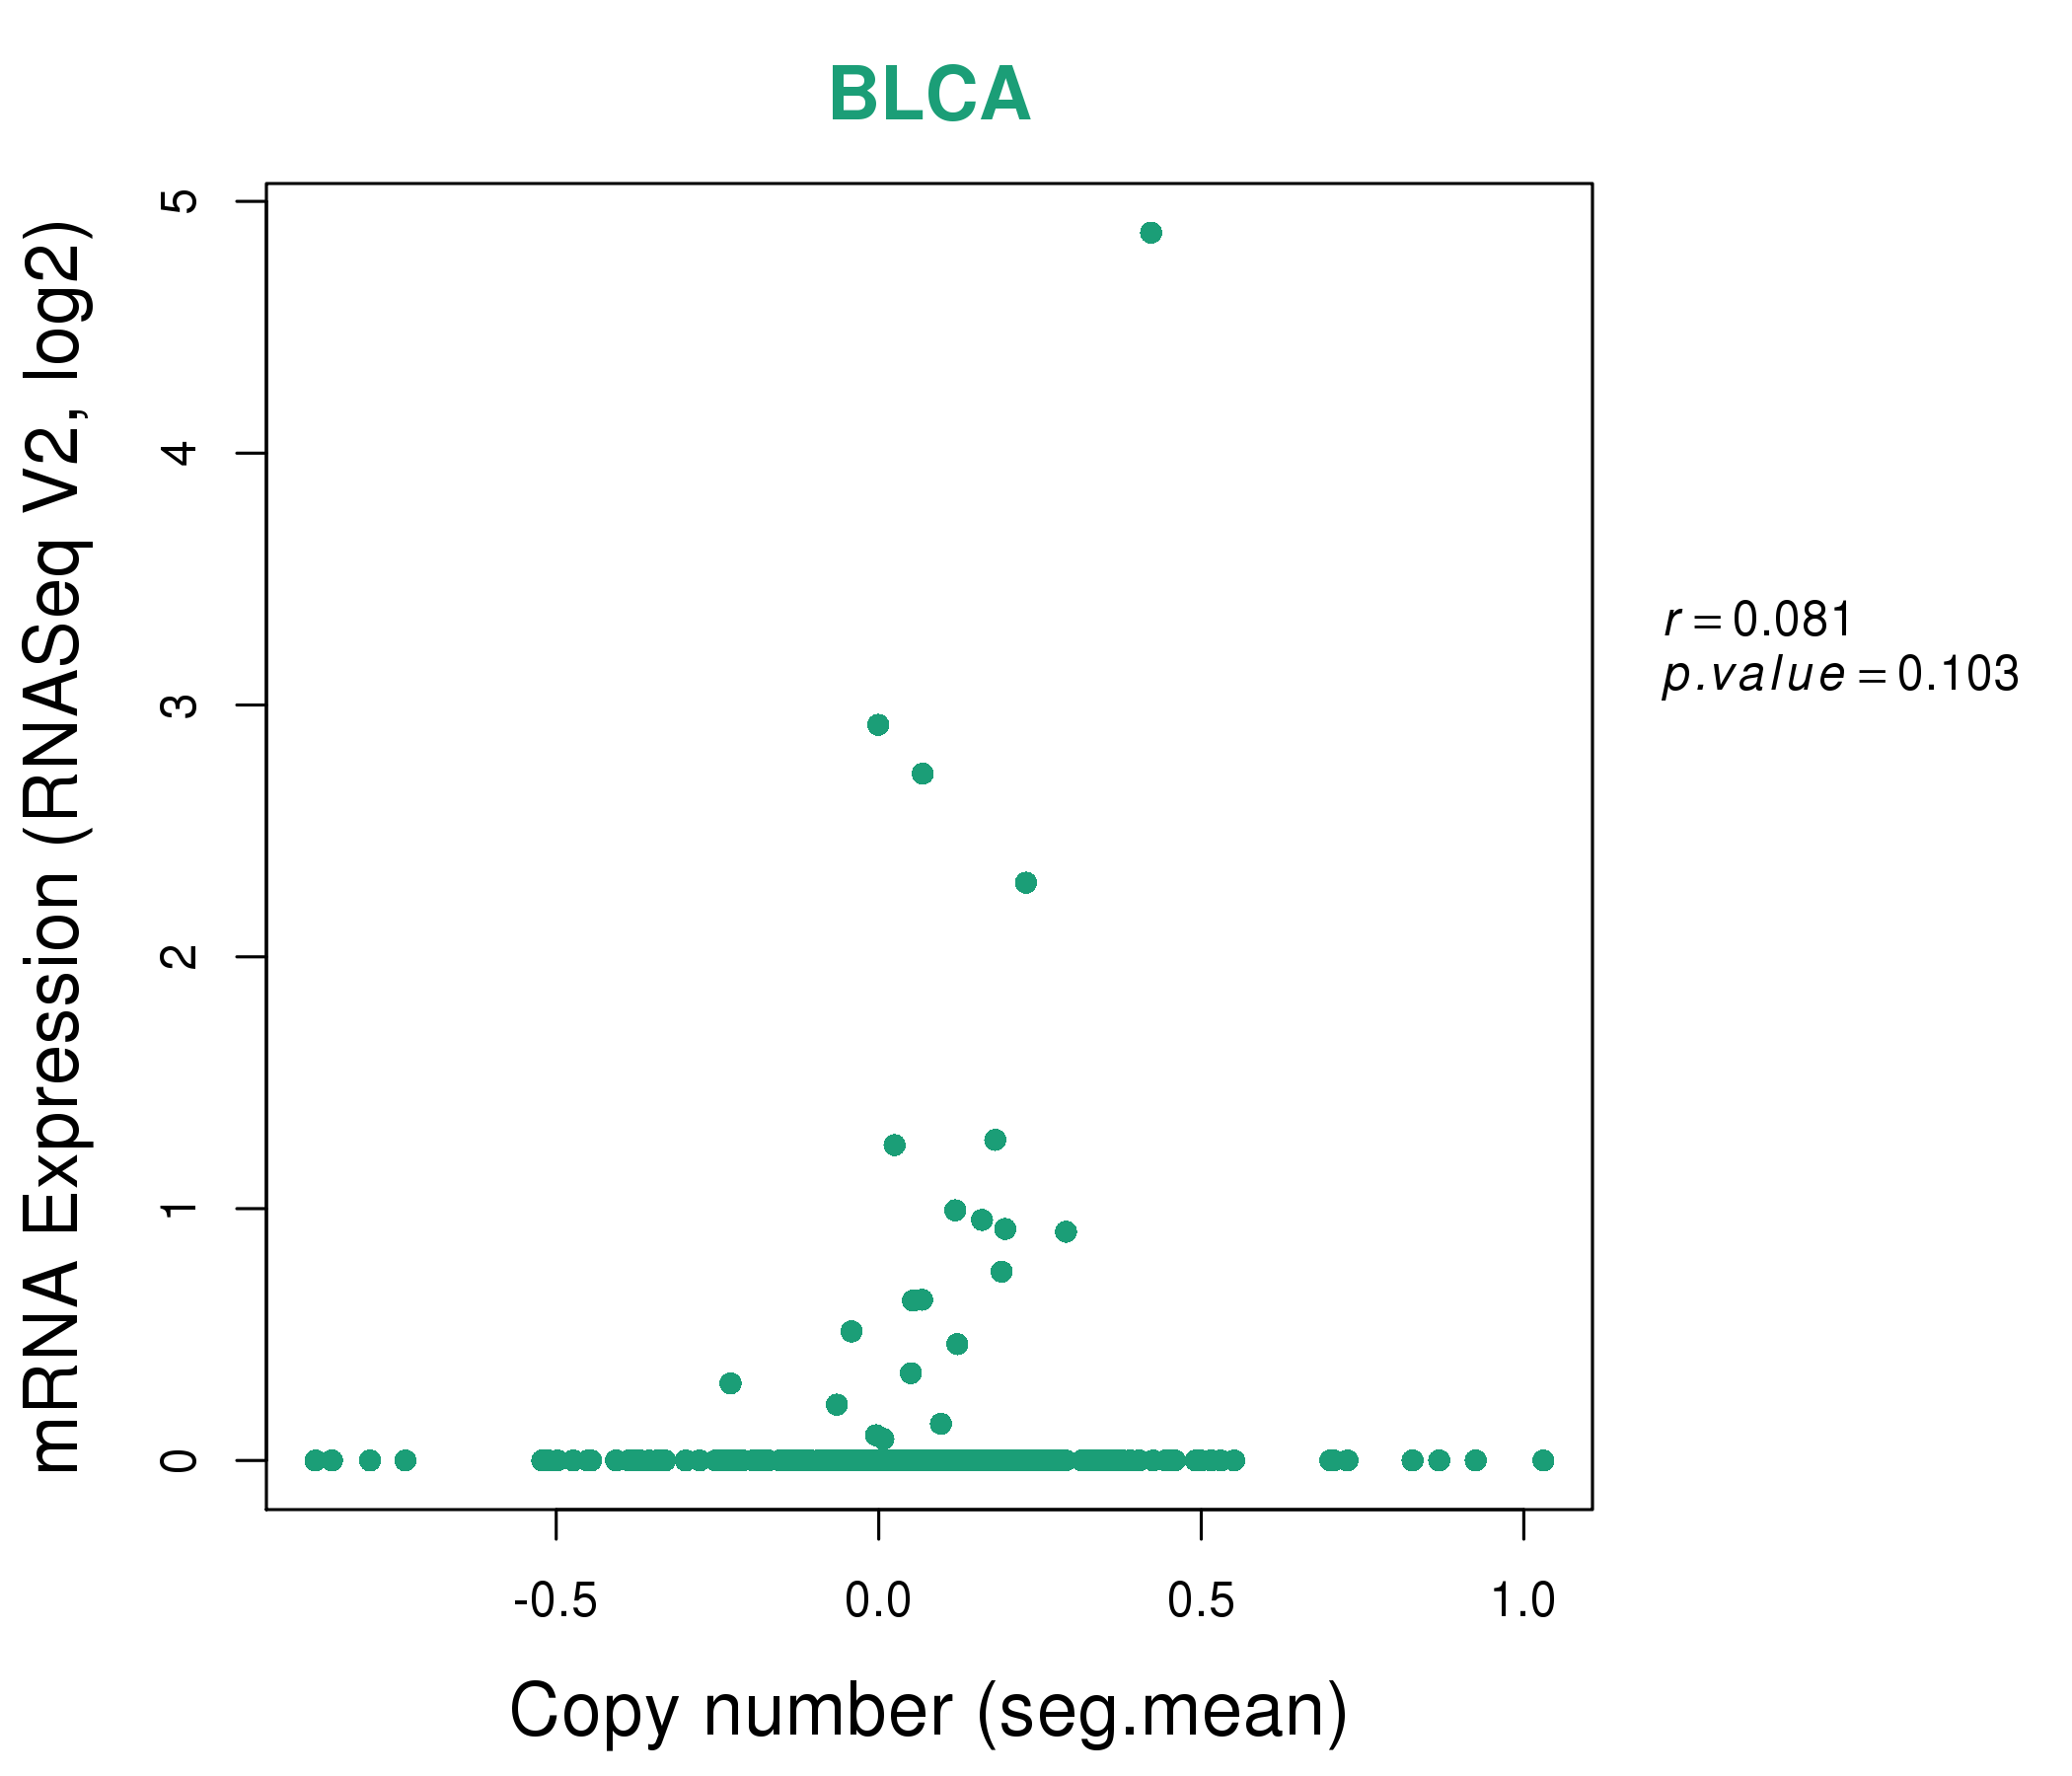
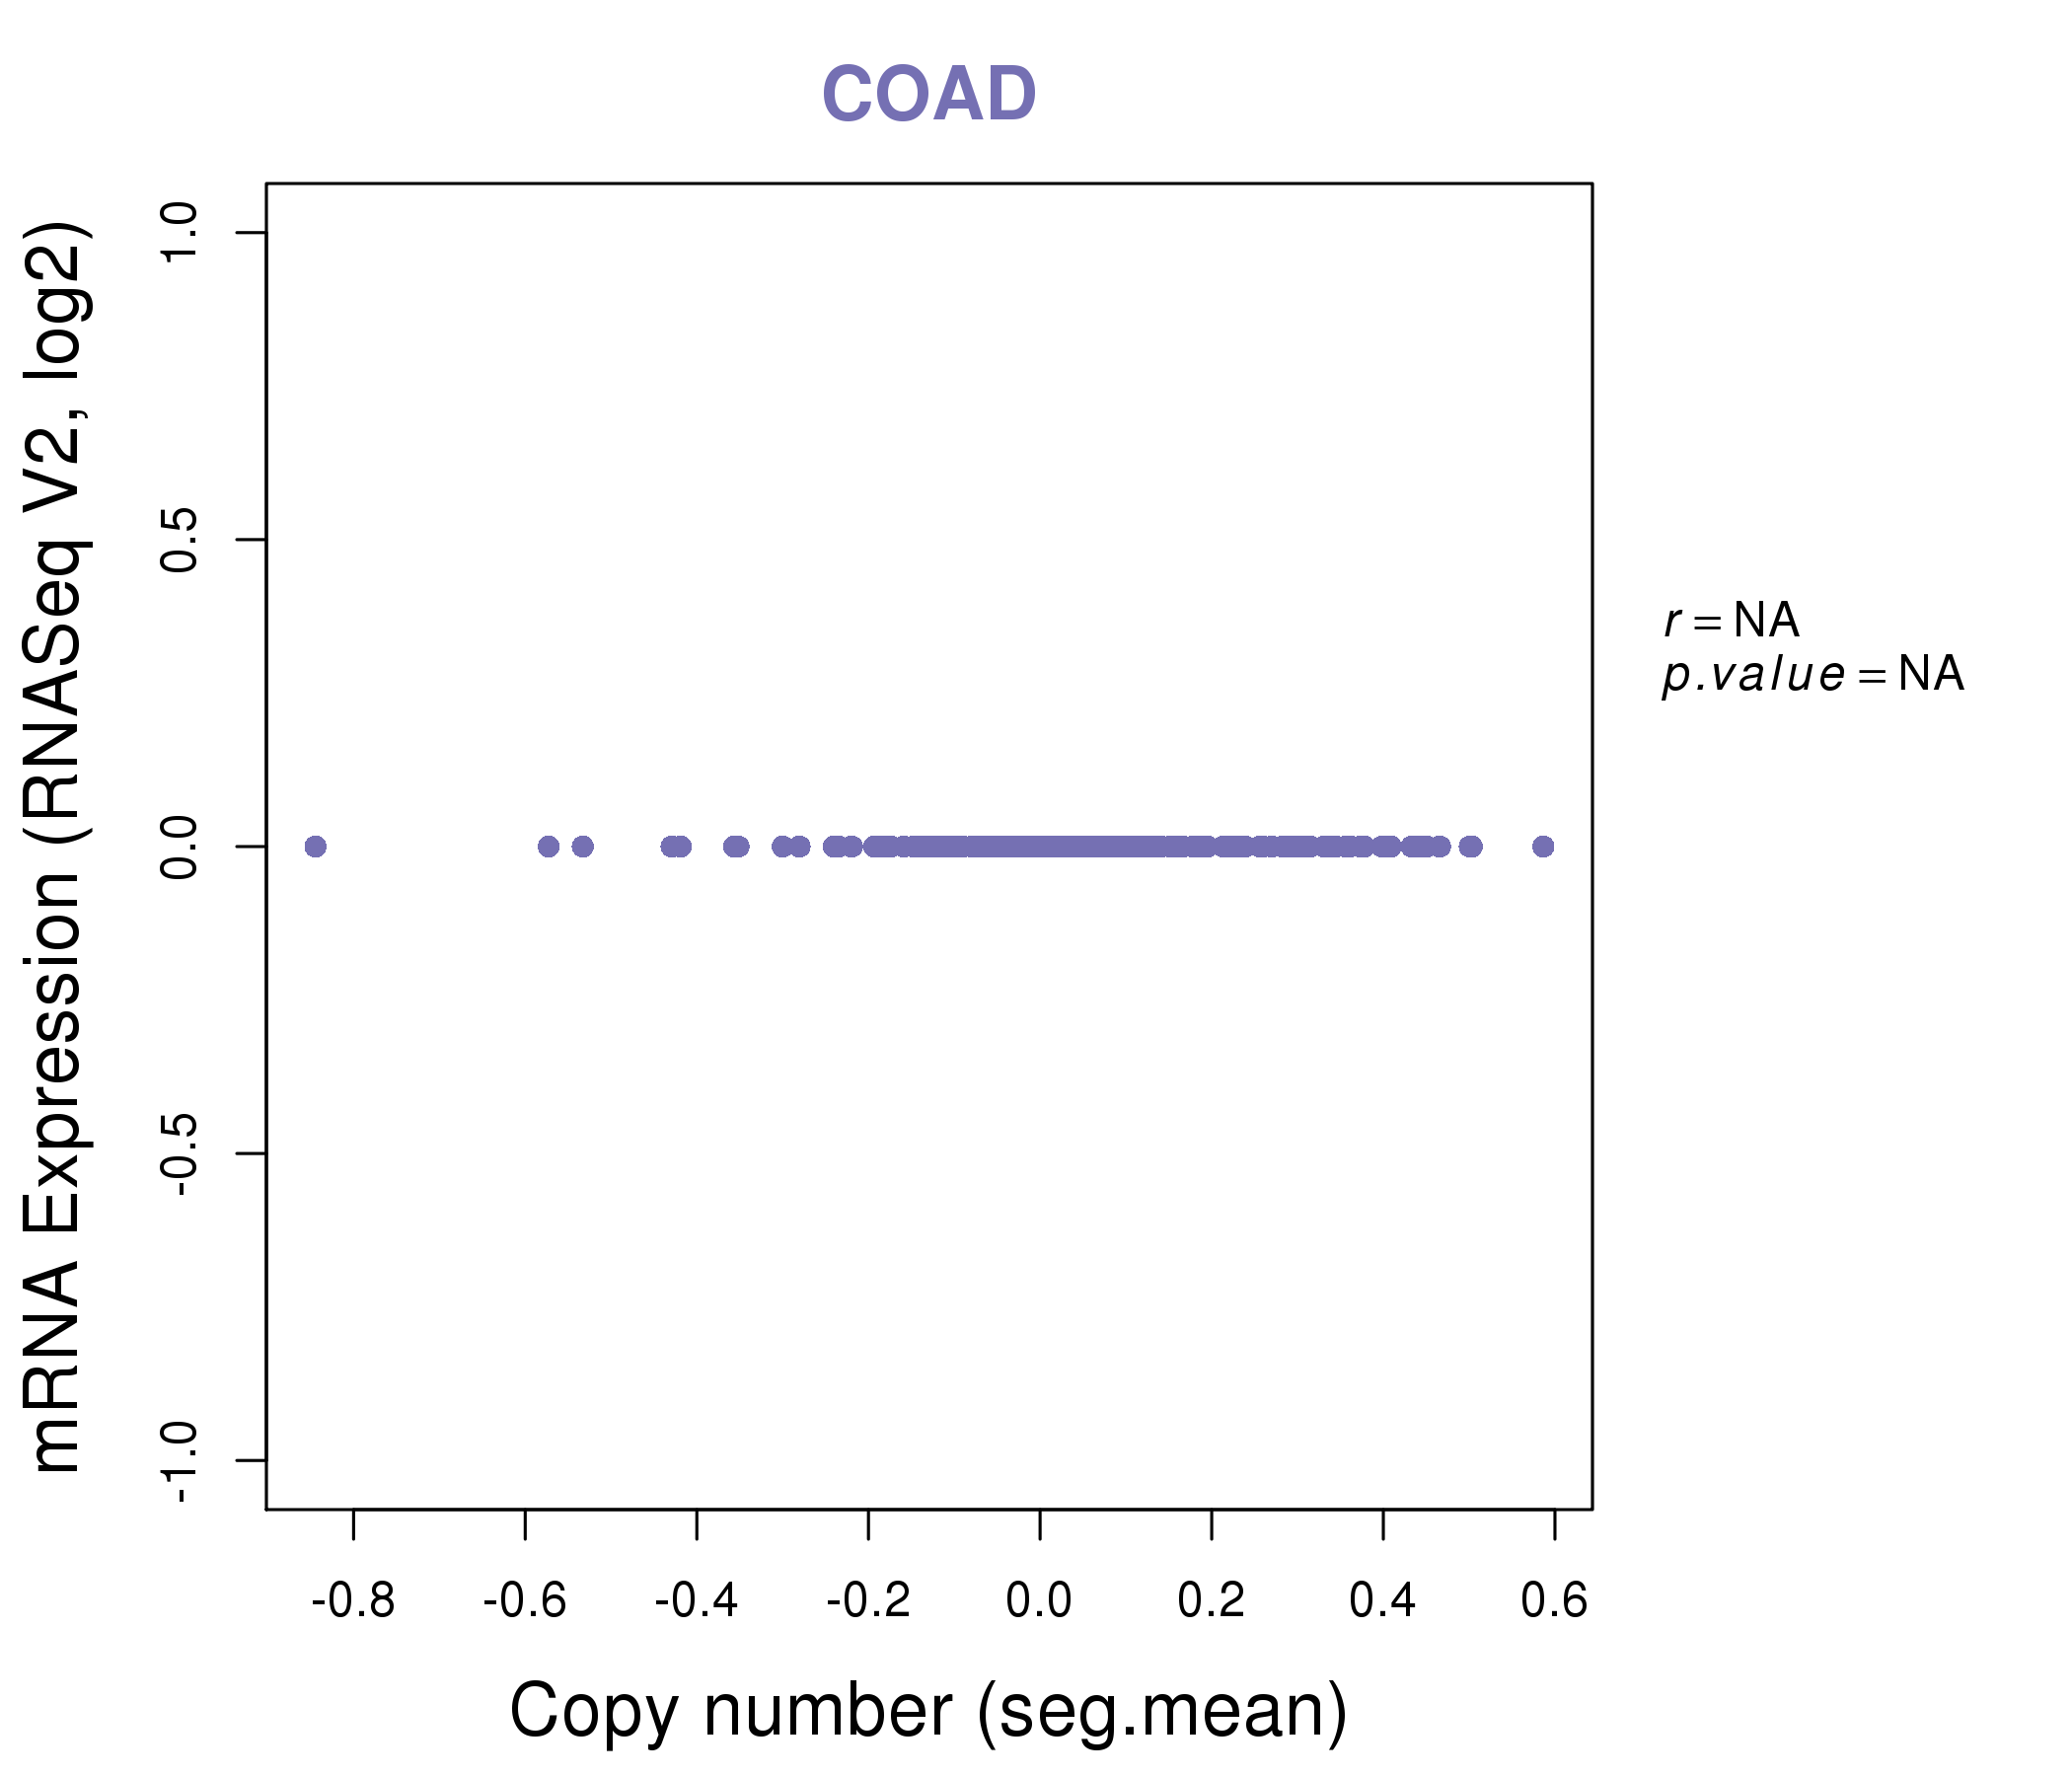
| * Copy number data were extracted from TCGA using R package TCGA-Assembler. The URLs of all public data files on TCGA DCC data server were gathered on Jan-05-2015. Function ProcessCNAData in TCGA-Assembler package was used to obtain gene-level copy number value which is calculated as the average copy number of the genomic region of a gene. |
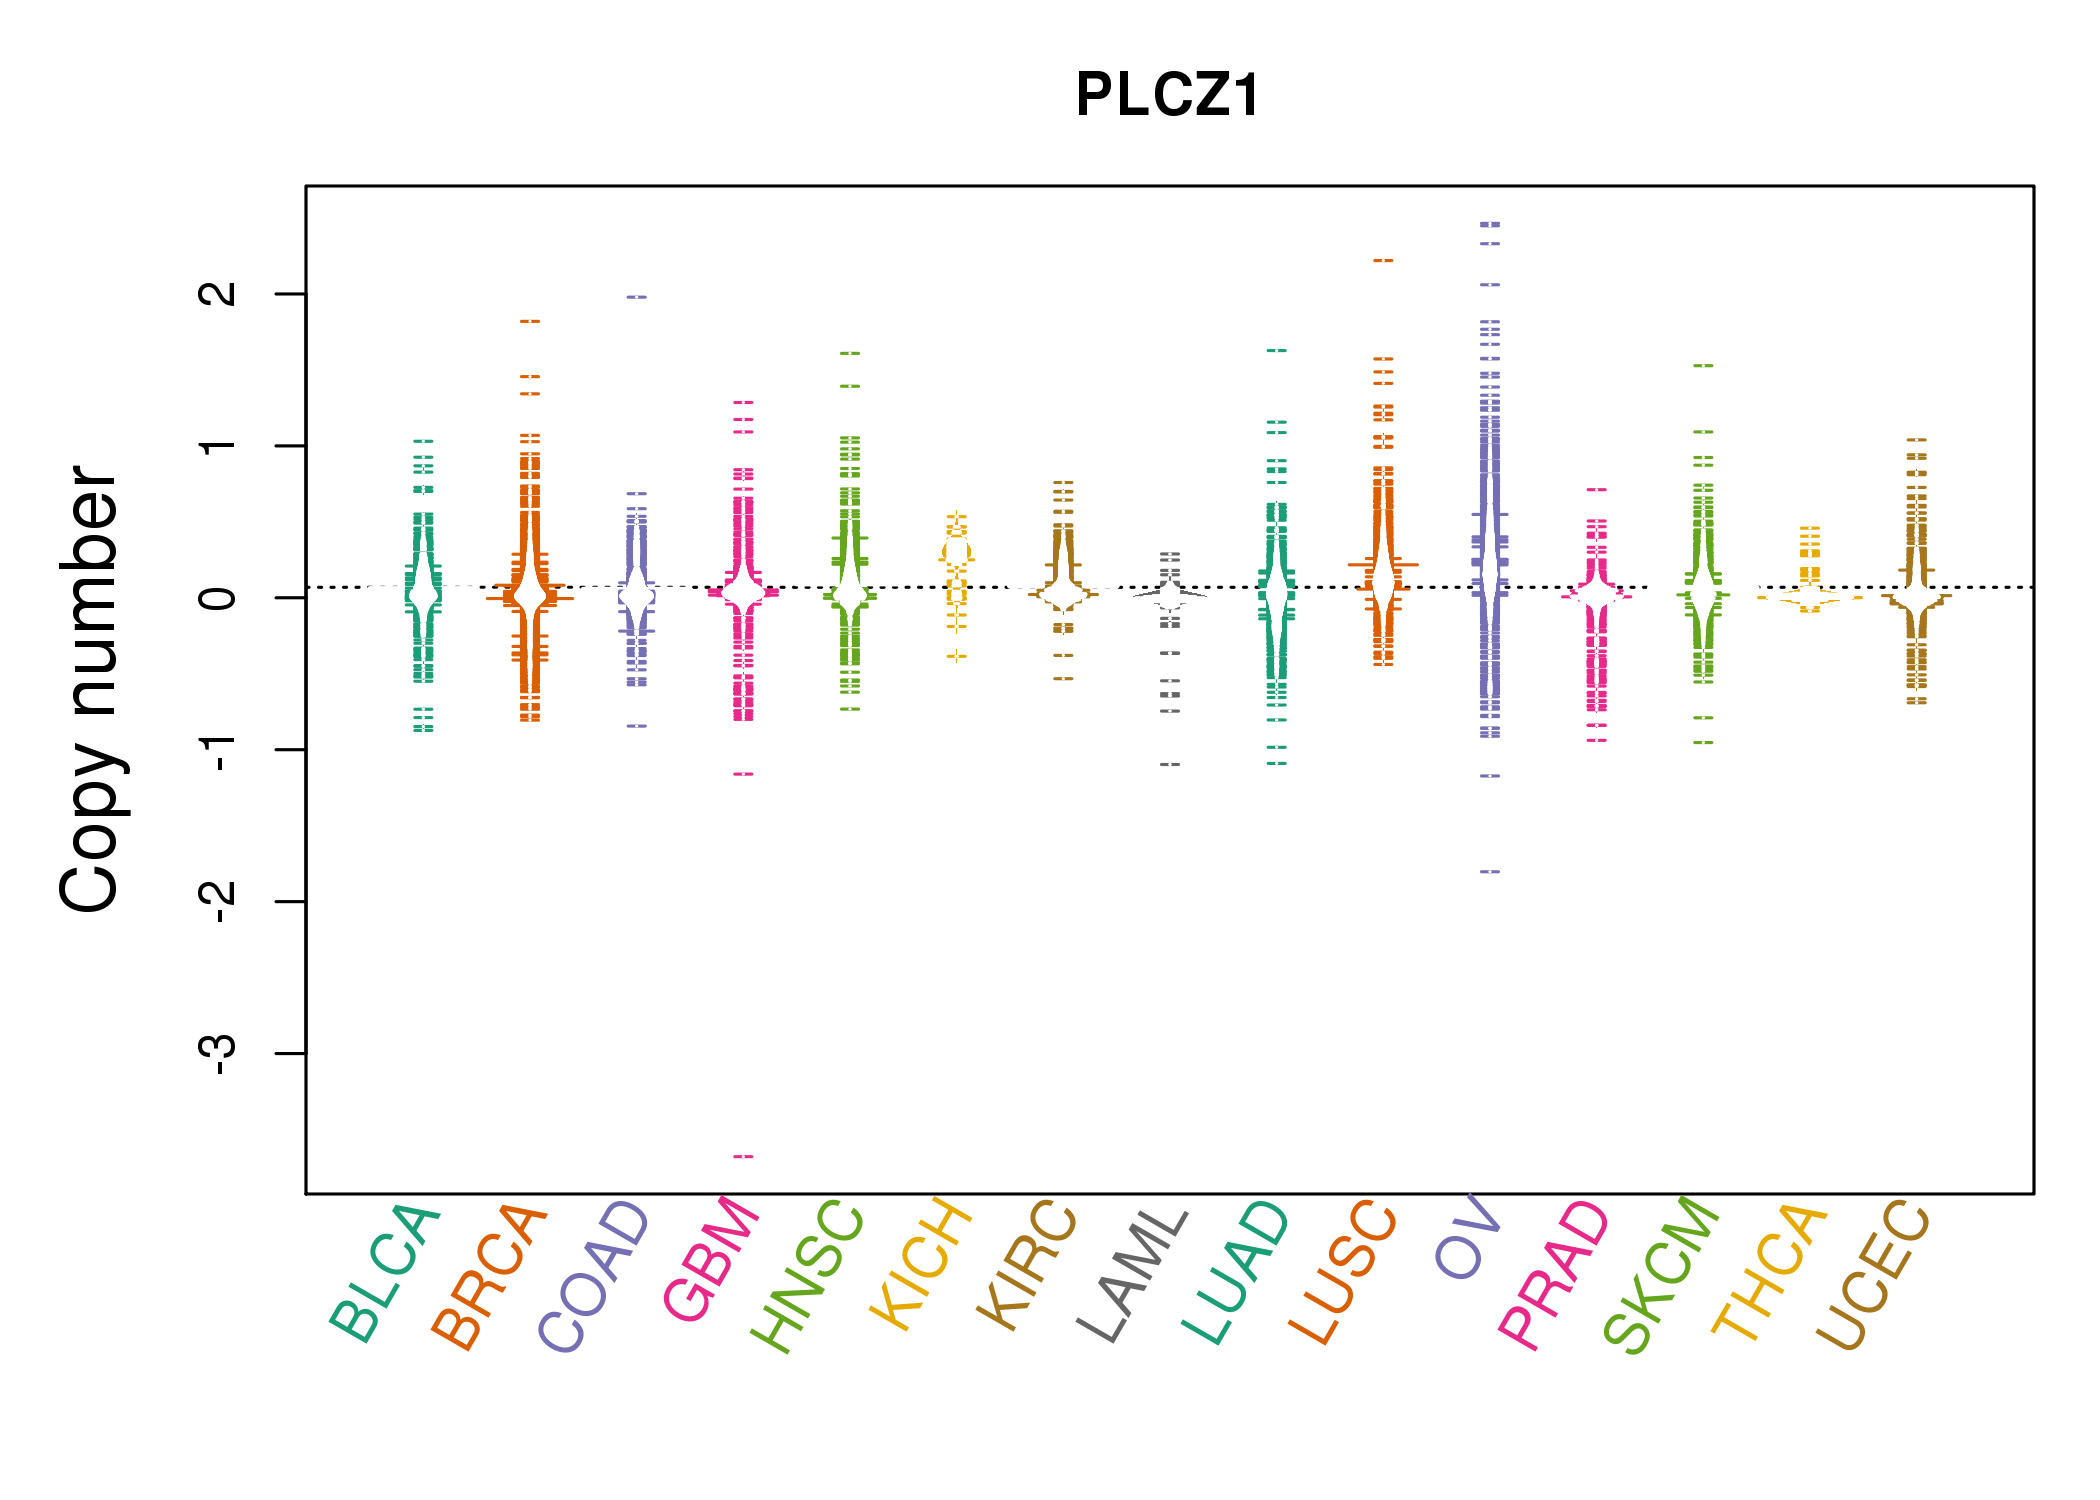 |
| cf) Tissue ID[Tissue type]: BLCA[Bladder Urothelial Carcinoma], BRCA[Breast invasive carcinoma], CESC[Cervical squamous cell carcinoma and endocervical adenocarcinoma], COAD[Colon adenocarcinoma], GBM[Glioblastoma multiforme], Glioma Low Grade, HNSC[Head and Neck squamous cell carcinoma], KICH[Kidney Chromophobe], KIRC[Kidney renal clear cell carcinoma], KIRP[Kidney renal papillary cell carcinoma], LAML[Acute Myeloid Leukemia], LUAD[Lung adenocarcinoma], LUSC[Lung squamous cell carcinoma], OV[Ovarian serous cystadenocarcinoma ], PAAD[Pancreatic adenocarcinoma], PRAD[Prostate adenocarcinoma], SKCM[Skin Cutaneous Melanoma], STAD[Stomach adenocarcinoma], THCA[Thyroid carcinoma], UCEC[Uterine Corpus Endometrial Carcinoma] |
| Top |
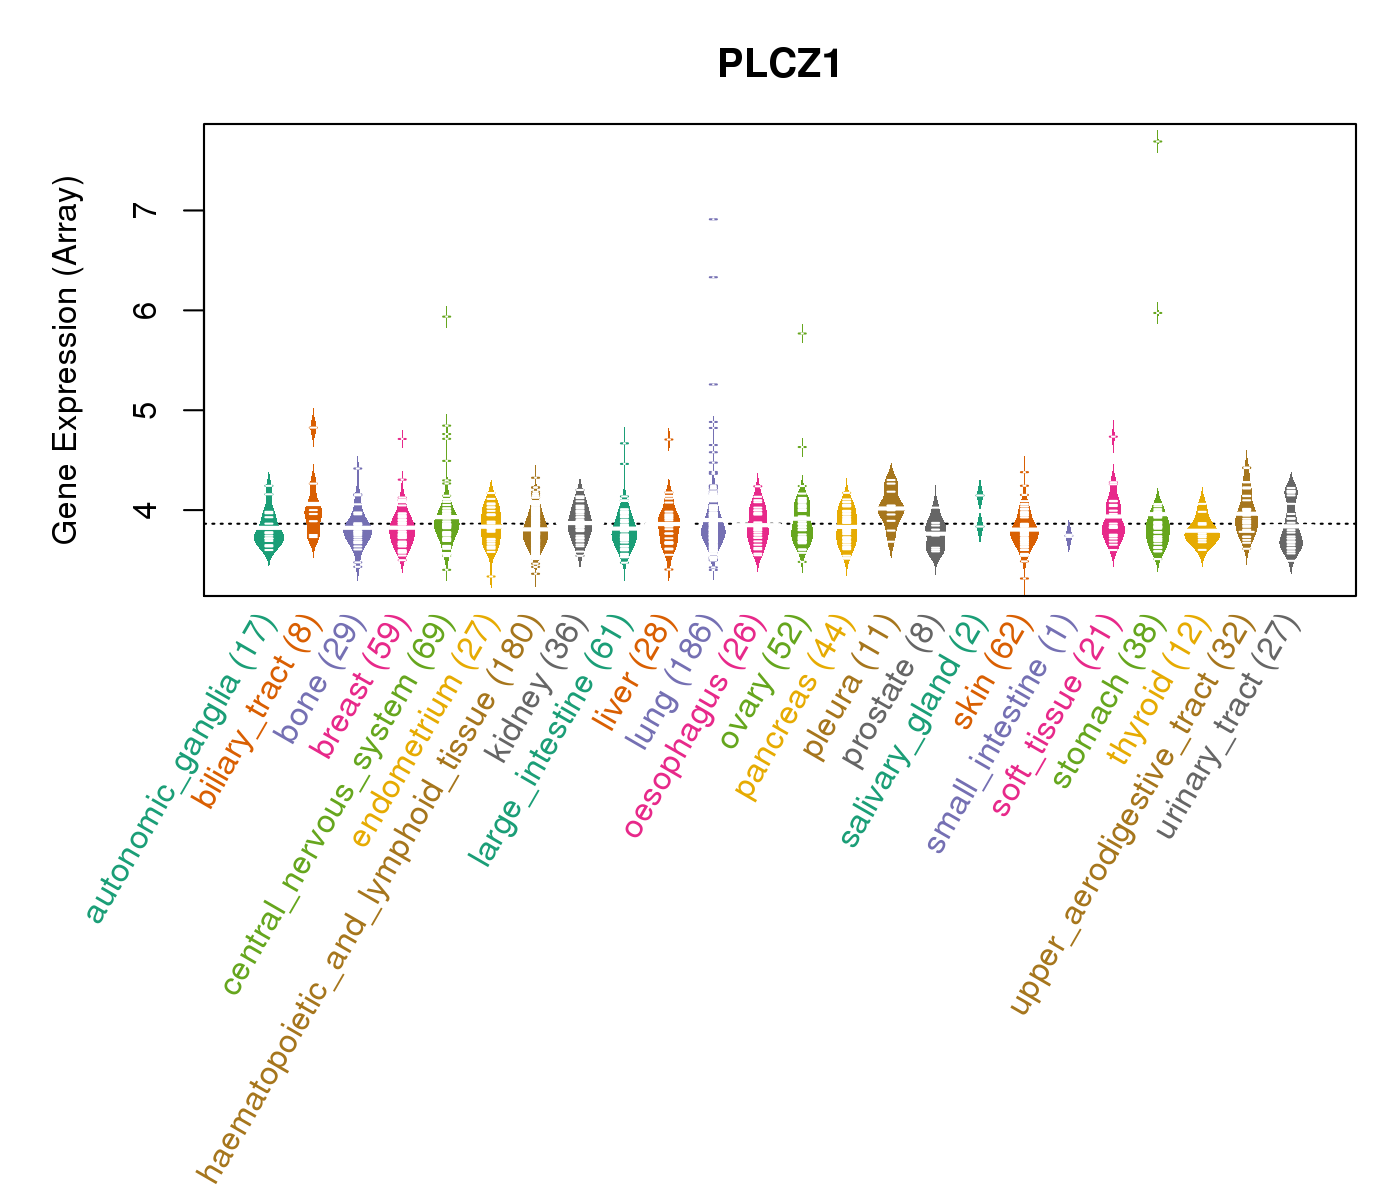
| Gene Expression for PLCZ1 |
| * CCLE gene expression data were extracted from CCLE_Expression_Entrez_2012-10-18.res: Gene-centric RMA-normalized mRNA expression data. |
 |
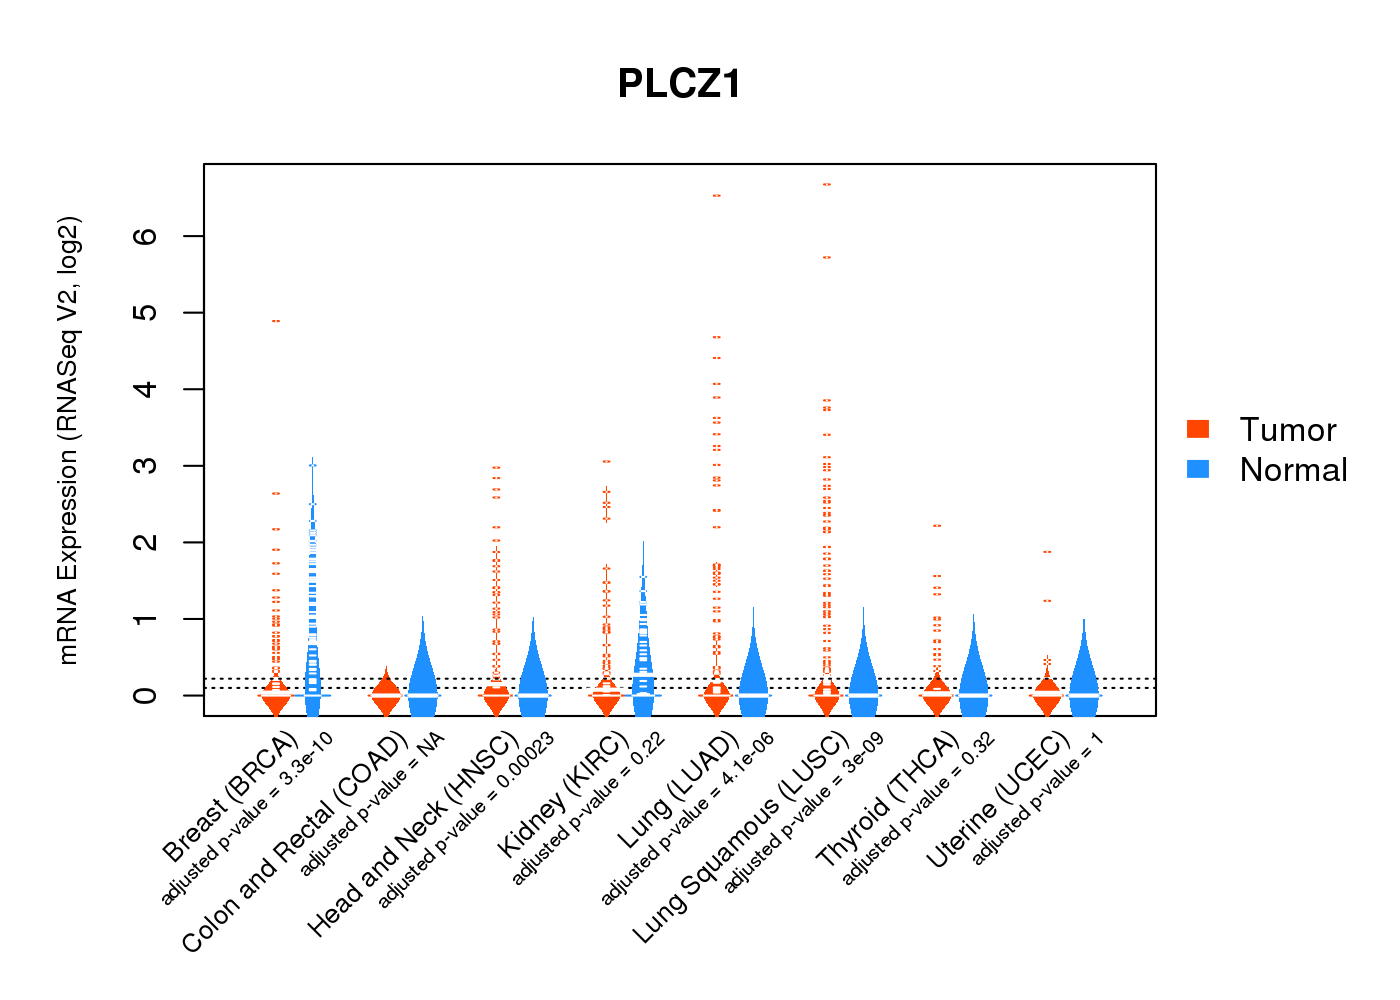
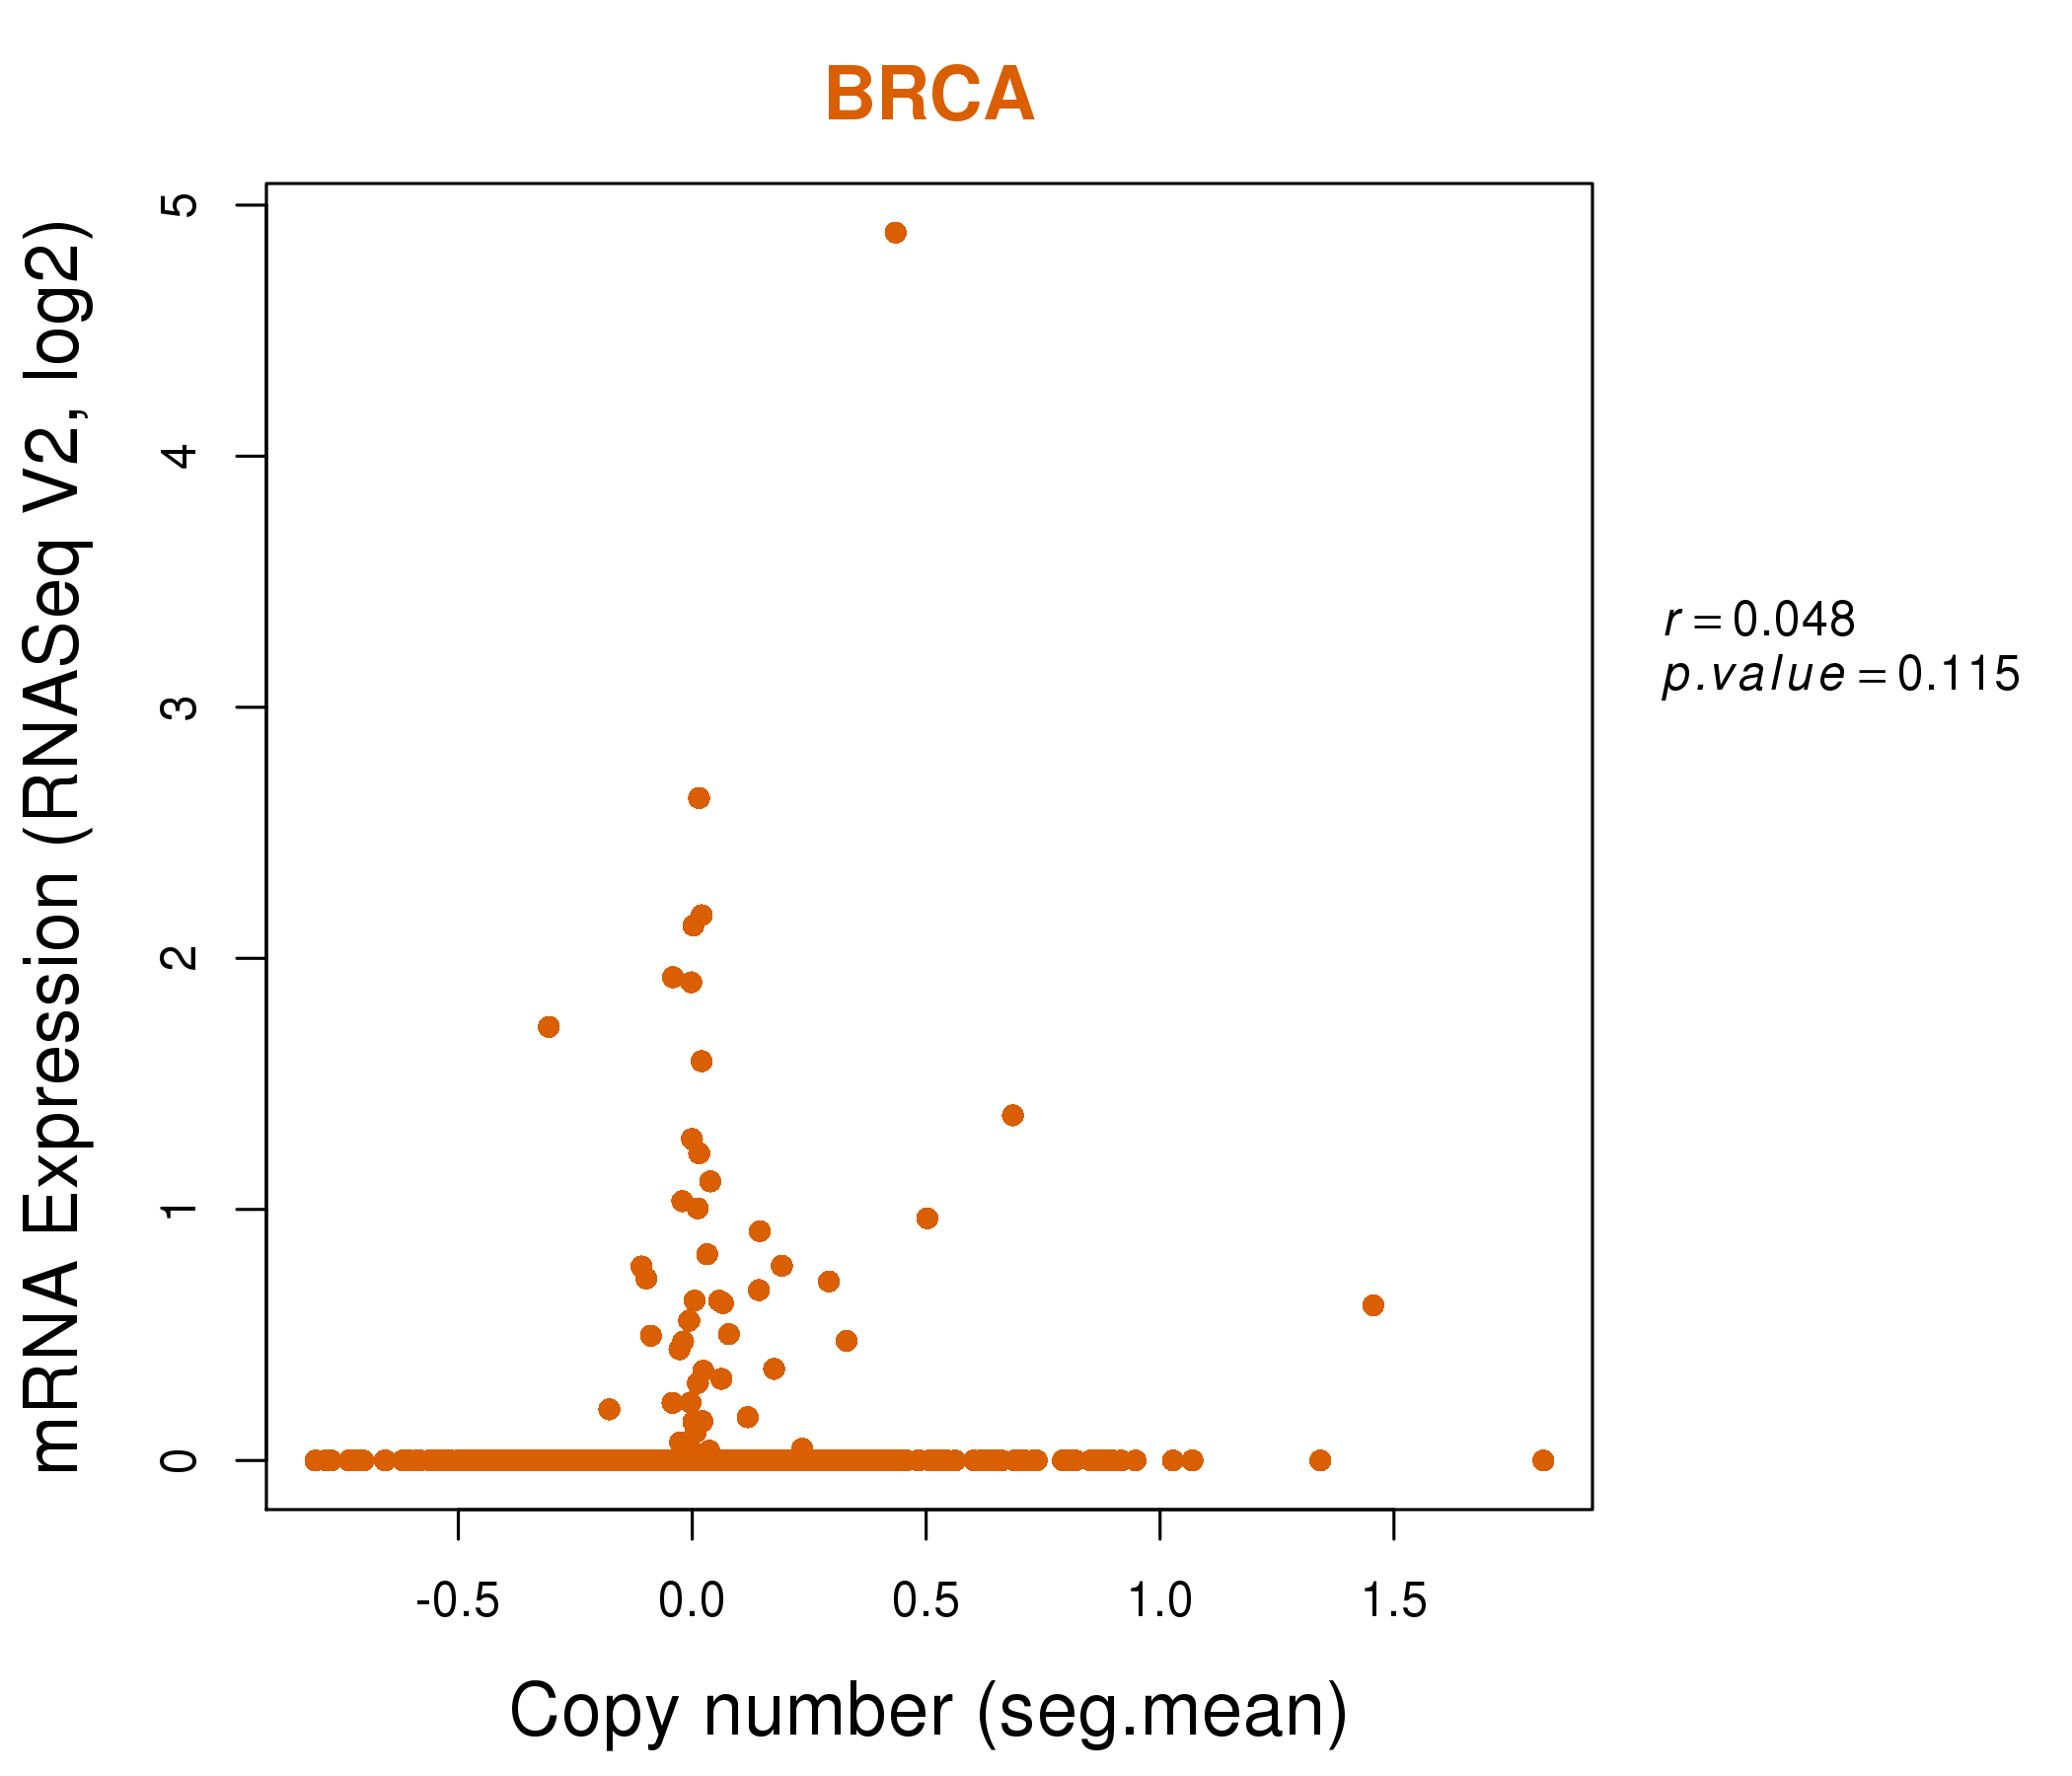
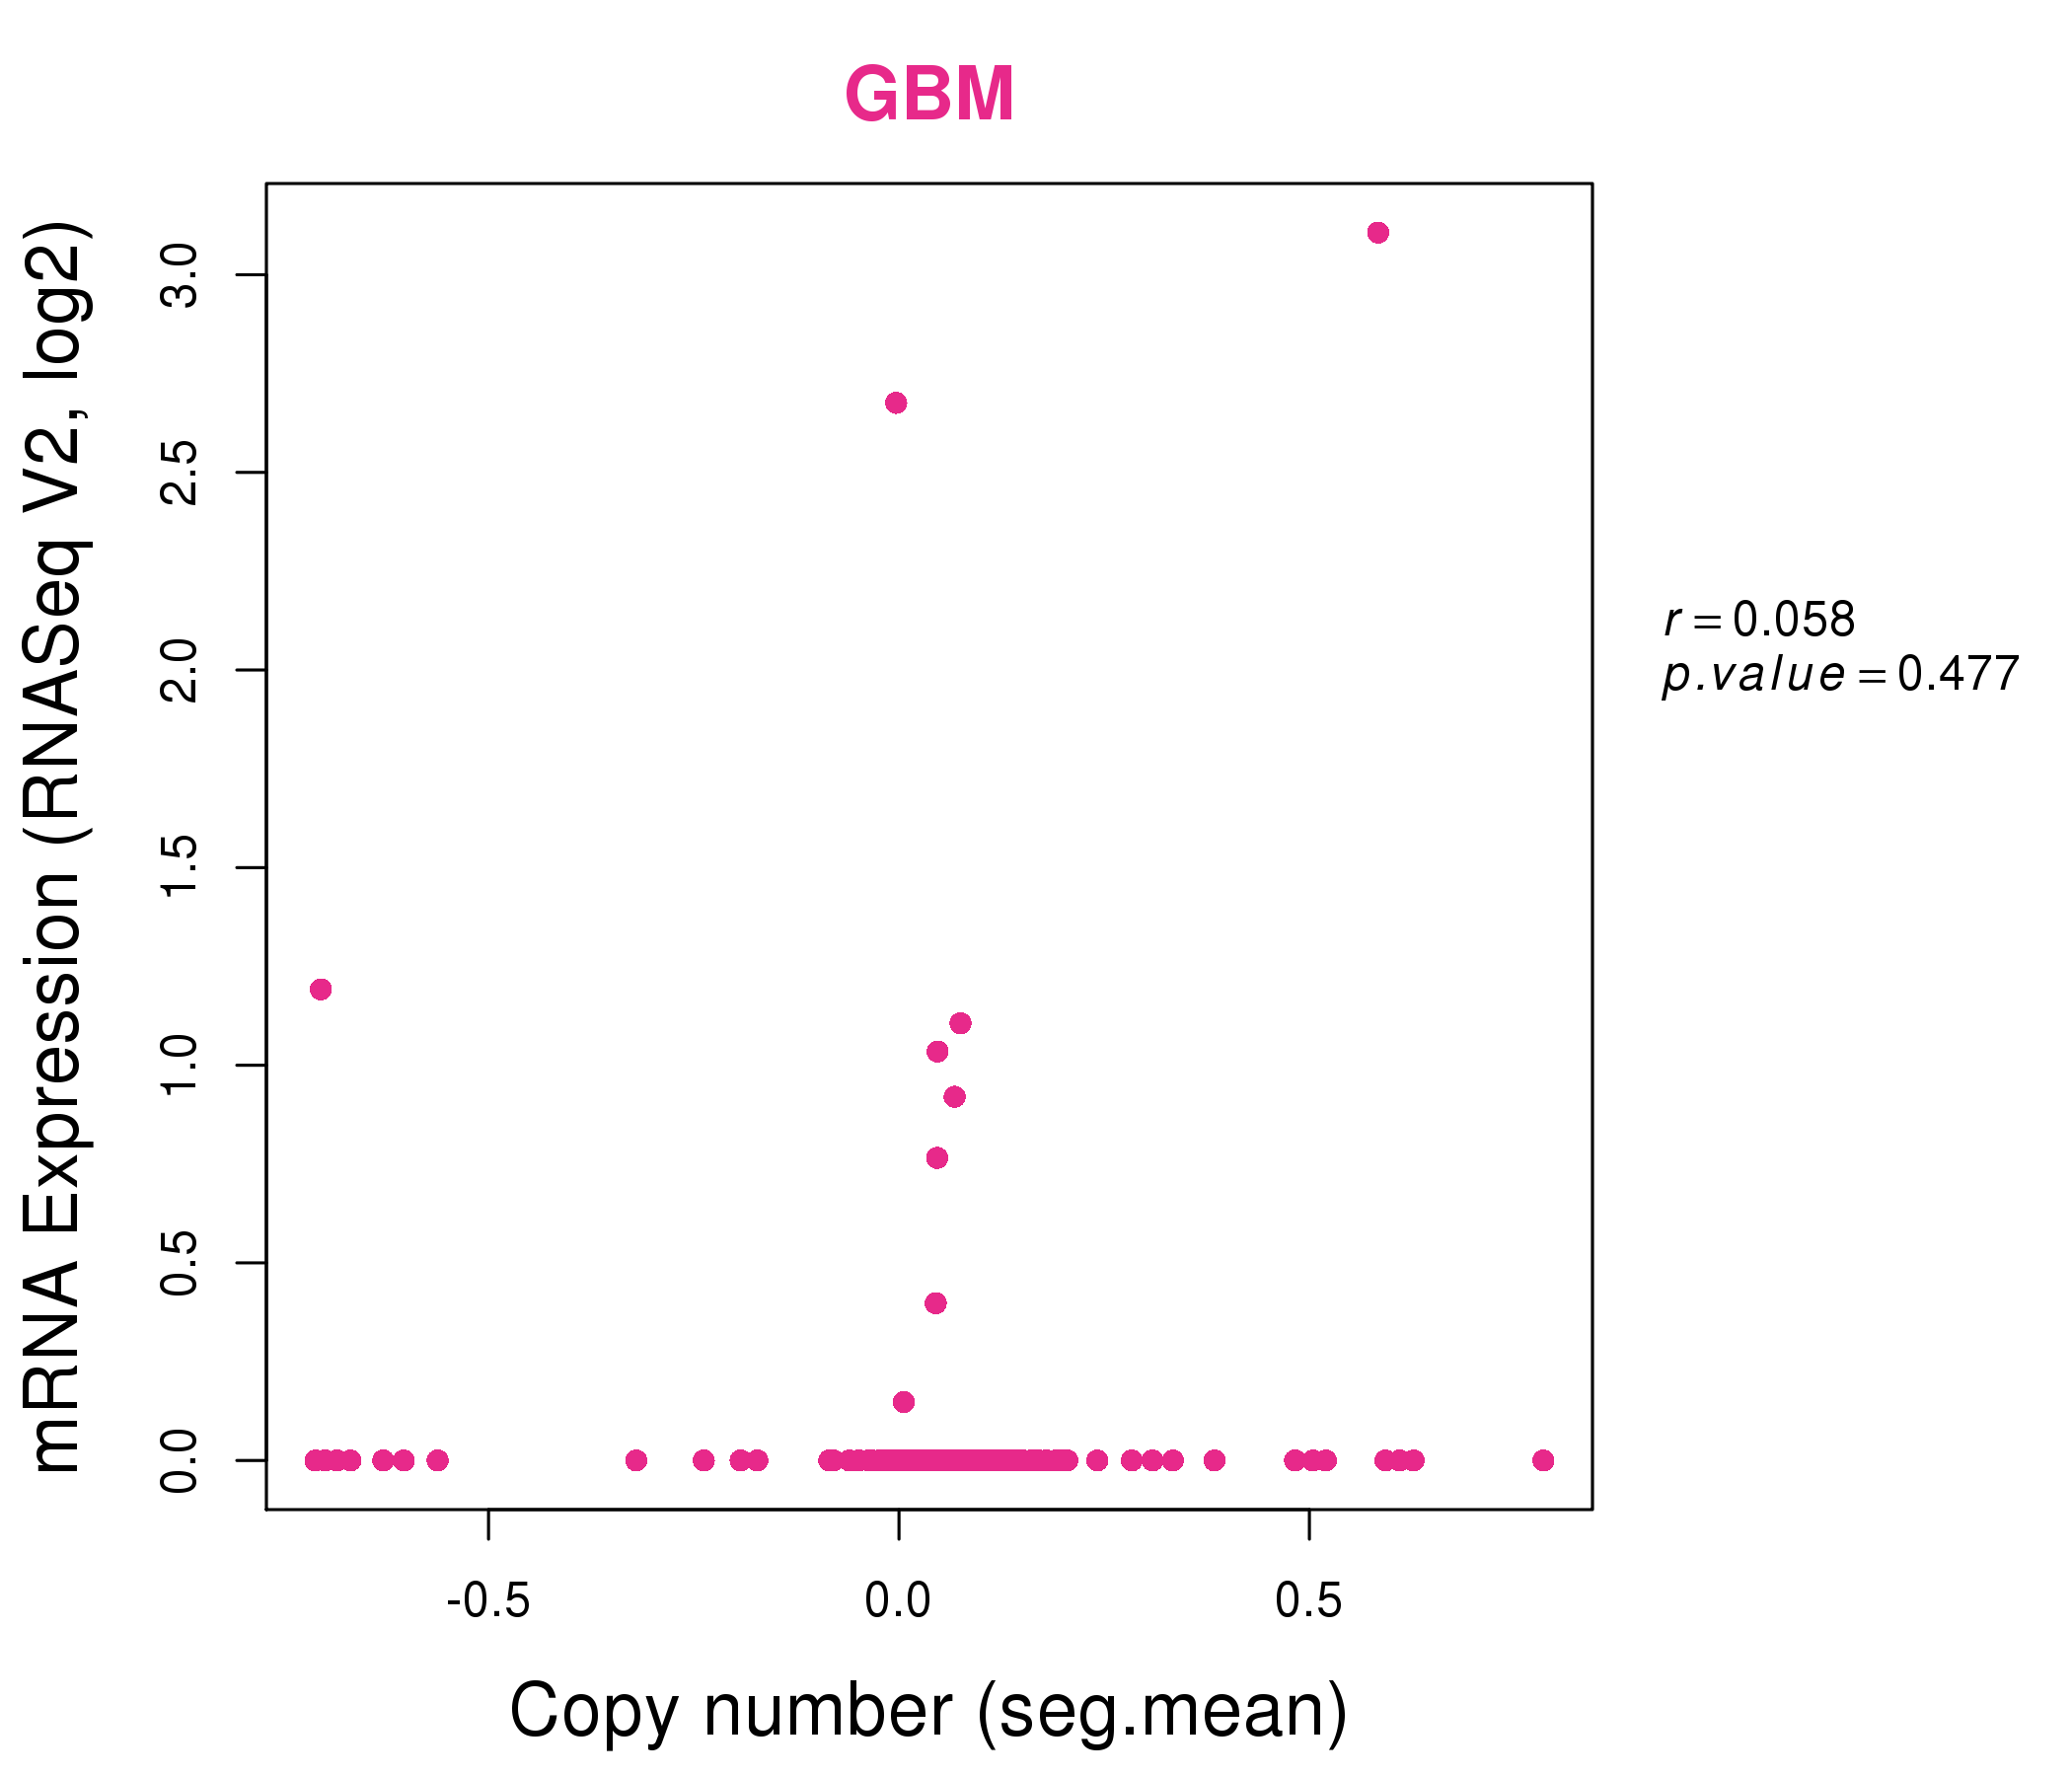
| * Normalized gene expression data of RNASeqV2 was extracted from TCGA using R package TCGA-Assembler. The URLs of all public data files on TCGA DCC data server were gathered at Jan-05-2015. Only eight cancer types have enough normal control samples for differential expression analysis. (t test, adjusted p<0.05 (using Benjamini-Hochberg FDR)) |
 |
| Top |
| * This plots show the correlation between CNV and gene expression. |
: Open all plots for all cancer types
 |
|
 |
|
| Top |
| Gene-Gene Network Information |
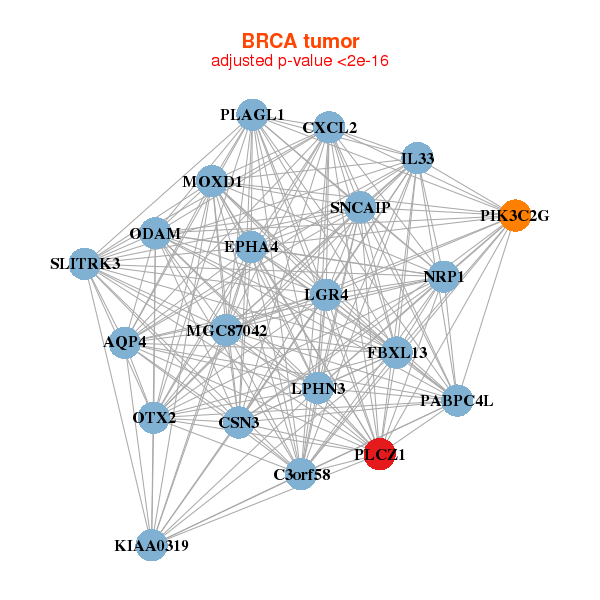
| * Co-Expression network figures were drawn using R package igraph. Only the top 20 genes with the highest correlations were shown. Red circle: input gene, orange circle: cell metabolism gene, sky circle: other gene |
: Open all plots for all cancer types
 |
|
| AQP4,C3orf58,CSN3,CXCL2,EPHA4,FBXL13,IL33, KIAA0319,LGR4,LPHN3,MGC87042,MOXD1,NRP1,ODAM, OTX2,PABPC4L,PIK3C2G,PLAGL1,PLCZ1,SLITRK3,SNCAIP | CAPZA3,EDN3,ETV1,ETV5,IL17RD,IL1RL2,KANSL1, KIAA1671,MCM3AP-AS1,OFD1,OGFRL1,PIK3C2G,PLCZ1,PTPRZ1, SAMD5,SFRP1,TRIM9,ZNF33B,ZNF662,ZNF667,ZNF711 |
 |
|
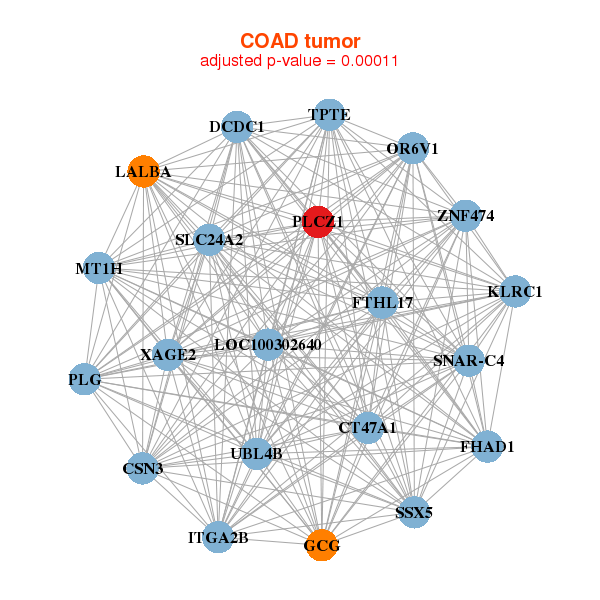
| CSN3,CT47A1,DCDC1,FHAD1,FTHL17,GCG,ITGA2B, KLRC1,LALBA,LOC100302640,MT1H,OR6V1,PLCZ1,PLG, SLC24A2,SNAR-C4,SSX5,TPTE,UBL4B,XAGE2,ZNF474 | SLC35G3,BEND2,LINC00305,CD300LD,CTAG2,CXCR2,FAM74A4, GAGE10,KRT72,LRIT1,NXF4,OR52E6,PADI4,PLCZ1, SELE,SLC22A24,SPRR2G,SSX5,STRA8,TREML4,ZNF735 |

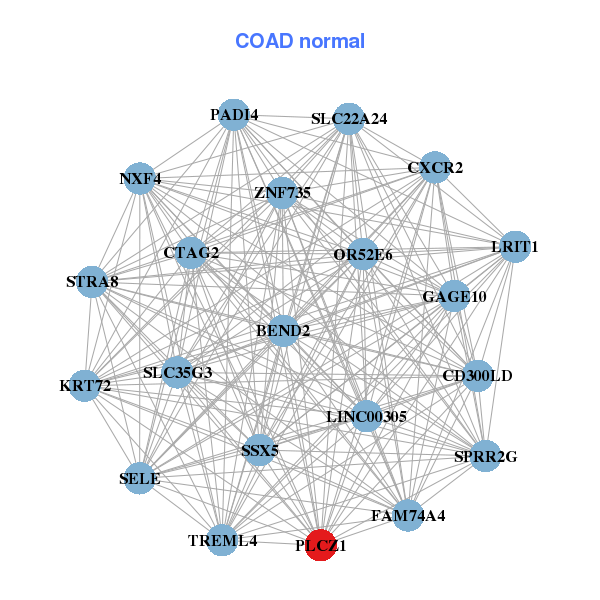
| * Co-Expression network figures were drawn using R package igraph. Only the top 20 genes with the highest correlations were shown. Red circle: input gene, orange circle: cell metabolism gene, sky circle: other gene |
: Open all plots for all cancer types
| Top |
: Open all interacting genes' information including KEGG pathway for all interacting genes from DAVID
| Top |
| Pharmacological Information for PLCZ1 |
| There's no related Drug. |
| Top |
| Cross referenced IDs for PLCZ1 |
| * We obtained these cross-references from Uniprot database. It covers 150 different DBs, 18 categories. http://www.uniprot.org/help/cross_references_section |
: Open all cross reference information
|
Copyright © 2016-Present - The Univsersity of Texas Health Science Center at Houston @ |