|
||||||||||||||||||||
| |
| Phenotypic Information (metabolism pathway, cancer, disease, phenome) |
| |
| |
| Gene-Gene Network Information: Co-Expression Network, Interacting Genes & KEGG |
| |
|


| Gene Summary for CH25H |
| Basic gene info. | Gene symbol | CH25H |
| Gene name | cholesterol 25-hydroxylase | |
| Synonyms | C25H | |
| Cytomap | UCSC genome browser: 10q23 | |
| Genomic location | chr10 :90965693-90967071 | |
| Type of gene | protein-coding | |
| RefGenes | NM_003956.3, | |
| Ensembl id | ENSG00000138135 | |
| Description | cholesterol 25-monooxygenaseh25OH | |
| Modification date | 20141207 | |
| dbXrefs | MIM : 604551 | |
| HGNC : HGNC | ||
| Ensembl : ENSG00000138135 | ||
| HPRD : 05183 | ||
| Vega : OTTHUMG00000018705 | ||
| Protein | UniProt: go to UniProt's Cross Reference DB Table | |
| Expression | CleanEX: HS_CH25H | |
| BioGPS: 9023 | ||
| Gene Expression Atlas: ENSG00000138135 | ||
| The Human Protein Atlas: ENSG00000138135 | ||
| Pathway | NCI Pathway Interaction Database: CH25H | |
| KEGG: CH25H | ||
| REACTOME: CH25H | ||
| ConsensusPathDB | ||
| Pathway Commons: CH25H | ||
| Metabolism | MetaCyc: CH25H | |
| HUMANCyc: CH25H | ||
| Regulation | Ensembl's Regulation: ENSG00000138135 | |
| miRBase: chr10 :90,965,693-90,967,071 | ||
| TargetScan: NM_003956 | ||
| cisRED: ENSG00000138135 | ||
| Context | iHOP: CH25H | |
| cancer metabolism search in PubMed: CH25H | ||
| UCL Cancer Institute: CH25H | ||
| Assigned class in ccmGDB | C | |
| Top |
| Phenotypic Information for CH25H(metabolism pathway, cancer, disease, phenome) |
| Cancer | CGAP: CH25H |
| Familial Cancer Database: CH25H | |
| * This gene is included in those cancer gene databases. |
|
|
|
|
|
| . | ||||||||||||||
Oncogene 1 | Significant driver gene in | |||||||||||||||||||
| cf) number; DB name 1 Oncogene; http://nar.oxfordjournals.org/content/35/suppl_1/D721.long, 2 Tumor Suppressor gene; https://bioinfo.uth.edu/TSGene/, 3 Cancer Gene Census; http://www.nature.com/nrc/journal/v4/n3/abs/nrc1299.html, 4 CancerGenes; http://nar.oxfordjournals.org/content/35/suppl_1/D721.long, 5 Network of Cancer Gene; http://ncg.kcl.ac.uk/index.php, 1Therapeutic Vulnerabilities in Cancer; http://cbio.mskcc.org/cancergenomics/statius/ |
| REACTOME_METABOLISM_OF_LIPIDS_AND_LIPOPROTEINS | |
| OMIM | |
| Orphanet | |
| Disease | KEGG Disease: CH25H |
| MedGen: CH25H (Human Medical Genetics with Condition) | |
| ClinVar: CH25H | |
| Phenotype | MGI: CH25H (International Mouse Phenotyping Consortium) |
| PhenomicDB: CH25H | |
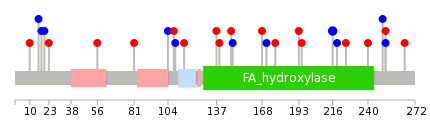
| Mutations for CH25H |
| * Under tables are showing count per each tissue to give us broad intuition about tissue specific mutation patterns.You can go to the detailed page for each mutation database's web site. |
| There's no structural variation information in COSMIC data for this gene. |
| * From mRNA Sanger sequences, Chitars2.0 arranged chimeric transcripts. This table shows CH25H related fusion information. |
| ID | Head Gene | Tail Gene | Accession | Gene_a | qStart_a | qEnd_a | Chromosome_a | tStart_a | tEnd_a | Gene_a | qStart_a | qEnd_a | Chromosome_a | tStart_a | tEnd_a |
| Top |
| There's no copy number variation information in COSMIC data for this gene. |
| Top |
|
 |
| Top |
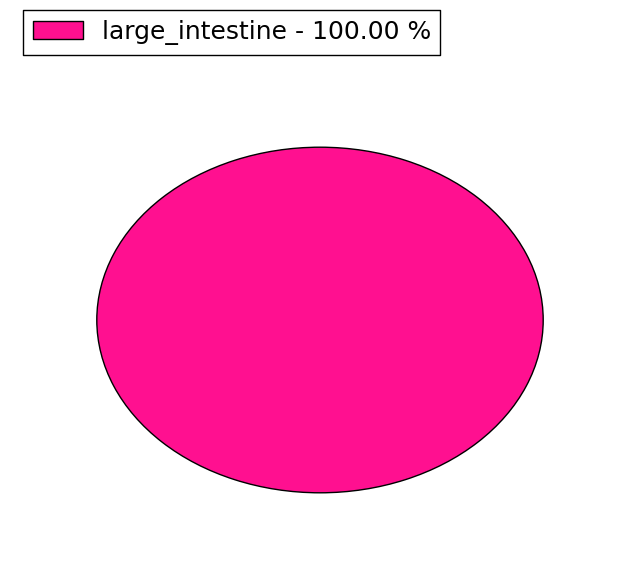
| Stat. for Non-Synonymous SNVs (# total SNVs=12) | (# total SNVs=8) |
 |  |
(# total SNVs=1) | (# total SNVs=0) |
 |
| Top |
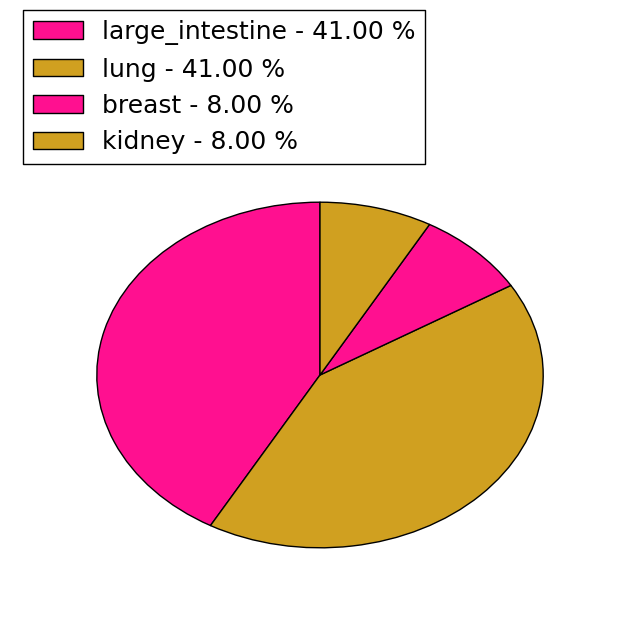
| * When you move the cursor on each content, you can see more deailed mutation information on the Tooltip. Those are primary_site,primary_histology,mutation(aa),pubmedID. |
| GRCh37 position | Mutation(aa) | Unique sampleID count |
| chr10:90966402-90966402 | p.S216S | 2 |
| chr10:90966467-90966467 | p.C195R | 1 |
| chr10:90966727-90966727 | p.A108V | 1 |
| chr10:90966472-90966472 | p.L193H | 1 |
| chr10:90966740-90966740 | p.L104L | 1 |
| chr10:90966519-90966519 | p.W177C | 1 |
| chr10:90966809-90966809 | p.A81T | 1 |
| chr10:90966256-90966256 | p.R265Q | 1 |
| chr10:90966537-90966537 | p.T171T | 1 |
| chr10:90966857-90966857 | p.V65fs*32 | 1 |
| Top |
|
 |
| Point Mutation/ Tissue ID | 1 | 2 | 3 | 4 | 5 | 6 | 7 | 8 | 9 | 10 | 11 | 12 | 13 | 14 | 15 | 16 | 17 | 18 | 19 | 20 |
| # sample | 1 | 1 | 6 | 2 | 5 | 1 | 2 | 3 | 3 | |||||||||||
| # mutation | 1 | 1 | 5 | 2 | 5 | 1 | 3 | 3 | 3 | |||||||||||
| nonsynonymous SNV | 1 | 1 | 4 | 1 | 5 | 1 | 2 | 2 | ||||||||||||
| synonymous SNV | 2 | 1 | 1 | 1 | 3 |
| cf) Tissue ID; Tissue type (1; BLCA[Bladder Urothelial Carcinoma], 2; BRCA[Breast invasive carcinoma], 3; CESC[Cervical squamous cell carcinoma and endocervical adenocarcinoma], 4; COAD[Colon adenocarcinoma], 5; GBM[Glioblastoma multiforme], 6; Glioma Low Grade, 7; HNSC[Head and Neck squamous cell carcinoma], 8; KICH[Kidney Chromophobe], 9; KIRC[Kidney renal clear cell carcinoma], 10; KIRP[Kidney renal papillary cell carcinoma], 11; LAML[Acute Myeloid Leukemia], 12; LUAD[Lung adenocarcinoma], 13; LUSC[Lung squamous cell carcinoma], 14; OV[Ovarian serous cystadenocarcinoma ], 15; PAAD[Pancreatic adenocarcinoma], 16; PRAD[Prostate adenocarcinoma], 17; SKCM[Skin Cutaneous Melanoma], 18:STAD[Stomach adenocarcinoma], 19:THCA[Thyroid carcinoma], 20:UCEC[Uterine Corpus Endometrial Carcinoma]) |
| Top |
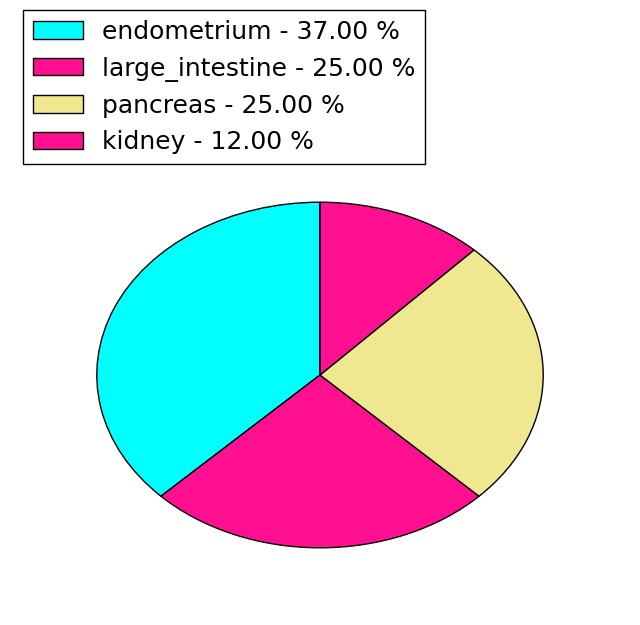
| * We represented just top 10 SNVs. When you move the cursor on each content, you can see more deailed mutation information on the Tooltip. Those are primary_site, primary_histology, mutation(aa), pubmedID. |
| Genomic Position | Mutation(aa) | Unique sampleID count |
| chr10:90966295 | p.P252L | 2 |
| chr10:90966547 | p.F139F | 1 |
| chr10:90966884 | p.M137I | 1 |
| chr10:90966606 | p.P115H | 1 |
| chr10:90966906 | p.R109R | 1 |
| chr10:90966611 | p.A108V | 1 |
| chr10:90966941 | p.R265Q | 1 |
| chr10:90966256 | p.L104L | 1 |
| chr10:90966633 | p.P252P | 1 |
| chr10:90966983 | p.H95Q | 1 |
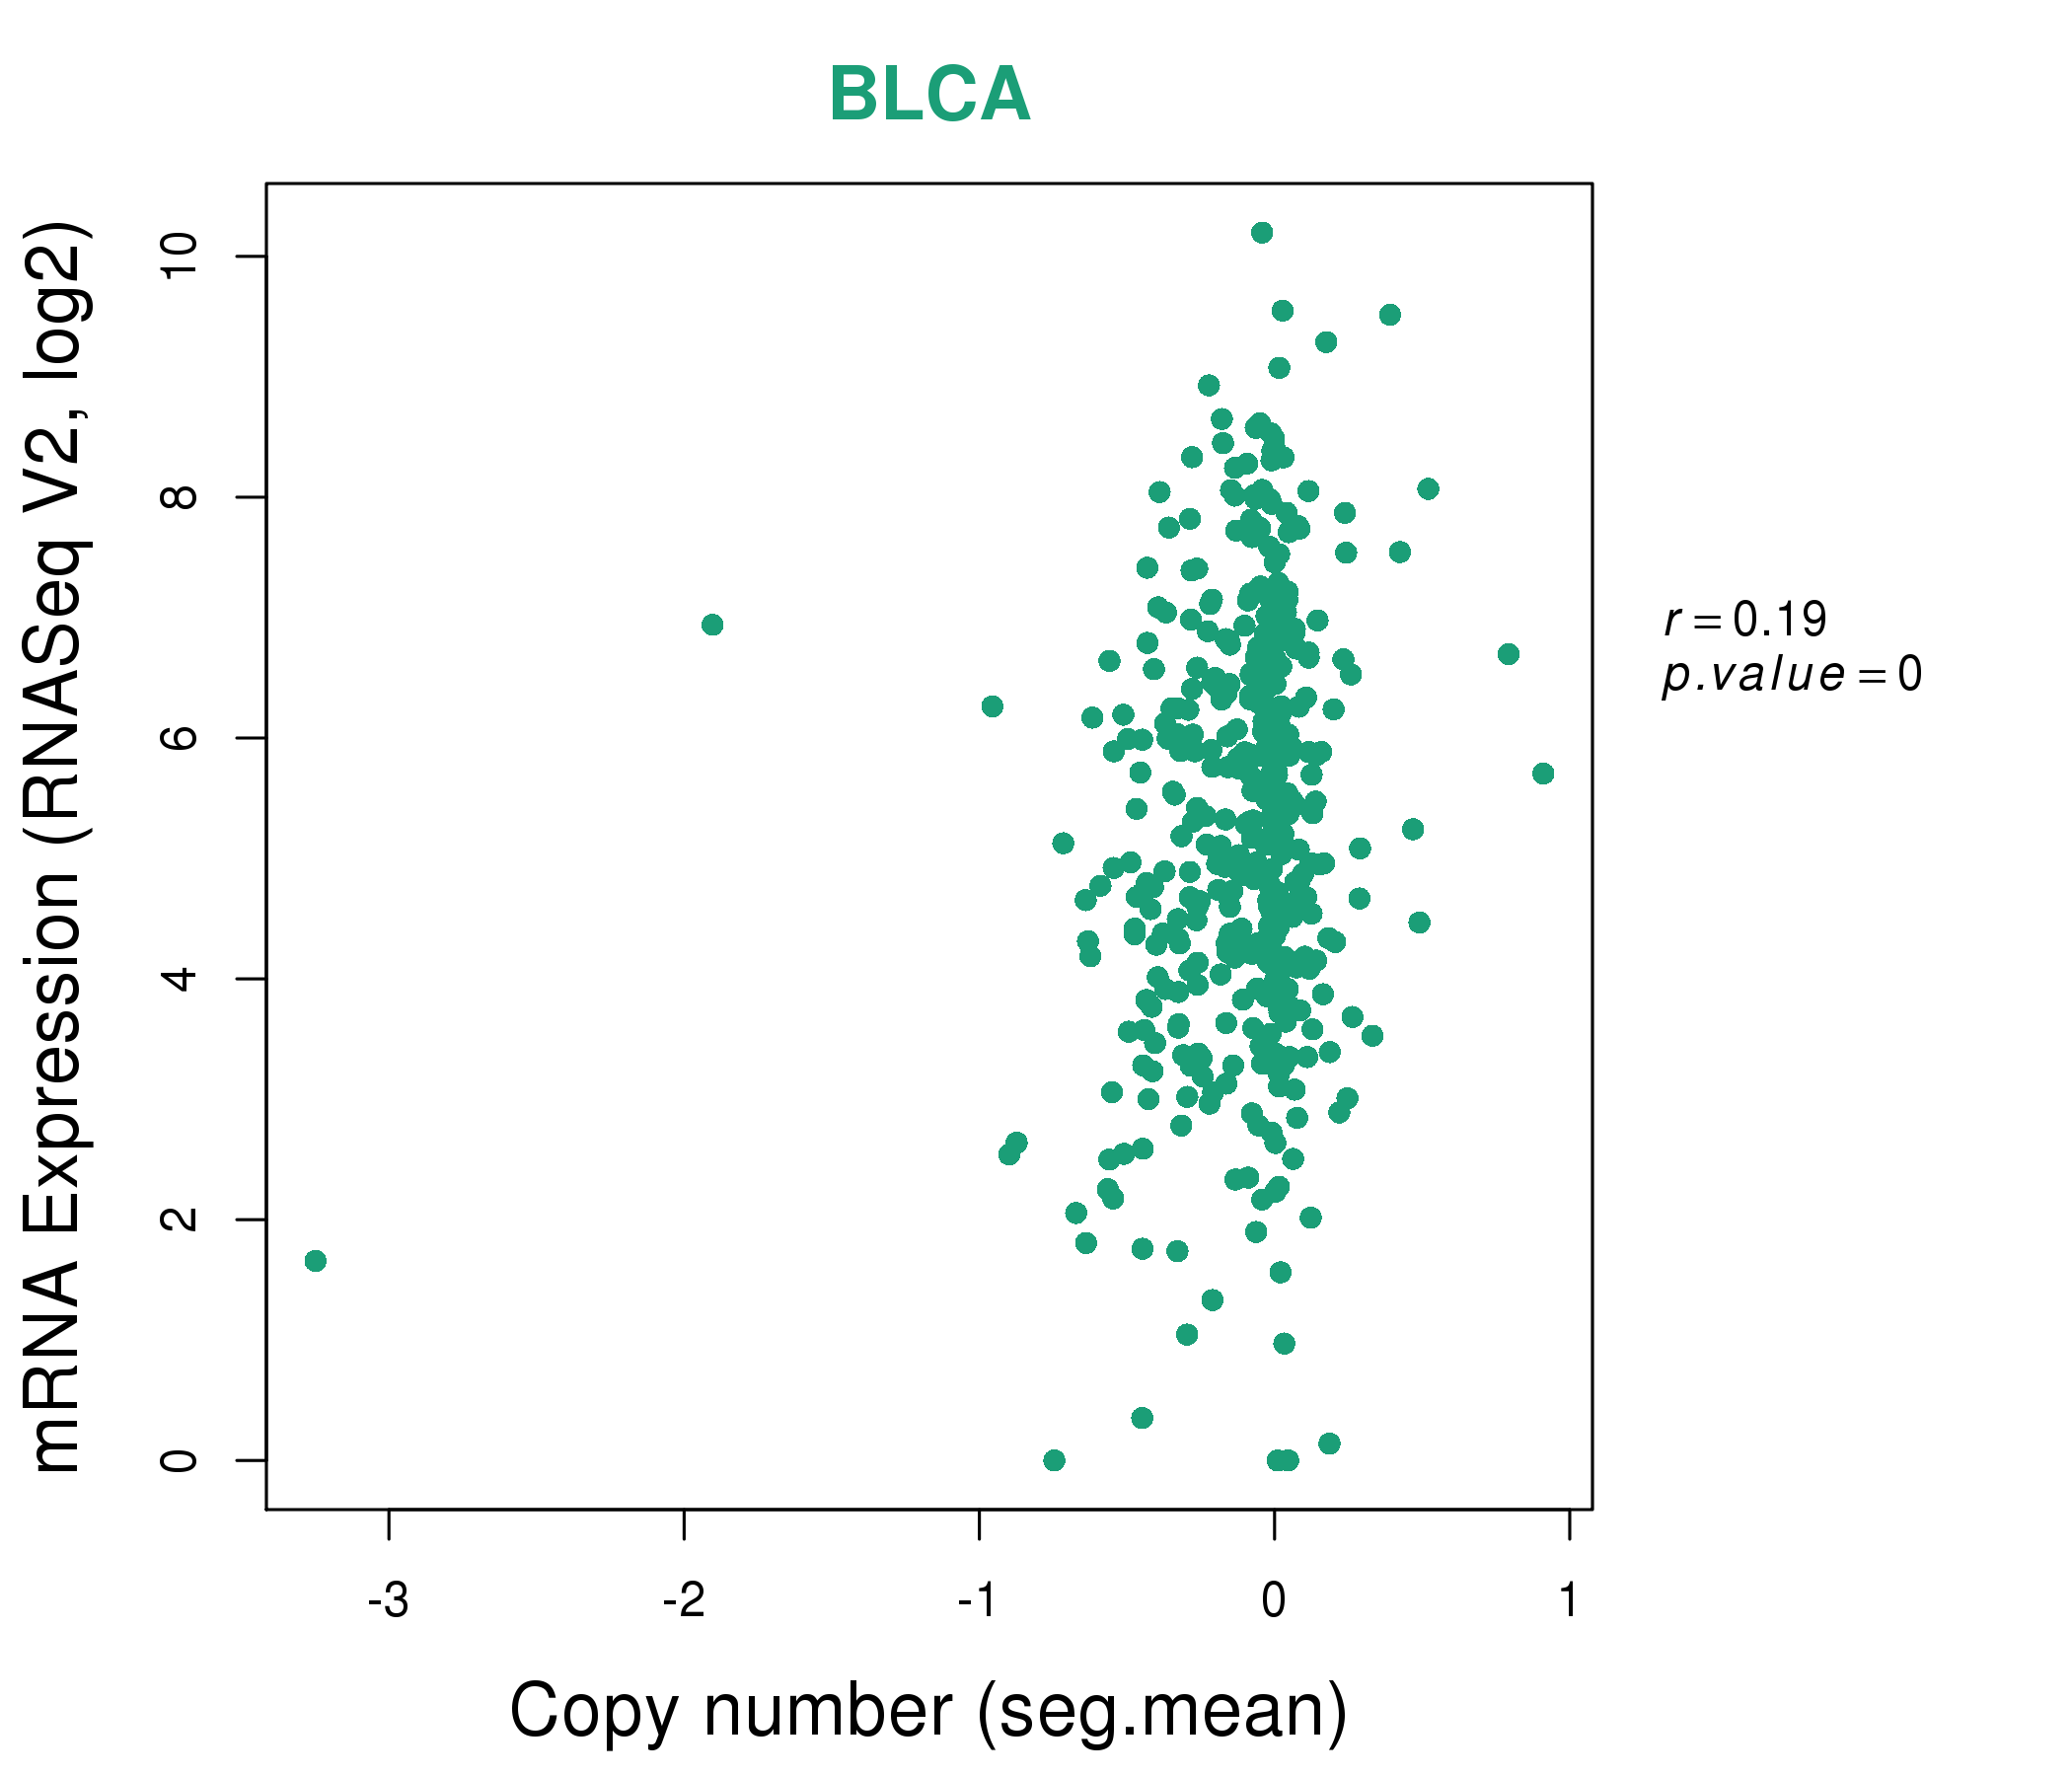
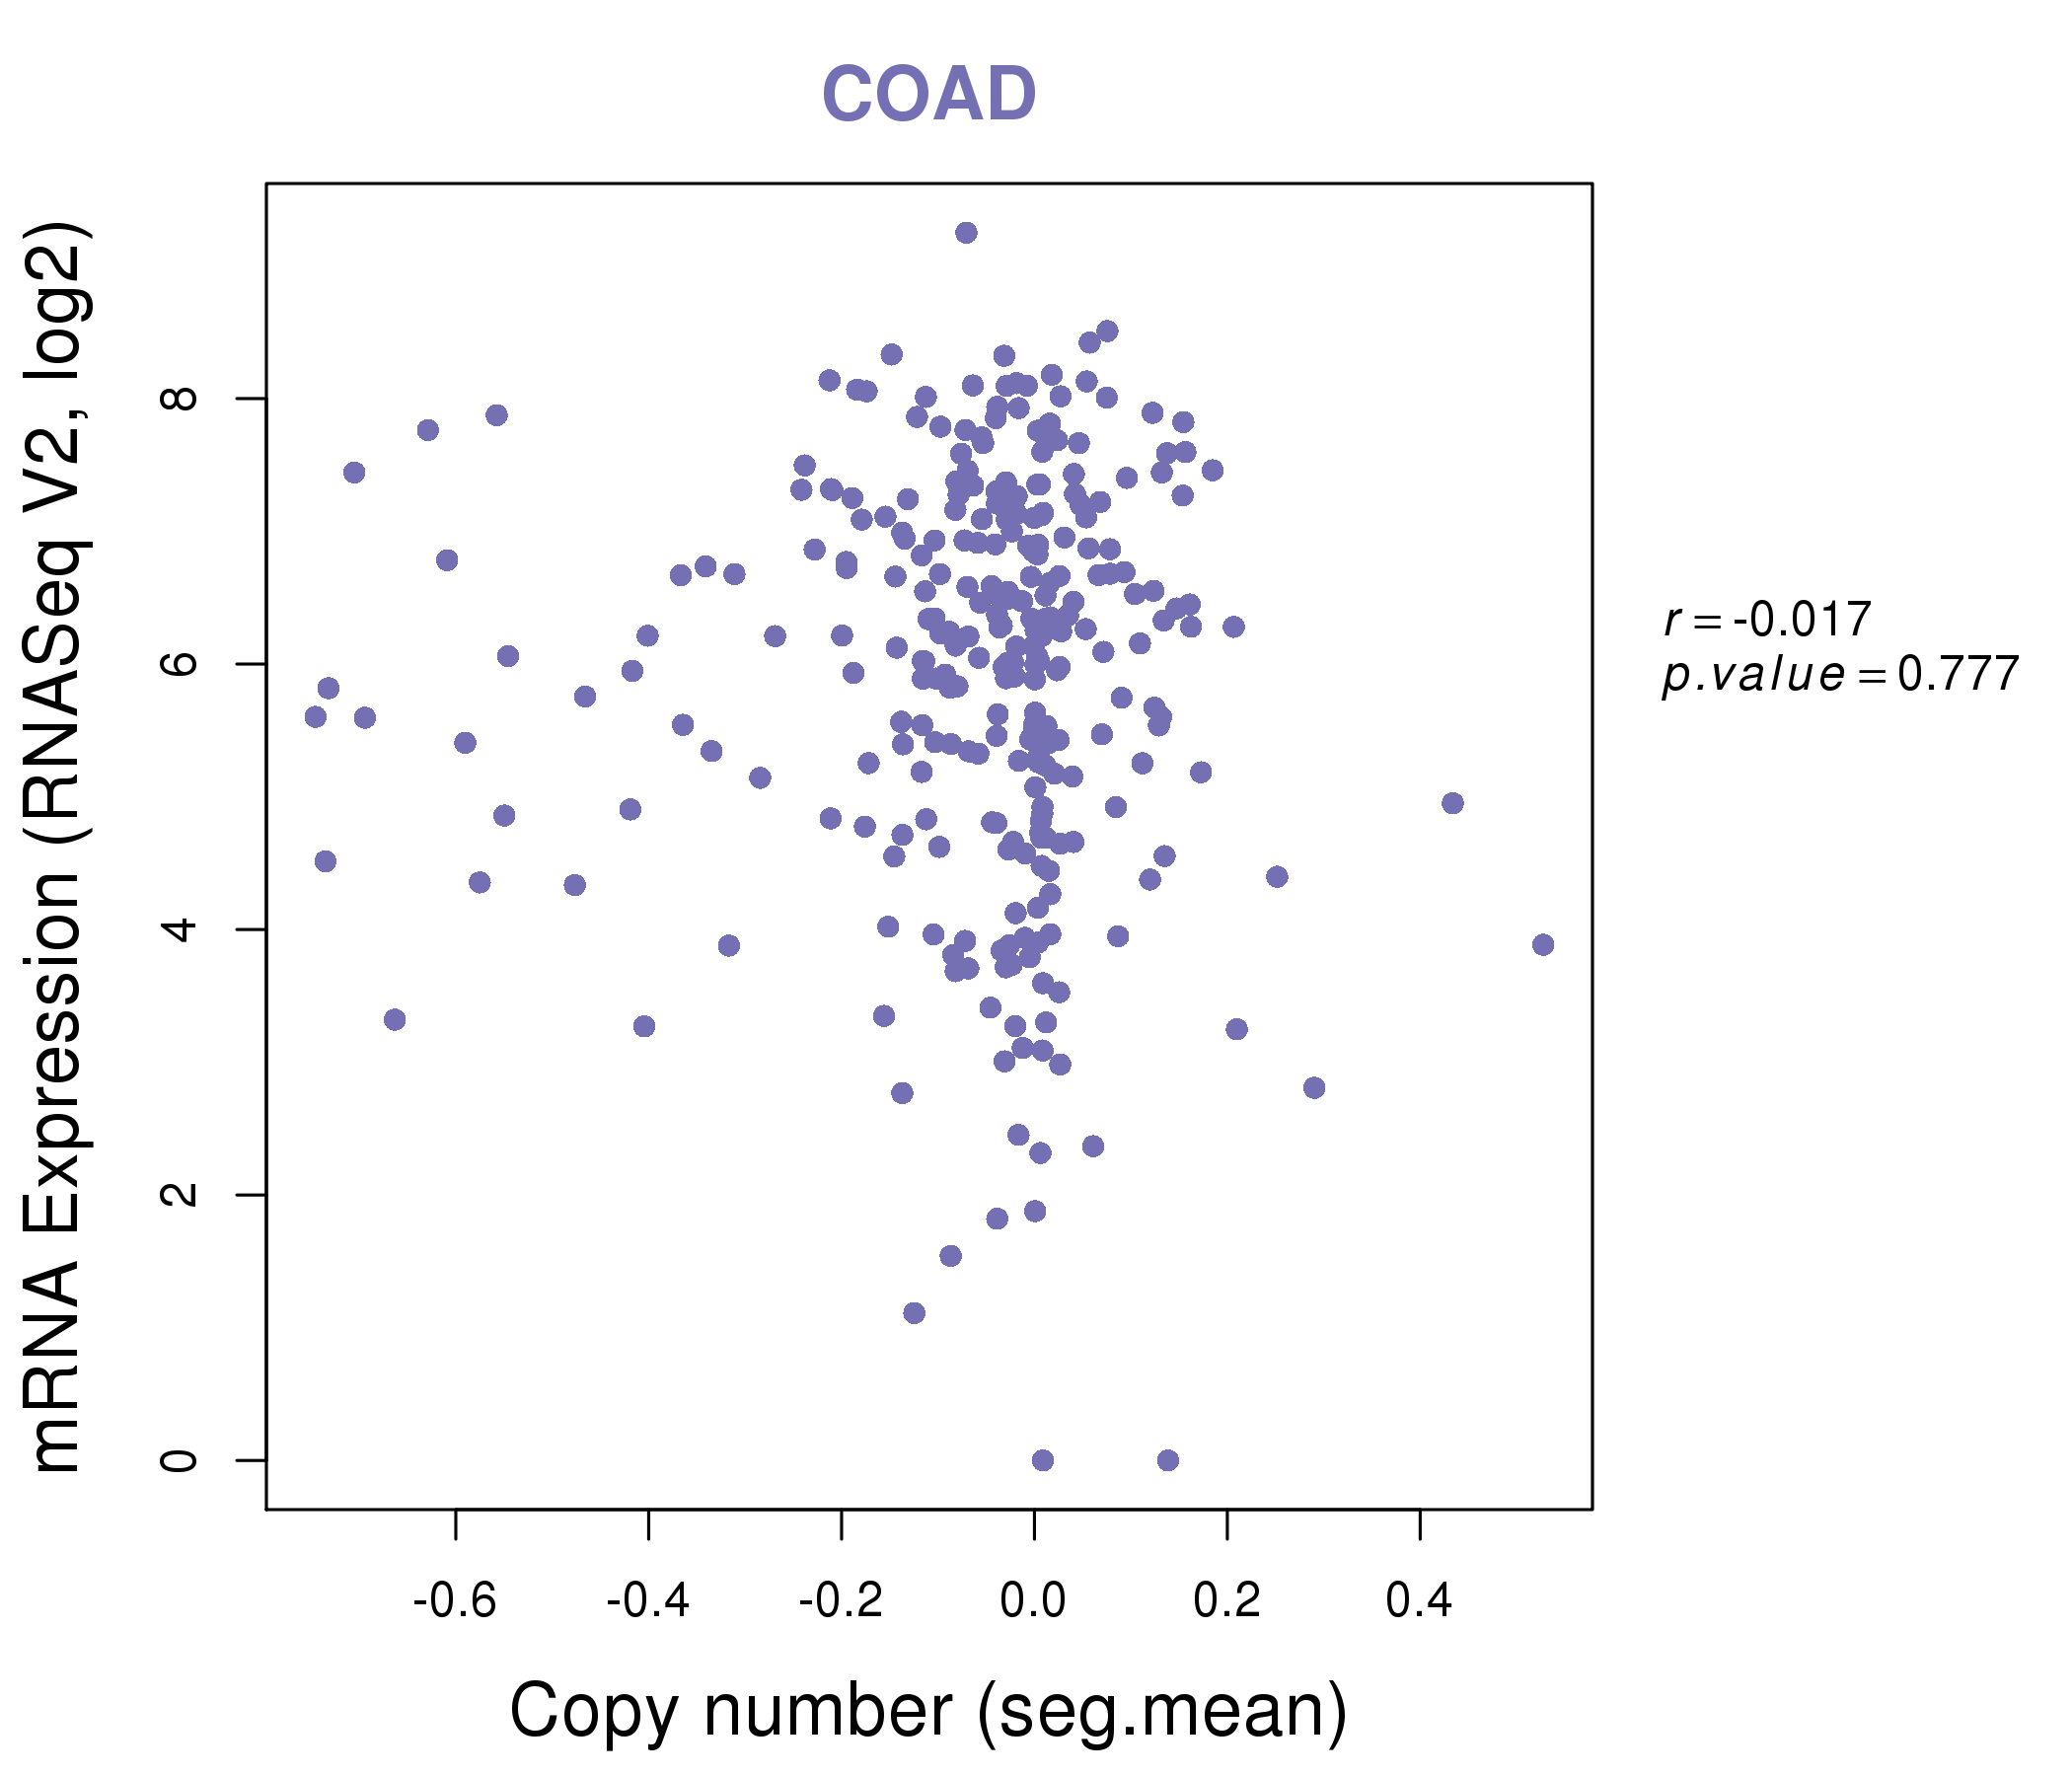
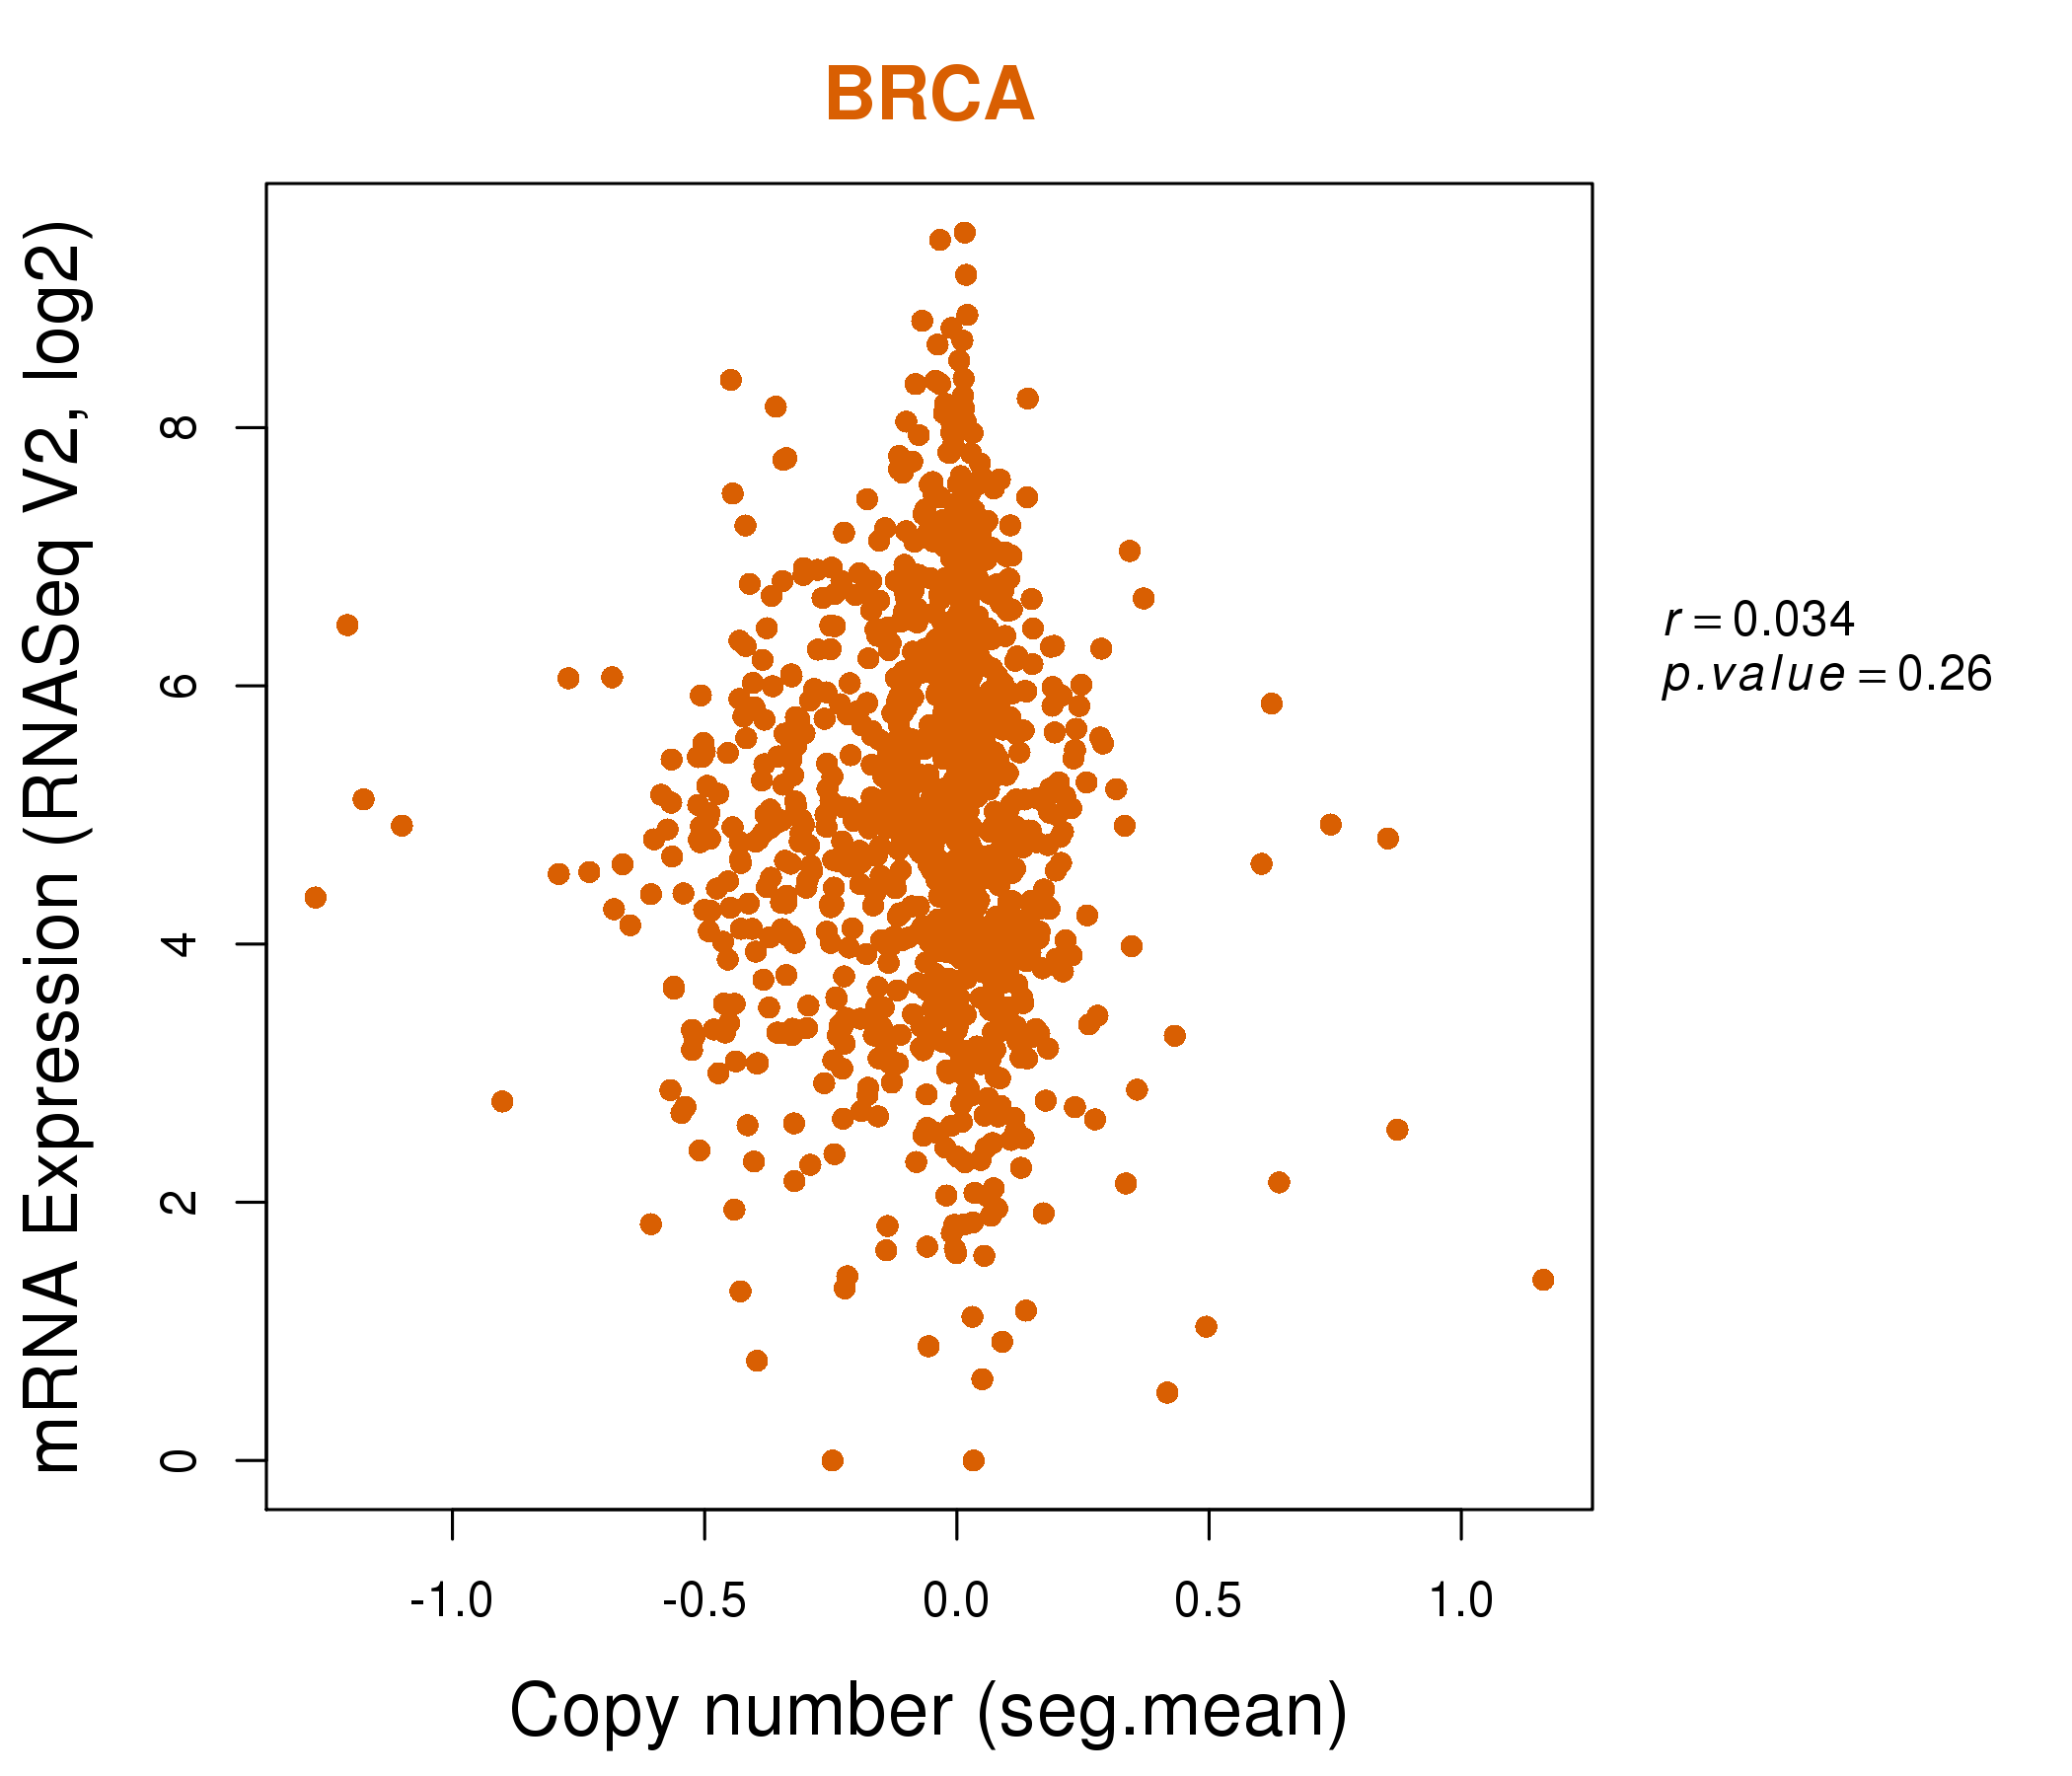
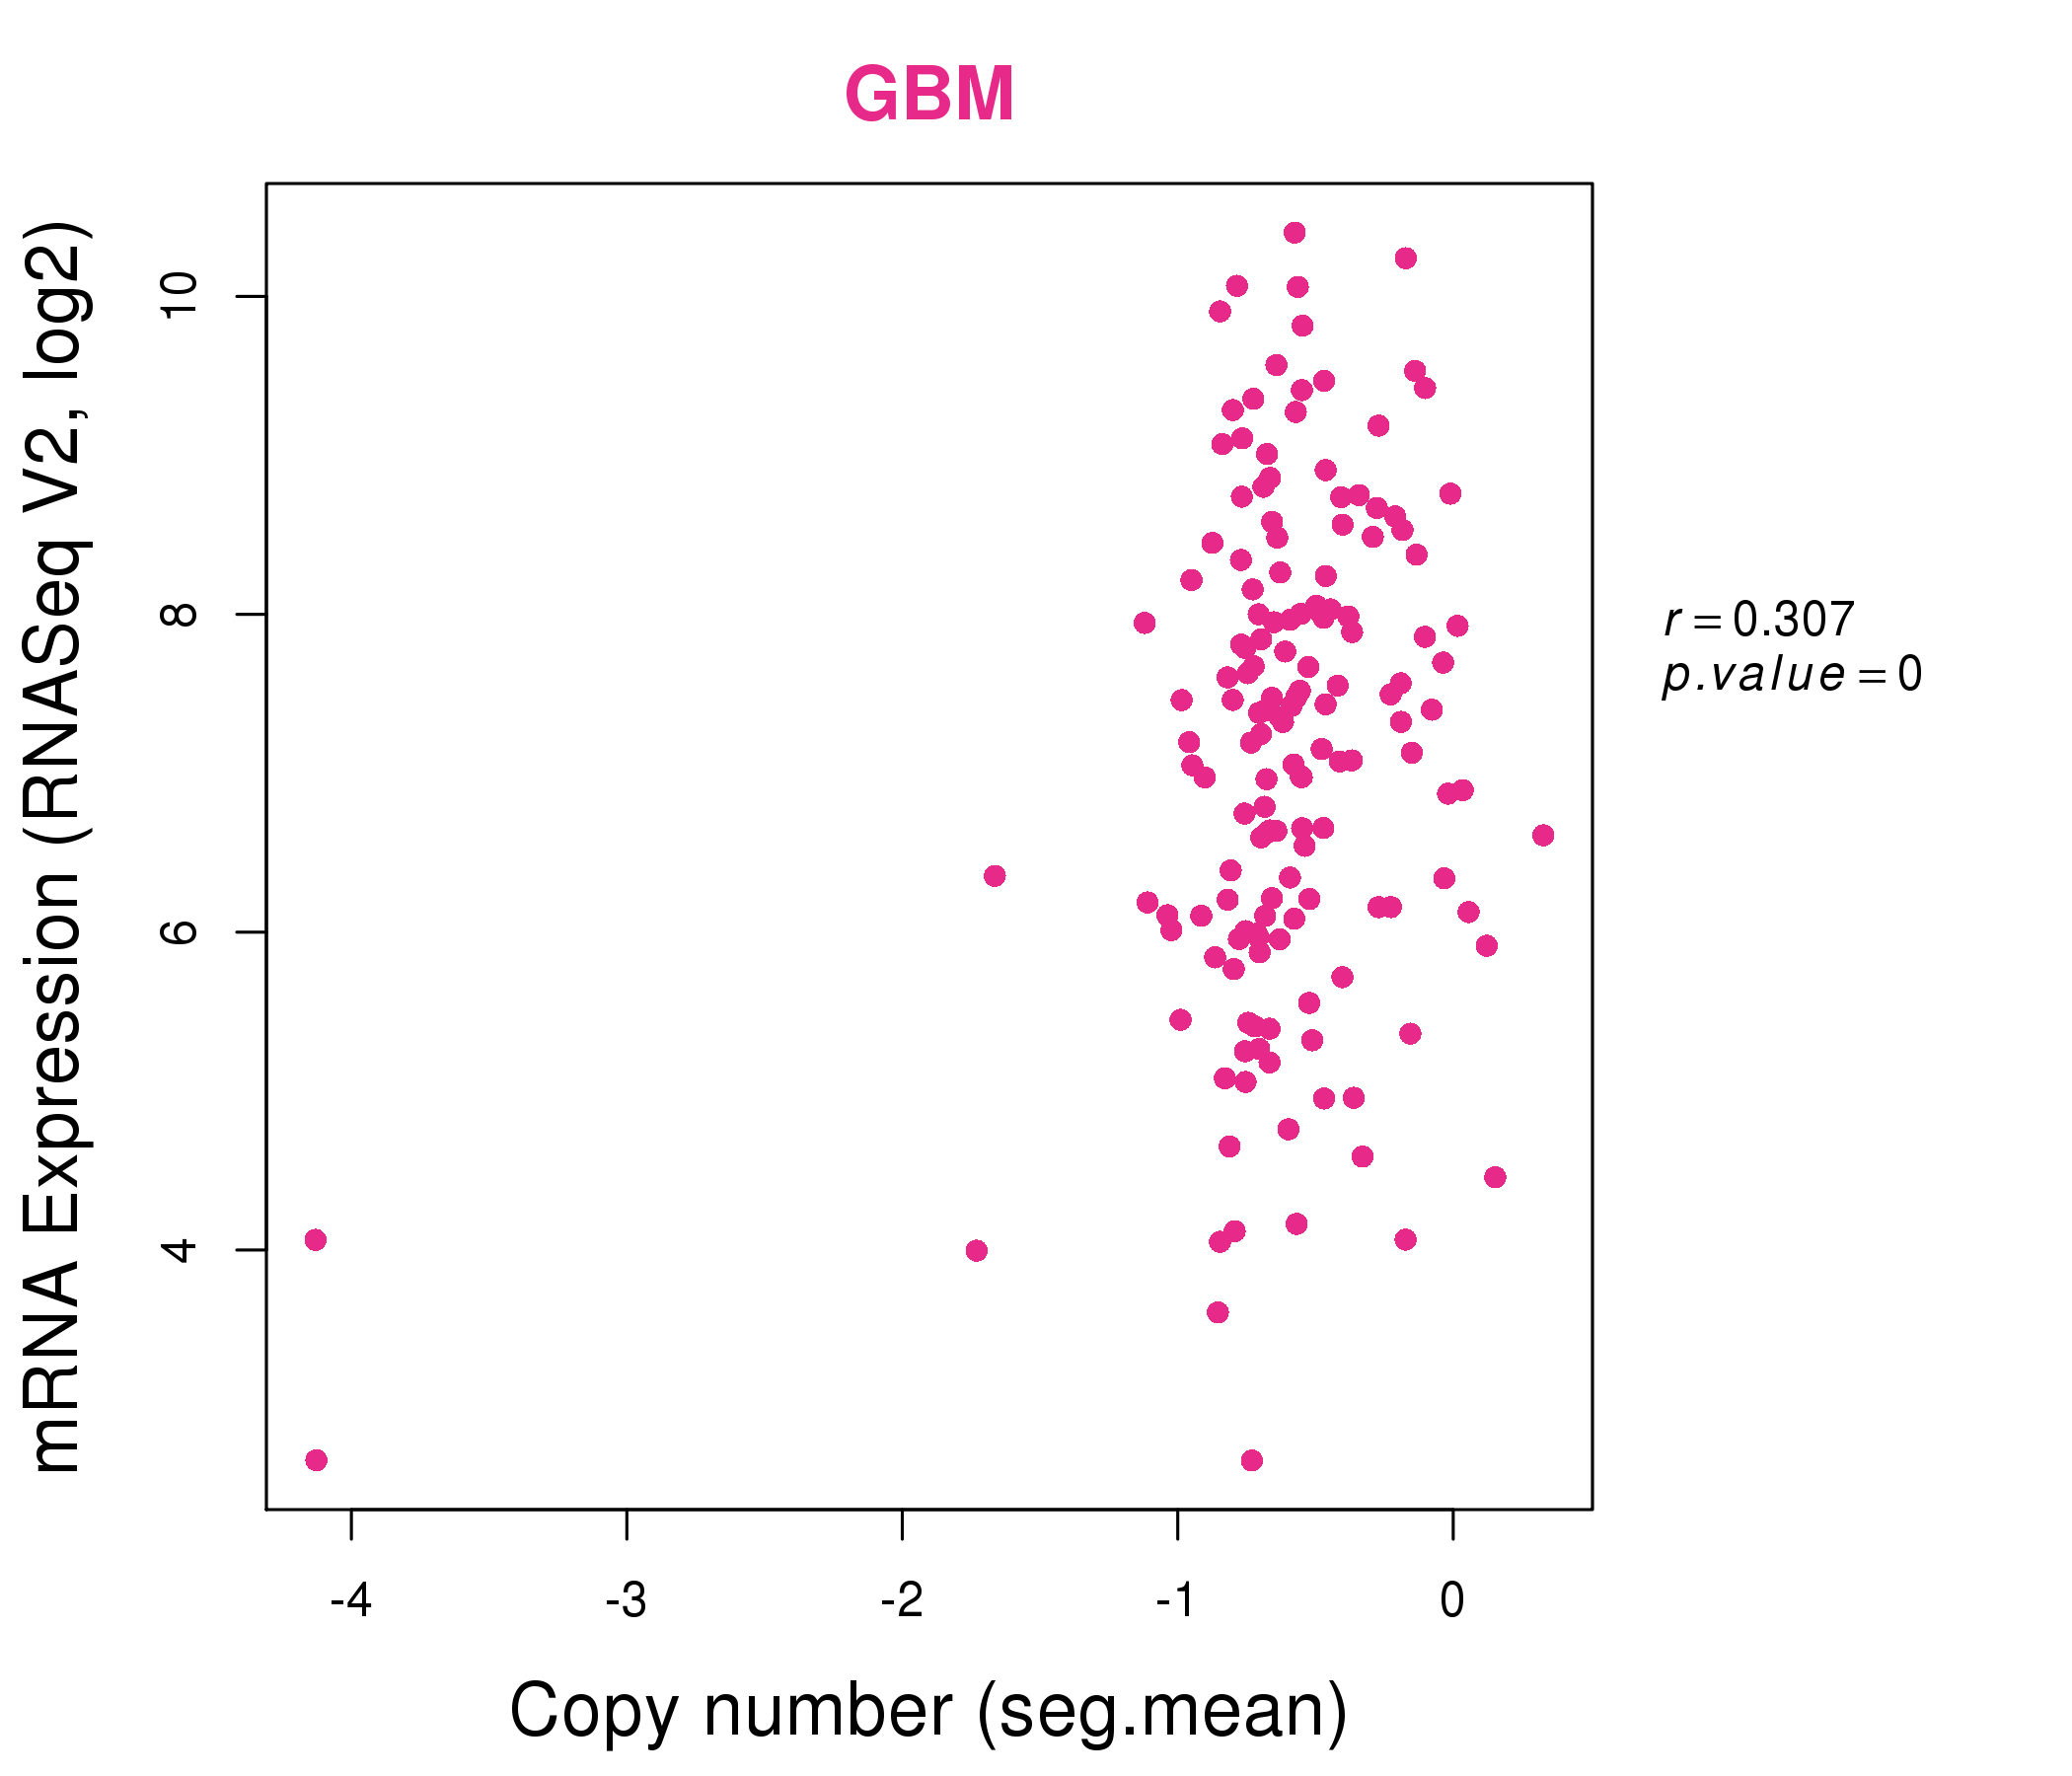
| * Copy number data were extracted from TCGA using R package TCGA-Assembler. The URLs of all public data files on TCGA DCC data server were gathered on Jan-05-2015. Function ProcessCNAData in TCGA-Assembler package was used to obtain gene-level copy number value which is calculated as the average copy number of the genomic region of a gene. |
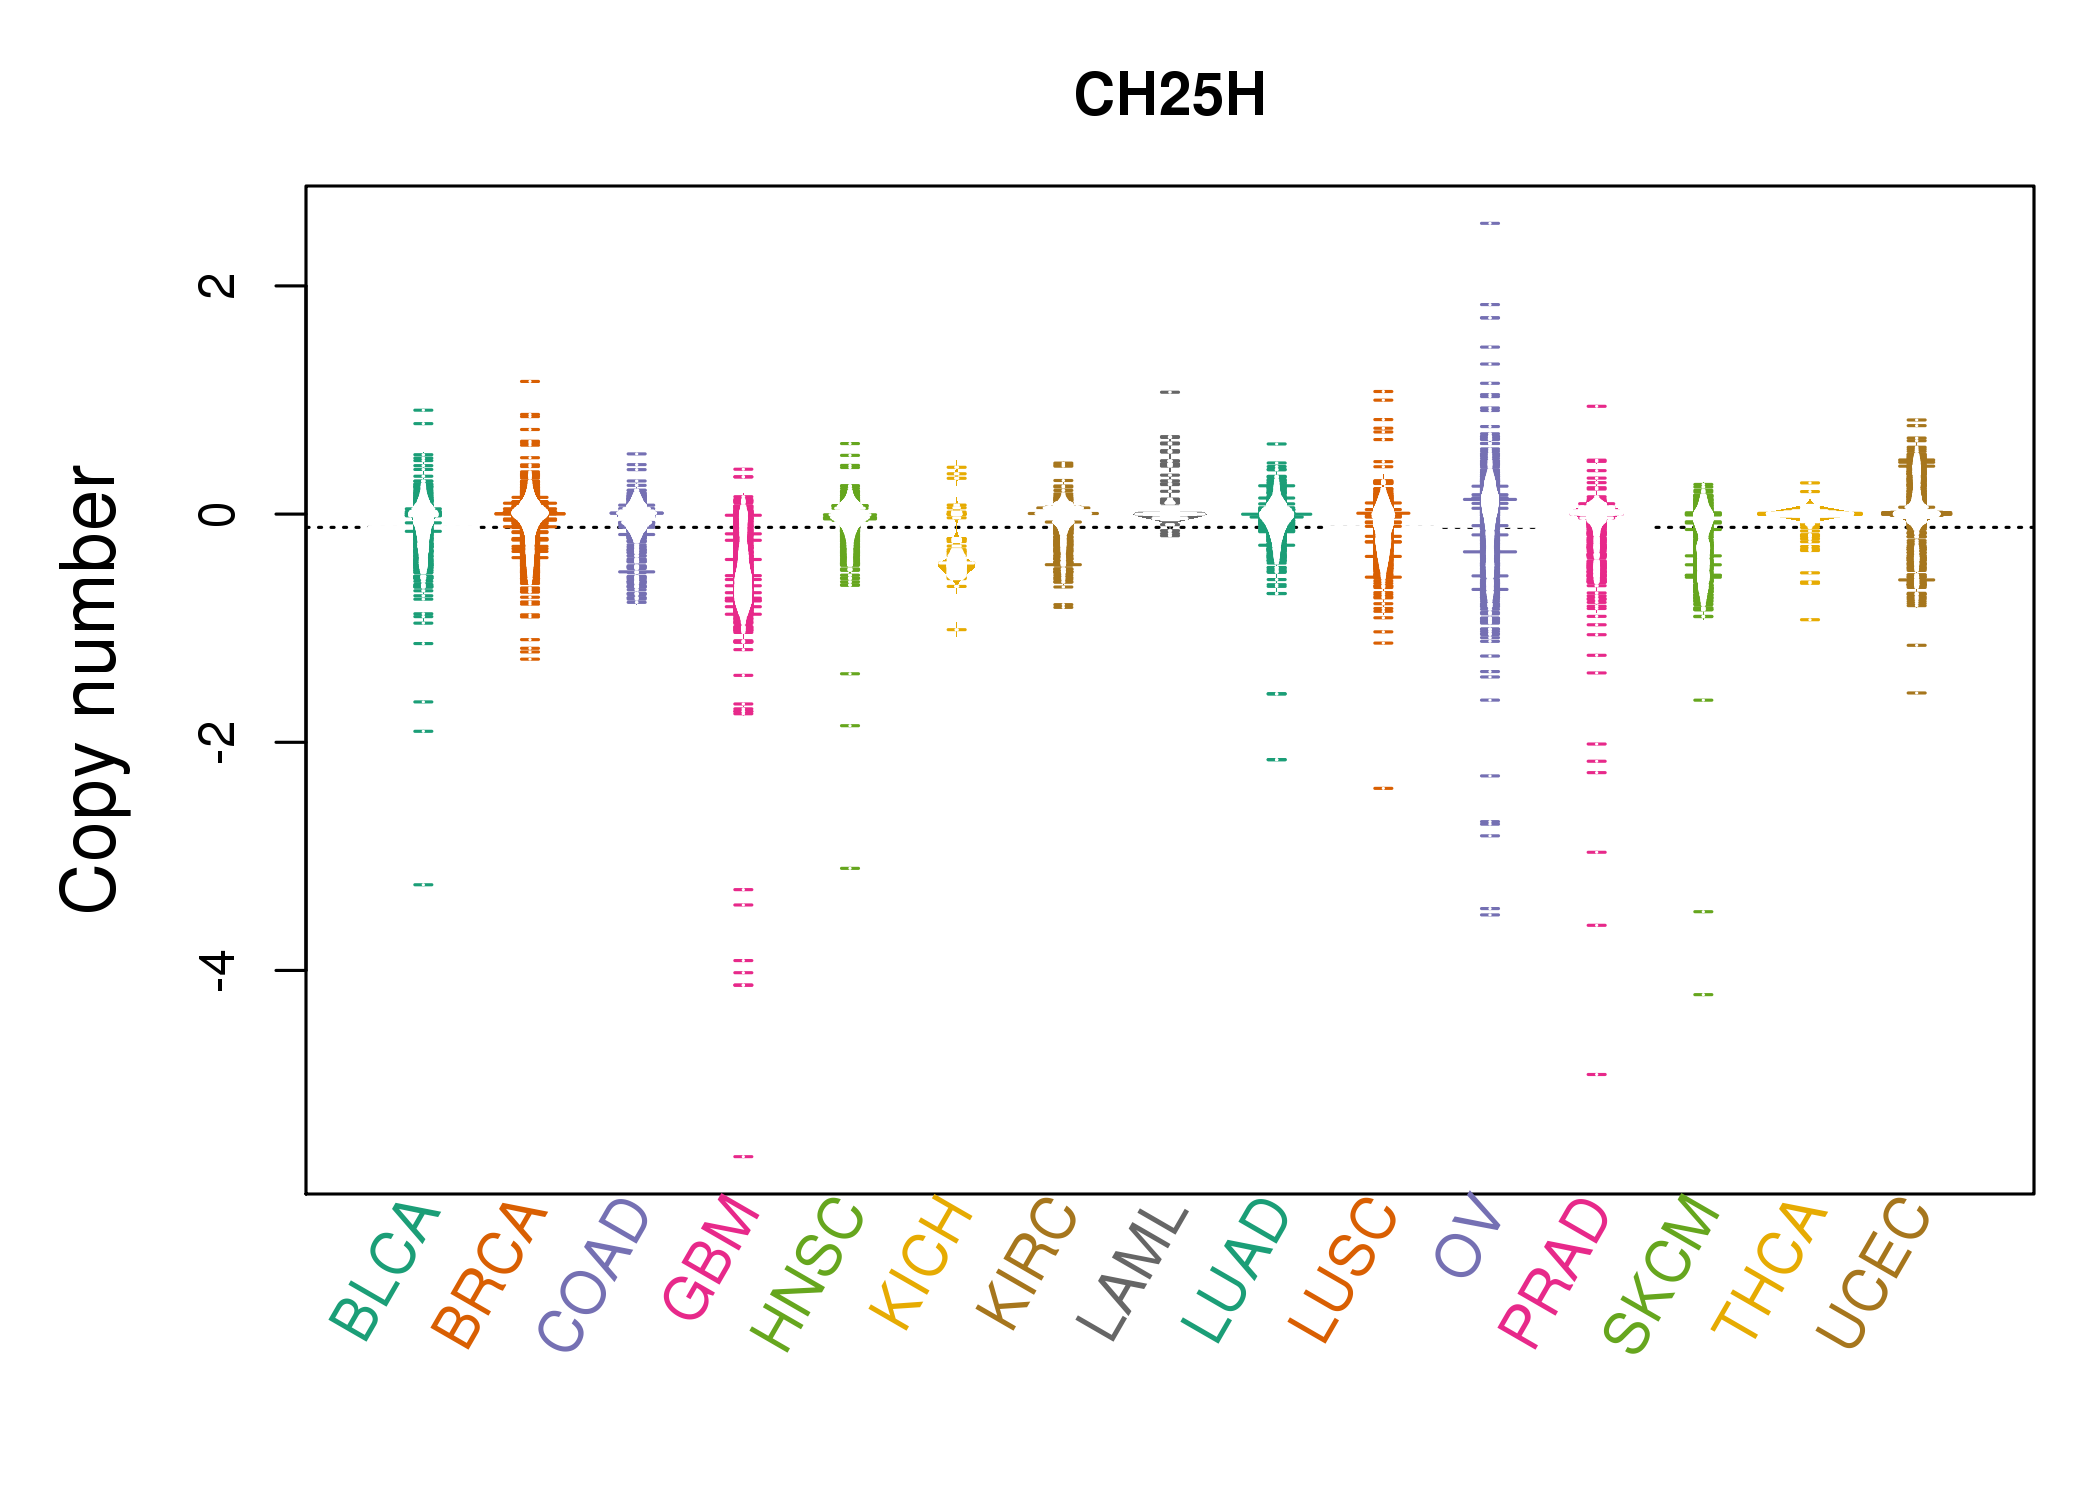 |
| cf) Tissue ID[Tissue type]: BLCA[Bladder Urothelial Carcinoma], BRCA[Breast invasive carcinoma], CESC[Cervical squamous cell carcinoma and endocervical adenocarcinoma], COAD[Colon adenocarcinoma], GBM[Glioblastoma multiforme], Glioma Low Grade, HNSC[Head and Neck squamous cell carcinoma], KICH[Kidney Chromophobe], KIRC[Kidney renal clear cell carcinoma], KIRP[Kidney renal papillary cell carcinoma], LAML[Acute Myeloid Leukemia], LUAD[Lung adenocarcinoma], LUSC[Lung squamous cell carcinoma], OV[Ovarian serous cystadenocarcinoma ], PAAD[Pancreatic adenocarcinoma], PRAD[Prostate adenocarcinoma], SKCM[Skin Cutaneous Melanoma], STAD[Stomach adenocarcinoma], THCA[Thyroid carcinoma], UCEC[Uterine Corpus Endometrial Carcinoma] |
| Top |
| Gene Expression for CH25H |
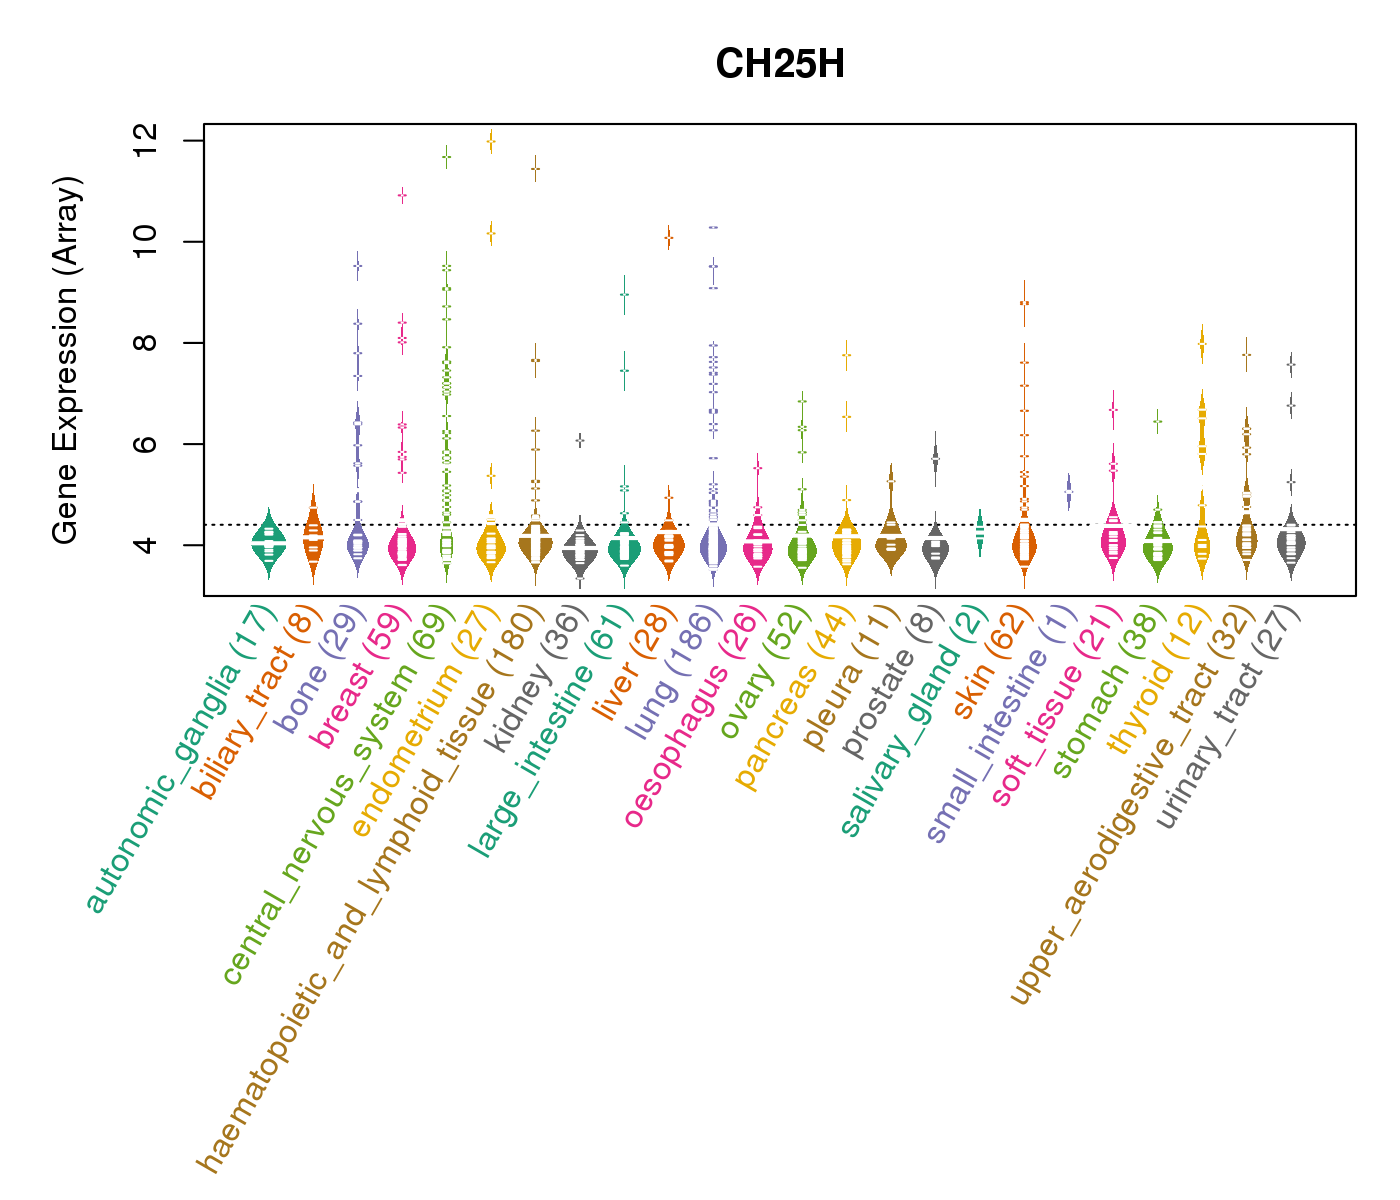
| * CCLE gene expression data were extracted from CCLE_Expression_Entrez_2012-10-18.res: Gene-centric RMA-normalized mRNA expression data. |
 |
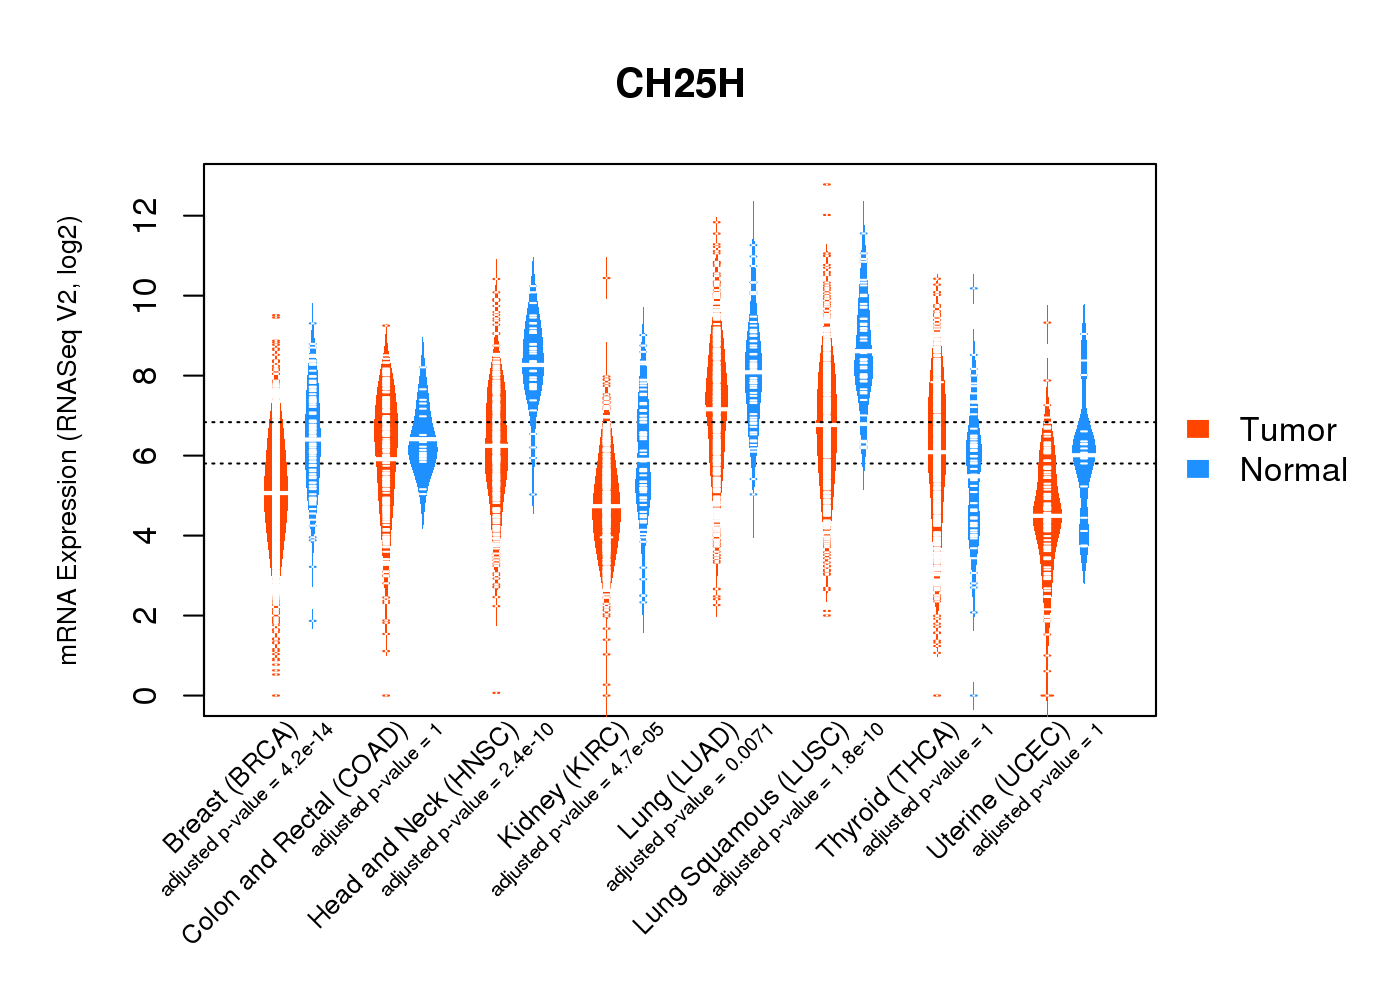
| * Normalized gene expression data of RNASeqV2 was extracted from TCGA using R package TCGA-Assembler. The URLs of all public data files on TCGA DCC data server were gathered at Jan-05-2015. Only eight cancer types have enough normal control samples for differential expression analysis. (t test, adjusted p<0.05 (using Benjamini-Hochberg FDR)) |
 |
| Top |
| * This plots show the correlation between CNV and gene expression. |
: Open all plots for all cancer types
 |
|
 |
|
| Top |
| Gene-Gene Network Information |
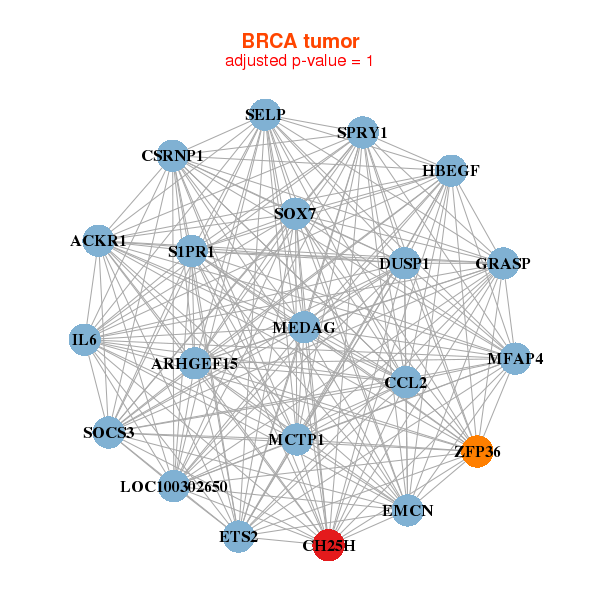
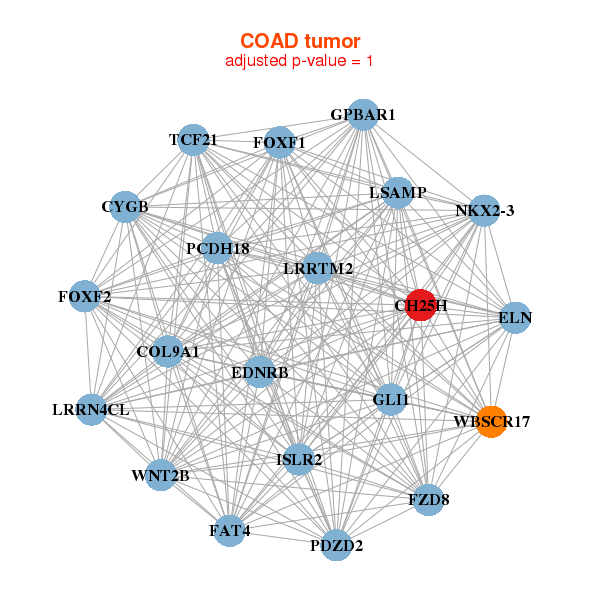
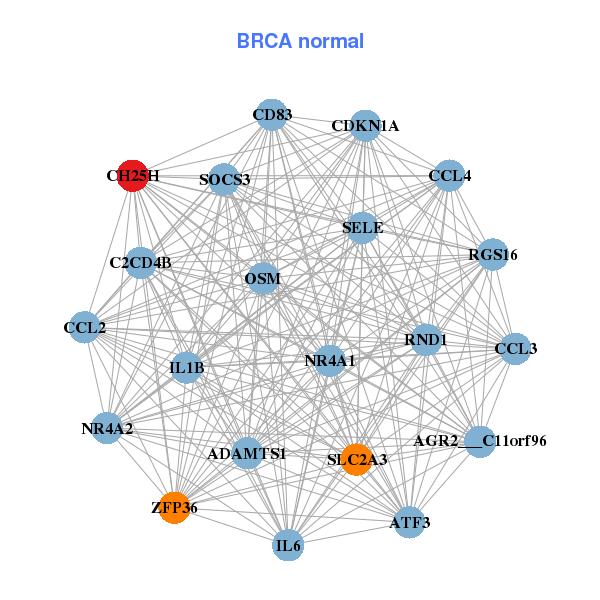
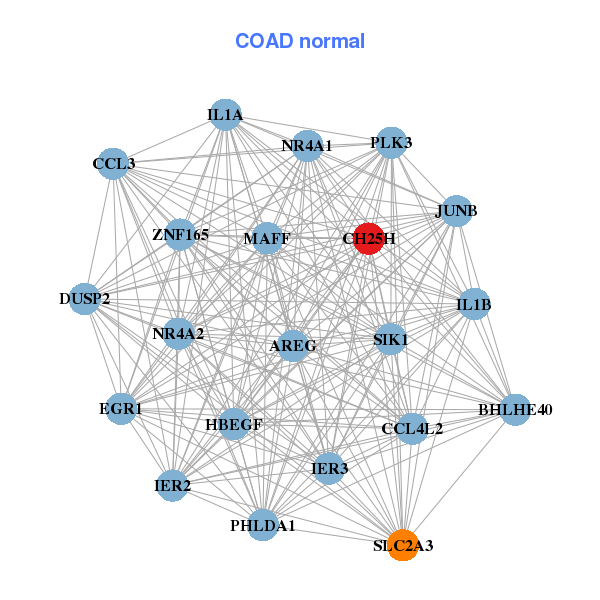
| * Co-Expression network figures were drawn using R package igraph. Only the top 20 genes with the highest correlations were shown. Red circle: input gene, orange circle: cell metabolism gene, sky circle: other gene |
: Open all plots for all cancer types
 |
|
| ARHGEF15,MEDAG,CCL2,CH25H,CSRNP1,ACKR1,DUSP1, EMCN,ETS2,GRASP,HBEGF,IL6,LOC100302650,MCTP1, MFAP4,S1PR1,SELP,SOCS3,SOX7,SPRY1,ZFP36 | ADAMTS1,AGR2___C11orf96,ATF3,C2CD4B,CCL2,CCL3,CCL4, CD83,CDKN1A,CH25H,IL1B,IL6,NR4A1,NR4A2, OSM,RGS16,RND1,SELE,SLC2A3,SOCS3,ZFP36 |
 |
|
| CH25H,COL9A1,CYGB,EDNRB,ELN,FAT4,FOXF1, FOXF2,FZD8,GLI1,GPBAR1,ISLR2,LRRN4CL,LRRTM2, LSAMP,NKX2-3,PCDH18,PDZD2,TCF21,WBSCR17,WNT2B | AREG,BHLHE40,CCL3,CCL4L2,CH25H,DUSP2,EGR1, HBEGF,IER2,IER3,IL1A,IL1B,JUNB,MAFF, NR4A1,NR4A2,PHLDA1,PLK3,SIK1,SLC2A3,ZNF165 |
| * Co-Expression network figures were drawn using R package igraph. Only the top 20 genes with the highest correlations were shown. Red circle: input gene, orange circle: cell metabolism gene, sky circle: other gene |
: Open all plots for all cancer types
| Top |
: Open all interacting genes' information including KEGG pathway for all interacting genes from DAVID
| Top |
| Pharmacological Information for CH25H |
| There's no related Drug. |
| Top |
| Cross referenced IDs for CH25H |
| * We obtained these cross-references from Uniprot database. It covers 150 different DBs, 18 categories. http://www.uniprot.org/help/cross_references_section |
: Open all cross reference information
|
Copyright © 2016-Present - The Univsersity of Texas Health Science Center at Houston @ |