|
||||||||||||||||||||||||||||||||||||||||||||||||||||||||||||||||||||||||||||||||||||||||||||||||||||||||||||||||||||||||||||||||||||||||||||||||||||||||||||||||||||||||||||||||||||||||||||||||||||||||||||||||||||||||||||||||||||||||||||||||||||||||||||||||||||||||||||||||||||||||||||||||||||||||||||||||||||||||||
| |
| Phenotypic Information (metabolism pathway, cancer, disease, phenome) |
| |
| |
| Gene-Gene Network Information: Co-Expression Network, Interacting Genes & KEGG |
| |
|


| Gene Summary for PAPSS2 |
| Basic gene info. | Gene symbol | PAPSS2 |
| Gene name | 3'-phosphoadenosine 5'-phosphosulfate synthase 2 | |
| Synonyms | ATPSK2|BCYM4|SK2 | |
| Cytomap | UCSC genome browser: 10q24 | |
| Genomic location | chr10 :89419475-89507462 | |
| Type of gene | protein-coding | |
| RefGenes | NM_001015880.1, NM_004670.3, | |
| Ensembl id | ENSG00000198682 | |
| Description | 3-prime-phosphoadenosine 5-prime-phosphosulfate synthase 2ATP sulfurylase/APS kinase 2ATP sulfurylase/adenosine 5'-phosphosulfate kinasePAPS synthase 2PAPS synthetase 2SK 2bifunctional 3'-phosphoadenosine 5'-phosphosulfate synthase 2bifunctional 3' | |
| Modification date | 20141207 | |
| dbXrefs | MIM : 603005 | |
| HGNC : HGNC | ||
| Ensembl : ENSG00000198682 | ||
| HPRD : 04303 | ||
| Vega : OTTHUMG00000018683 | ||
| Protein | UniProt: go to UniProt's Cross Reference DB Table | |
| Expression | CleanEX: HS_PAPSS2 | |
| BioGPS: 9060 | ||
| Gene Expression Atlas: ENSG00000198682 | ||
| The Human Protein Atlas: ENSG00000198682 | ||
| Pathway | NCI Pathway Interaction Database: PAPSS2 | |
| KEGG: PAPSS2 | ||
| REACTOME: PAPSS2 | ||
| ConsensusPathDB | ||
| Pathway Commons: PAPSS2 | ||
| Metabolism | MetaCyc: PAPSS2 | |
| HUMANCyc: PAPSS2 | ||
| Regulation | Ensembl's Regulation: ENSG00000198682 | |
| miRBase: chr10 :89,419,475-89,507,462 | ||
| TargetScan: NM_001015880 | ||
| cisRED: ENSG00000198682 | ||
| Context | iHOP: PAPSS2 | |
| cancer metabolism search in PubMed: PAPSS2 | ||
| UCL Cancer Institute: PAPSS2 | ||
| Assigned class in ccmGDB | C | |
| Top |
| Phenotypic Information for PAPSS2(metabolism pathway, cancer, disease, phenome) |
| Cancer | CGAP: PAPSS2 |
| Familial Cancer Database: PAPSS2 | |
| * This gene is included in those cancer gene databases. |
|
|
|
|
|
|
| ||||||||||||||||||||||||||||||||||||||||||||||||||||||||||||||||||||||||||||||||||||||||||||||||||||||||||||||||||||||||||||||||||||||||||||||||||||||||||||||||||||||||||||||||||||||||||||||||||||||||||||||||||||||||||||||||||||||||||||||||||||||||||||||||||||||||||||||||||||||||||||||||||||||||||||||||||||
Oncogene 1 | Significant driver gene in | |||||||||||||||||||||||||||||||||||||||||||||||||||||||||||||||||||||||||||||||||||||||||||||||||||||||||||||||||||||||||||||||||||||||||||||||||||||||||||||||||||||||||||||||||||||||||||||||||||||||||||||||||||||||||||||||||||||||||||||||||||||||||||||||||||||||||||||||||||||||||||||||||||||||||||||||||||||||||
| cf) number; DB name 1 Oncogene; http://nar.oxfordjournals.org/content/35/suppl_1/D721.long, 2 Tumor Suppressor gene; https://bioinfo.uth.edu/TSGene/, 3 Cancer Gene Census; http://www.nature.com/nrc/journal/v4/n3/abs/nrc1299.html, 4 CancerGenes; http://nar.oxfordjournals.org/content/35/suppl_1/D721.long, 5 Network of Cancer Gene; http://ncg.kcl.ac.uk/index.php, 1Therapeutic Vulnerabilities in Cancer; http://cbio.mskcc.org/cancergenomics/statius/ |
| KEGG_PURINE_METABOLISM KEGG_SELENOAMINO_ACID_METABOLISM KEGG_SULFUR_METABOLISM | |
| OMIM | |
| Orphanet | |
| Disease | KEGG Disease: PAPSS2 |
| MedGen: PAPSS2 (Human Medical Genetics with Condition) | |
| ClinVar: PAPSS2 | |
| Phenotype | MGI: PAPSS2 (International Mouse Phenotyping Consortium) |
| PhenomicDB: PAPSS2 | |
| Mutations for PAPSS2 |
| * Under tables are showing count per each tissue to give us broad intuition about tissue specific mutation patterns.You can go to the detailed page for each mutation database's web site. |
| - Statistics for Tissue and Mutation type | Top |
 |
| - For Inter-chromosomal Variations |
| * Inter-chromosomal variantions includes 'interchromosomal amplicon to amplicon', 'interchromosomal amplicon to non-amplified dna', 'interchromosomal insertion', 'Interchromosomal unknown type'. |
 |
| - For Intra-chromosomal Variations |
| * Intra-chromosomal variantions includes 'intrachromosomal amplicon to amplicon', 'intrachromosomal amplicon to non-amplified dna', 'intrachromosomal deletion', 'intrachromosomal fold-back inversion', 'intrachromosomal inversion', 'intrachromosomal tandem duplication', 'Intrachromosomal unknown type', 'intrachromosomal with inverted orientation', 'intrachromosomal with non-inverted orientation'. |
 |
| Sample | Symbol_a | Chr_a | Start_a | End_a | Symbol_b | Chr_b | Start_b | End_b |
| ovary | PAPSS2 | chr10 | 89432151 | 89432171 | PAPSS2 | chr10 | 89475047 | 89475067 |
| pancreas | PAPSS2 | chr10 | 89420307 | 89420327 | GRID1 | chr10 | 88125864 | 88125884 |
| cf) Tissue number; Tissue name (1;Breast, 2;Central_nervous_system, 3;Haematopoietic_and_lymphoid_tissue, 4;Large_intestine, 5;Liver, 6;Lung, 7;Ovary, 8;Pancreas, 9;Prostate, 10;Skin, 11;Soft_tissue, 12;Upper_aerodigestive_tract) |
| * From mRNA Sanger sequences, Chitars2.0 arranged chimeric transcripts. This table shows PAPSS2 related fusion information. |
| ID | Head Gene | Tail Gene | Accession | Gene_a | qStart_a | qEnd_a | Chromosome_a | tStart_a | tEnd_a | Gene_a | qStart_a | qEnd_a | Chromosome_a | tStart_a | tEnd_a |
| AA149744 | PLEKHJ1 | 1 | 109 | 19 | 2233182 | 2233290 | PAPSS2 | 108 | 516 | 10 | 89506245 | 89506651 | |
| Top |
| Mutation type/ Tissue ID | brca | cns | cerv | endome | haematopo | kidn | Lintest | liver | lung | ns | ovary | pancre | prost | skin | stoma | thyro | urina | |||
| Total # sample | 2 | 13 | 1 | 1 | 4 | 2 | 3 | 3 | 1 | |||||||||||
| GAIN (# sample) | ||||||||||||||||||||
| LOSS (# sample) | 2 | 13 | 1 | 1 | 4 | 2 | 3 | 3 | 1 |
| cf) Tissue ID; Tissue type (1; Breast, 2; Central_nervous_system, 3; Cervix, 4; Endometrium, 5; Haematopoietic_and_lymphoid_tissue, 6; Kidney, 7; Large_intestine, 8; Liver, 9; Lung, 10; NS, 11; Ovary, 12; Pancreas, 13; Prostate, 14; Skin, 15; Stomach, 16; Thyroid, 17; Urinary_tract) |
| Top |
|
 |
| Top |
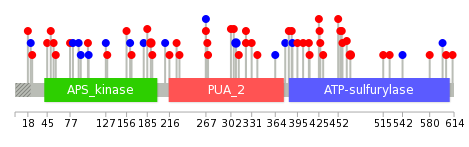
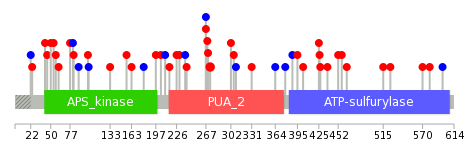
| Stat. for Non-Synonymous SNVs (# total SNVs=34) | (# total SNVs=10) |
 |  |
(# total SNVs=2) | (# total SNVs=0) |
 |
| Top |
| * When you move the cursor on each content, you can see more deailed mutation information on the Tooltip. Those are primary_site,primary_histology,mutation(aa),pubmedID. |
| GRCh37 position | Mutation(aa) | Unique sampleID count |
| chr10:89474550-89474550 | p.R190H | 2 |
| chr10:89487102-89487102 | p.R309R | 2 |
| chr10:89473069-89473069 | p.? | 2 |
| chr10:89503327-89503327 | p.G469R | 2 |
| chr10:89487190-89487190 | p.E339K | 1 |
| chr10:89472915-89472915 | p.D77N | 1 |
| chr10:89503196-89503196 | p.T425S | 1 |
| chr10:89473906-89473906 | p.L163I | 1 |
| chr10:89475536-89475536 | p.P267P | 1 |
| chr10:89504826-89504826 | p.A515V | 1 |
| Top |
|
 |
| Point Mutation/ Tissue ID | 1 | 2 | 3 | 4 | 5 | 6 | 7 | 8 | 9 | 10 | 11 | 12 | 13 | 14 | 15 | 16 | 17 | 18 | 19 | 20 |
| # sample | 2 | 2 | 5 | 3 | 2 | 3 | 2 | 7 | 1 | 1 | 1 | 6 | 5 | 1 | 8 | |||||
| # mutation | 2 | 2 | 6 | 2 | 2 | 3 | 2 | 9 | 1 | 1 | 1 | 6 | 5 | 1 | 9 | |||||
| nonsynonymous SNV | 5 | 2 | 2 | 3 | 1 | 7 | 1 | 1 | 1 | 5 | 4 | 1 | 6 | |||||||
| synonymous SNV | 2 | 2 | 1 | 1 | 2 | 1 | 1 | 3 |
| cf) Tissue ID; Tissue type (1; BLCA[Bladder Urothelial Carcinoma], 2; BRCA[Breast invasive carcinoma], 3; CESC[Cervical squamous cell carcinoma and endocervical adenocarcinoma], 4; COAD[Colon adenocarcinoma], 5; GBM[Glioblastoma multiforme], 6; Glioma Low Grade, 7; HNSC[Head and Neck squamous cell carcinoma], 8; KICH[Kidney Chromophobe], 9; KIRC[Kidney renal clear cell carcinoma], 10; KIRP[Kidney renal papillary cell carcinoma], 11; LAML[Acute Myeloid Leukemia], 12; LUAD[Lung adenocarcinoma], 13; LUSC[Lung squamous cell carcinoma], 14; OV[Ovarian serous cystadenocarcinoma ], 15; PAAD[Pancreatic adenocarcinoma], 16; PRAD[Prostate adenocarcinoma], 17; SKCM[Skin Cutaneous Melanoma], 18:STAD[Stomach adenocarcinoma], 19:THCA[Thyroid carcinoma], 20:UCEC[Uterine Corpus Endometrial Carcinoma]) |
| Top |
| * We represented just top 10 SNVs. When you move the cursor on each content, you can see more deailed mutation information on the Tooltip. Those are primary_site, primary_histology, mutation(aa), pubmedID. |
| Genomic Position | Mutation(aa) | Unique sampleID count |
| chr10:89475553 | p.R273Q,PAPSS2 | 2 |
| chr10:89503196 | p.R133H,PAPSS2 | 1 |
| chr10:89472915 | p.A464V,PAPSS2 | 1 |
| chr10:89505676 | p.E156G,PAPSS2 | 1 |
| chr10:89474593 | p.V302I,PAPSS2 | 1 |
| chr10:89503199 | p.A515V,PAPSS2 | 1 |
| chr10:89472929 | p.A22A,PAPSS2 | 1 |
| chr10:89474611 | p.L163I,PAPSS2 | 1 |
| chr10:89487079 | p.D306N,PAPSS2 | 1 |
| chr10:89503202 | p.D525N,PAPSS2 | 1 |
| * Copy number data were extracted from TCGA using R package TCGA-Assembler. The URLs of all public data files on TCGA DCC data server were gathered on Jan-05-2015. Function ProcessCNAData in TCGA-Assembler package was used to obtain gene-level copy number value which is calculated as the average copy number of the genomic region of a gene. |
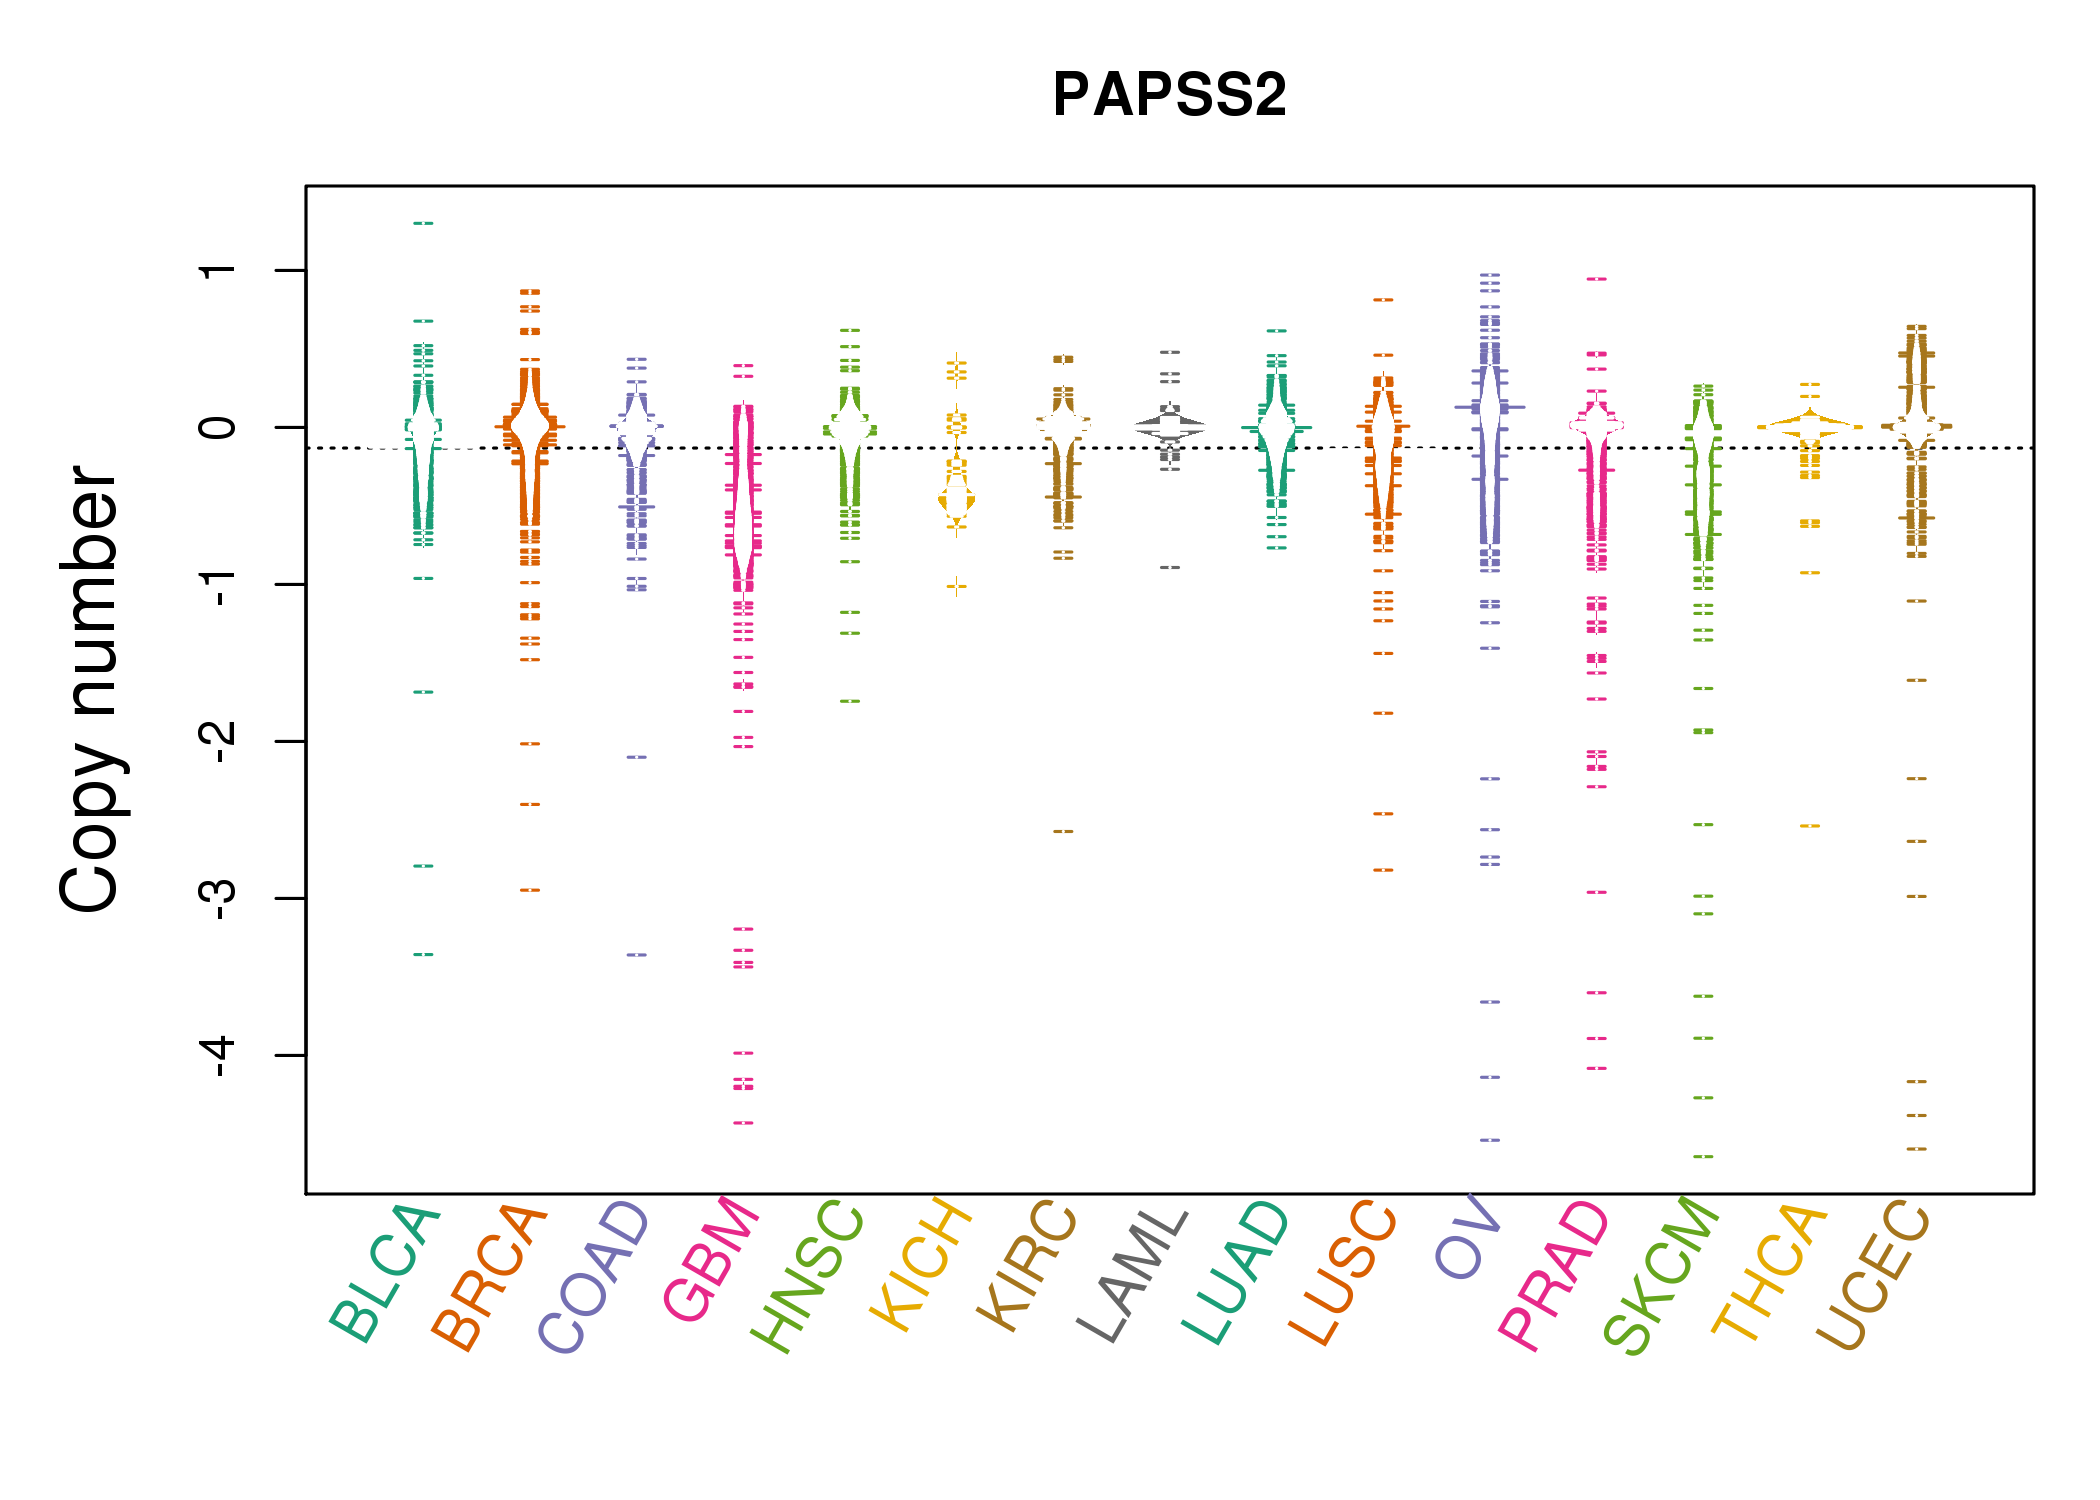 |
| cf) Tissue ID[Tissue type]: BLCA[Bladder Urothelial Carcinoma], BRCA[Breast invasive carcinoma], CESC[Cervical squamous cell carcinoma and endocervical adenocarcinoma], COAD[Colon adenocarcinoma], GBM[Glioblastoma multiforme], Glioma Low Grade, HNSC[Head and Neck squamous cell carcinoma], KICH[Kidney Chromophobe], KIRC[Kidney renal clear cell carcinoma], KIRP[Kidney renal papillary cell carcinoma], LAML[Acute Myeloid Leukemia], LUAD[Lung adenocarcinoma], LUSC[Lung squamous cell carcinoma], OV[Ovarian serous cystadenocarcinoma ], PAAD[Pancreatic adenocarcinoma], PRAD[Prostate adenocarcinoma], SKCM[Skin Cutaneous Melanoma], STAD[Stomach adenocarcinoma], THCA[Thyroid carcinoma], UCEC[Uterine Corpus Endometrial Carcinoma] |
| Top |
| Gene Expression for PAPSS2 |
| * CCLE gene expression data were extracted from CCLE_Expression_Entrez_2012-10-18.res: Gene-centric RMA-normalized mRNA expression data. |
 |
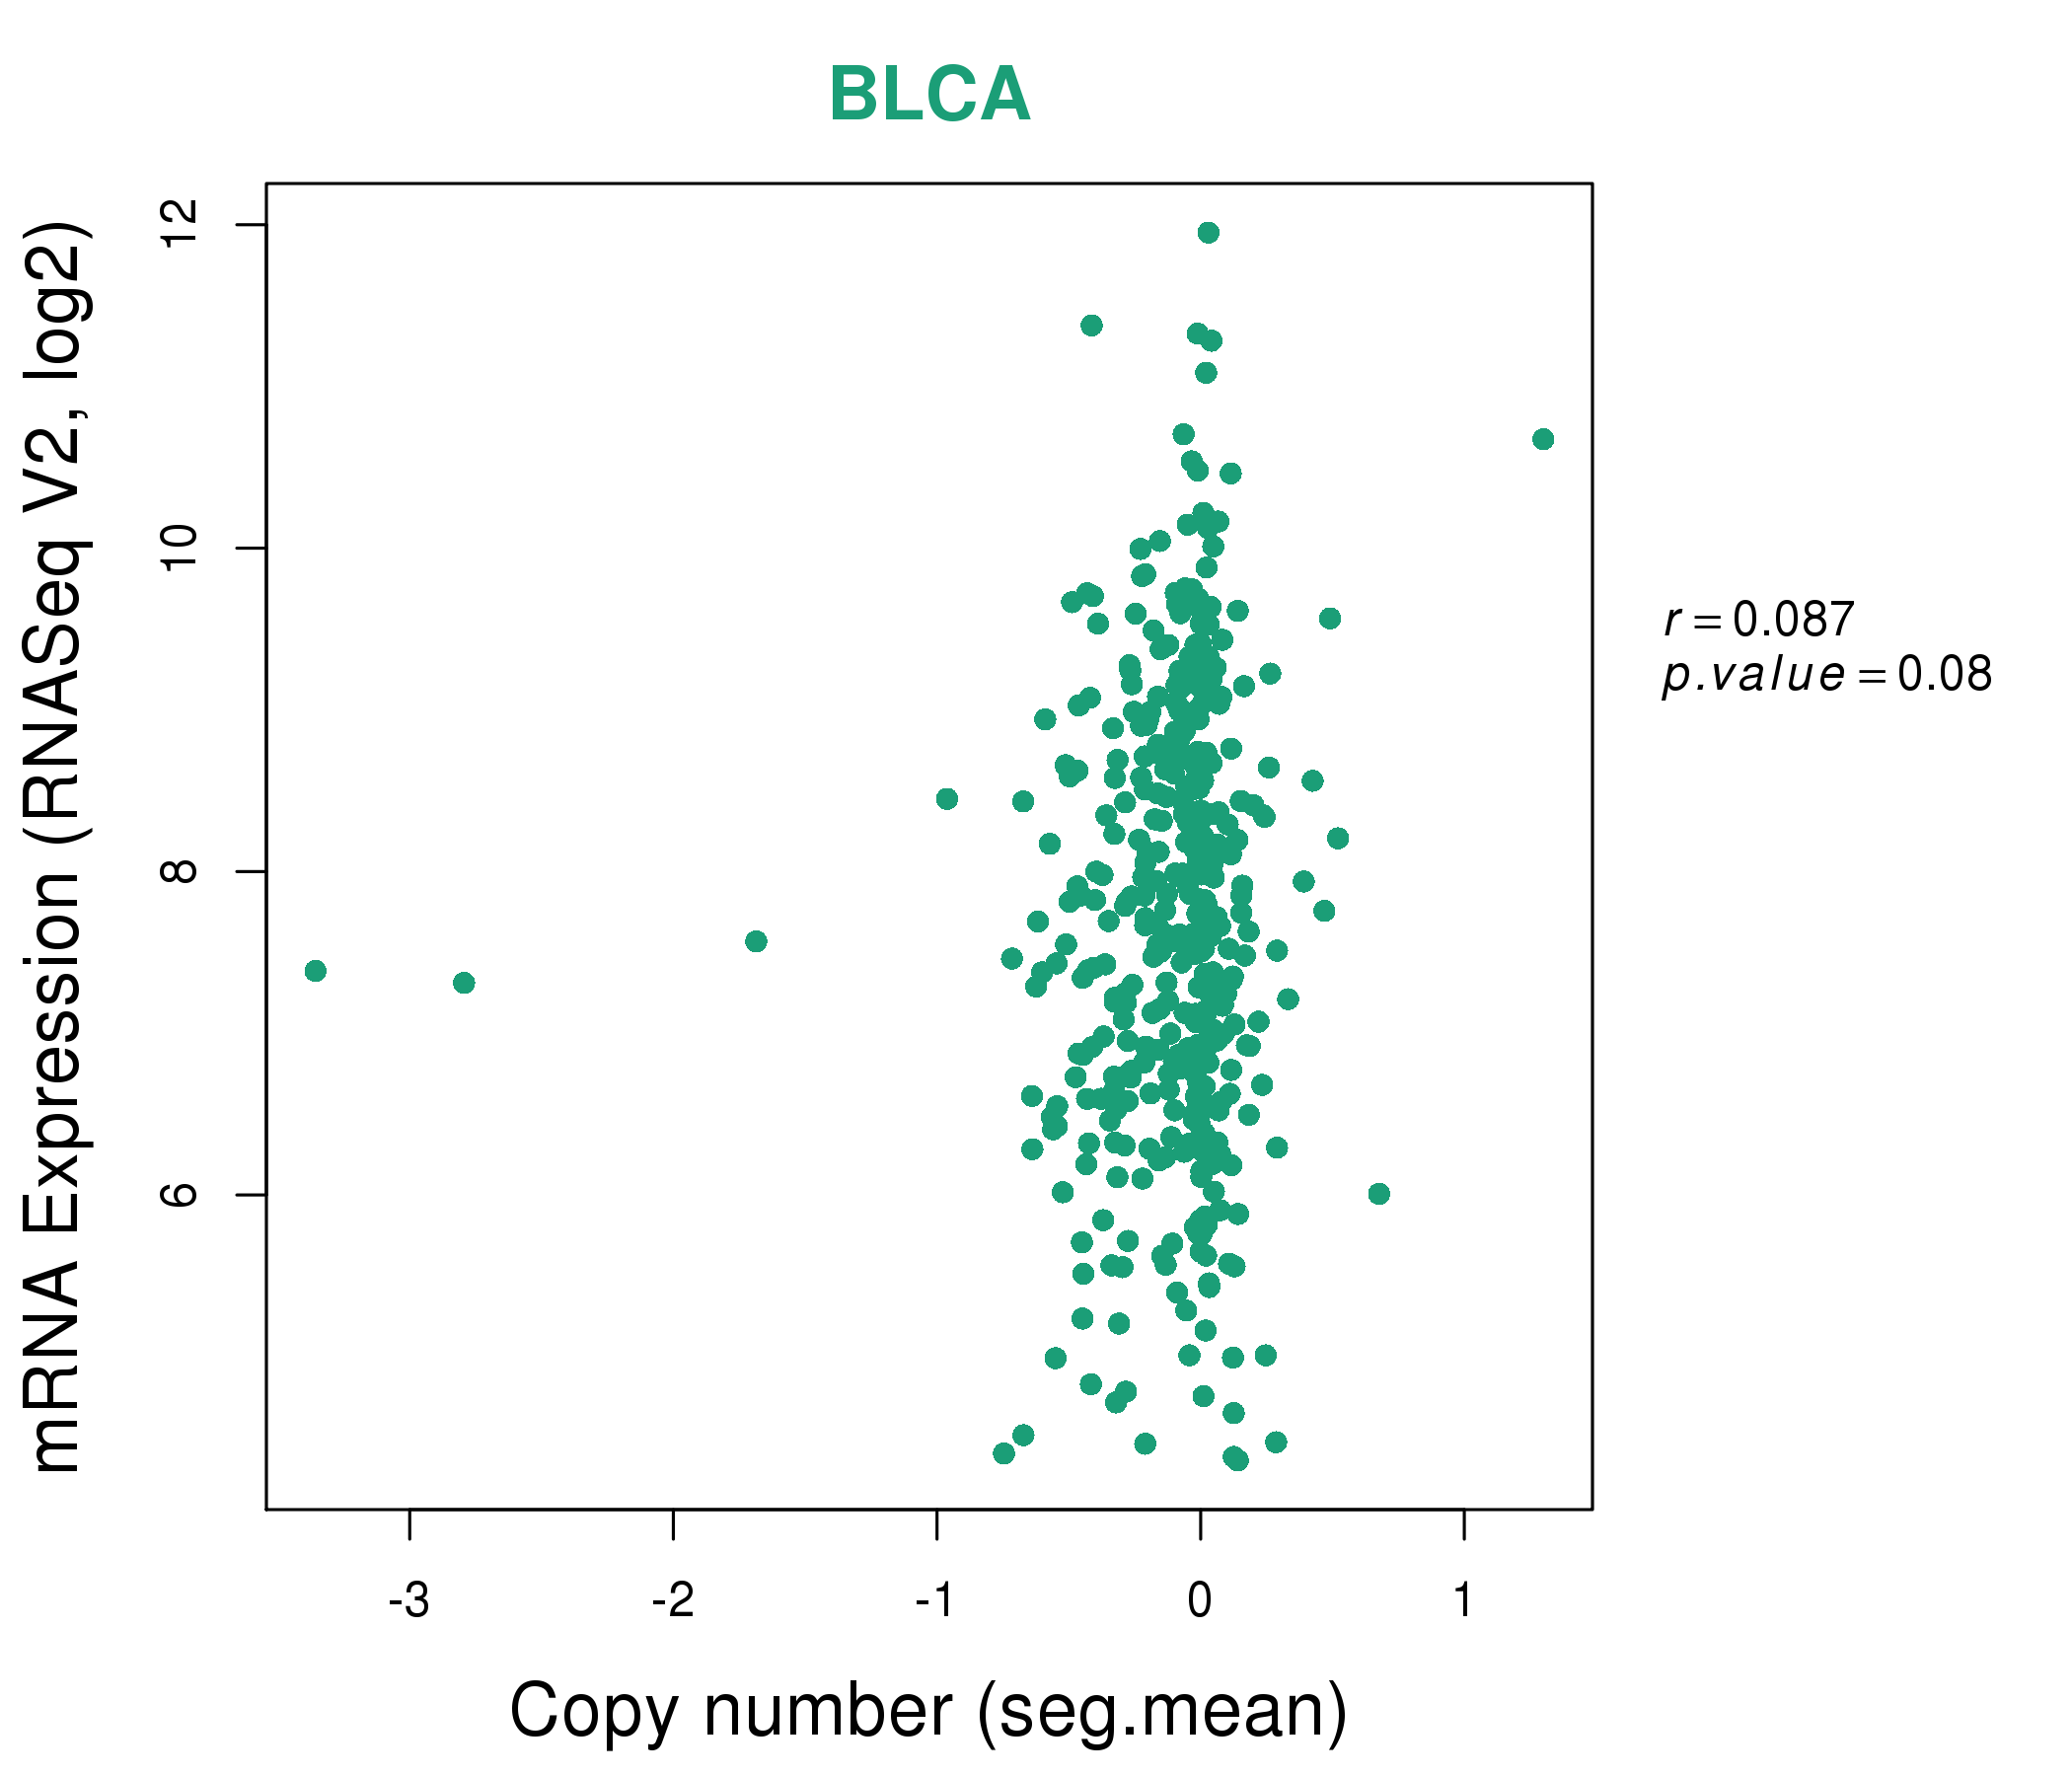
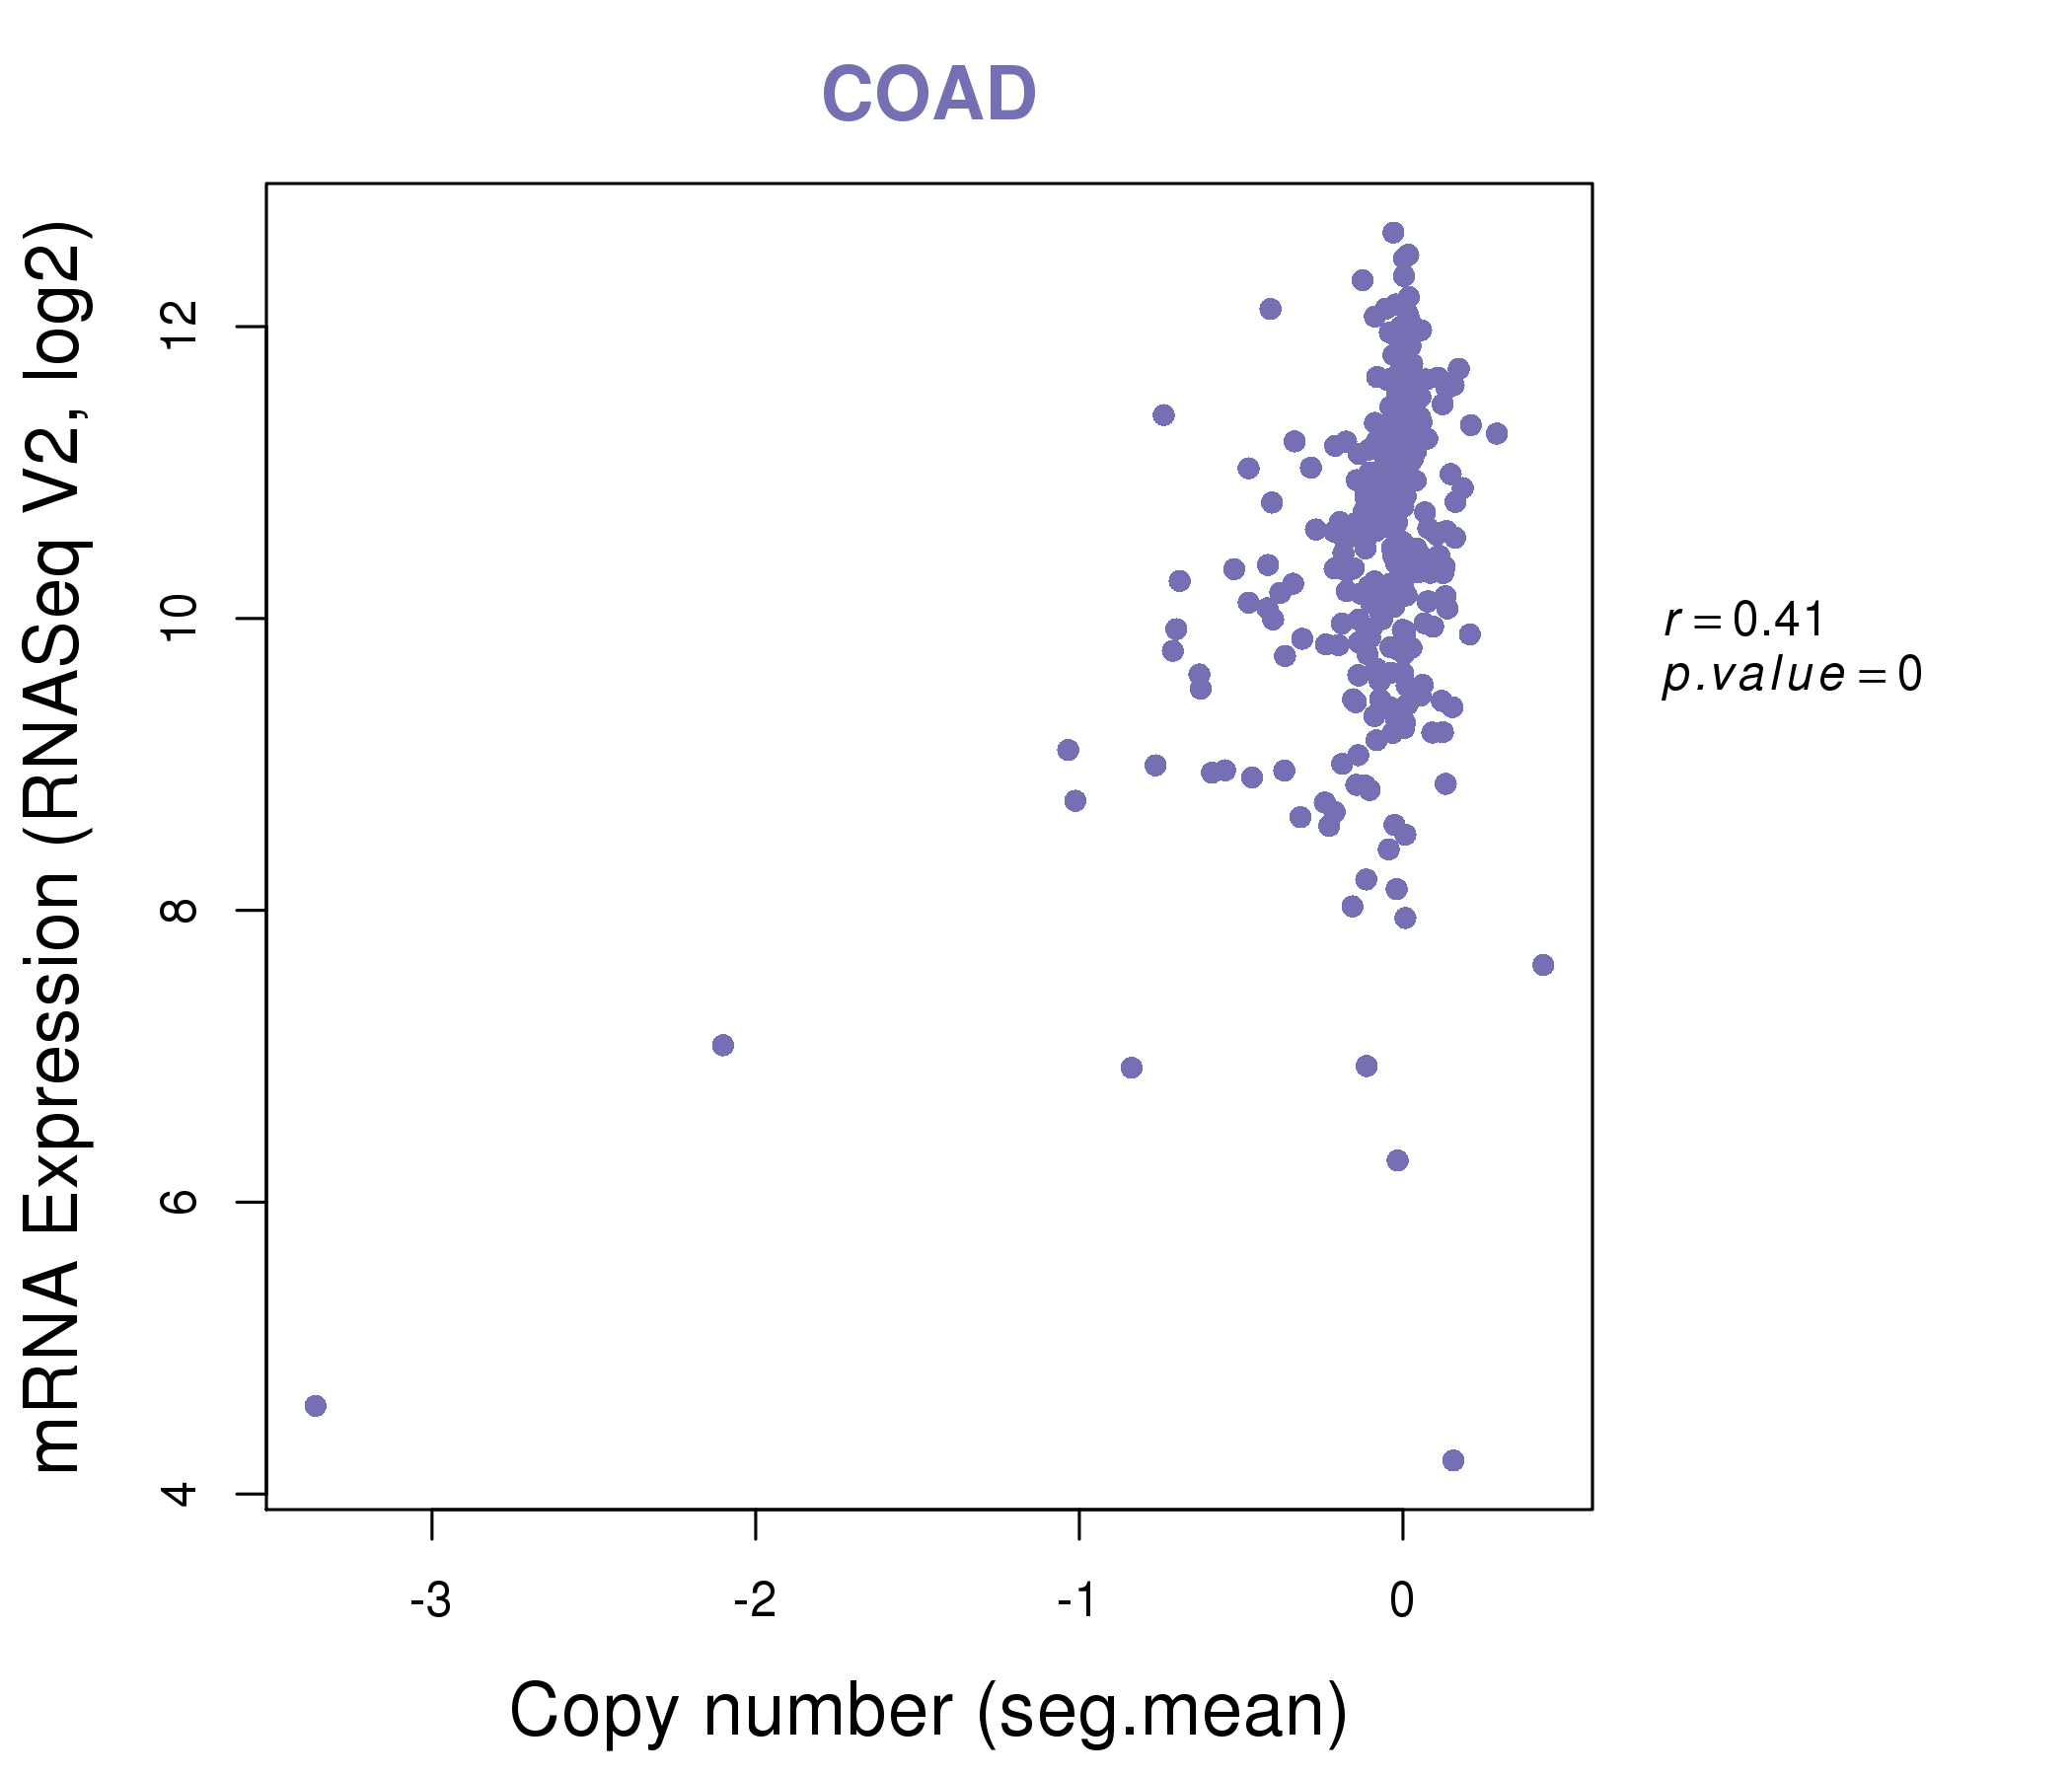
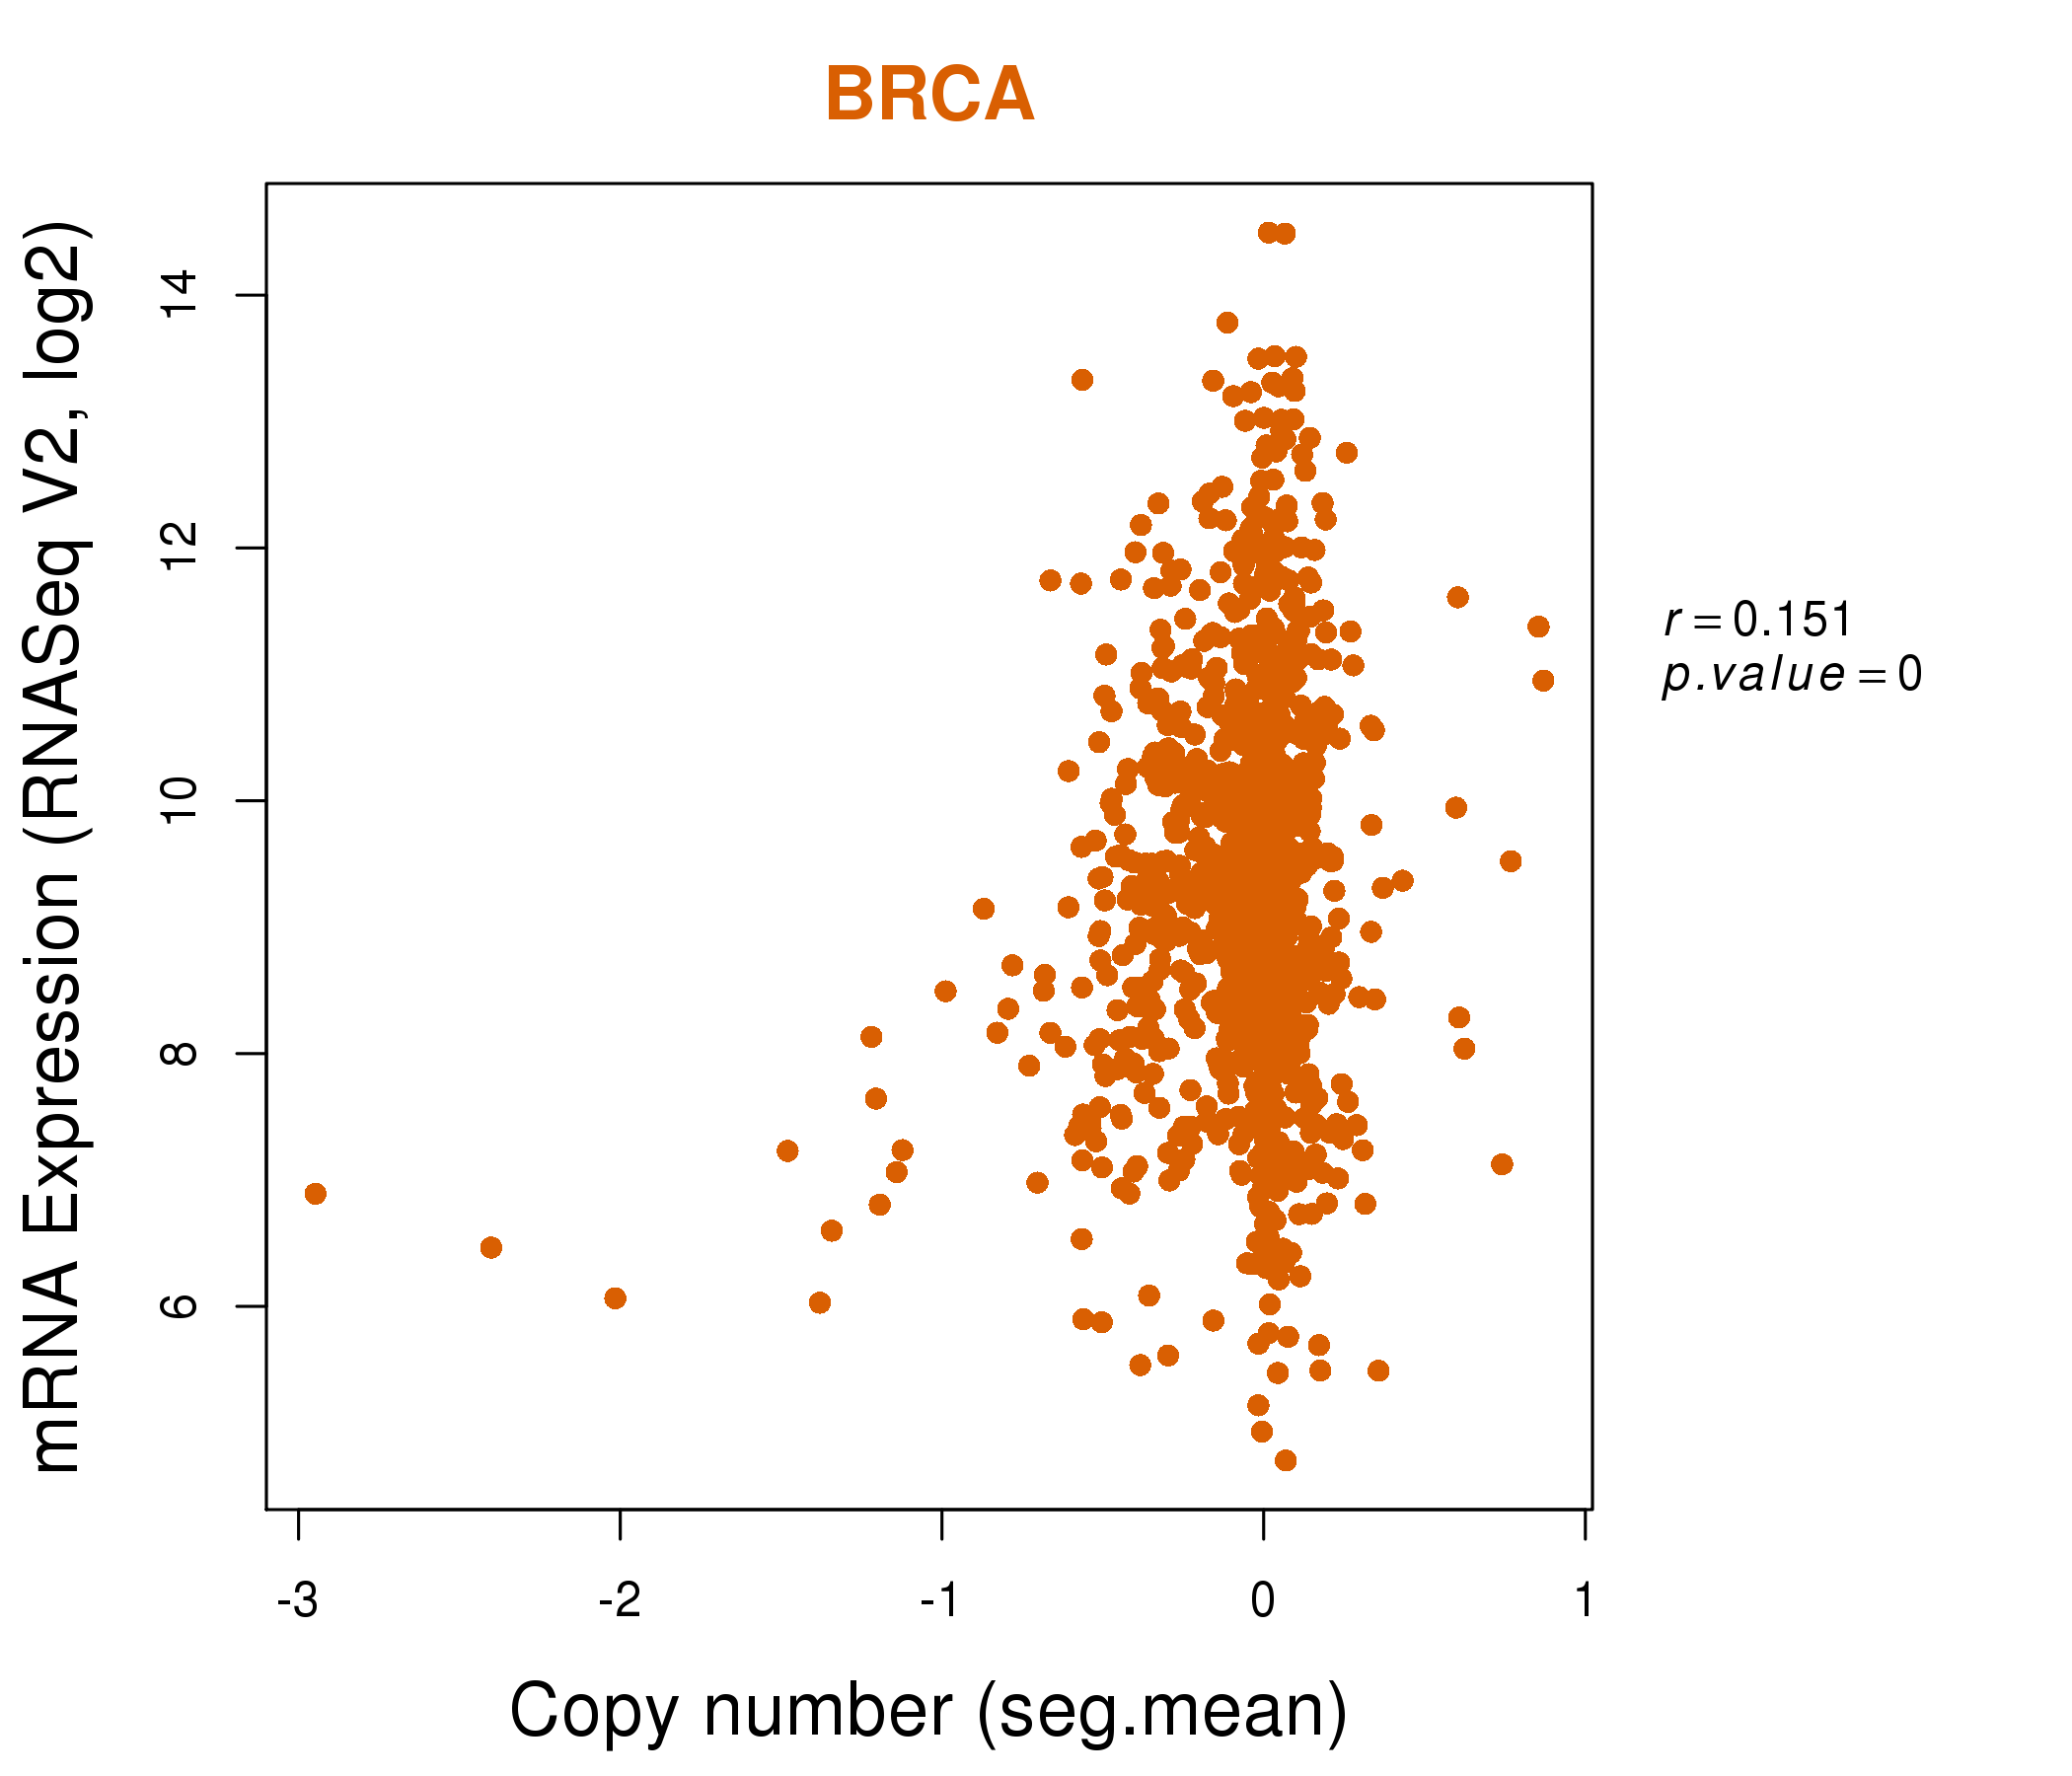
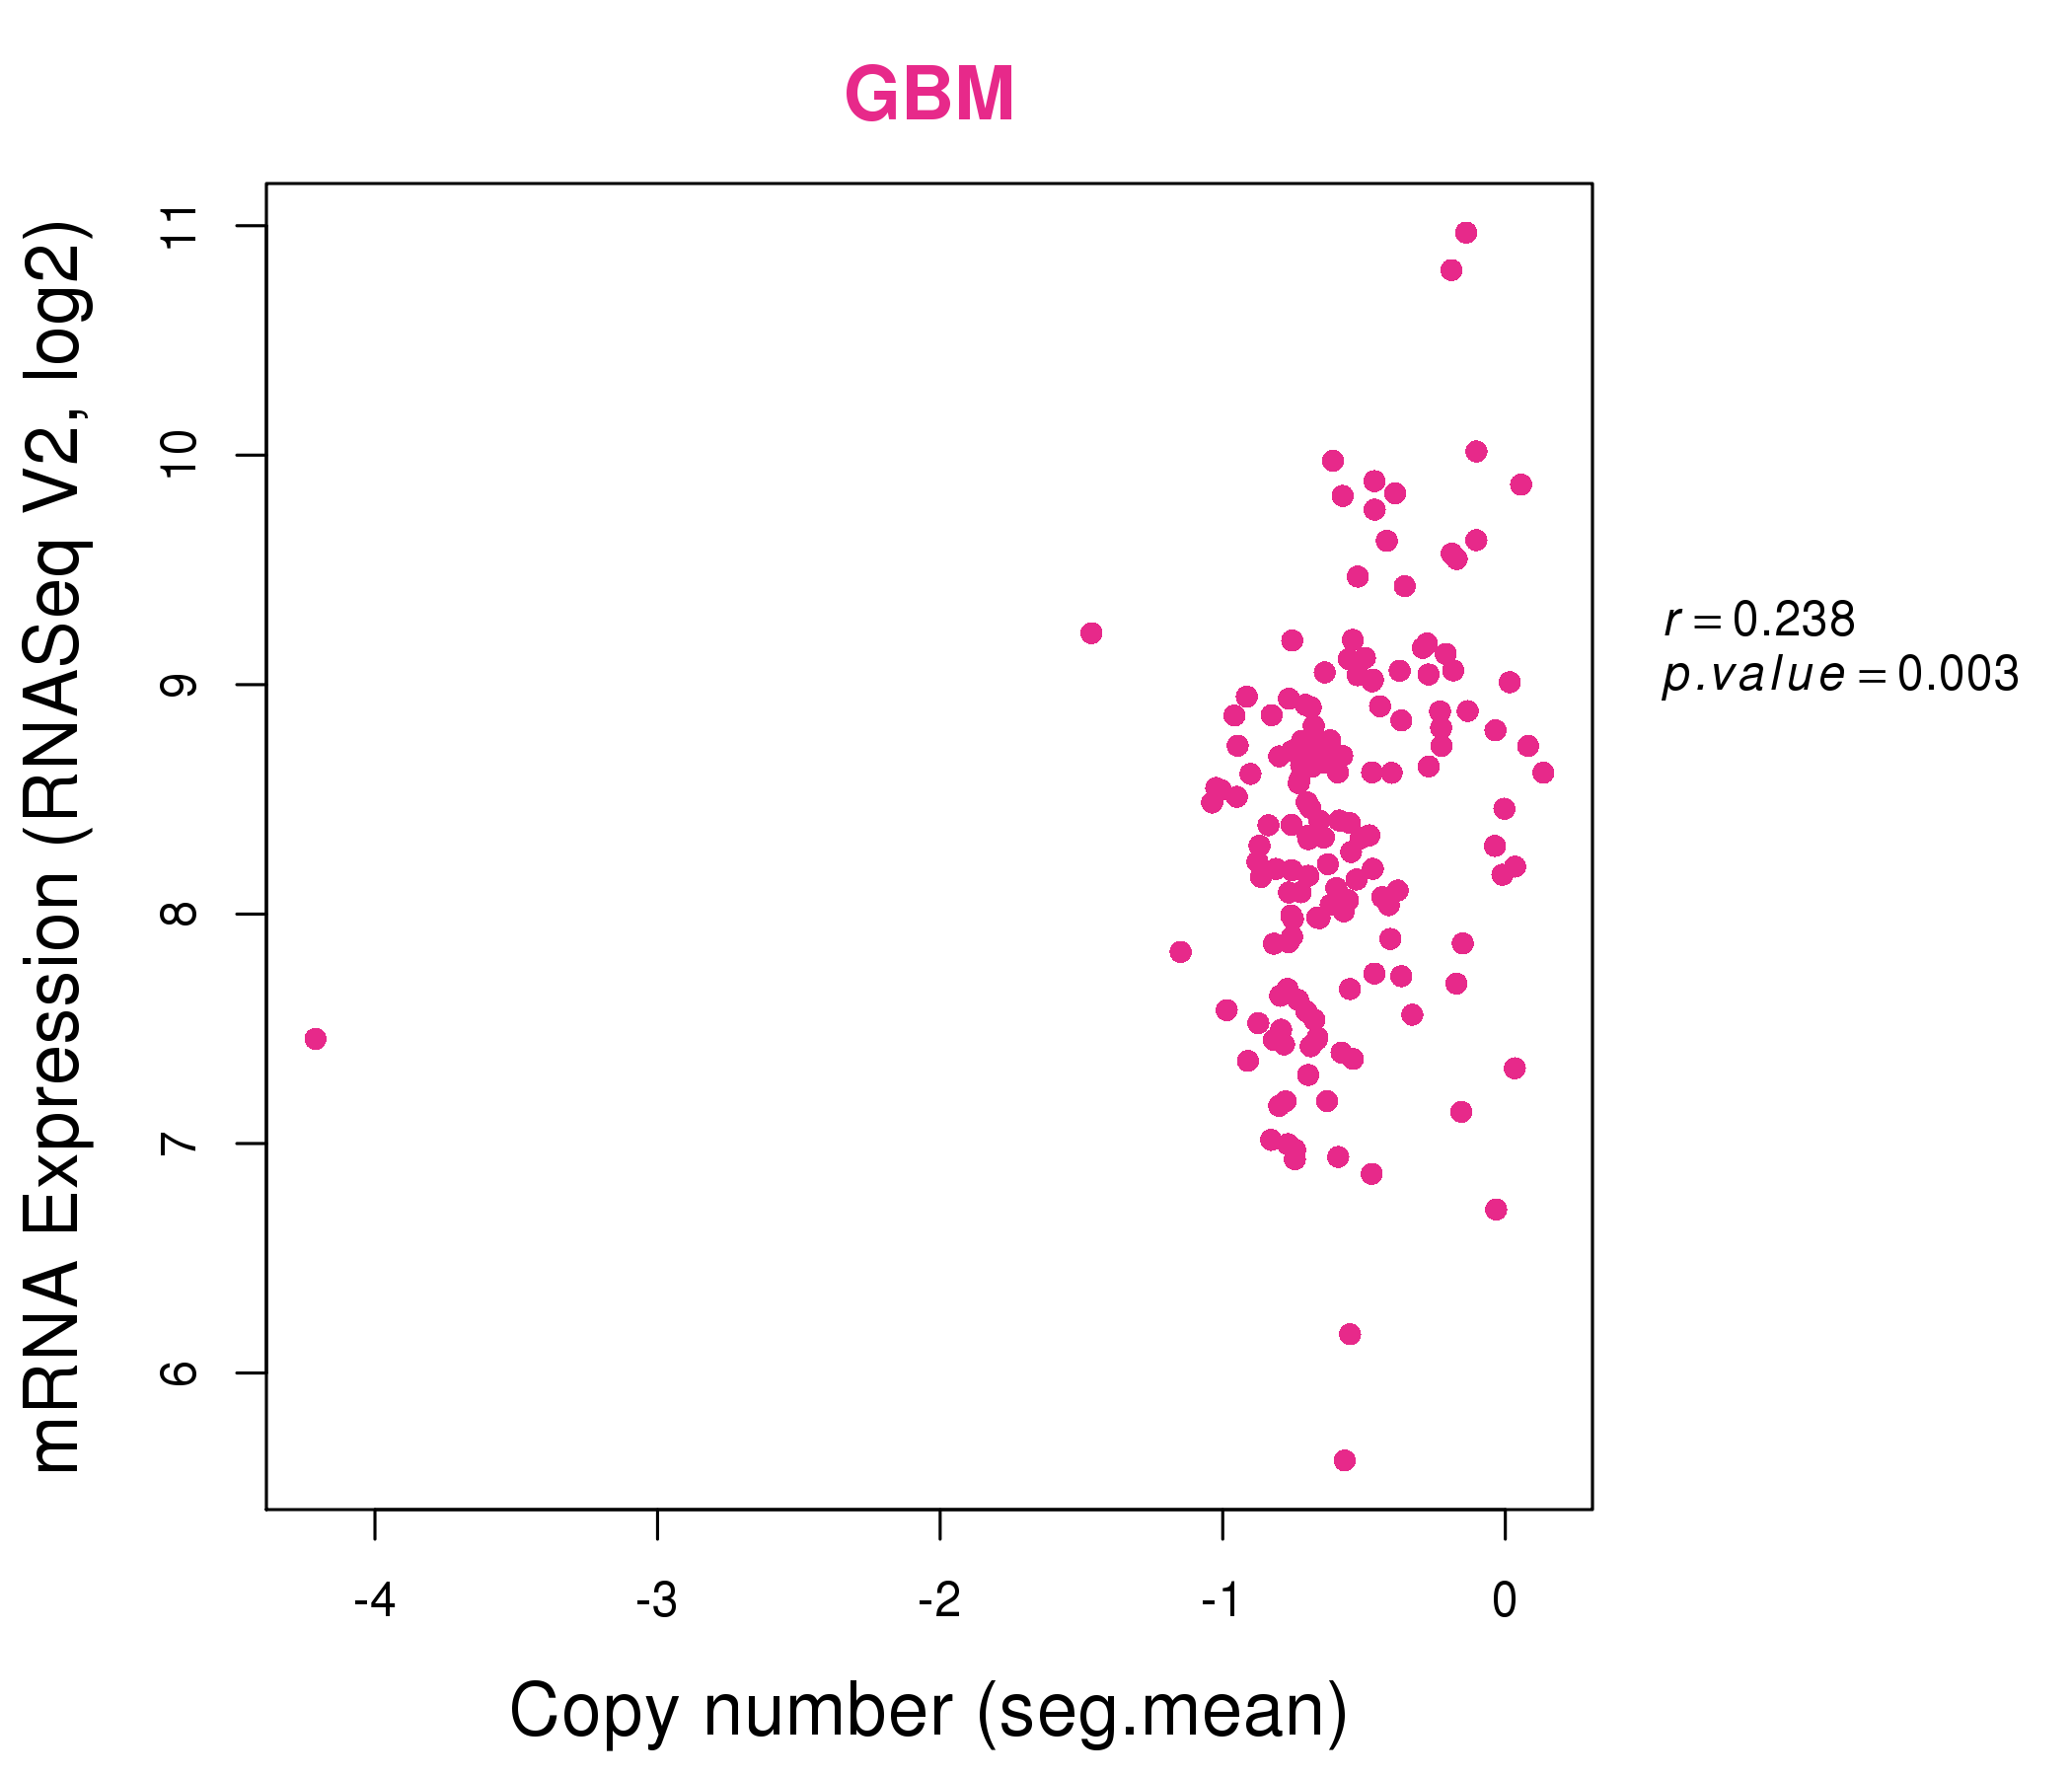
| * Normalized gene expression data of RNASeqV2 was extracted from TCGA using R package TCGA-Assembler. The URLs of all public data files on TCGA DCC data server were gathered at Jan-05-2015. Only eight cancer types have enough normal control samples for differential expression analysis. (t test, adjusted p<0.05 (using Benjamini-Hochberg FDR)) |
 |
| Top |
| * This plots show the correlation between CNV and gene expression. |
: Open all plots for all cancer types
 |
|
 |
|
| Top |
| Gene-Gene Network Information |
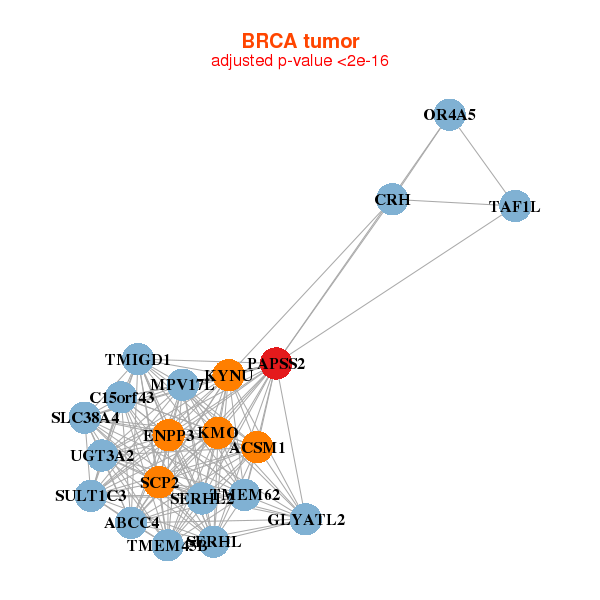
| * Co-Expression network figures were drawn using R package igraph. Only the top 20 genes with the highest correlations were shown. Red circle: input gene, orange circle: cell metabolism gene, sky circle: other gene |
: Open all plots for all cancer types
 |
|
| ABCC4,ACSM1,C15orf43,CRH,ENPP3,GLYATL2,KMO, KYNU,MPV17L,OR4A5,PAPSS2,SCP2,SERHL2,SERHL, SLC38A4,SULT1C3,TAF1L,TMEM45B,TMEM62,TMIGD1,UGT3A2 | ABHD6,ANO10,CCNYL1,CPPED1,CRK,ECM2,FAM173B, FAR2,FBXW2,FITM2,GNS,ME1,NQO1,OSTM1, PAPSS2,PARM1,PBLD,SEC22B,SLC5A3,TSKU,ZDHHC3 |
 |
|
| BCL10,C4orf19,CA12,CASP7,GNAQ,HK2,IQGAP2, ITM2C,LIMA1,NR3C2,PAPSS2,PIGR,RBM47,RNF145, SGMS2,SIAE,STYK1,TC2N,TNFRSF11A,TNFSF13,TSPAN1 | ACOX1,ACSS2,ALAS1,ARF3,ATP1B1,CDH17,CDH1, RHOV___CHP1,CORO2A,CUL3,IQGAP2,PAPSS2,PDCD6IP,PLD1, RAB14,RBM47,SFXN1,SLC22A5,SLC41A2,STK38,UGT1A10 |
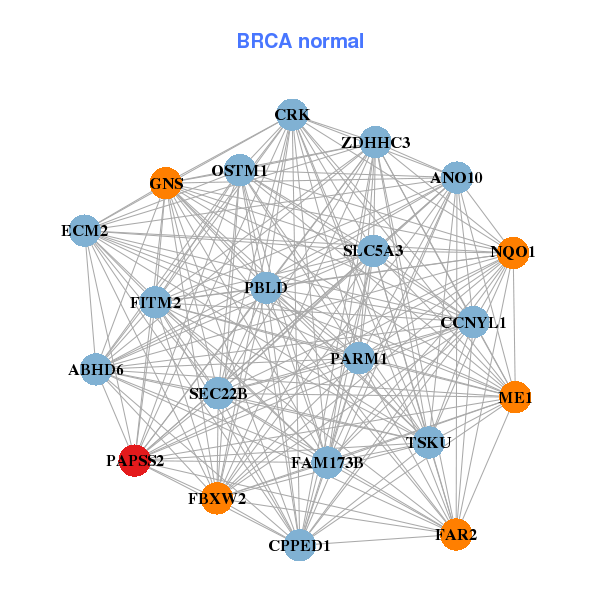
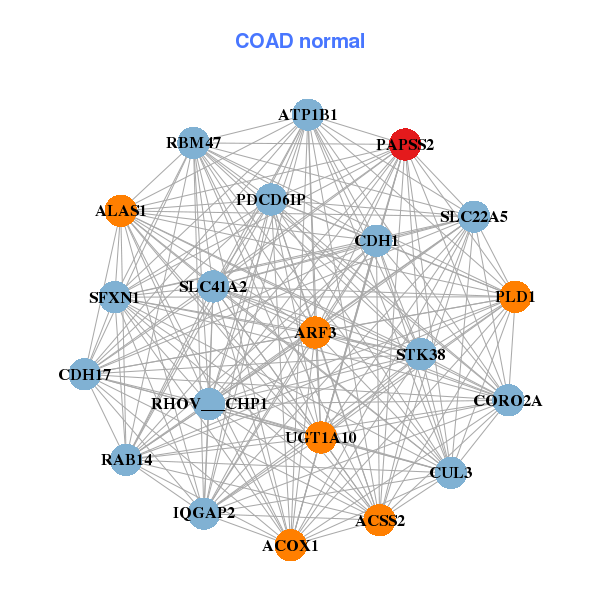
| * Co-Expression network figures were drawn using R package igraph. Only the top 20 genes with the highest correlations were shown. Red circle: input gene, orange circle: cell metabolism gene, sky circle: other gene |
: Open all plots for all cancer types
| Top |
: Open all interacting genes' information including KEGG pathway for all interacting genes from DAVID
| Top |
| Pharmacological Information for PAPSS2 |
| There's no related Drug. |
| Top |
| Cross referenced IDs for PAPSS2 |
| * We obtained these cross-references from Uniprot database. It covers 150 different DBs, 18 categories. http://www.uniprot.org/help/cross_references_section |
: Open all cross reference information
|
Copyright © 2016-Present - The Univsersity of Texas Health Science Center at Houston @ |