|
||||||||||||||||||||||||||||||||||||||||||||||||||||||||||||||||||||||||||||||||||||||||||||||||||||||||||||||||||||||||||||||||||||||||||||||||||||||||||||||||||||||||||||||||||||||||||||||||||||||||||||||||||||||||||||||||||||||||||||||||||||||||||||||||||||||||||||||||||||||||||||||||||||||||||||||||||||||||||
| |
| Phenotypic Information (metabolism pathway, cancer, disease, phenome) |
| |
| |
| Gene-Gene Network Information: Co-Expression Network, Interacting Genes & KEGG |
| |
|


| Gene Summary for MTMR6 |
| Basic gene info. | Gene symbol | MTMR6 |
| Gene name | myotubularin related protein 6 | |
| Synonyms | - | |
| Cytomap | UCSC genome browser: 13q12 | |
| Genomic location | chr13 :25820340-25861704 | |
| Type of gene | protein-coding | |
| RefGenes | NM_004685.3, | |
| Ensembl id | ENSG00000139505 | |
| Description | myotubularin-related protein 6 | |
| Modification date | 20141207 | |
| dbXrefs | MIM : 603561 | |
| HGNC : HGNC | ||
| Ensembl : ENSG00000139505 | ||
| HPRD : 11946 | ||
| Vega : OTTHUMG00000016606 | ||
| Protein | UniProt: go to UniProt's Cross Reference DB Table | |
| Expression | CleanEX: HS_MTMR6 | |
| BioGPS: 9107 | ||
| Gene Expression Atlas: ENSG00000139505 | ||
| The Human Protein Atlas: ENSG00000139505 | ||
| Pathway | NCI Pathway Interaction Database: MTMR6 | |
| KEGG: MTMR6 | ||
| REACTOME: MTMR6 | ||
| ConsensusPathDB | ||
| Pathway Commons: MTMR6 | ||
| Metabolism | MetaCyc: MTMR6 | |
| HUMANCyc: MTMR6 | ||
| Regulation | Ensembl's Regulation: ENSG00000139505 | |
| miRBase: chr13 :25,820,340-25,861,704 | ||
| TargetScan: NM_004685 | ||
| cisRED: ENSG00000139505 | ||
| Context | iHOP: MTMR6 | |
| cancer metabolism search in PubMed: MTMR6 | ||
| UCL Cancer Institute: MTMR6 | ||
| Assigned class in ccmGDB | C | |
| Top |
| Phenotypic Information for MTMR6(metabolism pathway, cancer, disease, phenome) |
| Cancer | CGAP: MTMR6 |
| Familial Cancer Database: MTMR6 | |
| * This gene is included in those cancer gene databases. |
|
|
|
|
|
| . | ||||||||||||||||||||||||||||||||||||||||||||||||||||||||||||||||||||||||||||||||||||||||||||||||||||||||||||||||||||||||||||||||||||||||||||||||||||||||||||||||||||||||||||||||||||||||||||||||||||||||||||||||||||||||||||||||||||||||||||||||||||||||||||||||||||||||||||||||||||||||||||||||||||||||||||||||||||
Oncogene 1 | Significant driver gene in | |||||||||||||||||||||||||||||||||||||||||||||||||||||||||||||||||||||||||||||||||||||||||||||||||||||||||||||||||||||||||||||||||||||||||||||||||||||||||||||||||||||||||||||||||||||||||||||||||||||||||||||||||||||||||||||||||||||||||||||||||||||||||||||||||||||||||||||||||||||||||||||||||||||||||||||||||||||||||
| cf) number; DB name 1 Oncogene; http://nar.oxfordjournals.org/content/35/suppl_1/D721.long, 2 Tumor Suppressor gene; https://bioinfo.uth.edu/TSGene/, 3 Cancer Gene Census; http://www.nature.com/nrc/journal/v4/n3/abs/nrc1299.html, 4 CancerGenes; http://nar.oxfordjournals.org/content/35/suppl_1/D721.long, 5 Network of Cancer Gene; http://ncg.kcl.ac.uk/index.php, 1Therapeutic Vulnerabilities in Cancer; http://cbio.mskcc.org/cancergenomics/statius/ |
| KEGG_FRUCTOSE_AND_MANNOSE_METABOLISM KEGG_RIBOFLAVIN_METABOLISM REACTOME_PHOSPHOLIPID_METABOLISM REACTOME_PI_METABOLISM REACTOME_METABOLISM_OF_LIPIDS_AND_LIPOPROTEINS | |
| OMIM | |
| Orphanet | |
| Disease | KEGG Disease: MTMR6 |
| MedGen: MTMR6 (Human Medical Genetics with Condition) | |
| ClinVar: MTMR6 | |
| Phenotype | MGI: MTMR6 (International Mouse Phenotyping Consortium) |
| PhenomicDB: MTMR6 | |
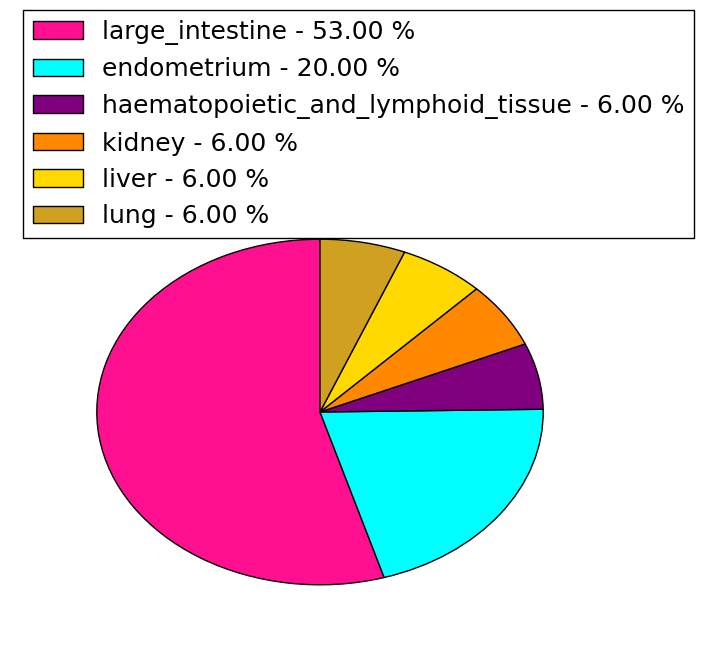
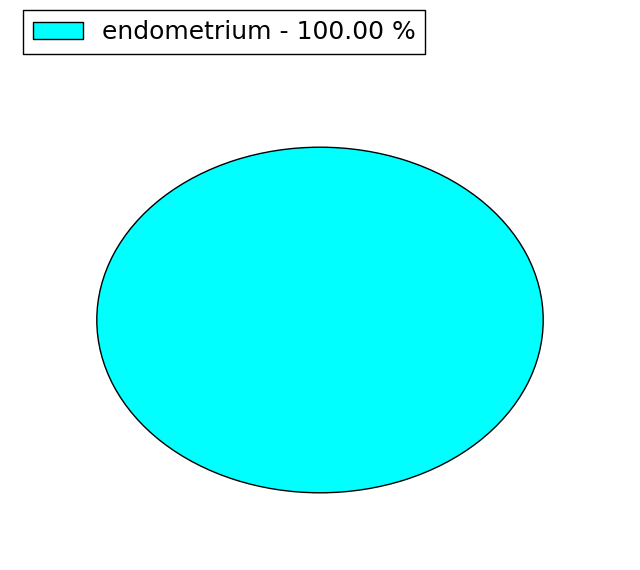
| Mutations for MTMR6 |
| * Under tables are showing count per each tissue to give us broad intuition about tissue specific mutation patterns.You can go to the detailed page for each mutation database's web site. |
| - Statistics for Tissue and Mutation type | Top |
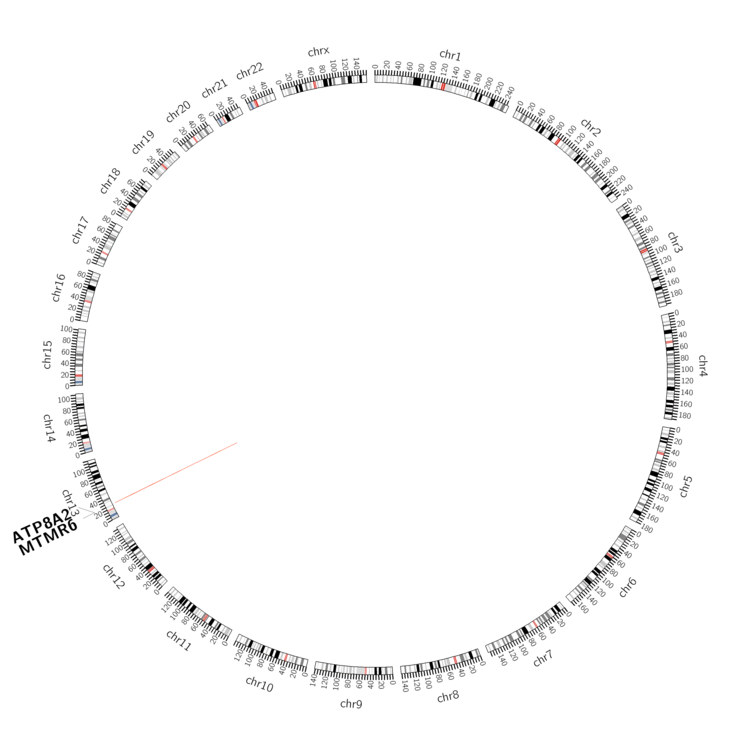 |
| - For Inter-chromosomal Variations |
| There's no inter-chromosomal structural variation. |
| - For Intra-chromosomal Variations |
| * Intra-chromosomal variantions includes 'intrachromosomal amplicon to amplicon', 'intrachromosomal amplicon to non-amplified dna', 'intrachromosomal deletion', 'intrachromosomal fold-back inversion', 'intrachromosomal inversion', 'intrachromosomal tandem duplication', 'Intrachromosomal unknown type', 'intrachromosomal with inverted orientation', 'intrachromosomal with non-inverted orientation'. |
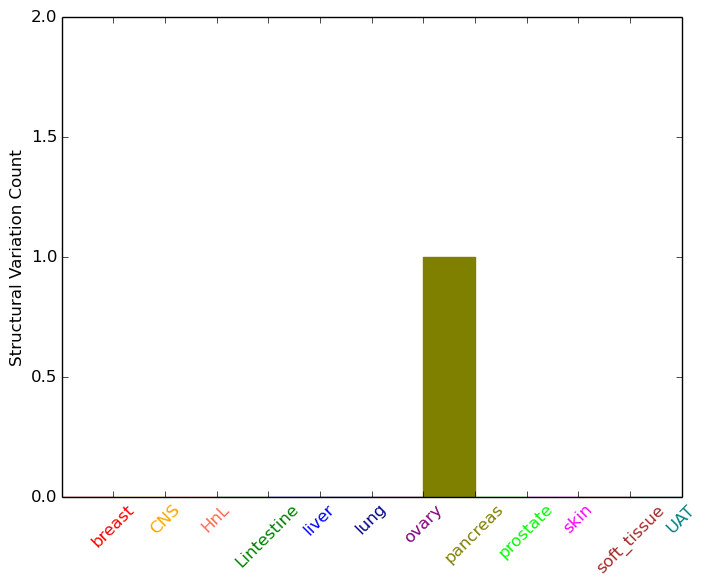 |
| Sample | Symbol_a | Chr_a | Start_a | End_a | Symbol_b | Chr_b | Start_b | End_b |
| pancreas | MTMR6 | chr13 | 25861108 | 25861308 | ATP8A2 | chr13 | 25972079 | 25972279 |
| cf) Tissue number; Tissue name (1;Breast, 2;Central_nervous_system, 3;Haematopoietic_and_lymphoid_tissue, 4;Large_intestine, 5;Liver, 6;Lung, 7;Ovary, 8;Pancreas, 9;Prostate, 10;Skin, 11;Soft_tissue, 12;Upper_aerodigestive_tract) |
| * From mRNA Sanger sequences, Chitars2.0 arranged chimeric transcripts. This table shows MTMR6 related fusion information. |
| ID | Head Gene | Tail Gene | Accession | Gene_a | qStart_a | qEnd_a | Chromosome_a | tStart_a | tEnd_a | Gene_a | qStart_a | qEnd_a | Chromosome_a | tStart_a | tEnd_a |
| BE147849 | RC3H1 | 15 | 231 | 1 | 173913862 | 173914078 | MTMR6 | 226 | 322 | 13 | 25852367 | 25852463 | |
| Top |
| Mutation type/ Tissue ID | brca | cns | cerv | endome | haematopo | kidn | Lintest | liver | lung | ns | ovary | pancre | prost | skin | stoma | thyro | urina | |||
| Total # sample | 1 | |||||||||||||||||||
| GAIN (# sample) | 1 | |||||||||||||||||||
| LOSS (# sample) |
| cf) Tissue ID; Tissue type (1; Breast, 2; Central_nervous_system, 3; Cervix, 4; Endometrium, 5; Haematopoietic_and_lymphoid_tissue, 6; Kidney, 7; Large_intestine, 8; Liver, 9; Lung, 10; NS, 11; Ovary, 12; Pancreas, 13; Prostate, 14; Skin, 15; Stomach, 16; Thyroid, 17; Urinary_tract) |
| Top |
|
 |
| Top |
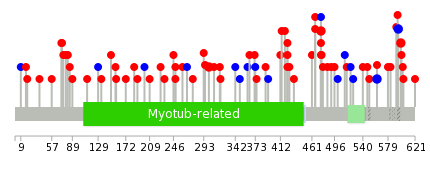
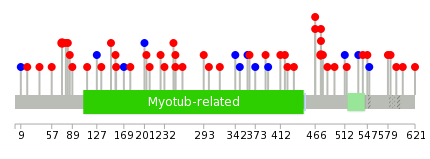
| Stat. for Non-Synonymous SNVs (# total SNVs=51) | (# total SNVs=15) |
 |  |
(# total SNVs=1) | (# total SNVs=0) |
 |
| Top |
| * When you move the cursor on each content, you can see more deailed mutation information on the Tooltip. Those are primary_site,primary_histology,mutation(aa),pubmedID. |
| GRCh37 position | Mutation(aa) | Unique sampleID count |
| chr13:25826045-25826045 | p.S475F | 3 |
| chr13:25823550-25823550 | p.P562P | 2 |
| chr13:25831942-25831942 | p.G301S | 2 |
| chr13:25827981-25827981 | p.L423F | 2 |
| chr13:25823441-25823441 | p.A599T | 2 |
| chr13:25823451-25823451 | p.Y595Y | 2 |
| chr13:25825882-25825882 | p.R504* | 1 |
| chr13:25831922-25831922 | p.W307* | 1 |
| chr13:25842050-25842050 | p.E57D | 1 |
| chr13:25826072-25826072 | p.K466T | 1 |
| Top |
|
 |
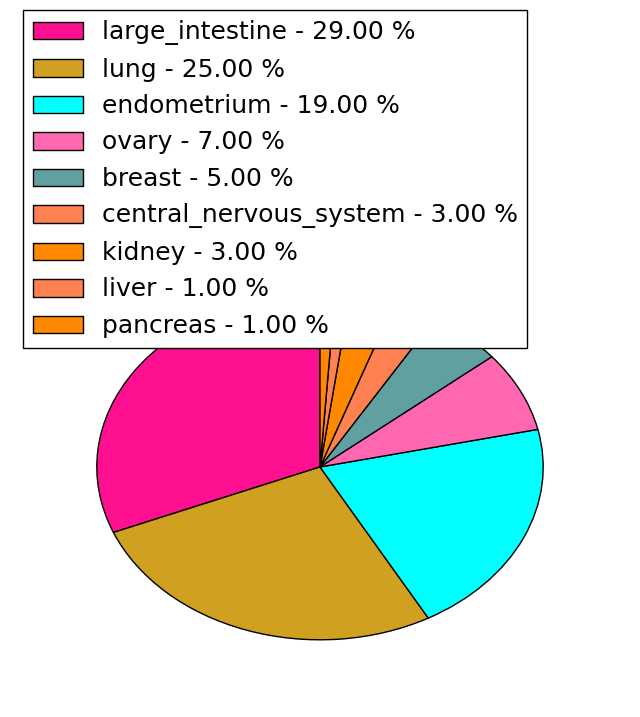
| Point Mutation/ Tissue ID | 1 | 2 | 3 | 4 | 5 | 6 | 7 | 8 | 9 | 10 | 11 | 12 | 13 | 14 | 15 | 16 | 17 | 18 | 19 | 20 |
| # sample | 4 | 2 | 14 | 2 | 2 | 1 | 8 | 6 | 3 | 2 | 4 | 10 | ||||||||
| # mutation | 4 | 2 | 14 | 3 | 2 | 1 | 8 | 6 | 3 | 2 | 4 | 11 | ||||||||
| nonsynonymous SNV | 4 | 2 | 11 | 1 | 1 | 7 | 5 | 3 | 2 | 4 | 8 | |||||||||
| synonymous SNV | 3 | 2 | 1 | 1 | 1 | 1 | 3 |
| cf) Tissue ID; Tissue type (1; BLCA[Bladder Urothelial Carcinoma], 2; BRCA[Breast invasive carcinoma], 3; CESC[Cervical squamous cell carcinoma and endocervical adenocarcinoma], 4; COAD[Colon adenocarcinoma], 5; GBM[Glioblastoma multiforme], 6; Glioma Low Grade, 7; HNSC[Head and Neck squamous cell carcinoma], 8; KICH[Kidney Chromophobe], 9; KIRC[Kidney renal clear cell carcinoma], 10; KIRP[Kidney renal papillary cell carcinoma], 11; LAML[Acute Myeloid Leukemia], 12; LUAD[Lung adenocarcinoma], 13; LUSC[Lung squamous cell carcinoma], 14; OV[Ovarian serous cystadenocarcinoma ], 15; PAAD[Pancreatic adenocarcinoma], 16; PRAD[Prostate adenocarcinoma], 17; SKCM[Skin Cutaneous Melanoma], 18:STAD[Stomach adenocarcinoma], 19:THCA[Thyroid carcinoma], 20:UCEC[Uterine Corpus Endometrial Carcinoma]) |
| Top |
| * We represented just top 10 SNVs. When you move the cursor on each content, you can see more deailed mutation information on the Tooltip. Those are primary_site, primary_histology, mutation(aa), pubmedID. |
| Genomic Position | Mutation(aa) | Unique sampleID count |
| chr13:25826045 | p.S475Y | 3 |
| chr13:25842002 | p.K73N | 2 |
| chr13:25827992 | p.H478Y | 1 |
| chr13:25841985 | p.A318V | 1 |
| chr13:25831966 | p.A149T | 1 |
| chr13:25825856 | p.G301S | 1 |
| chr13:25840041 | p.Y134C | 1 |
| chr13:25828013 | p.S475P | 1 |
| chr13:25832777 | p.L293F | 1 |
| chr13:25823374 | p.L127L | 1 |
| * Copy number data were extracted from TCGA using R package TCGA-Assembler. The URLs of all public data files on TCGA DCC data server were gathered on Jan-05-2015. Function ProcessCNAData in TCGA-Assembler package was used to obtain gene-level copy number value which is calculated as the average copy number of the genomic region of a gene. |
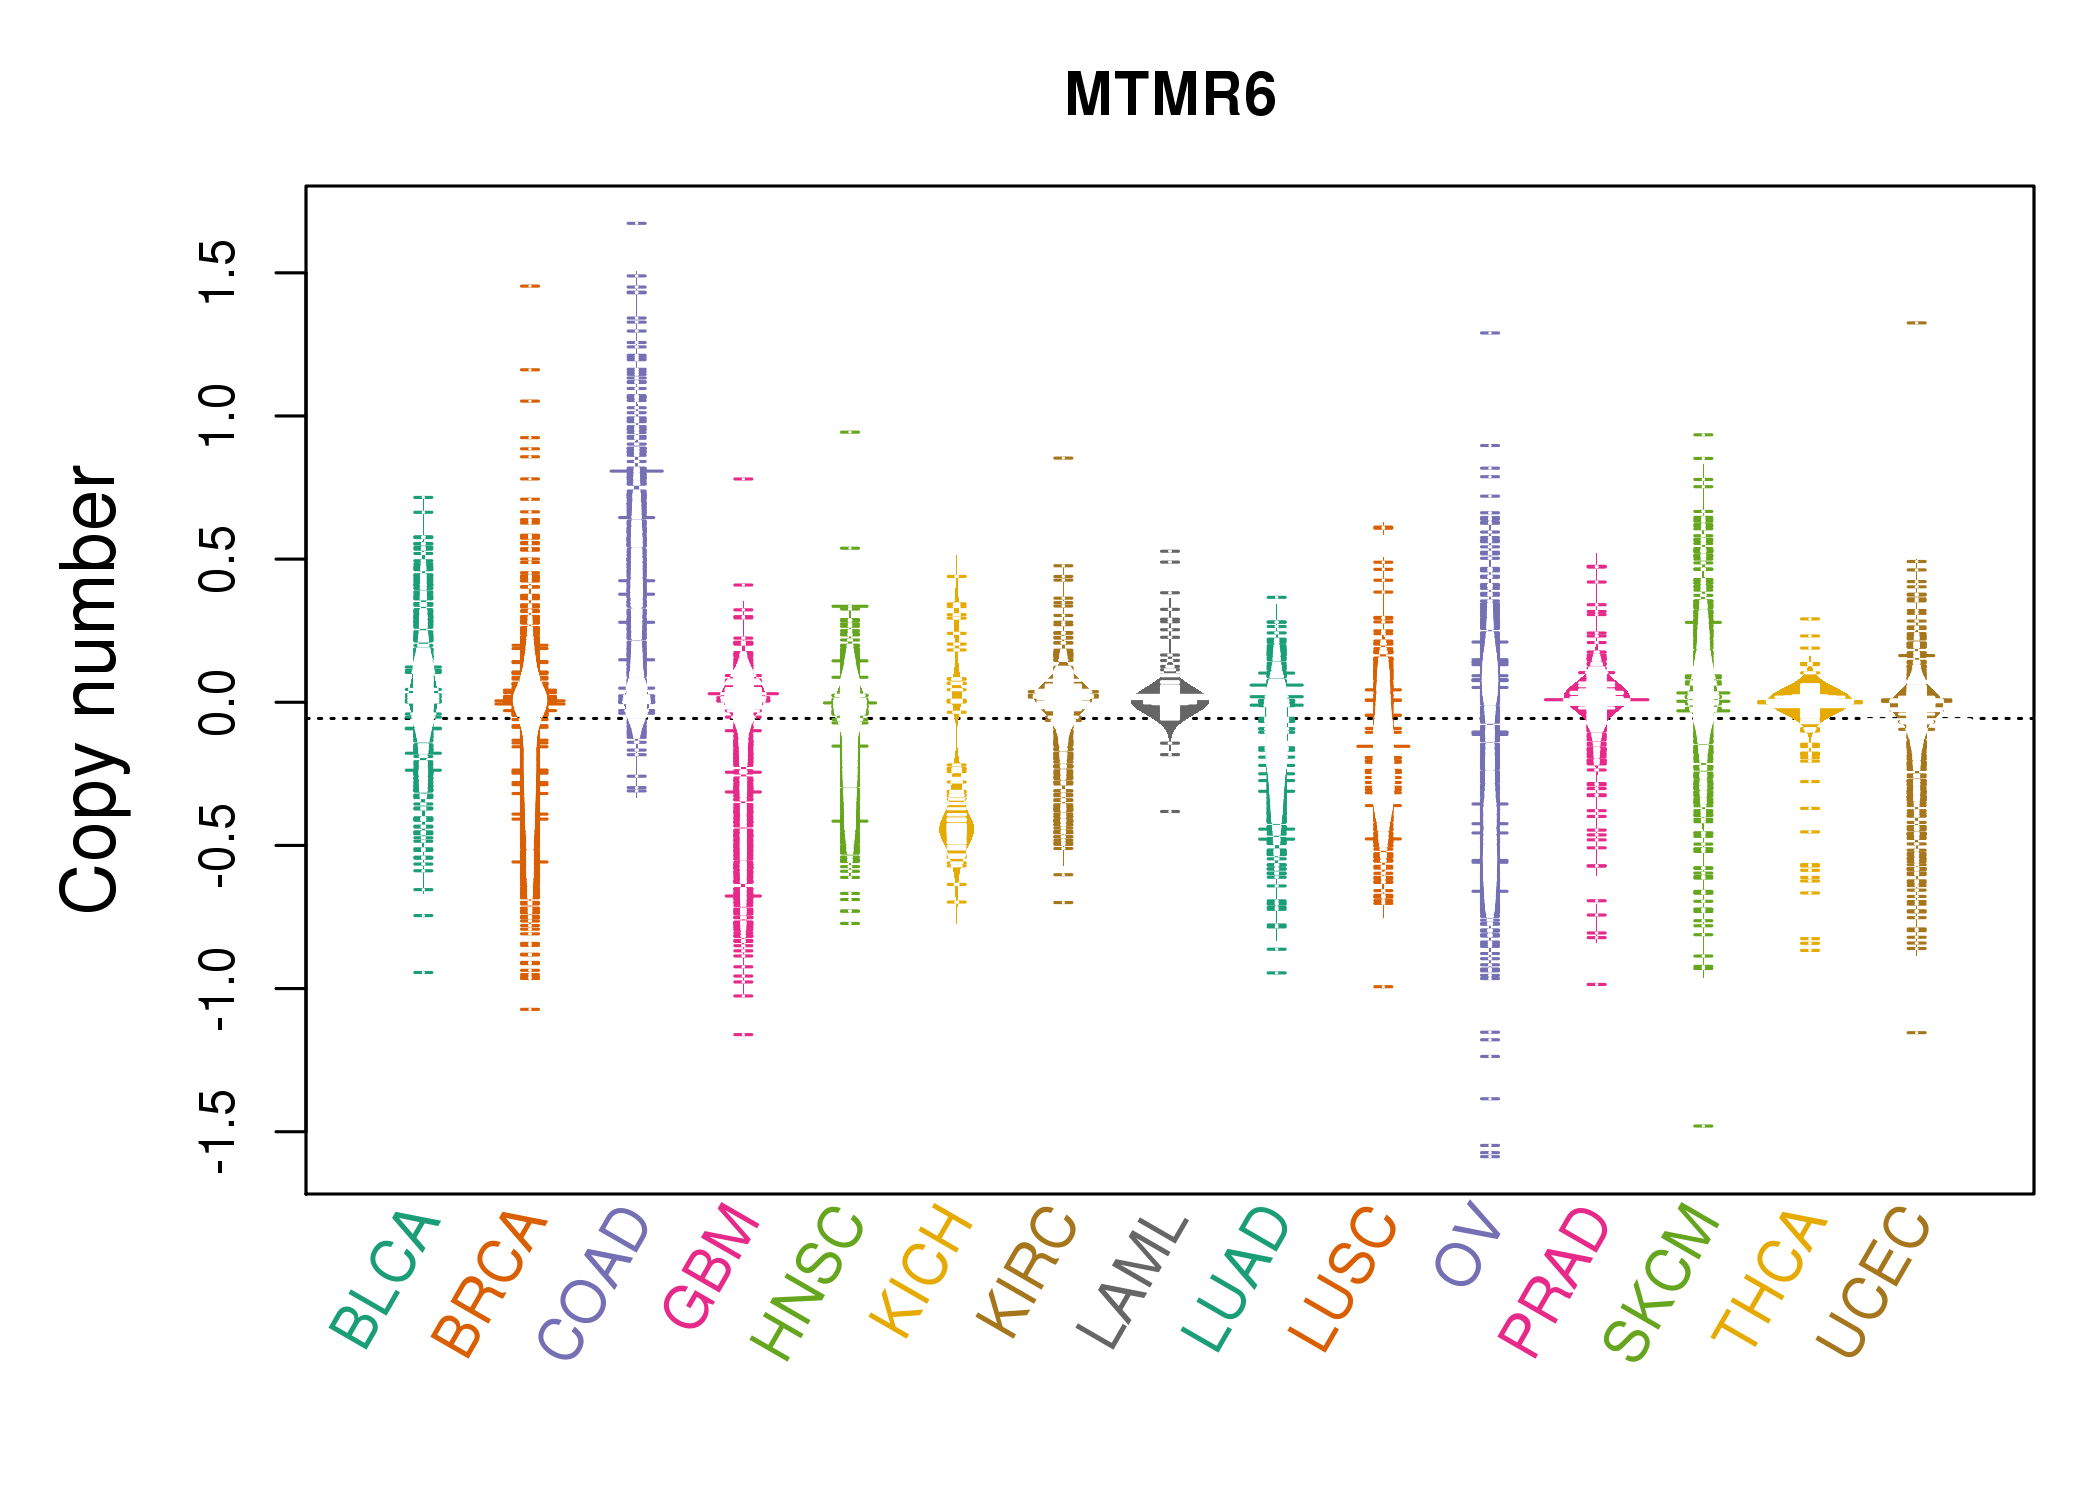 |
| cf) Tissue ID[Tissue type]: BLCA[Bladder Urothelial Carcinoma], BRCA[Breast invasive carcinoma], CESC[Cervical squamous cell carcinoma and endocervical adenocarcinoma], COAD[Colon adenocarcinoma], GBM[Glioblastoma multiforme], Glioma Low Grade, HNSC[Head and Neck squamous cell carcinoma], KICH[Kidney Chromophobe], KIRC[Kidney renal clear cell carcinoma], KIRP[Kidney renal papillary cell carcinoma], LAML[Acute Myeloid Leukemia], LUAD[Lung adenocarcinoma], LUSC[Lung squamous cell carcinoma], OV[Ovarian serous cystadenocarcinoma ], PAAD[Pancreatic adenocarcinoma], PRAD[Prostate adenocarcinoma], SKCM[Skin Cutaneous Melanoma], STAD[Stomach adenocarcinoma], THCA[Thyroid carcinoma], UCEC[Uterine Corpus Endometrial Carcinoma] |
| Top |
| Gene Expression for MTMR6 |
| * CCLE gene expression data were extracted from CCLE_Expression_Entrez_2012-10-18.res: Gene-centric RMA-normalized mRNA expression data. |
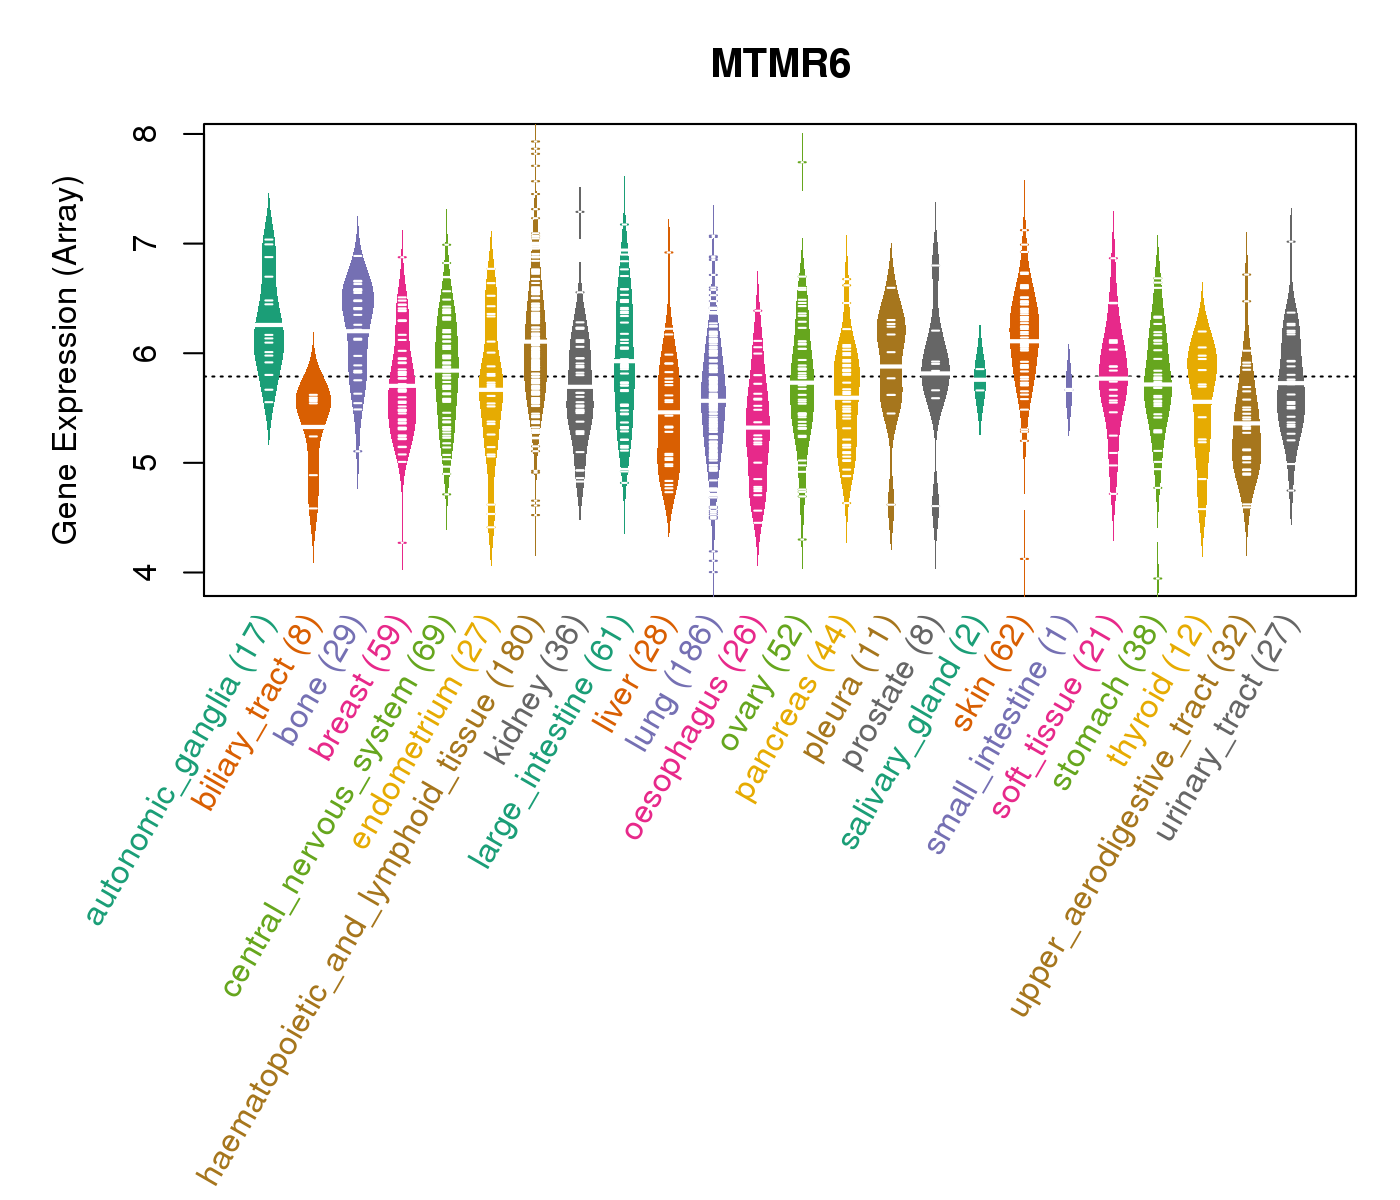 |
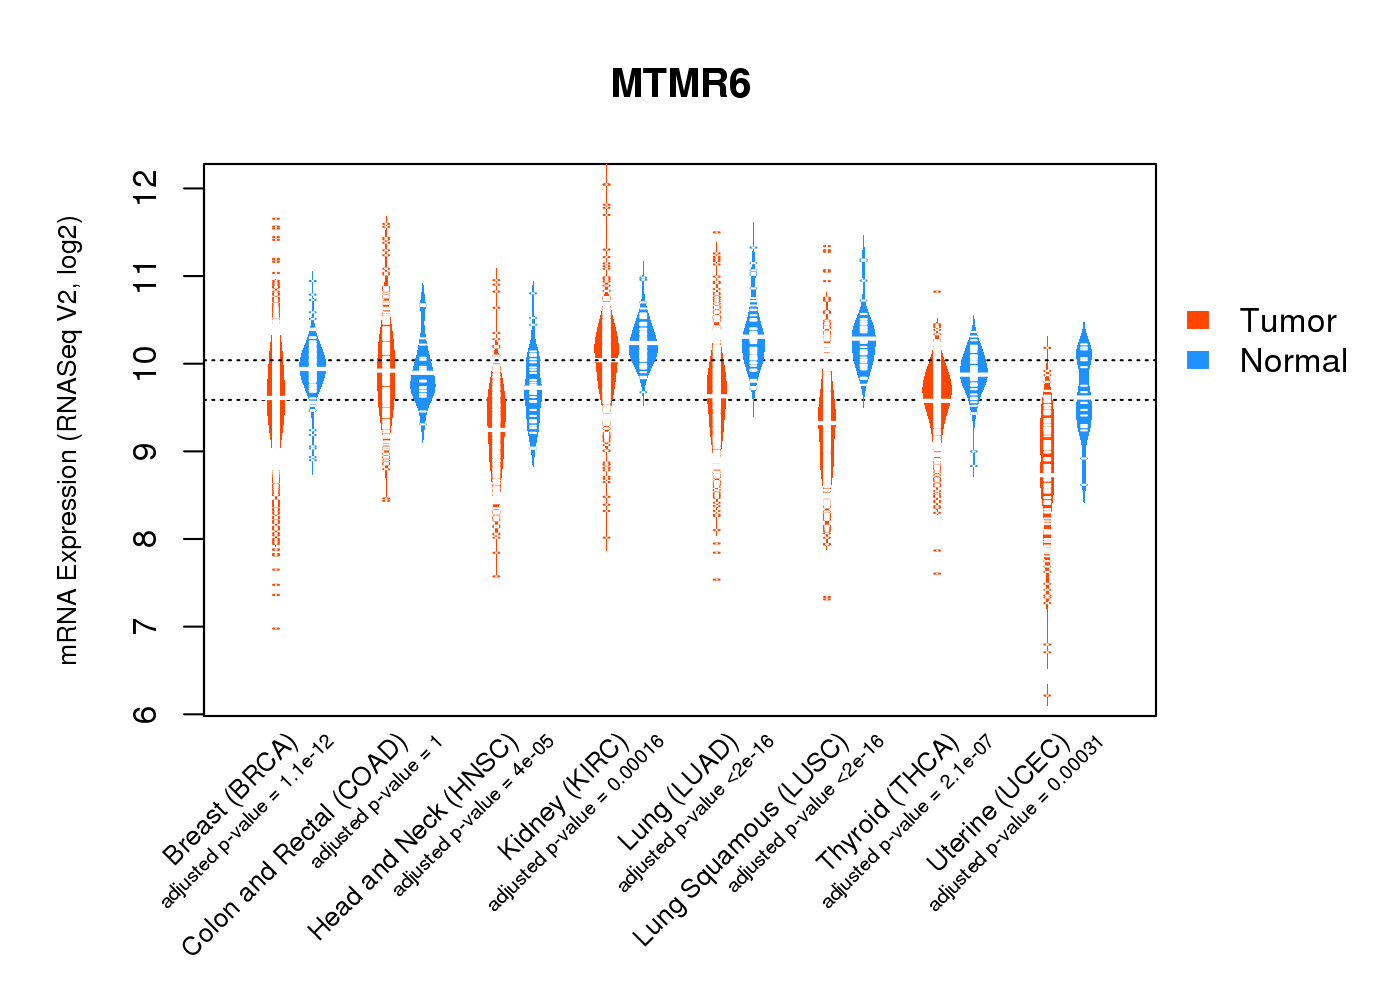
| * Normalized gene expression data of RNASeqV2 was extracted from TCGA using R package TCGA-Assembler. The URLs of all public data files on TCGA DCC data server were gathered at Jan-05-2015. Only eight cancer types have enough normal control samples for differential expression analysis. (t test, adjusted p<0.05 (using Benjamini-Hochberg FDR)) |
 |
| Top |
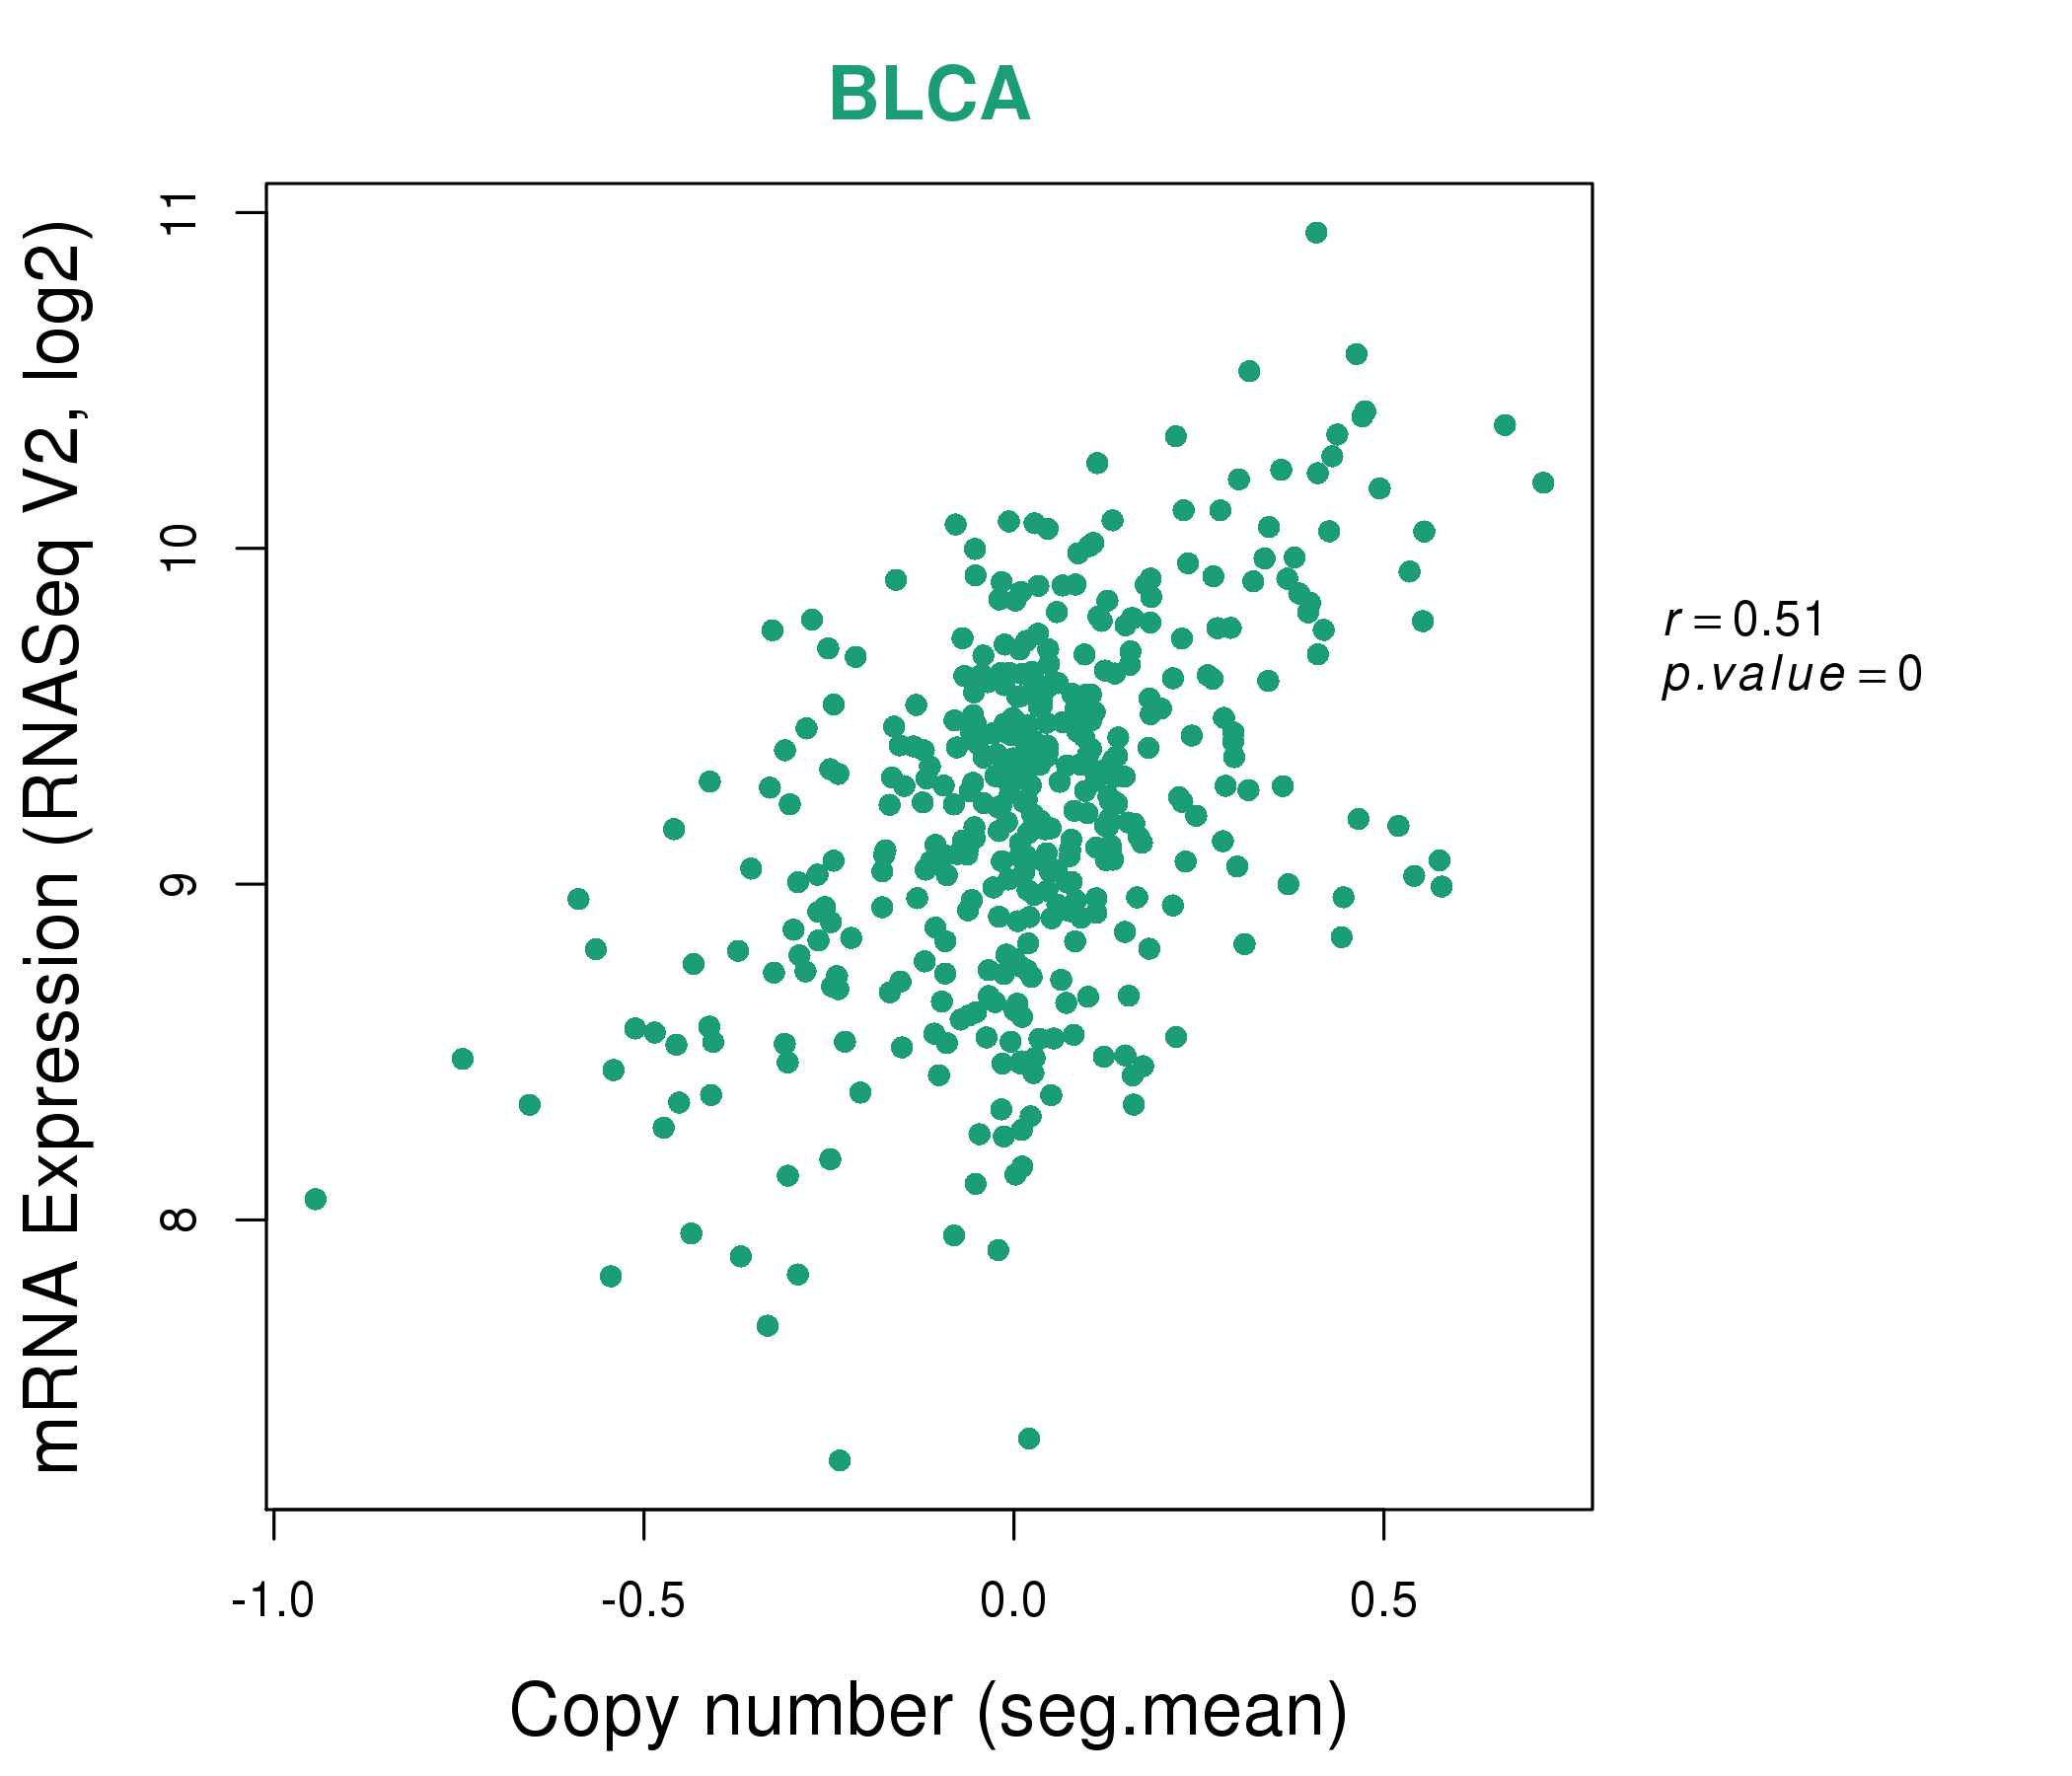
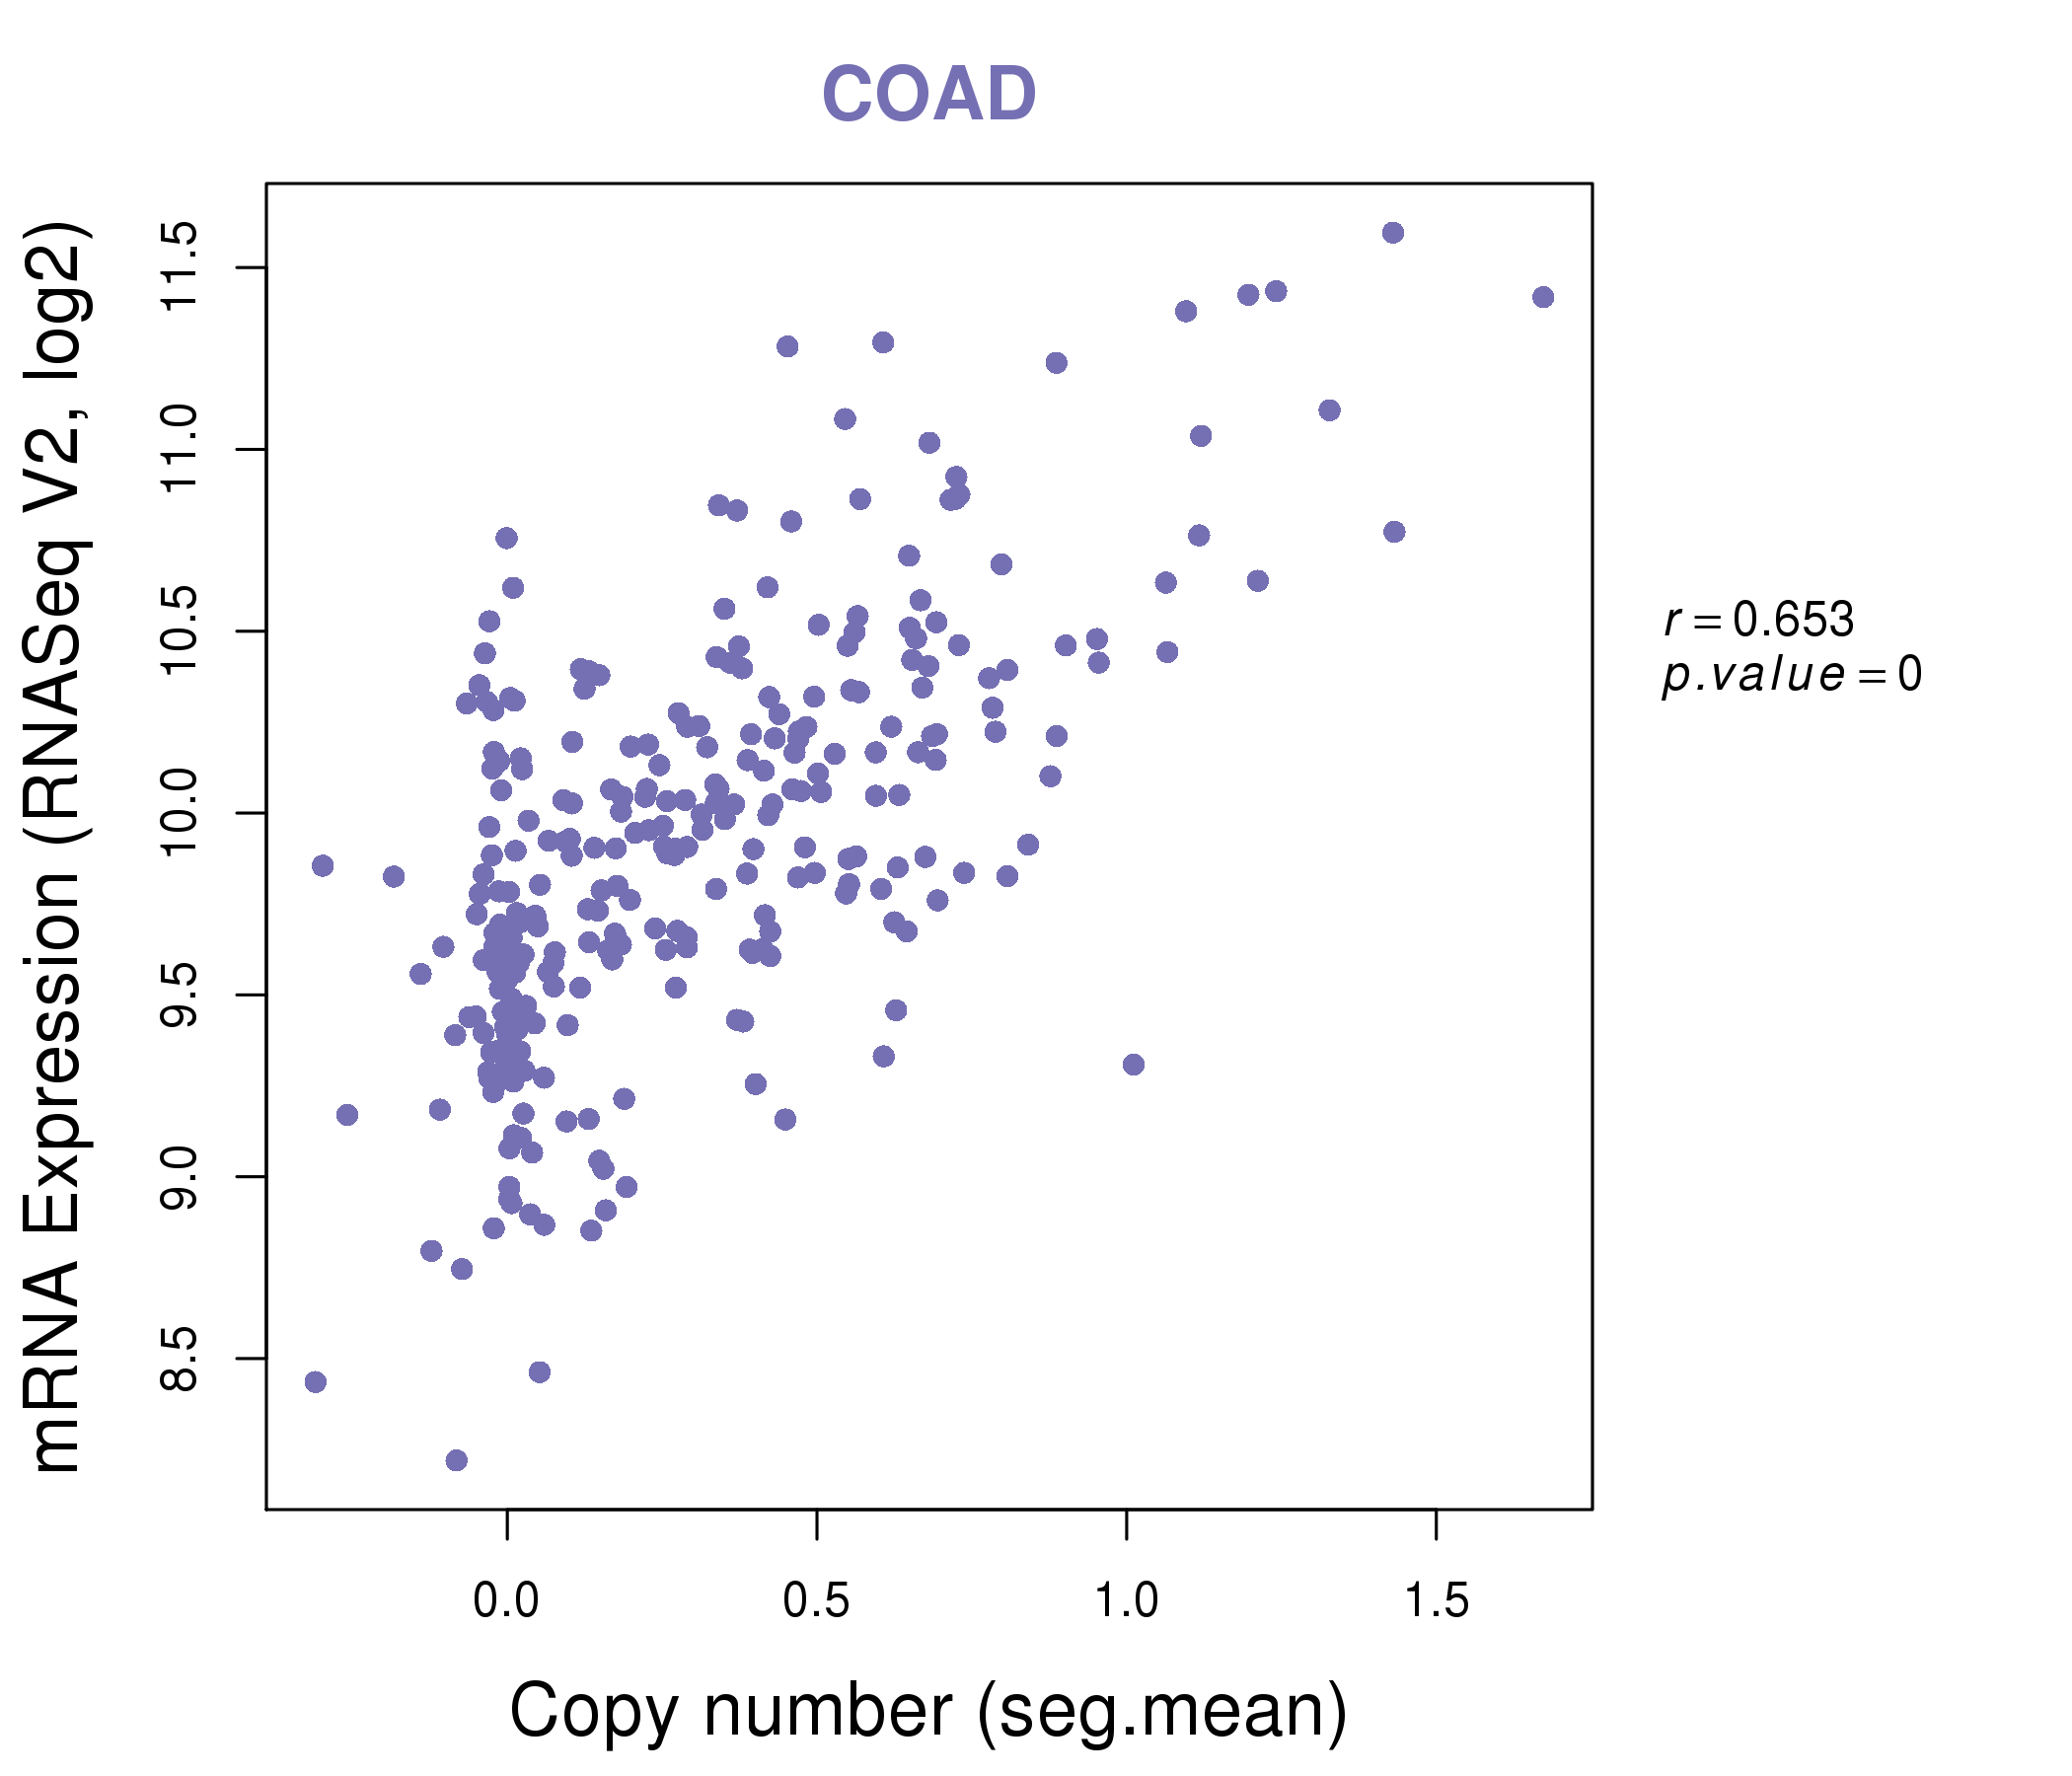
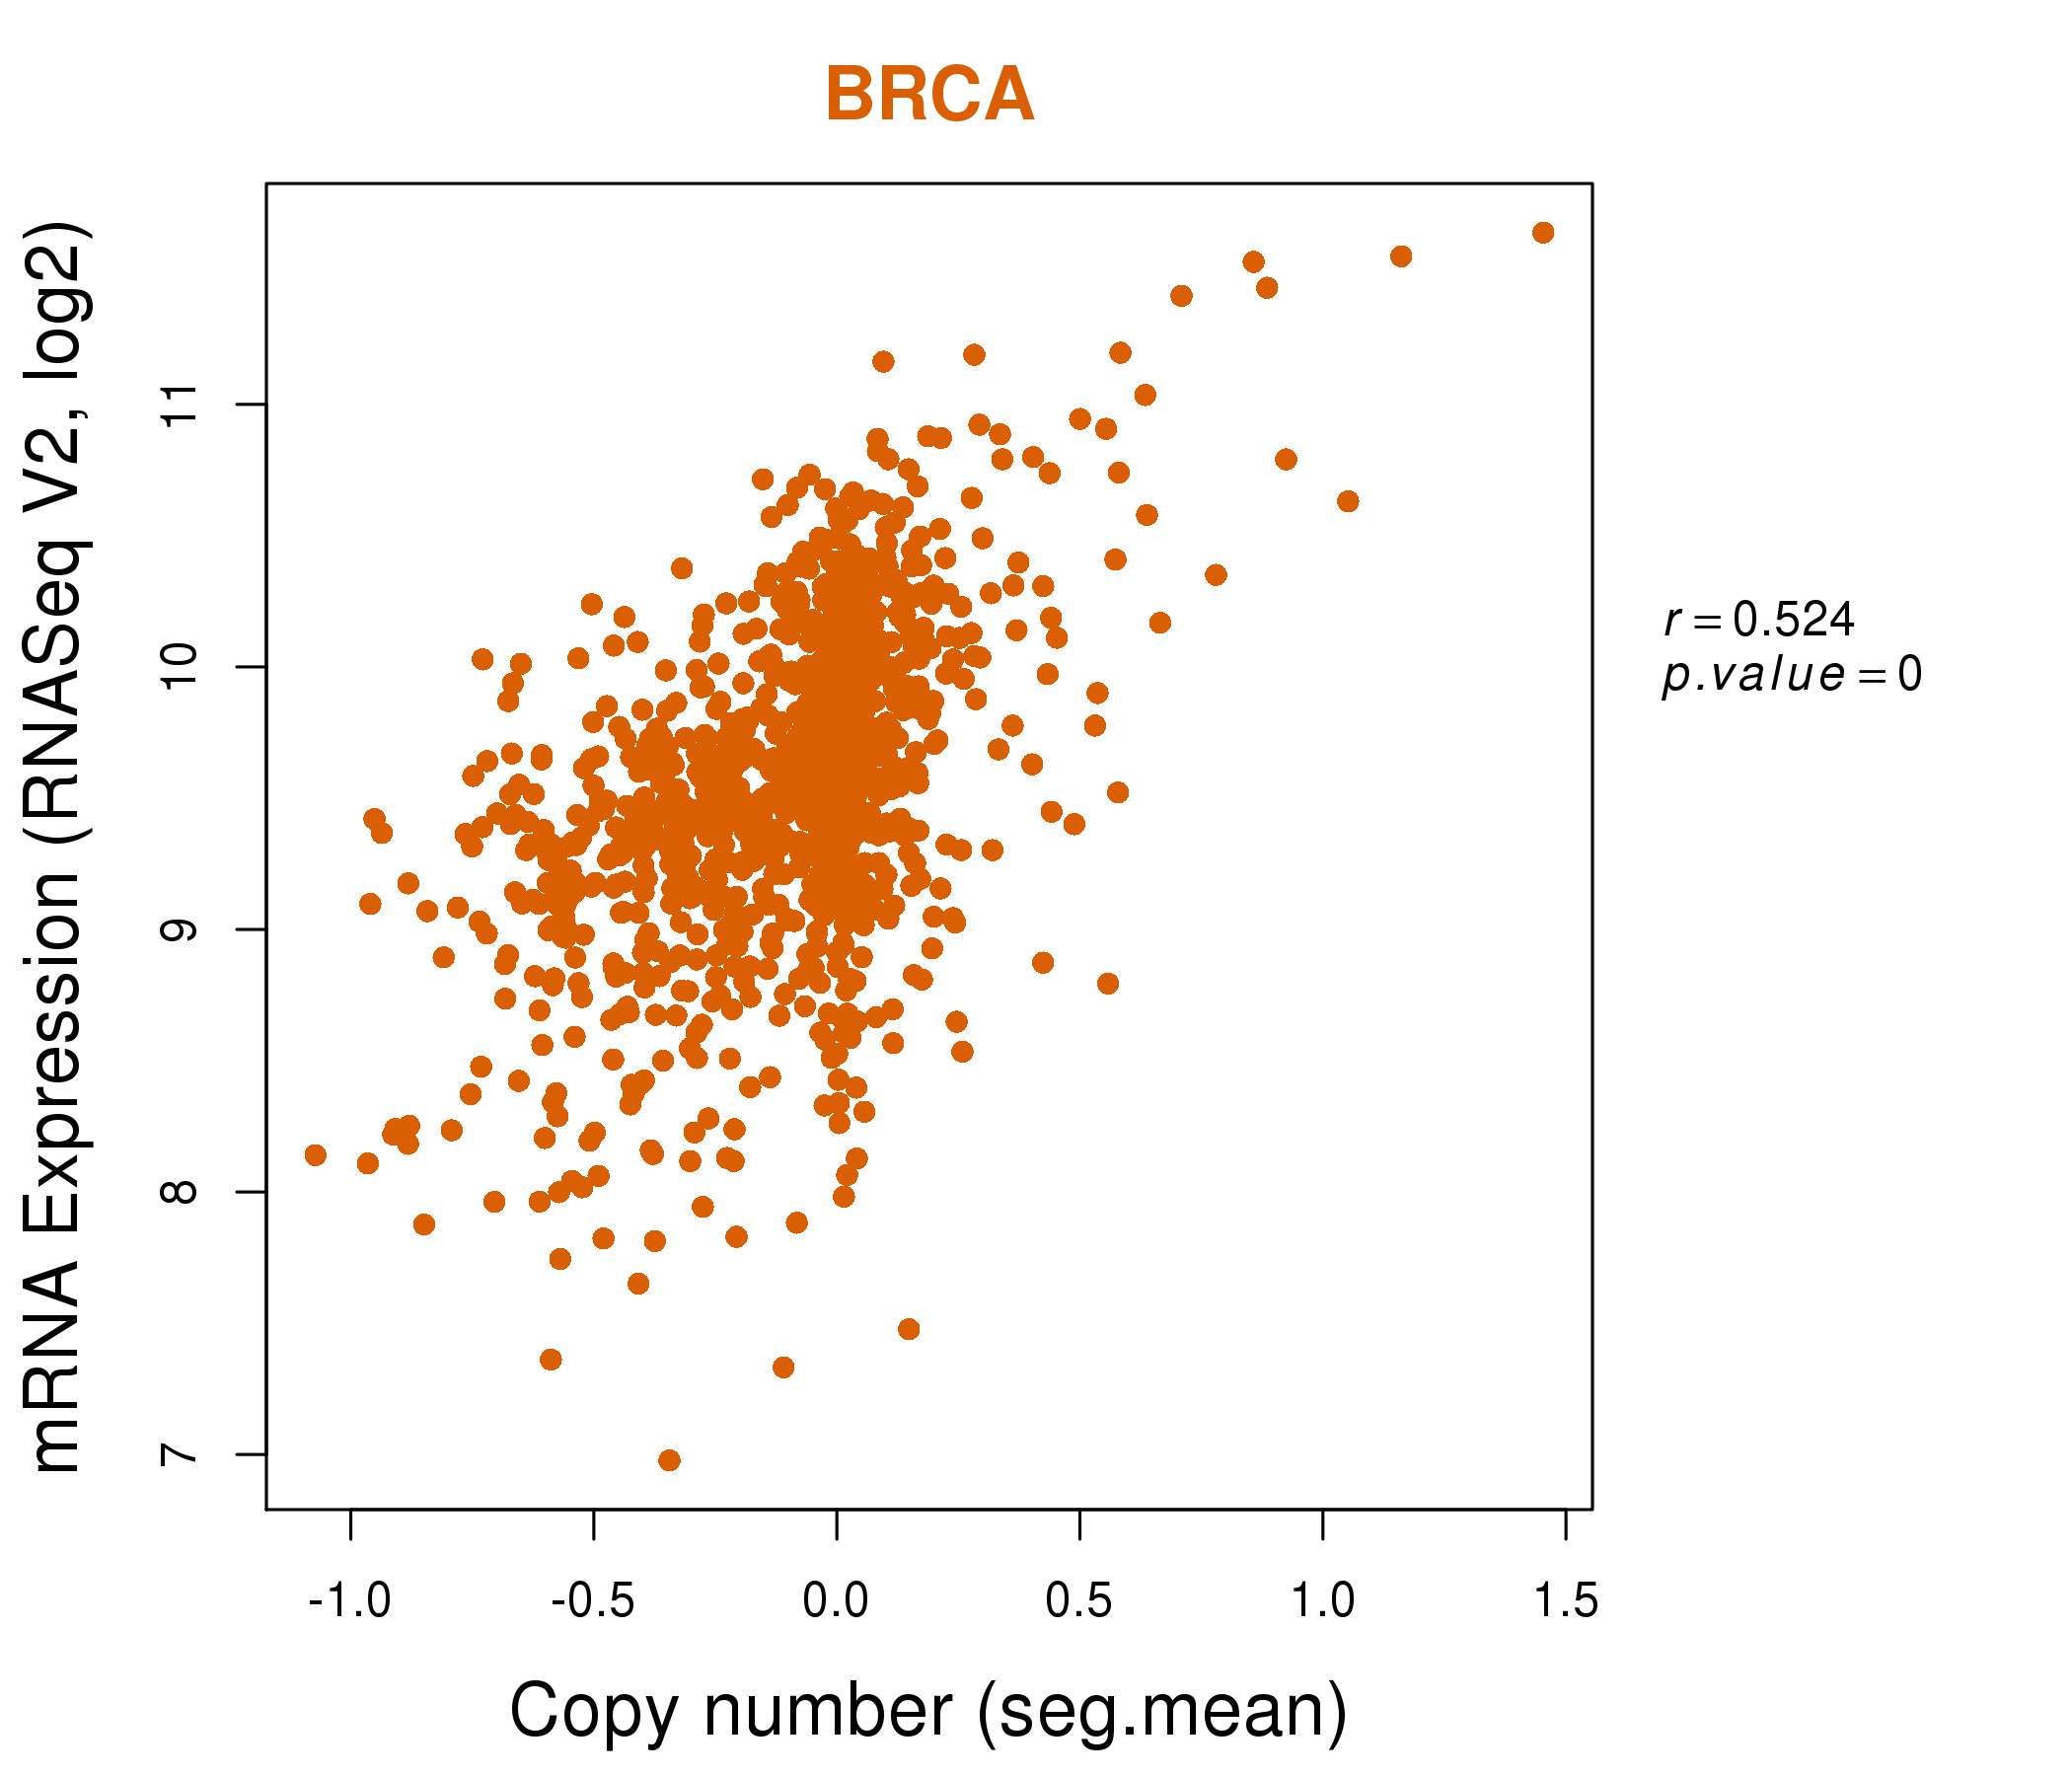
| * This plots show the correlation between CNV and gene expression. |
: Open all plots for all cancer types
 |
|
 |
|

| Top |
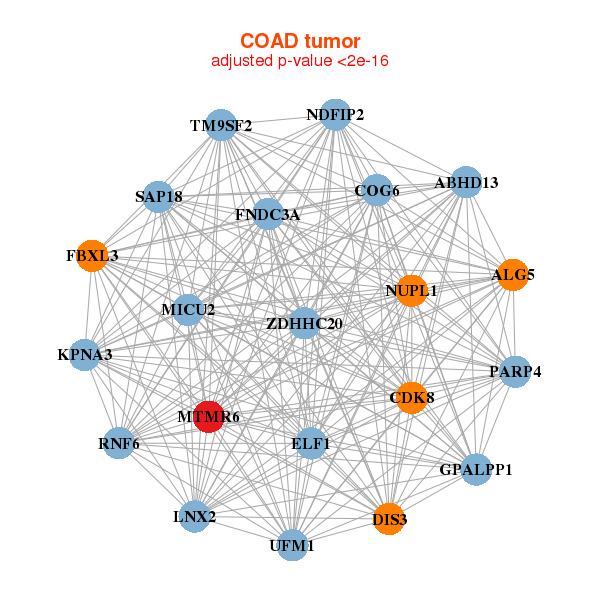
| Gene-Gene Network Information |
| * Co-Expression network figures were drawn using R package igraph. Only the top 20 genes with the highest correlations were shown. Red circle: input gene, orange circle: cell metabolism gene, sky circle: other gene |
: Open all plots for all cancer types
 |
|
| ABHD13,AKAP11,COG6,DIS3,KBTBD7,GPALPP1,LNX2, MPHOSPH8,MTMR6,NDFIP2,NUPL1,PARP4,RBM26,RNF6, SUCLA2,TM9SF2,UBL3,USP12,XPO4,ZDHHC20,ZMYM2 | ABHD13,ACBD3,FAM91A1,FBXO28,CFAP97,LRRC40,LYSMD3, MIER3,MTMR6,NAPG,PAQR3,PGGT1B,PLEKHA1,PRKAA1, STAM2,TMED7,TMEM106B,UBE2K,UBXN4,WASL,ZNF800 |
 |
|
| ABHD13,ALG5,CDK8,COG6,DIS3,MICU2,ELF1, FBXL3,FNDC3A,GPALPP1,KPNA3,LNX2,MTMR6,NDFIP2, NUPL1,PARP4,RNF6,SAP18,TM9SF2,UFM1,ZDHHC20 | ARMC1,FAM204A,C11orf58,C3orf33,CLDND1,COMMD2,DIMT1, DNAJC8,LOC441089,MOB4,MTMR6,PNPLA8,POLR2K,POLR3F, PRKRA,RHEB,RWDD1,TSEN15,TSNAX,UBE2V2,VBP1 |

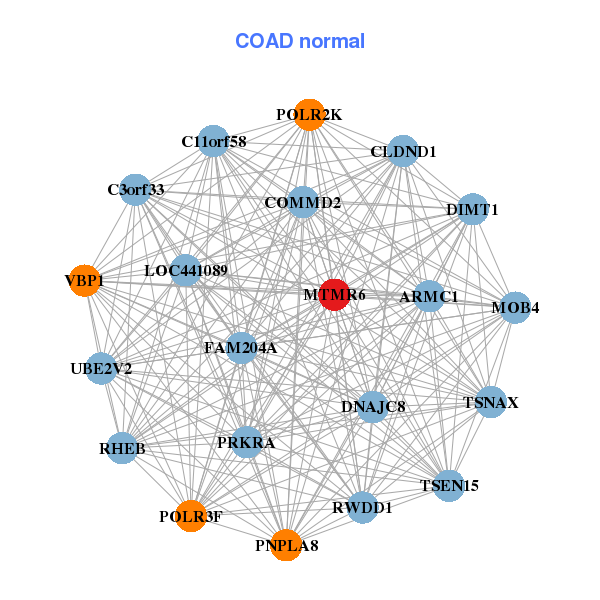
| * Co-Expression network figures were drawn using R package igraph. Only the top 20 genes with the highest correlations were shown. Red circle: input gene, orange circle: cell metabolism gene, sky circle: other gene |
: Open all plots for all cancer types
| Top |
: Open all interacting genes' information including KEGG pathway for all interacting genes from DAVID
| Top |
| Pharmacological Information for MTMR6 |
| There's no related Drug. |
| Top |
| Cross referenced IDs for MTMR6 |
| * We obtained these cross-references from Uniprot database. It covers 150 different DBs, 18 categories. http://www.uniprot.org/help/cross_references_section |
: Open all cross reference information
|
Copyright © 2016-Present - The Univsersity of Texas Health Science Center at Houston @ |