|
||||||||||||||||||||
| |
| Phenotypic Information (metabolism pathway, cancer, disease, phenome) |
| |
| |
| Gene-Gene Network Information: Co-Expression Network, Interacting Genes & KEGG |
| |
|


| Gene Summary for SLC16A3 |
| Basic gene info. | Gene symbol | SLC16A3 |
| Gene name | solute carrier family 16 (monocarboxylate transporter), member 3 | |
| Synonyms | MCT 3|MCT 4|MCT-3|MCT-4|MCT3|MCT4 | |
| Cytomap | UCSC genome browser: 17q25 | |
| Genomic location | chr17 :80190107-80197375 | |
| Type of gene | protein-coding | |
| RefGenes | NM_001042422.2, NM_001042423.2,NM_001206950.1,NM_001206951.1,NM_001206952.1, NM_004207.3, | |
| Ensembl id | ENSG00000141526 | |
| Description | monocarboxylate transporter 3monocarboxylate transporter 4solute carrier family 16 (monocarboxylic acid transporters), member 3solute carrier family 16, member 3 (monocarboxylic acid transporter 4) | |
| Modification date | 20141207 | |
| dbXrefs | MIM : 603877 | |
| HGNC : HGNC | ||
| Ensembl : ENSG00000141526 | ||
| HPRD : 04854 | ||
| Vega : OTTHUMG00000178832 | ||
| Protein | UniProt: go to UniProt's Cross Reference DB Table | |
| Expression | CleanEX: HS_SLC16A3 | |
| BioGPS: 9123 | ||
| Gene Expression Atlas: ENSG00000141526 | ||
| The Human Protein Atlas: ENSG00000141526 | ||
| Pathway | NCI Pathway Interaction Database: SLC16A3 | |
| KEGG: SLC16A3 | ||
| REACTOME: SLC16A3 | ||
| ConsensusPathDB | ||
| Pathway Commons: SLC16A3 | ||
| Metabolism | MetaCyc: SLC16A3 | |
| HUMANCyc: SLC16A3 | ||
| Regulation | Ensembl's Regulation: ENSG00000141526 | |
| miRBase: chr17 :80,190,107-80,197,375 | ||
| TargetScan: NM_001042422 | ||
| cisRED: ENSG00000141526 | ||
| Context | iHOP: SLC16A3 | |
| cancer metabolism search in PubMed: SLC16A3 | ||
| UCL Cancer Institute: SLC16A3 | ||
| Assigned class in ccmGDB | C | |
| Top |
| Phenotypic Information for SLC16A3(metabolism pathway, cancer, disease, phenome) |
| Cancer | CGAP: SLC16A3 |
| Familial Cancer Database: SLC16A3 | |
| * This gene is included in those cancer gene databases. |
|
|
|
|
|
|
| ||||||||||||||
Oncogene 1 | Significant driver gene in | |||||||||||||||||||
| cf) number; DB name 1 Oncogene; http://nar.oxfordjournals.org/content/35/suppl_1/D721.long, 2 Tumor Suppressor gene; https://bioinfo.uth.edu/TSGene/, 3 Cancer Gene Census; http://www.nature.com/nrc/journal/v4/n3/abs/nrc1299.html, 4 CancerGenes; http://nar.oxfordjournals.org/content/35/suppl_1/D721.long, 5 Network of Cancer Gene; http://ncg.kcl.ac.uk/index.php, 1Therapeutic Vulnerabilities in Cancer; http://cbio.mskcc.org/cancergenomics/statius/ |
| REACTOME_PYRUVATE_METABOLISM_AND_CITRIC_ACID_TCA_CYCLE REACTOME_PYRUVATE_METABOLISM | |
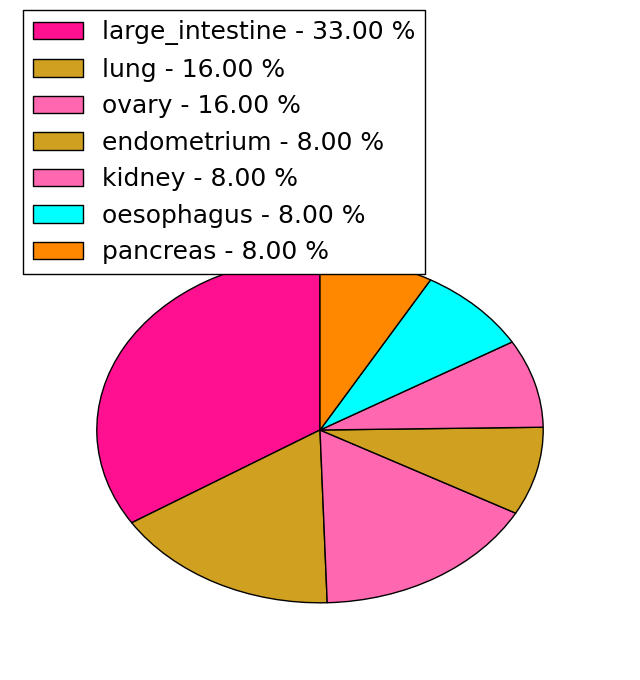
| Mutations for SLC16A3 |
| * Under tables are showing count per each tissue to give us broad intuition about tissue specific mutation patterns.You can go to the detailed page for each mutation database's web site. |
| There's no structural variation information in COSMIC data for this gene. |
| * From mRNA Sanger sequences, Chitars2.0 arranged chimeric transcripts. This table shows SLC16A3 related fusion information. |
| ID | Head Gene | Tail Gene | Accession | Gene_a | qStart_a | qEnd_a | Chromosome_a | tStart_a | tEnd_a | Gene_a | qStart_a | qEnd_a | Chromosome_a | tStart_a | tEnd_a |
| AA373754 | SLC16A3 | 1 | 40 | 17 | 80186944 | 80186983 | RNF213 | 36 | 222 | 17 | 78237458 | 78247106 | |
| AK127090 | SLC16A3 | 1 | 2846 | 17 | 80186921 | 80189766 | FTH1 | 2839 | 3621 | 11 | 61732038 | 61734967 | |
| AI128892 | SLC16A3 | 1 | 137 | 17 | 80196796 | 80196935 | SLC16A3 | 133 | 404 | 17 | 80194689 | 80195226 | |
| CB530028 | SLC16A3 | 18 | 489 | 17 | 80196884 | 80197355 | SLC16A3 | 482 | 590 | 17 | 80195530 | 80195639 | |
| Top |
| There's no copy number variation information in COSMIC data for this gene. |
| Top |
|
 |
| Top |
| Stat. for Non-Synonymous SNVs (# total SNVs=12) | (# total SNVs=8) |
 |  |
(# total SNVs=1) | (# total SNVs=0) |
 |
| Top |
| * When you move the cursor on each content, you can see more deailed mutation information on the Tooltip. Those are primary_site,primary_histology,mutation(aa),pubmedID. |
| GRCh37 position | Mutation(aa) | Unique sampleID count |
| chr17:80195666-80195666 | p.F340L | 3 |
| chr17:80195293-80195293 | p.R216L | 2 |
| chr17:80196735-80196735 | p.E427E | 2 |
| chr17:80195582-80195582 | p.G312G | 2 |
| chr17:80196837-80196837 | p.P461P | 2 |
| chr17:80193902-80193902 | p.V6V | 1 |
| chr17:80195756-80195756 | p.G370G | 1 |
| chr17:80195544-80195544 | p.F300L | 1 |
| chr17:80194035-80194035 | p.Q51E | 1 |
| chr17:80196577-80196577 | p.? | 1 |
| Top |
|
 |
| Point Mutation/ Tissue ID | 1 | 2 | 3 | 4 | 5 | 6 | 7 | 8 | 9 | 10 | 11 | 12 | 13 | 14 | 15 | 16 | 17 | 18 | 19 | 20 |
| # sample | 1 | 1 | 2 | 1 | 1 | 7 | 4 | 3 | ||||||||||||
| # mutation | 1 | 1 | 2 | 1 | 1 | 9 | 4 | 3 | ||||||||||||
| nonsynonymous SNV | 1 | 1 | 1 | 1 | 1 | 1 | 3 | 1 | ||||||||||||
| synonymous SNV | 1 | 8 | 1 | 2 |
| cf) Tissue ID; Tissue type (1; BLCA[Bladder Urothelial Carcinoma], 2; BRCA[Breast invasive carcinoma], 3; CESC[Cervical squamous cell carcinoma and endocervical adenocarcinoma], 4; COAD[Colon adenocarcinoma], 5; GBM[Glioblastoma multiforme], 6; Glioma Low Grade, 7; HNSC[Head and Neck squamous cell carcinoma], 8; KICH[Kidney Chromophobe], 9; KIRC[Kidney renal clear cell carcinoma], 10; KIRP[Kidney renal papillary cell carcinoma], 11; LAML[Acute Myeloid Leukemia], 12; LUAD[Lung adenocarcinoma], 13; LUSC[Lung squamous cell carcinoma], 14; OV[Ovarian serous cystadenocarcinoma ], 15; PAAD[Pancreatic adenocarcinoma], 16; PRAD[Prostate adenocarcinoma], 17; SKCM[Skin Cutaneous Melanoma], 18:STAD[Stomach adenocarcinoma], 19:THCA[Thyroid carcinoma], 20:UCEC[Uterine Corpus Endometrial Carcinoma]) |
| Top |
| * We represented just top 10 SNVs. When you move the cursor on each content, you can see more deailed mutation information on the Tooltip. Those are primary_site, primary_histology, mutation(aa), pubmedID. |
| Genomic Position | Mutation(aa) | Unique sampleID count |
| chr17:80193902 | p.A366V,SLC16A3 | 1 |
| chr17:80195437 | p.G73G,SLC16A3 | 1 |
| chr17:80196837 | p.G75D,SLC16A3 | 1 |
| chr17:80194035 | p.G370G,SLC16A3 | 1 |
| chr17:80195441 | p.P76P,SLC16A3 | 1 |
| chr17:80194073 | p.F446F,SLC16A3 | 1 |
| chr17:80195474 | p.V82V,SLC16A3 | 1 |
| chr17:80194103 | p.P461P,SLC16A3 | 1 |
| chr17:80195519 | p.G101D,SLC16A3 | 1 |
| chr17:80194605 | p.M102L,SLC16A3 | 1 |
| * Copy number data were extracted from TCGA using R package TCGA-Assembler. The URLs of all public data files on TCGA DCC data server were gathered on Jan-05-2015. Function ProcessCNAData in TCGA-Assembler package was used to obtain gene-level copy number value which is calculated as the average copy number of the genomic region of a gene. |
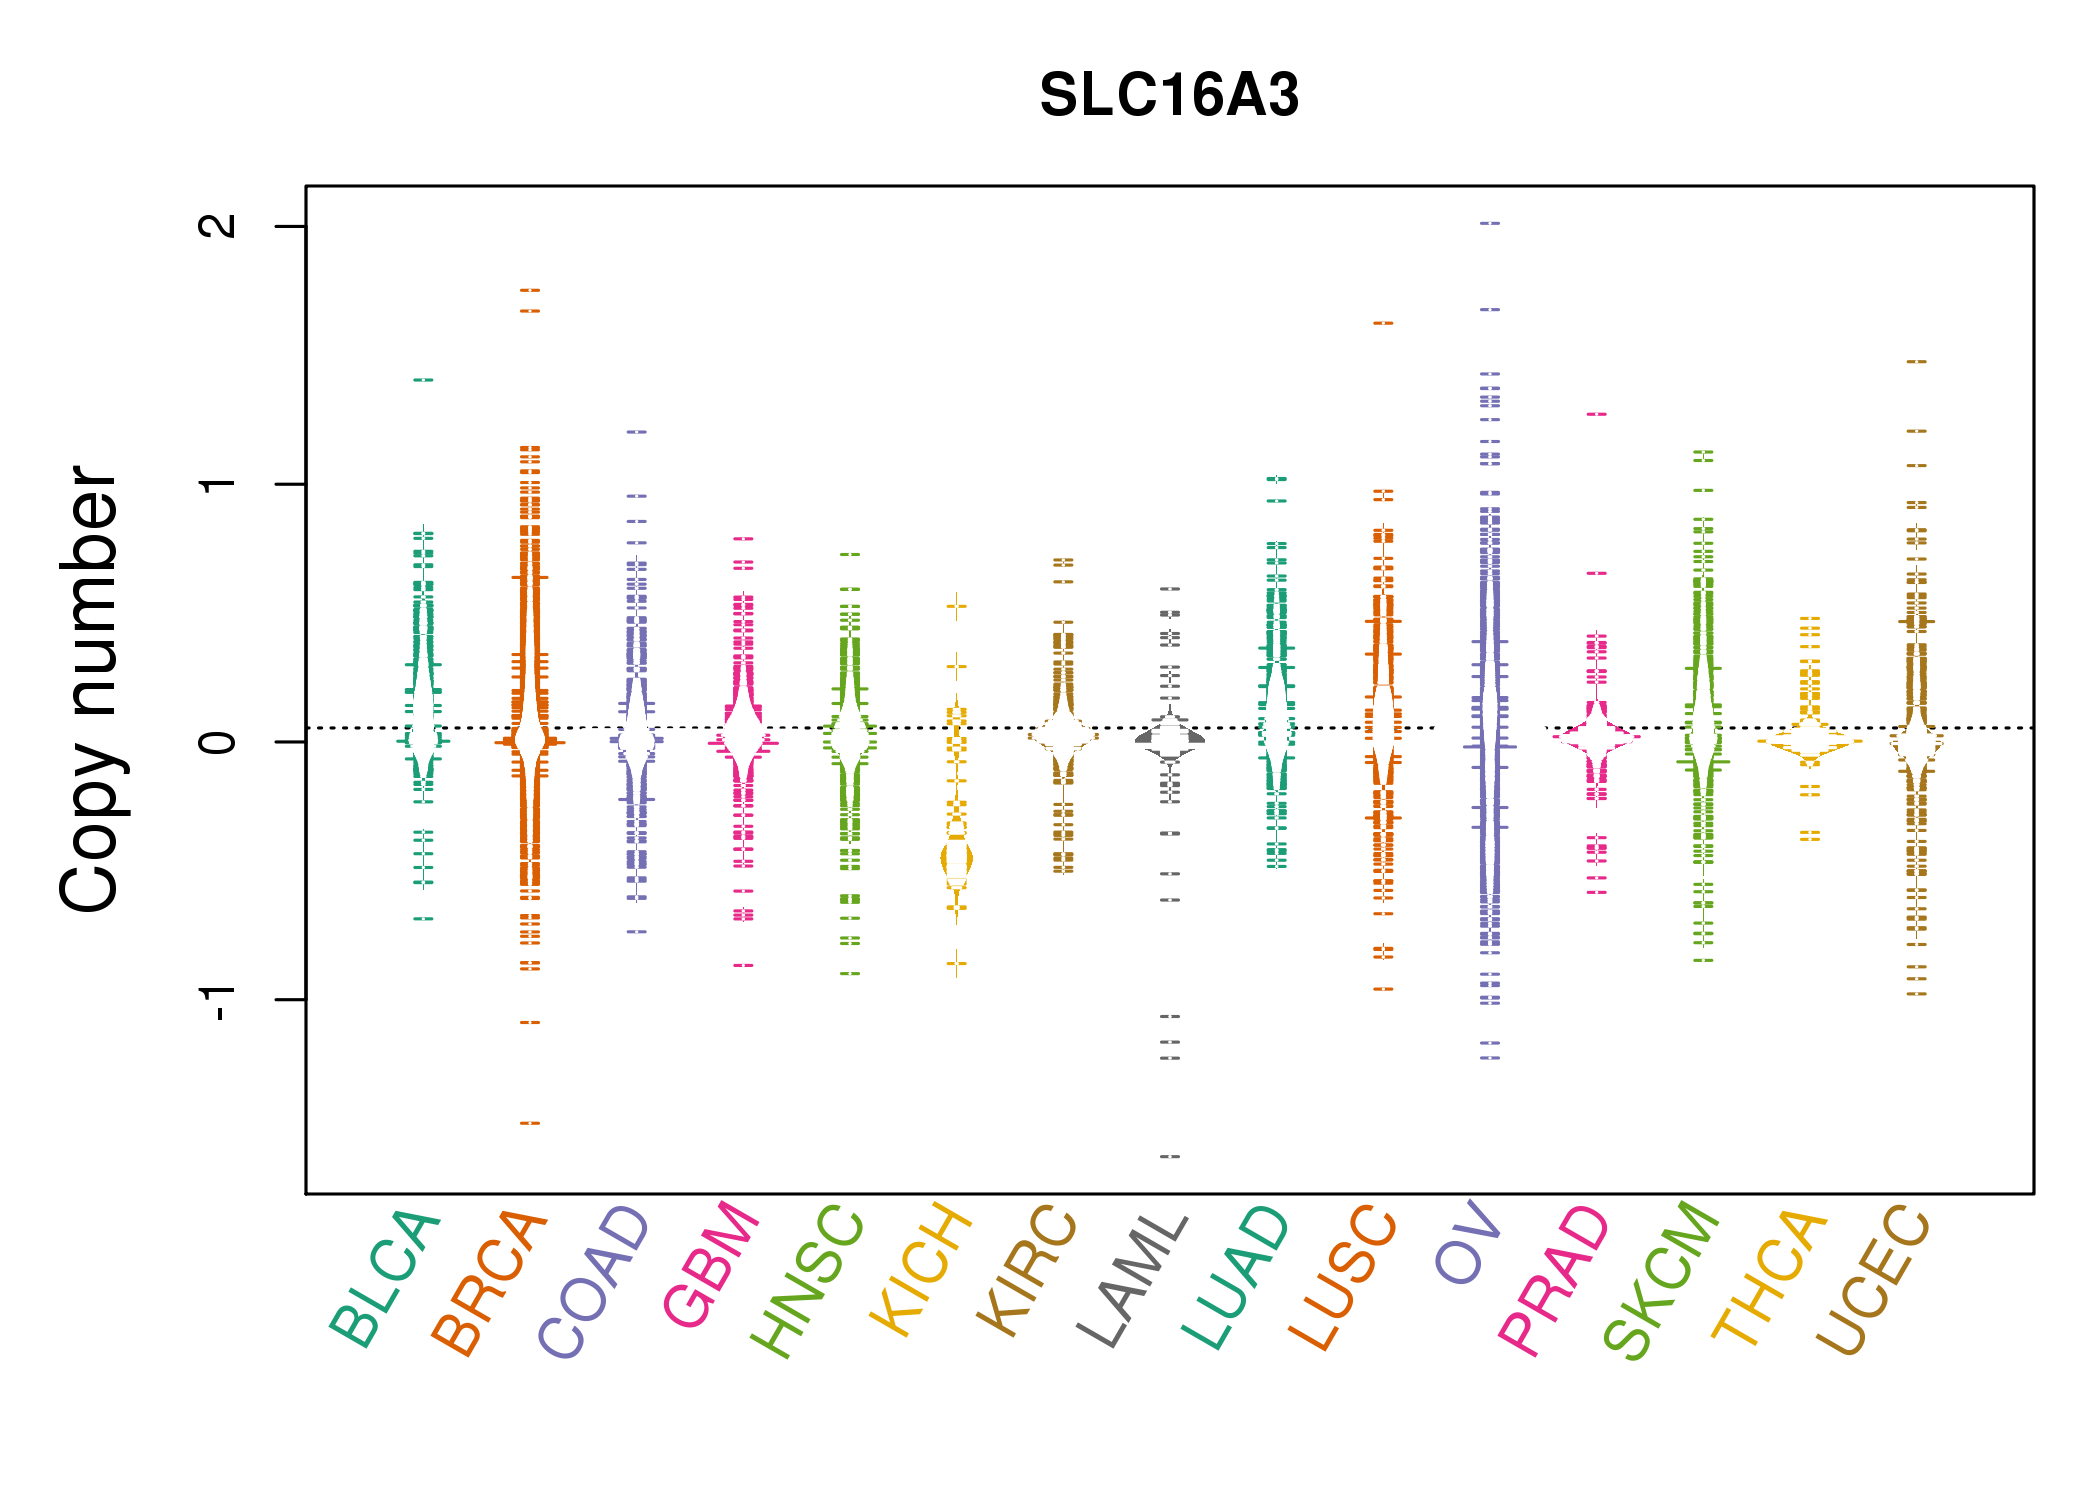 |
| cf) Tissue ID[Tissue type]: BLCA[Bladder Urothelial Carcinoma], BRCA[Breast invasive carcinoma], CESC[Cervical squamous cell carcinoma and endocervical adenocarcinoma], COAD[Colon adenocarcinoma], GBM[Glioblastoma multiforme], Glioma Low Grade, HNSC[Head and Neck squamous cell carcinoma], KICH[Kidney Chromophobe], KIRC[Kidney renal clear cell carcinoma], KIRP[Kidney renal papillary cell carcinoma], LAML[Acute Myeloid Leukemia], LUAD[Lung adenocarcinoma], LUSC[Lung squamous cell carcinoma], OV[Ovarian serous cystadenocarcinoma ], PAAD[Pancreatic adenocarcinoma], PRAD[Prostate adenocarcinoma], SKCM[Skin Cutaneous Melanoma], STAD[Stomach adenocarcinoma], THCA[Thyroid carcinoma], UCEC[Uterine Corpus Endometrial Carcinoma] |
| Top |
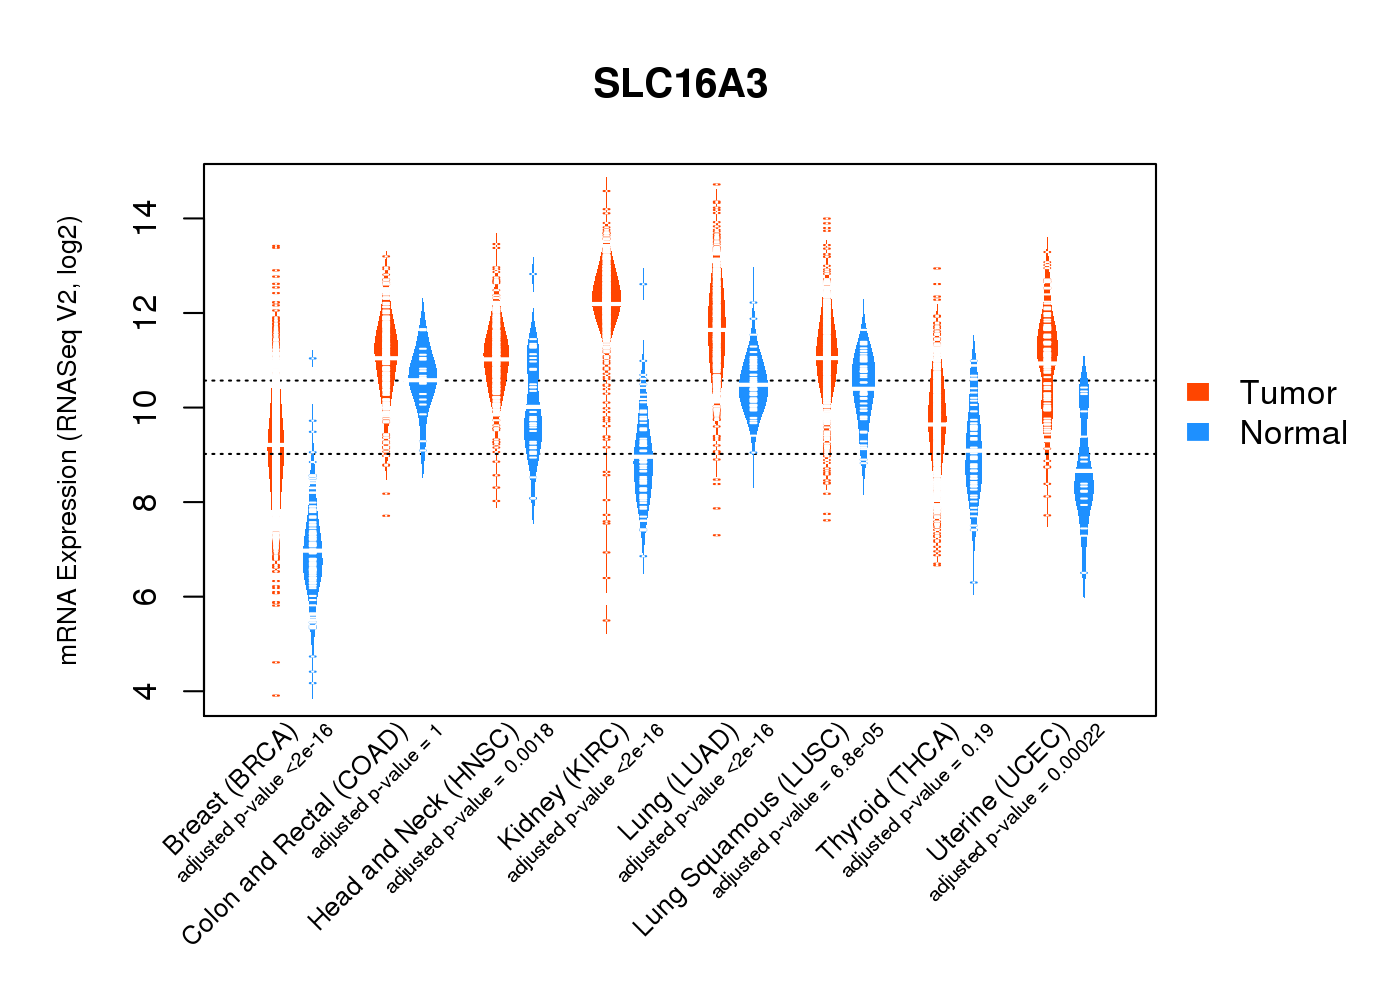
| Gene Expression for SLC16A3 |
| * CCLE gene expression data were extracted from CCLE_Expression_Entrez_2012-10-18.res: Gene-centric RMA-normalized mRNA expression data. |
 |
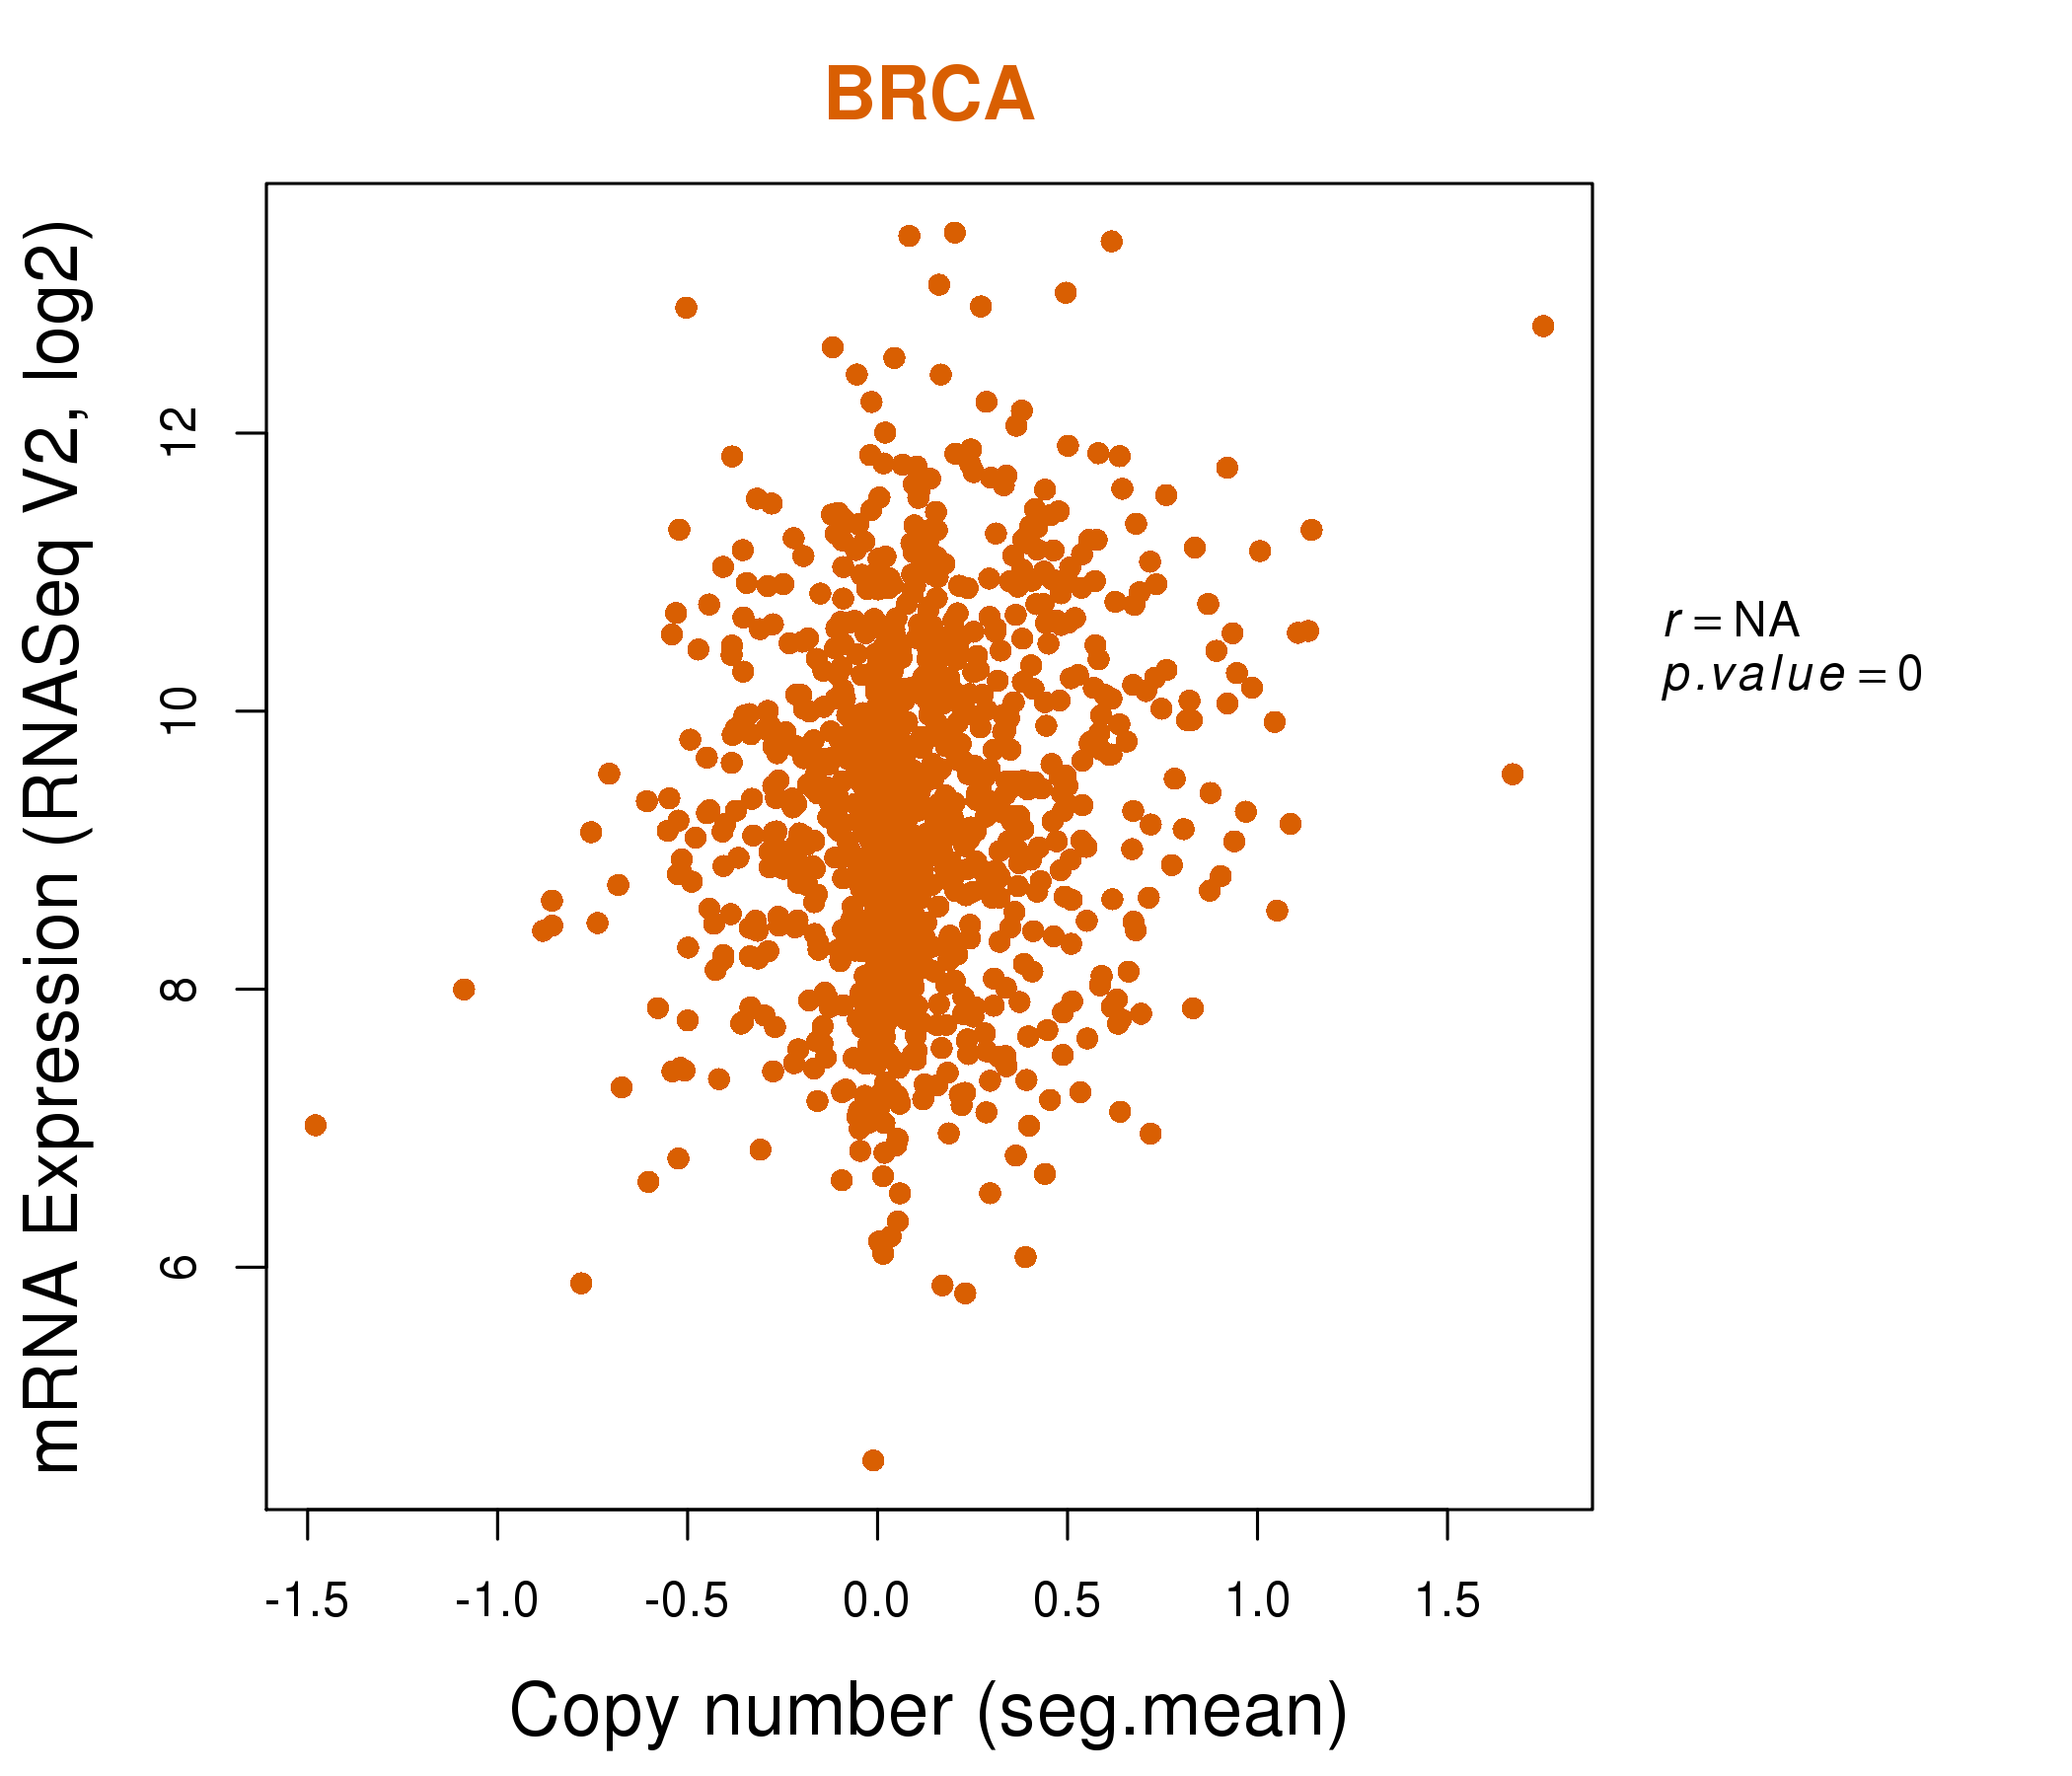
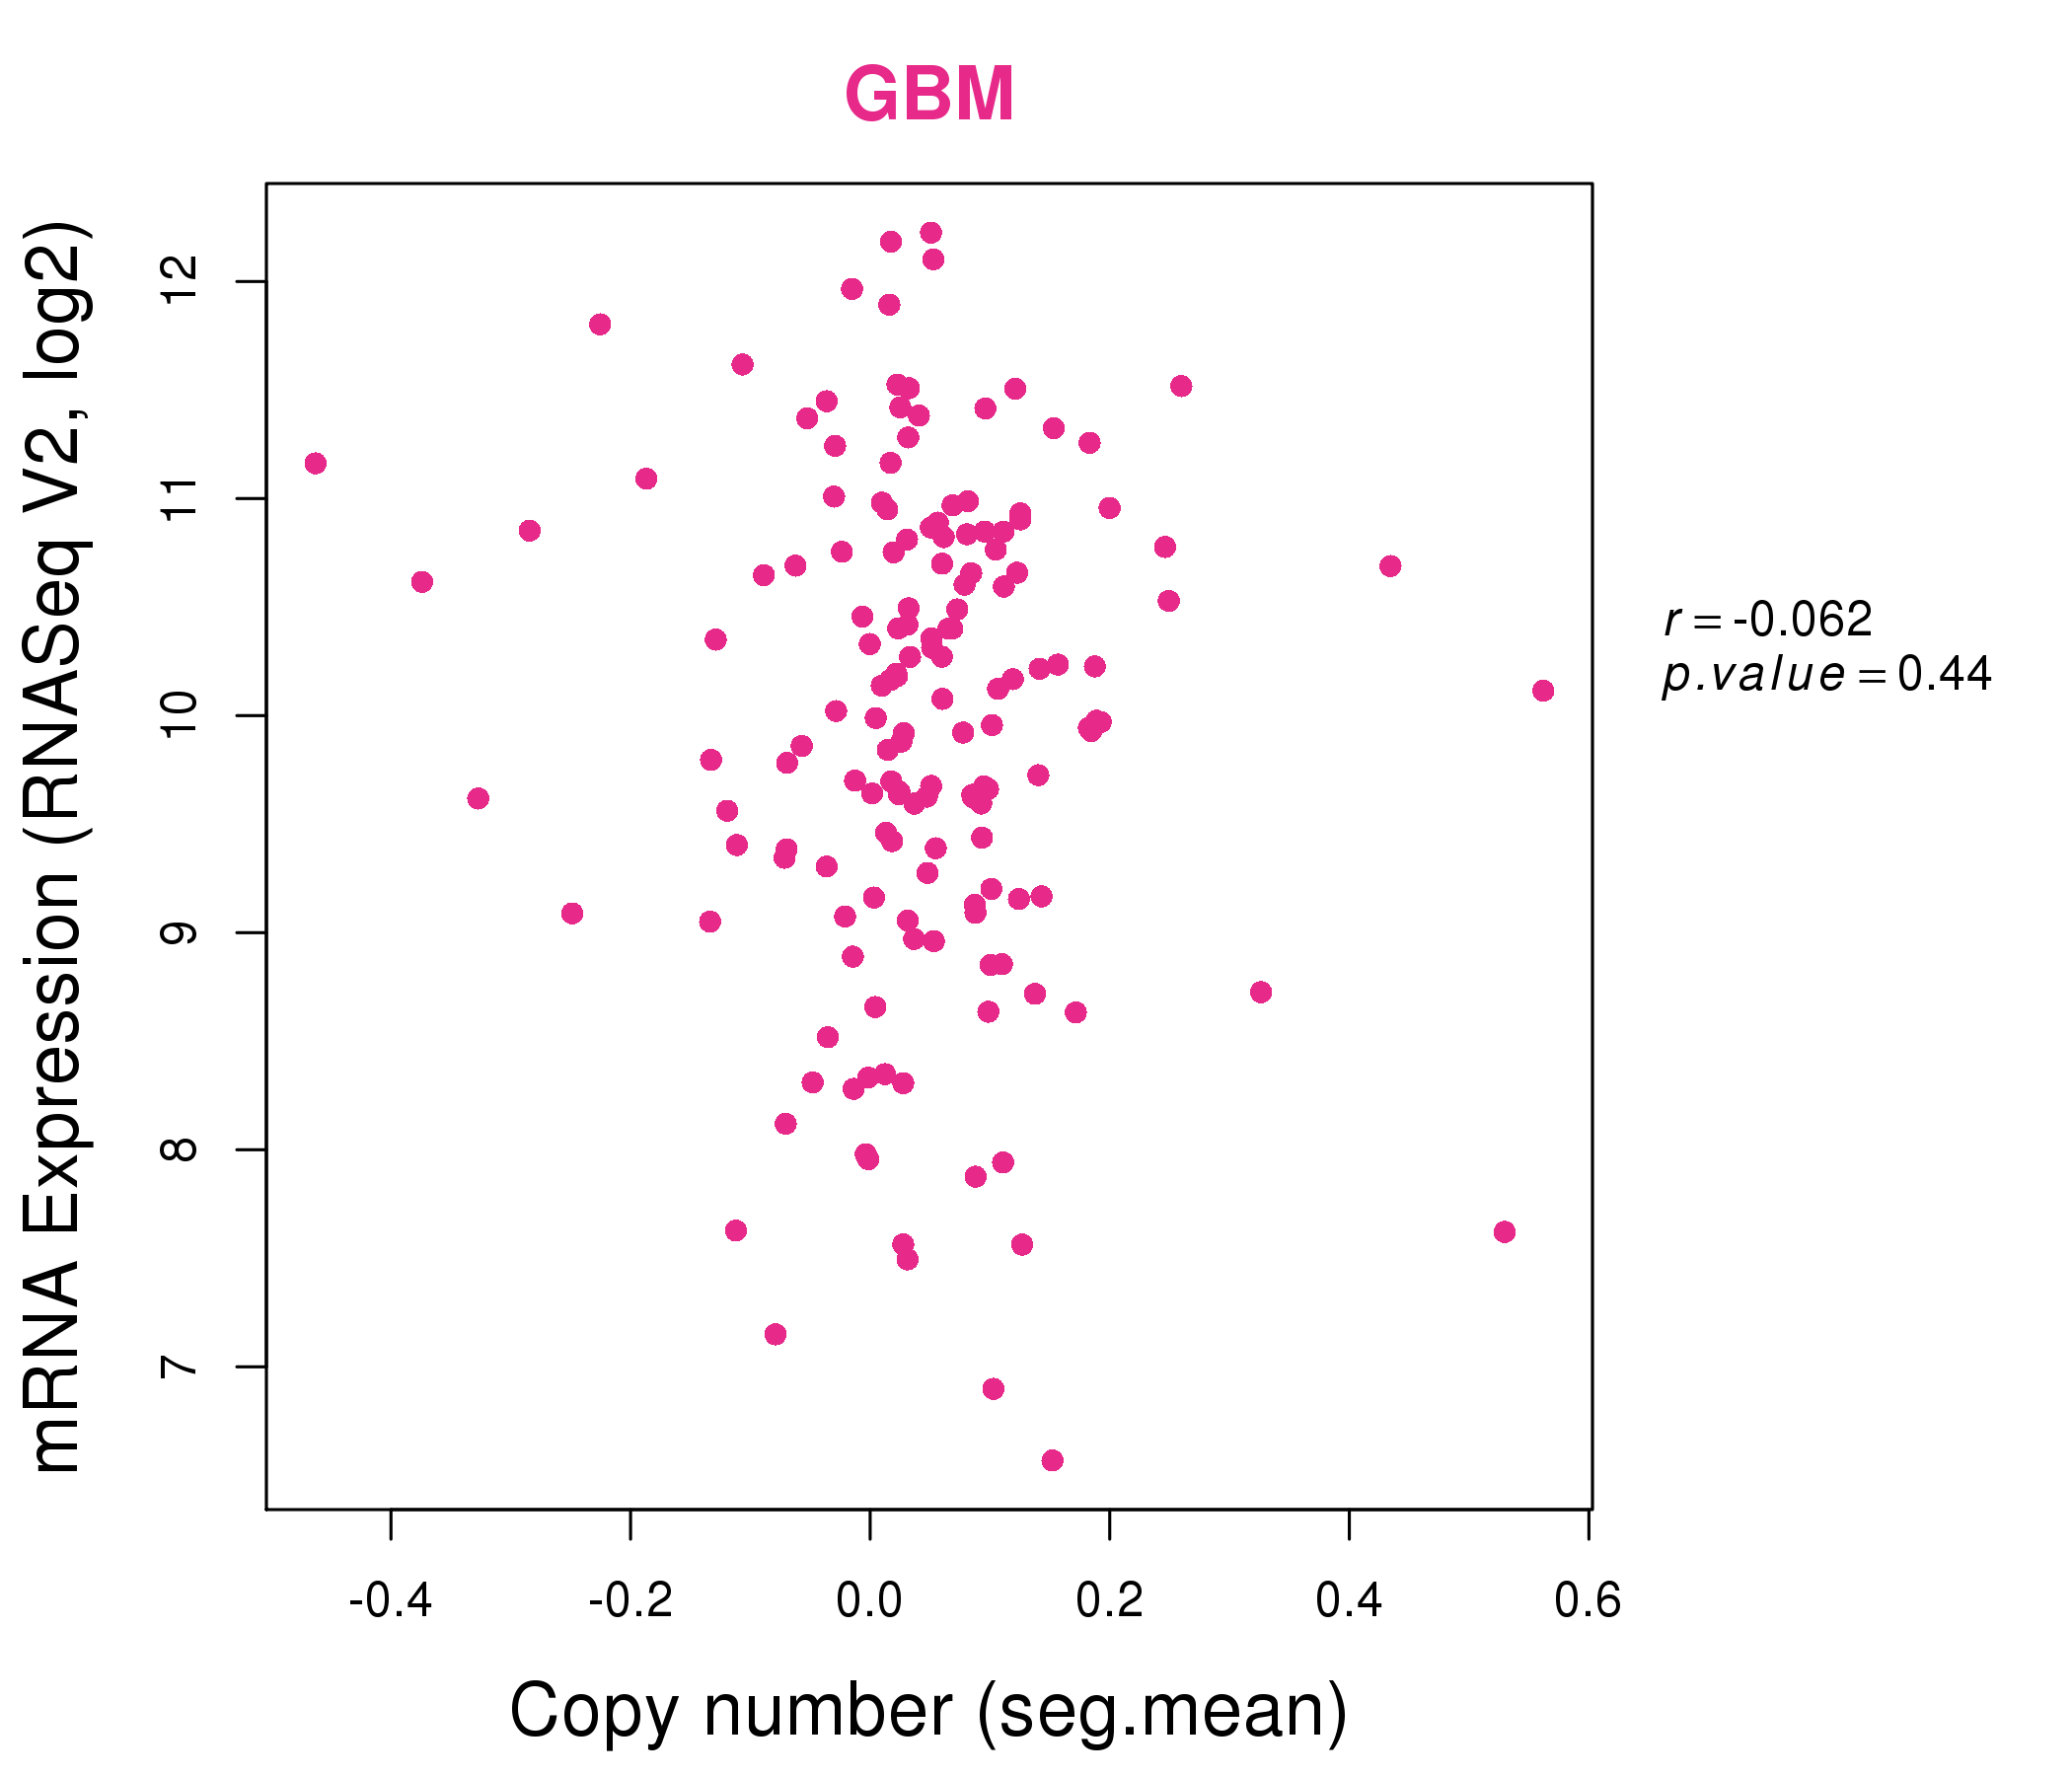
| * Normalized gene expression data of RNASeqV2 was extracted from TCGA using R package TCGA-Assembler. The URLs of all public data files on TCGA DCC data server were gathered at Jan-05-2015. Only eight cancer types have enough normal control samples for differential expression analysis. (t test, adjusted p<0.05 (using Benjamini-Hochberg FDR)) |
 |
| Top |
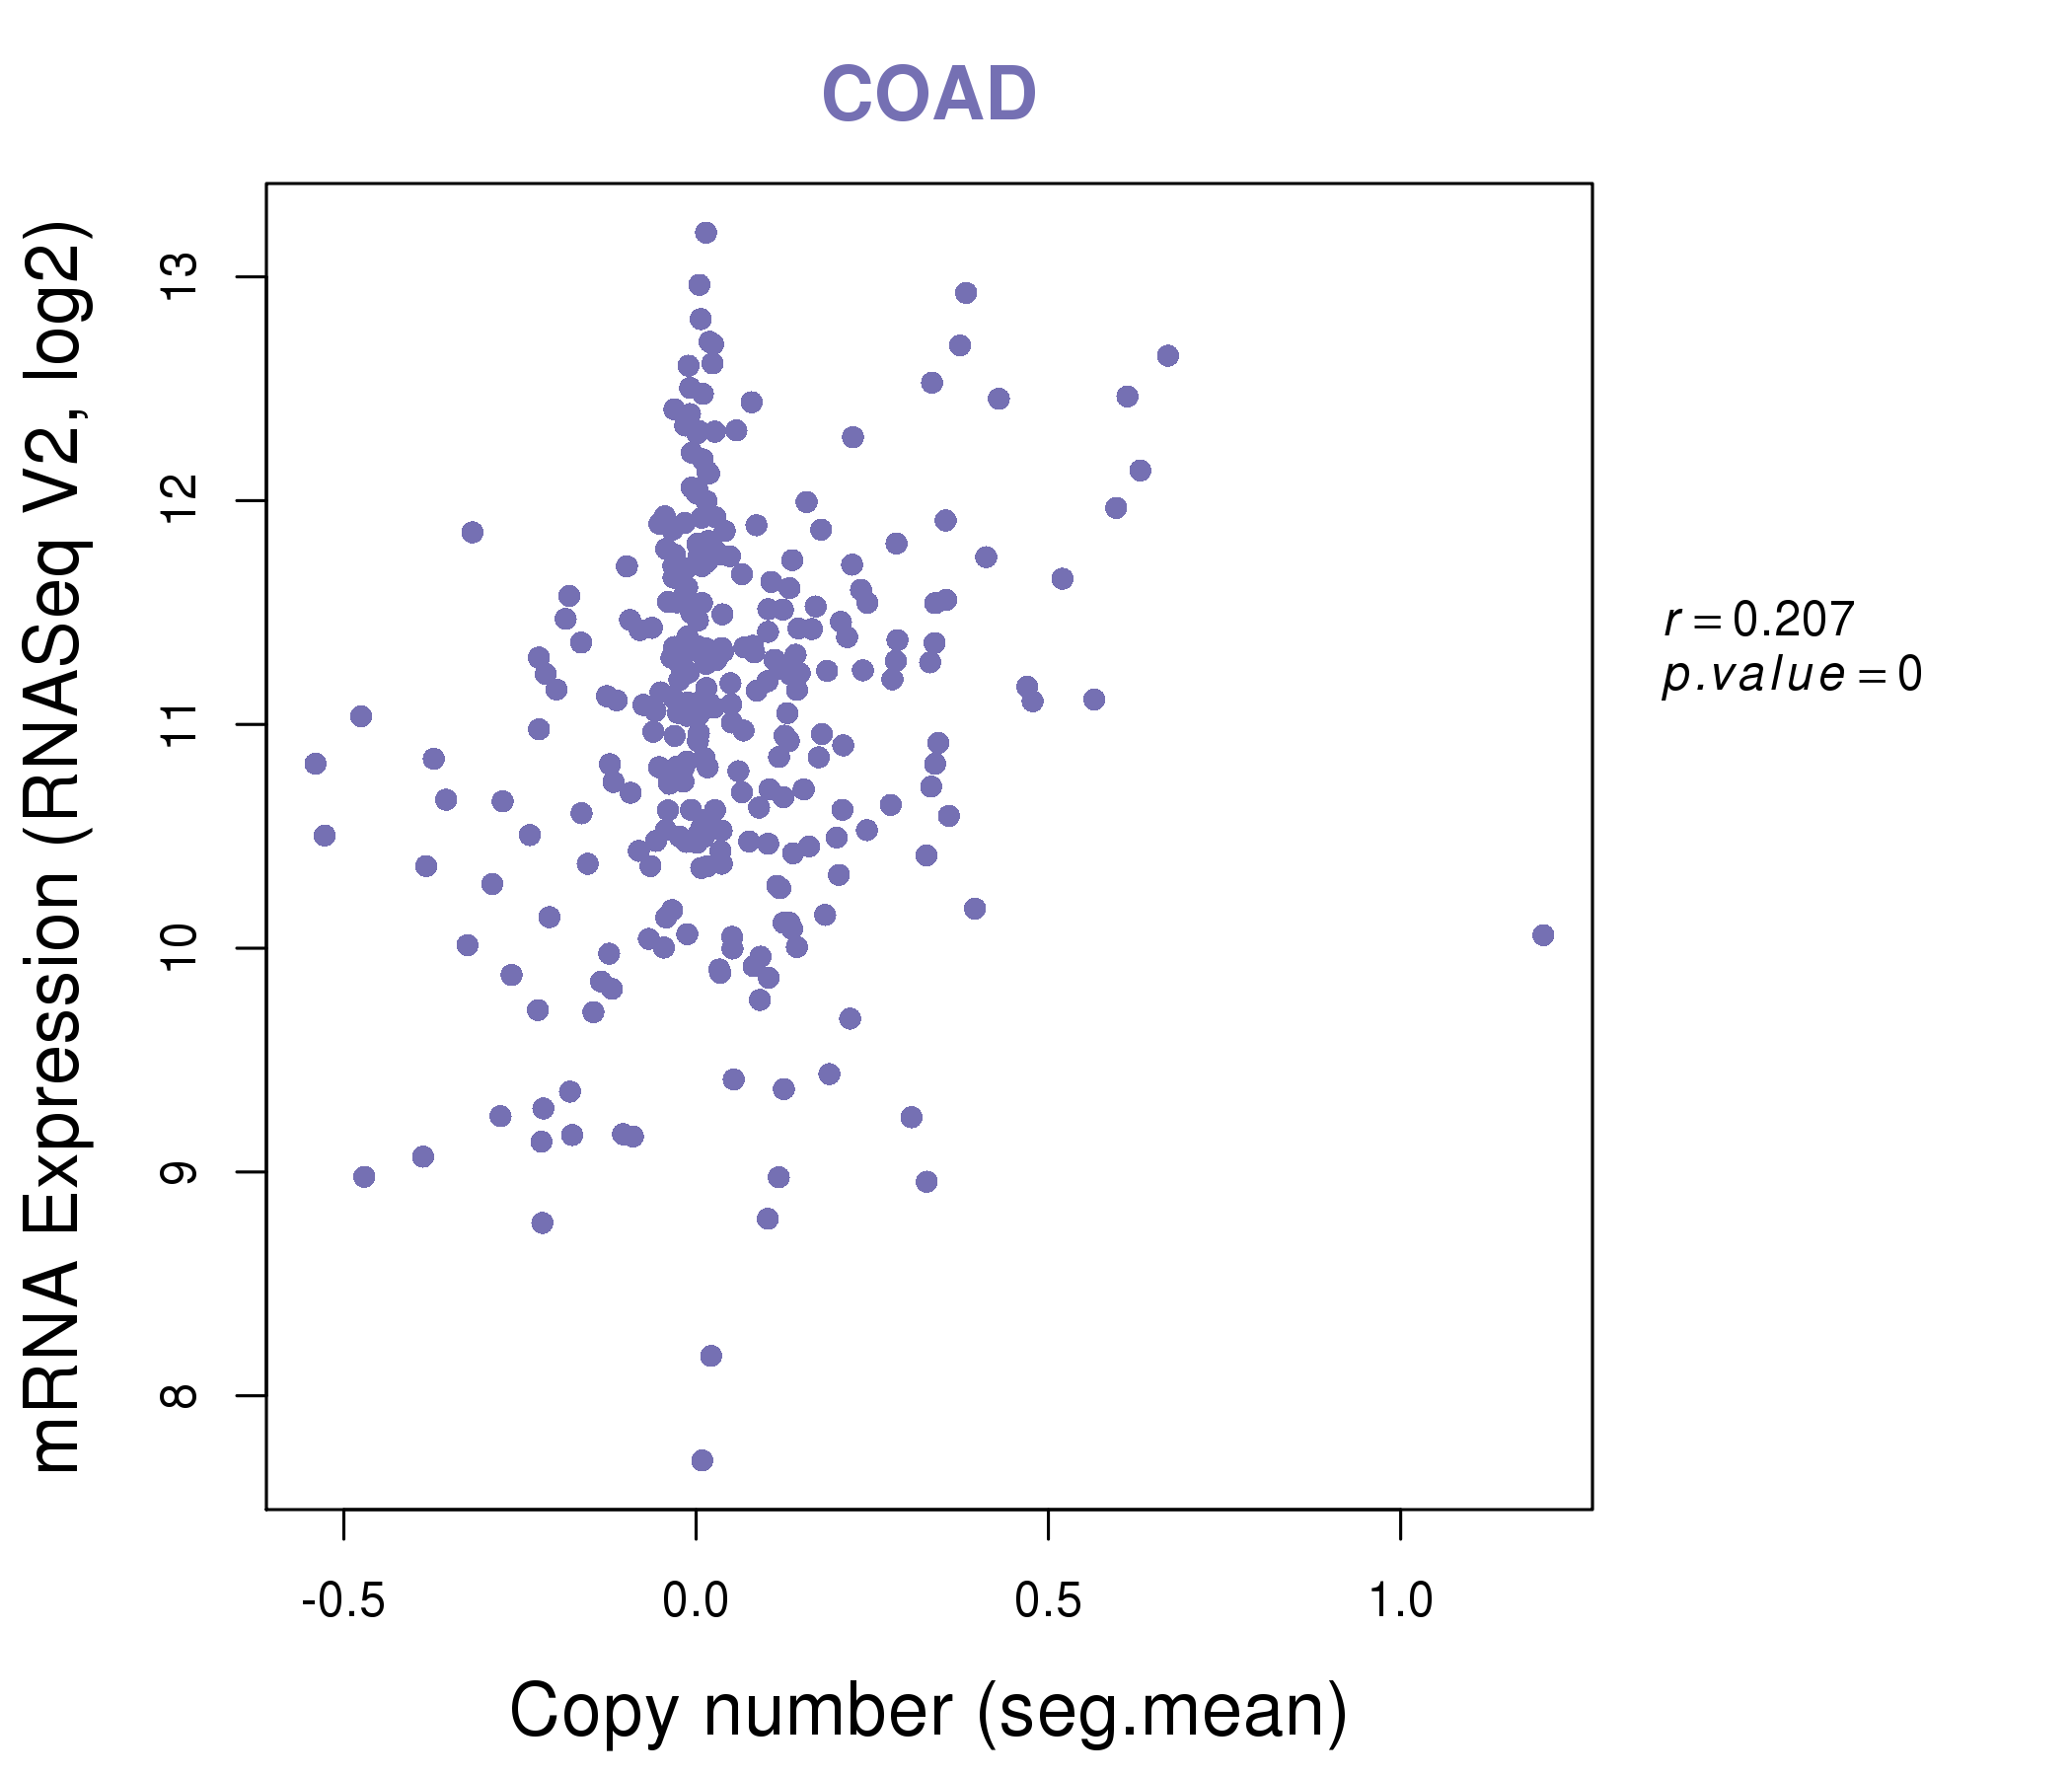
| * This plots show the correlation between CNV and gene expression. |
: Open all plots for all cancer types
 |
|
 |
|
| Top |
| Gene-Gene Network Information |
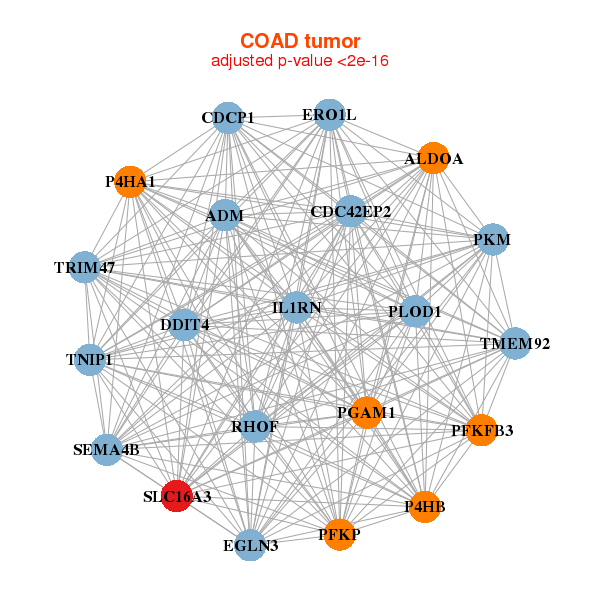
| * Co-Expression network figures were drawn using R package igraph. Only the top 20 genes with the highest correlations were shown. Red circle: input gene, orange circle: cell metabolism gene, sky circle: other gene |
: Open all plots for all cancer types
 |
| ||||
| ARPC1B,BMP1,CCM2,EMILIN1,EMP3,FAM20C,HHIPL1, KIFC3,LEPRE1,LGALS1,METRNL,MRC2,PCOLCE,PLA2G15, PLAUR,RCN3,SERPINH1,SLC16A3,TMED9,TREM1,UPP1 | ACOT11,AKR1B1,CARM1,CCDC28B,DNASE1L1,GMPR,HSPB1, IL32,IMPA2,LINC00116,PKM,PLEC,PPP1R3F,RAMP1, SCN1B,SH2B2,SLC16A3,SNAI3,TEAD4,TPI1,UBAC1 | ||||
 |
| ||||
| ADM,ALDOA,CDC42EP2,CDCP1,DDIT4,EGLN3,ERO1L, IL1RN,P4HA1,P4HB,PFKFB3,PFKP,PGAM1,PKM, PLOD1,RHOF,SEMA4B,SLC16A3,TMEM92,TNIP1,TRIM47 | CNPPD1,EGLN3,ENTPD8,GBA,IFNGR2,KRTAP5-5,LITAF, LOC646627,MAPK3,N4BP1,P2RX4,PEX26,PRSS8,SERINC2, SLC16A3,SLC8B1,SLC6A10P,TJP3,TMEM127,TNIP1,TTC22 |

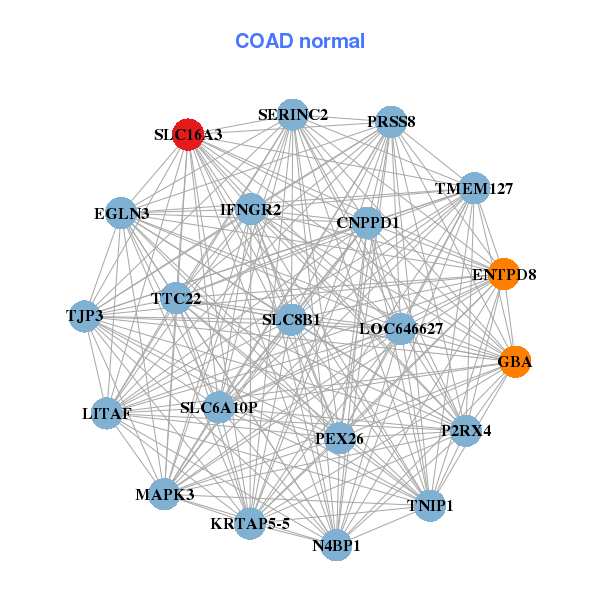
| * Co-Expression network figures were drawn using R package igraph. Only the top 20 genes with the highest correlations were shown. Red circle: input gene, orange circle: cell metabolism gene, sky circle: other gene |
: Open all plots for all cancer types
| Top |
: Open all interacting genes' information including KEGG pathway for all interacting genes from DAVID
| Top |
| Pharmacological Information for SLC16A3 |
| DB Category | DB Name | DB's ID and Url link |
| * Gene Centered Interaction Network. |
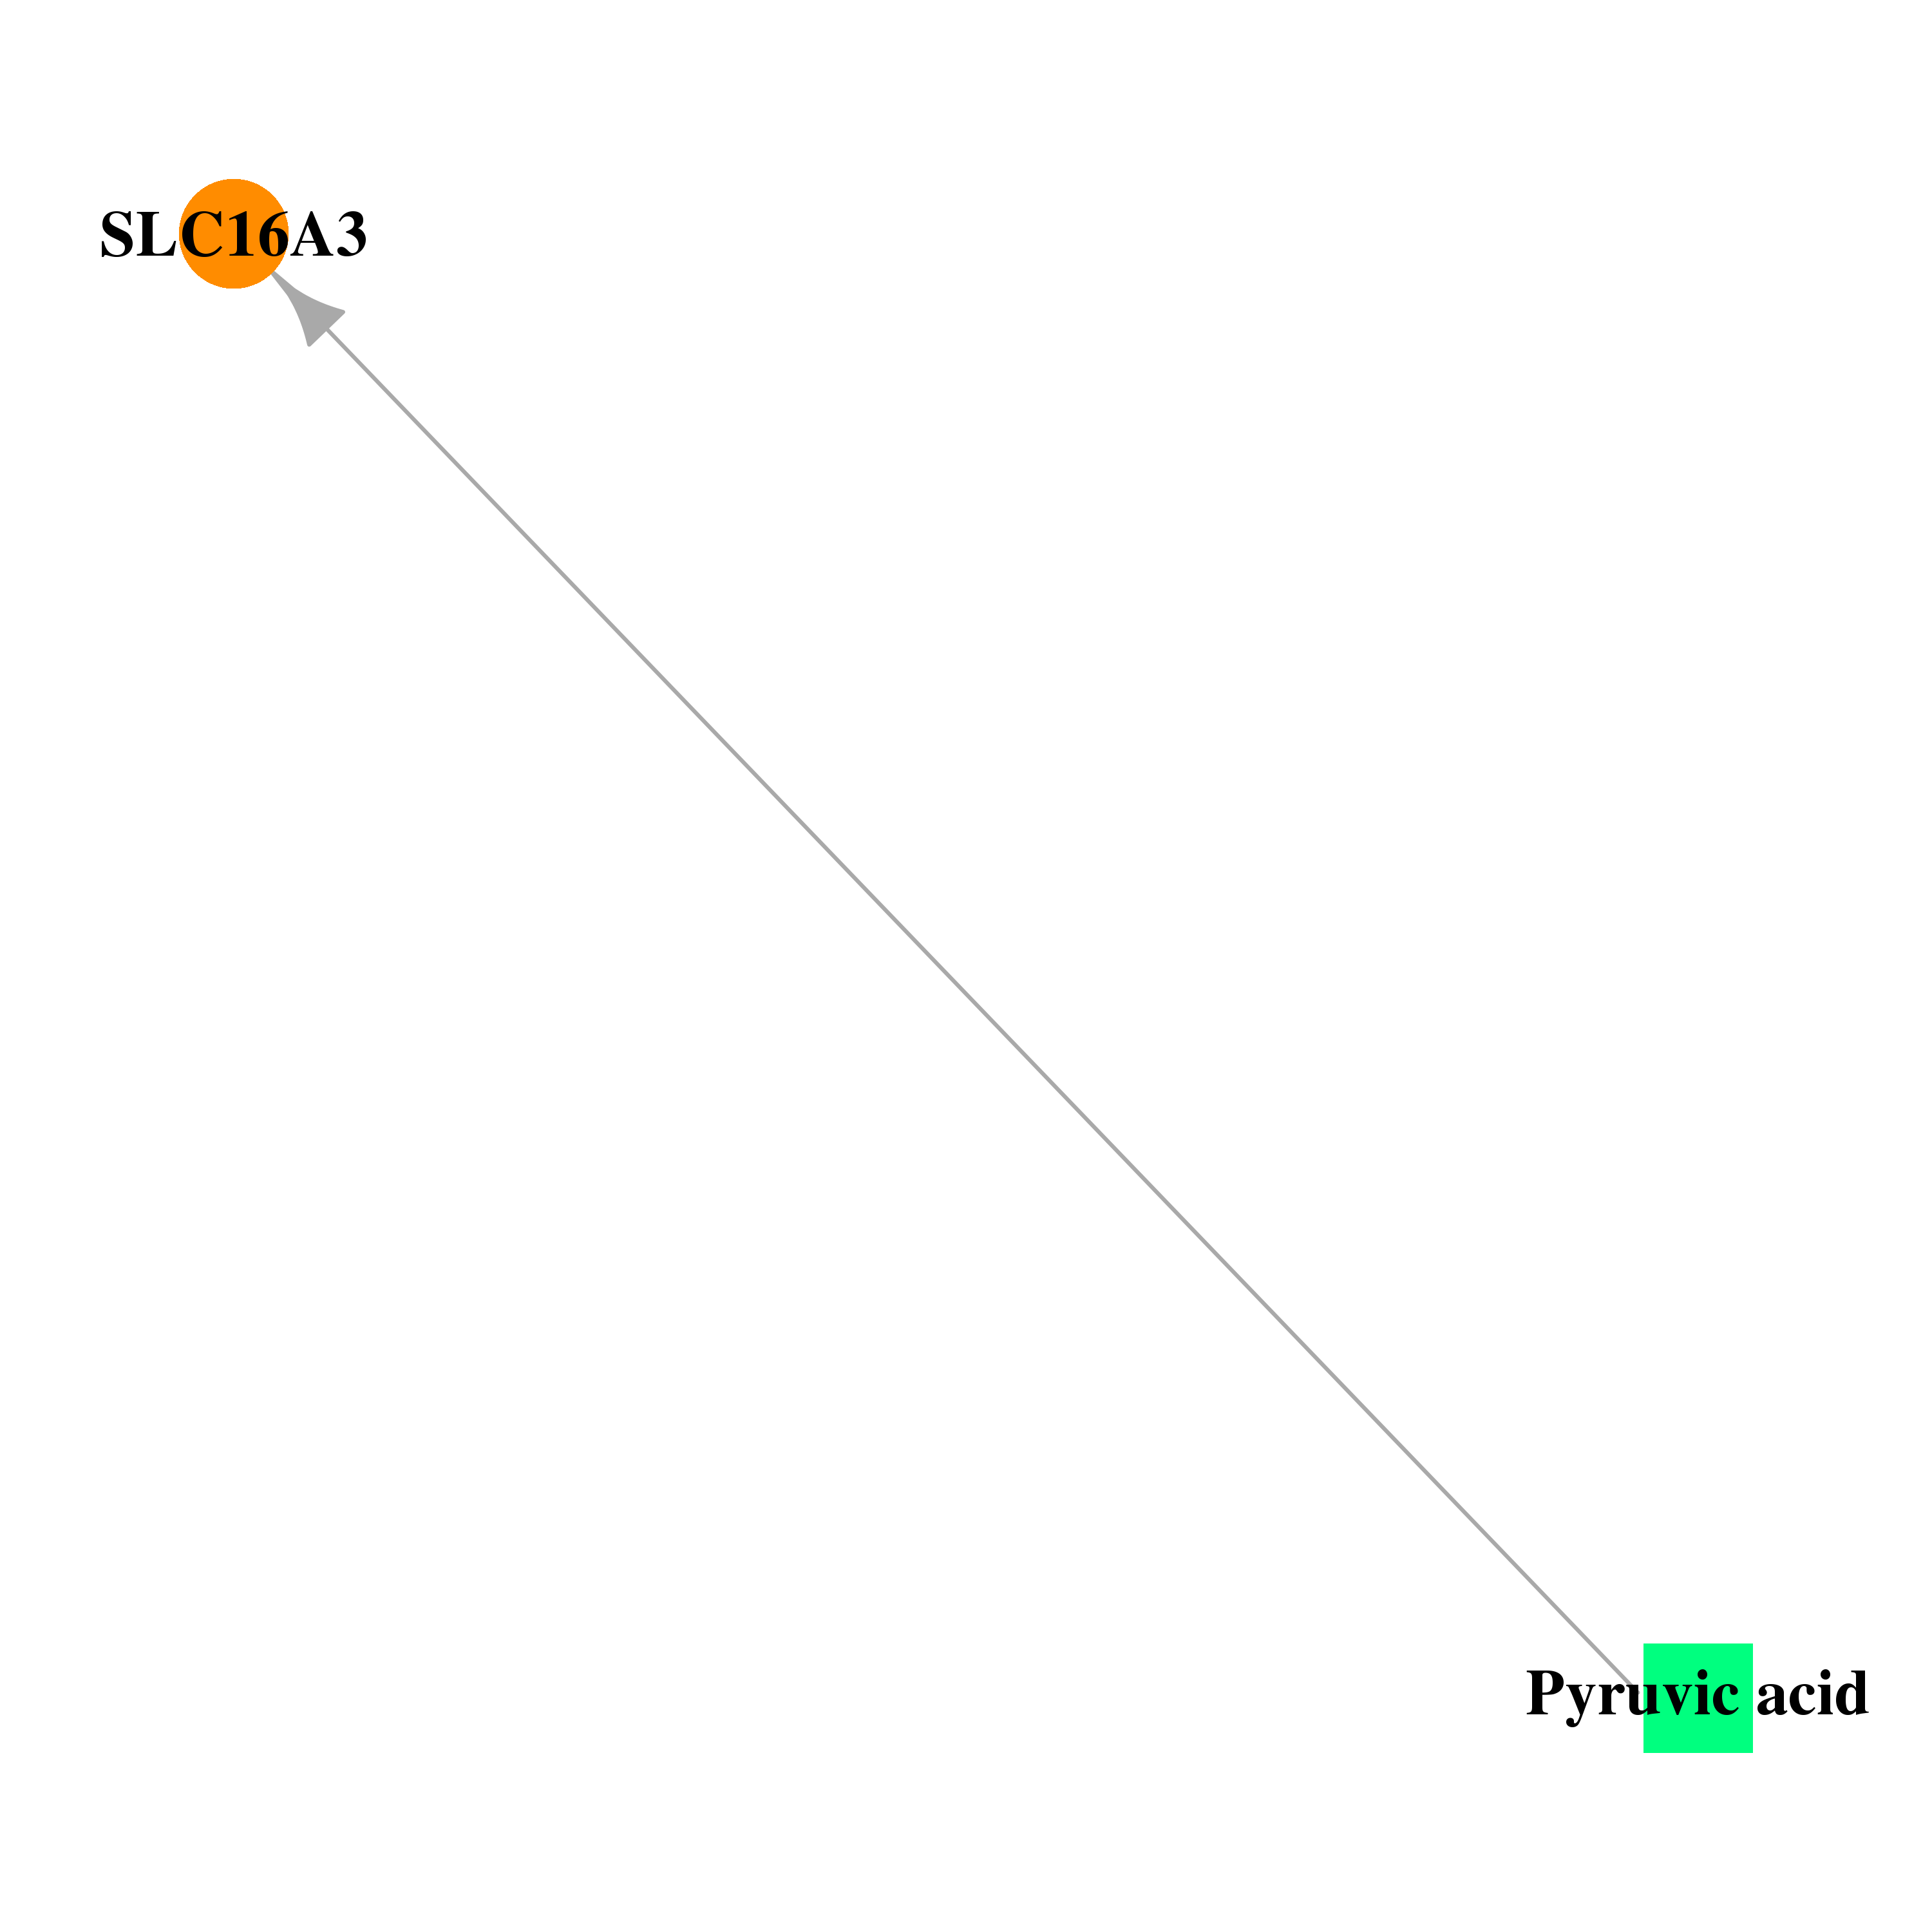 |
| * Drug Centered Interaction Network. |
| DrugBank ID | Target Name | Drug Groups | Generic Name | Drug Centered Network | Drug Structure |
| DB00119 | solute carrier family 16, member 3 (monocarboxylic acid transporter 4) | approved; nutraceutical | Pyruvic acid | 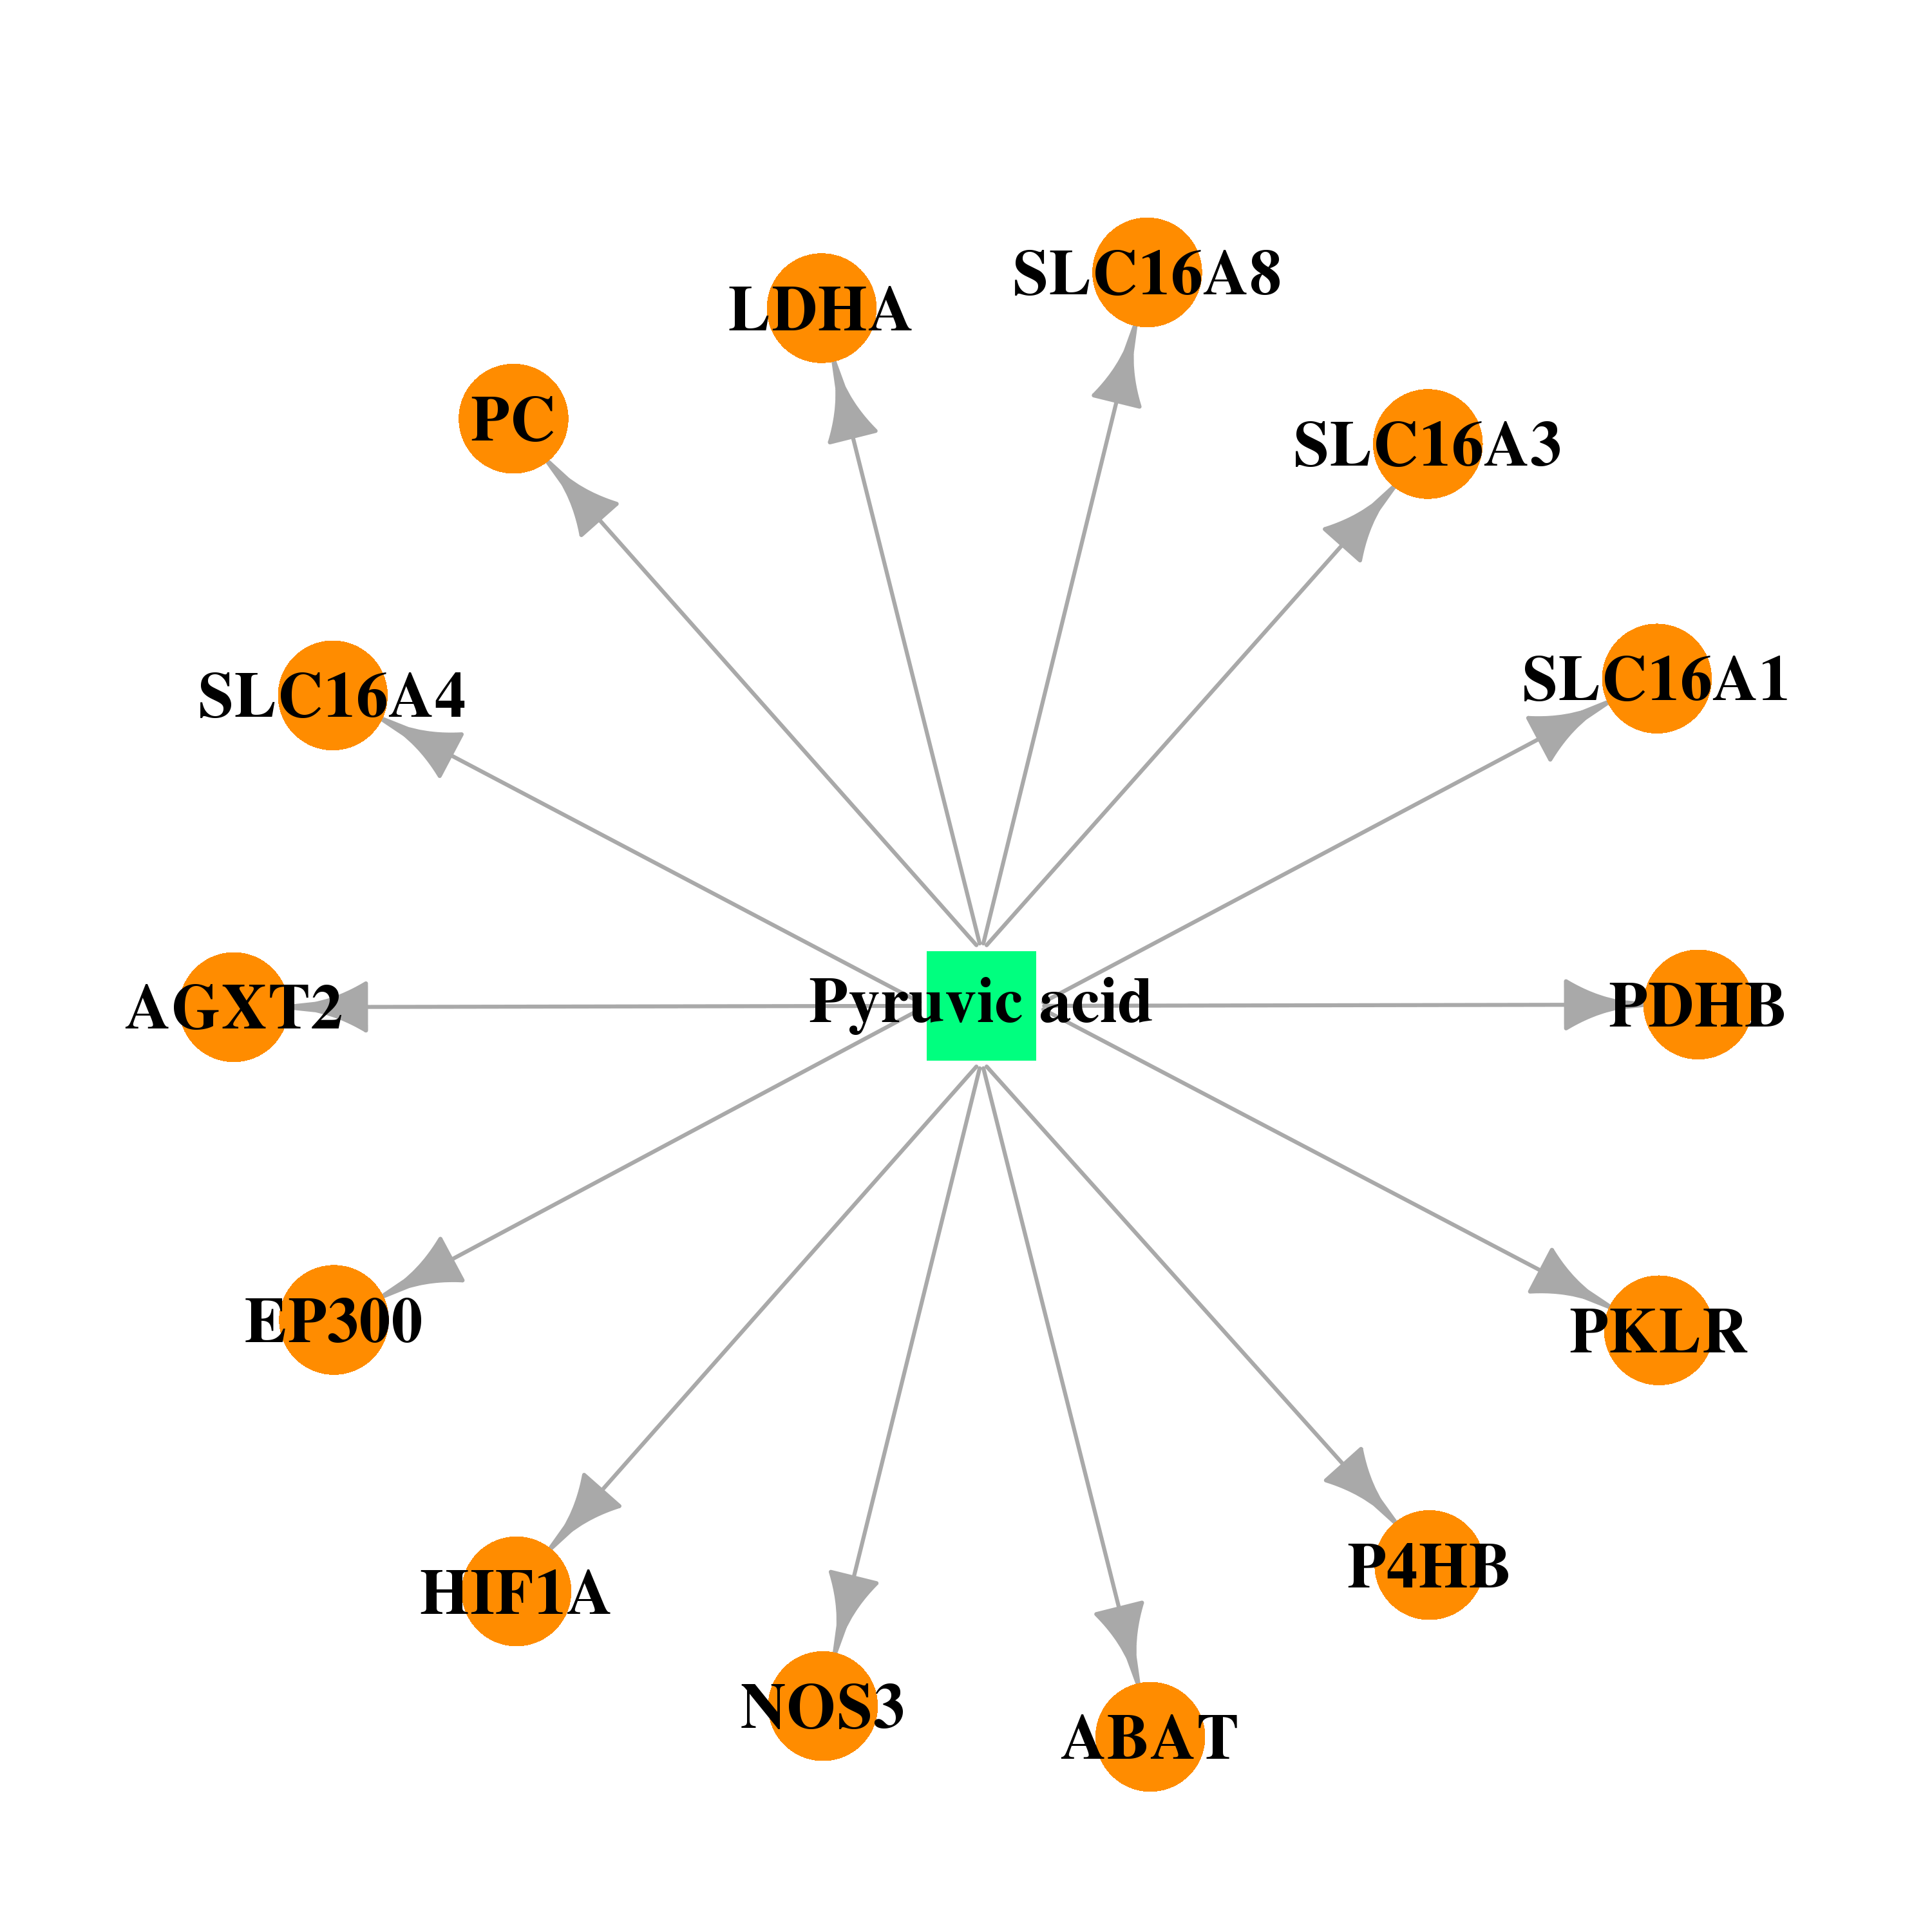 | 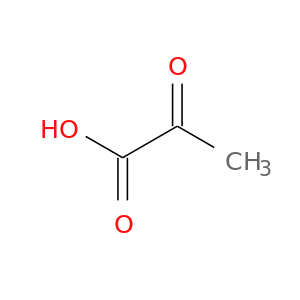 |
| Top |
| Cross referenced IDs for SLC16A3 |
| * We obtained these cross-references from Uniprot database. It covers 150 different DBs, 18 categories. http://www.uniprot.org/help/cross_references_section |
: Open all cross reference information
|
Copyright © 2016-Present - The Univsersity of Texas Health Science Center at Houston @ |