|
||||||||||||||||||||||||||||||||||||||||||||||||||||||||||||||||||||||||||||||||||||||||||||||||||||||||||||||||||||||||||||||||||||||||||||||||||||||||||||||||||||||||||||||||||||||||||||||||||||||||||||||||||||||||||||||||||||||||||||||||||||||||||||||||||||||||||||||||||||||||||||||||||||||||||||||||||||||||||
| |
| Phenotypic Information (metabolism pathway, cancer, disease, phenome) |
| |
| |
| Gene-Gene Network Information: Co-Expression Network, Interacting Genes & KEGG |
| |
|


| Gene Summary for DGKI |
| Top |
| Phenotypic Information for DGKI(metabolism pathway, cancer, disease, phenome) |
| Cancer | CGAP: DGKI |
| Familial Cancer Database: DGKI | |
| * This gene is included in those cancer gene databases. |
|
|
|
|
|
| . | ||||||||||||||||||||||||||||||||||||||||||||||||||||||||||||||||||||||||||||||||||||||||||||||||||||||||||||||||||||||||||||||||||||||||||||||||||||||||||||||||||||||||||||||||||||||||||||||||||||||||||||||||||||||||||||||||||||||||||||||||||||||||||||||||||||||||||||||||||||||||||||||||||||||||||||||||||||
Oncogene 1 | Significant driver gene in | |||||||||||||||||||||||||||||||||||||||||||||||||||||||||||||||||||||||||||||||||||||||||||||||||||||||||||||||||||||||||||||||||||||||||||||||||||||||||||||||||||||||||||||||||||||||||||||||||||||||||||||||||||||||||||||||||||||||||||||||||||||||||||||||||||||||||||||||||||||||||||||||||||||||||||||||||||||||||
| cf) number; DB name 1 Oncogene; http://nar.oxfordjournals.org/content/35/suppl_1/D721.long, 2 Tumor Suppressor gene; https://bioinfo.uth.edu/TSGene/, 3 Cancer Gene Census; http://www.nature.com/nrc/journal/v4/n3/abs/nrc1299.html, 4 CancerGenes; http://nar.oxfordjournals.org/content/35/suppl_1/D721.long, 5 Network of Cancer Gene; http://ncg.kcl.ac.uk/index.php, 1Therapeutic Vulnerabilities in Cancer; http://cbio.mskcc.org/cancergenomics/statius/ |
| KEGG_GLYCEROLIPID_METABOLISM KEGG_GLYCEROPHOSPHOLIPID_METABOLISM | |
| OMIM | 604072; gene. |
| Orphanet | |
| Disease | KEGG Disease: DGKI |
| MedGen: DGKI (Human Medical Genetics with Condition) | |
| ClinVar: DGKI | |
| Phenotype | MGI: DGKI (International Mouse Phenotyping Consortium) |
| PhenomicDB: DGKI | |
| Mutations for DGKI |
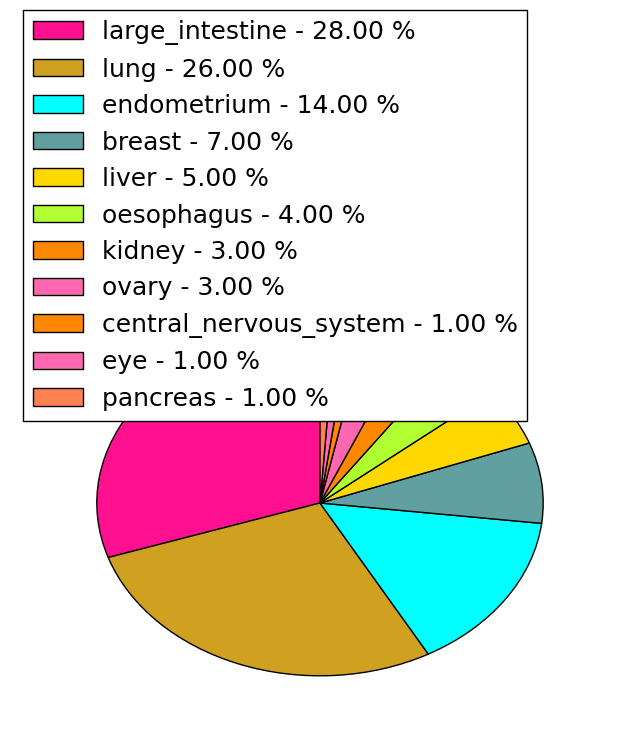
| * Under tables are showing count per each tissue to give us broad intuition about tissue specific mutation patterns.You can go to the detailed page for each mutation database's web site. |
| - Statistics for Tissue and Mutation type | Top |
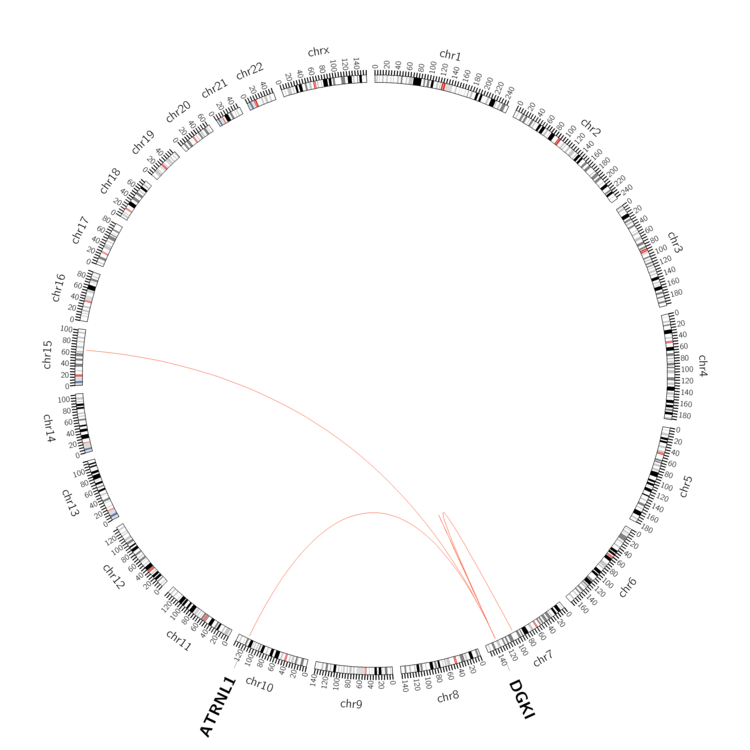 |
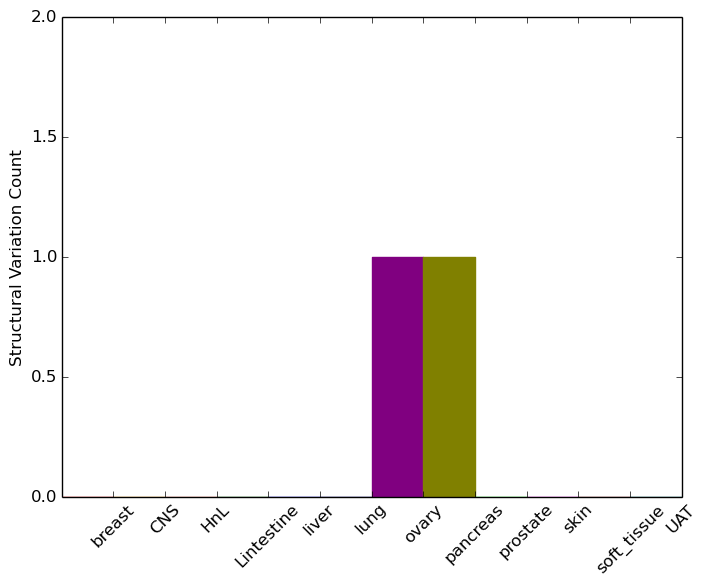
| - For Inter-chromosomal Variations |
| * Inter-chromosomal variantions includes 'interchromosomal amplicon to amplicon', 'interchromosomal amplicon to non-amplified dna', 'interchromosomal insertion', 'Interchromosomal unknown type'. |
 |
| - For Intra-chromosomal Variations |
| There's no intra-chromosomal structural variation. |
| Sample | Symbol_a | Chr_a | Start_a | End_a | Symbol_b | Chr_b | Start_b | End_b |
| ovary | DGKI | chr7 | 137249433 | 137249453 | chr7 | 102359990 | 102360010 | |
| ovary | DGKI | chr7 | 137344896 | 137344916 | DGKI | chr7 | 137344368 | 137344388 |
| ovary | DGKI | chr7 | 137493229 | 137493249 | chr15 | 65087616 | 65087636 | |
| ovary | DGKI | chr7 | 137513427 | 137513447 | DGKI | chr7 | 137509899 | 137509919 |
| pancreas | DGKI | chr7 | 137275912 | 137275932 | DGKI | chr7 | 137276197 | 137276217 |
| pancreas | DGKI | chr7 | 137280670 | 137280690 | ATRNL1 | chr10 | 117056109 | 117056129 |
| cf) Tissue number; Tissue name (1;Breast, 2;Central_nervous_system, 3;Haematopoietic_and_lymphoid_tissue, 4;Large_intestine, 5;Liver, 6;Lung, 7;Ovary, 8;Pancreas, 9;Prostate, 10;Skin, 11;Soft_tissue, 12;Upper_aerodigestive_tract) |
| * From mRNA Sanger sequences, Chitars2.0 arranged chimeric transcripts. This table shows DGKI related fusion information. |
| ID | Head Gene | Tail Gene | Accession | Gene_a | qStart_a | qEnd_a | Chromosome_a | tStart_a | tEnd_a | Gene_a | qStart_a | qEnd_a | Chromosome_a | tStart_a | tEnd_a |
| BF962288 | DGKI | 14 | 58 | 7 | 137466791 | 137466835 | RAPGEF4 | 56 | 219 | 2 | 173901377 | 173916432 | |
| AA665202 | CCDC152 | 1 | 133 | 5 | 42800293 | 42800425 | DGKI | 123 | 142 | 7 | 137390839 | 137390858 | |
| BF357704 | SP140 | 8 | 29 | 2 | 231118475 | 231118497 | DGKI | 13 | 441 | 7 | 137498017 | 137498447 | |
| BF948083 | DGKI | 14 | 219 | 7 | 137078838 | 137079042 | RBFOX1 | 200 | 531 | 16 | 6809509 | 6809840 | |
| Top |
| Mutation type/ Tissue ID | brca | cns | cerv | endome | haematopo | kidn | Lintest | liver | lung | ns | ovary | pancre | prost | skin | stoma | thyro | urina | |||
| Total # sample | 6 | 1 | 1 | 1 | 1 | 7 | ||||||||||||||
| GAIN (# sample) | 6 | 1 | 1 | 1 | 1 | 7 | ||||||||||||||
| LOSS (# sample) |
| cf) Tissue ID; Tissue type (1; Breast, 2; Central_nervous_system, 3; Cervix, 4; Endometrium, 5; Haematopoietic_and_lymphoid_tissue, 6; Kidney, 7; Large_intestine, 8; Liver, 9; Lung, 10; NS, 11; Ovary, 12; Pancreas, 13; Prostate, 14; Skin, 15; Stomach, 16; Thyroid, 17; Urinary_tract) |
| Top |
|
 |
| Top |
| Stat. for Non-Synonymous SNVs (# total SNVs=138) | (# total SNVs=40) |
 |  |
(# total SNVs=0) | (# total SNVs=0) |
| Top |
| * When you move the cursor on each content, you can see more deailed mutation information on the Tooltip. Those are primary_site,primary_histology,mutation(aa),pubmedID. |
| GRCh37 position | Mutation(aa) | Unique sampleID count |
| chr7:137206693-137206693 | p.R723C | 8 |
| chr7:137263038-137263038 | p.R559Q | 4 |
| chr7:137263039-137263039 | p.R559* | 4 |
| chr7:137282621-137282621 | p.R428Q | 3 |
| chr7:137148282-137148282 | p.Y904* | 3 |
| chr7:137092711-137092711 | p.L952L | 2 |
| chr7:137237203-137237203 | p.A687T | 2 |
| chr7:137374662-137374662 | p.P163H | 2 |
| chr7:137092651-137092651 | p.G972R | 2 |
| chr7:137170135-137170135 | p.Q804H | 2 |
| Top |
|
 |
| Point Mutation/ Tissue ID | 1 | 2 | 3 | 4 | 5 | 6 | 7 | 8 | 9 | 10 | 11 | 12 | 13 | 14 | 15 | 16 | 17 | 18 | 19 | 20 |
| # sample | 5 | 7 | 22 | 1 | 9 | 3 | 32 | 12 | 4 | 27 | 14 | 16 | ||||||||
| # mutation | 5 | 7 | 23 | 1 | 10 | 3 | 37 | 14 | 4 | 29 | 14 | 28 | ||||||||
| nonsynonymous SNV | 5 | 6 | 21 | 1 | 8 | 1 | 27 | 12 | 3 | 19 | 10 | 17 | ||||||||
| synonymous SNV | 1 | 2 | 2 | 2 | 10 | 2 | 1 | 10 | 4 | 11 |
| cf) Tissue ID; Tissue type (1; BLCA[Bladder Urothelial Carcinoma], 2; BRCA[Breast invasive carcinoma], 3; CESC[Cervical squamous cell carcinoma and endocervical adenocarcinoma], 4; COAD[Colon adenocarcinoma], 5; GBM[Glioblastoma multiforme], 6; Glioma Low Grade, 7; HNSC[Head and Neck squamous cell carcinoma], 8; KICH[Kidney Chromophobe], 9; KIRC[Kidney renal clear cell carcinoma], 10; KIRP[Kidney renal papillary cell carcinoma], 11; LAML[Acute Myeloid Leukemia], 12; LUAD[Lung adenocarcinoma], 13; LUSC[Lung squamous cell carcinoma], 14; OV[Ovarian serous cystadenocarcinoma ], 15; PAAD[Pancreatic adenocarcinoma], 16; PRAD[Prostate adenocarcinoma], 17; SKCM[Skin Cutaneous Melanoma], 18:STAD[Stomach adenocarcinoma], 19:THCA[Thyroid carcinoma], 20:UCEC[Uterine Corpus Endometrial Carcinoma]) |
| Top |
| * We represented just top 10 SNVs. When you move the cursor on each content, you can see more deailed mutation information on the Tooltip. Those are primary_site, primary_histology, mutation(aa), pubmedID. |
| Genomic Position | Mutation(aa) | Unique sampleID count |
| chr7:137237203 | p.R428Q | 2 |
| chr7:137339506 | p.R575I | 2 |
| chr7:137172389 | p.P816L | 2 |
| chr7:137374734 | p.R1006W | 2 |
| chr7:137263038 | p.R559Q | 2 |
| chr7:137271945 | p.Q804H | 2 |
| chr7:137172424 | p.R139Q | 2 |
| chr7:137075986 | p.E985K | 2 |
| chr7:137154346 | p.R237L | 2 |
| chr7:137080409 | p.D1060Y | 2 |
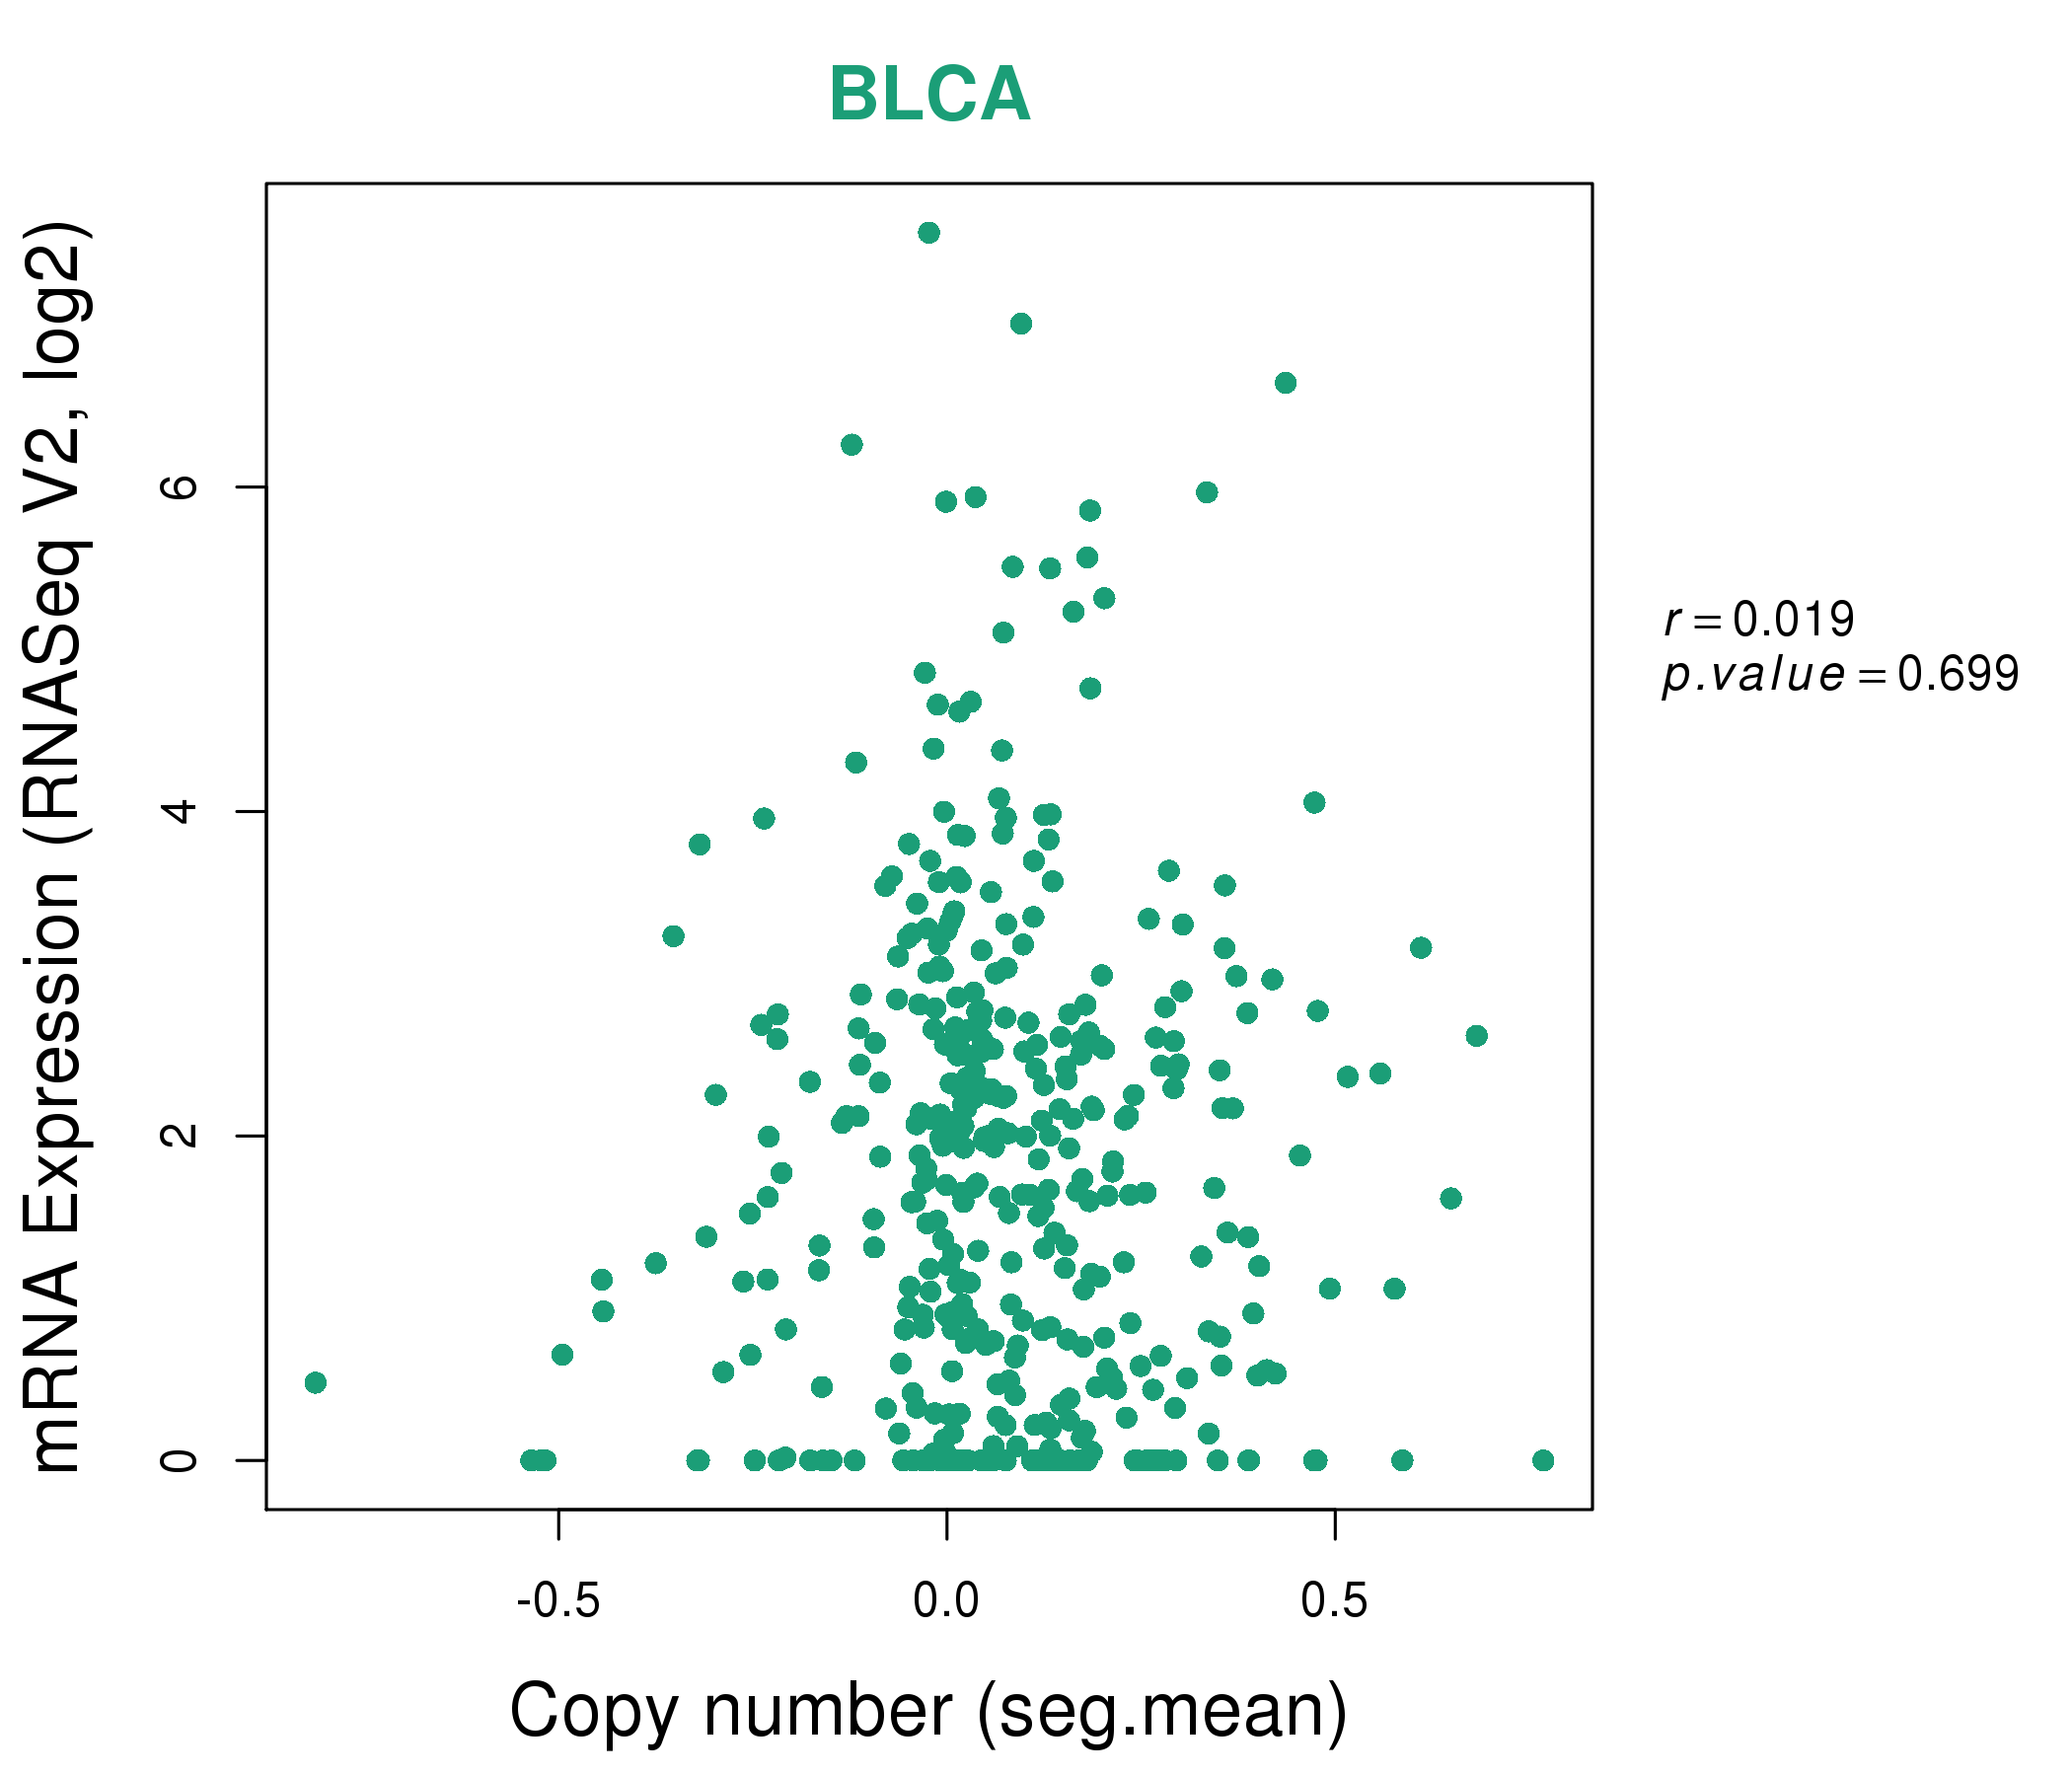
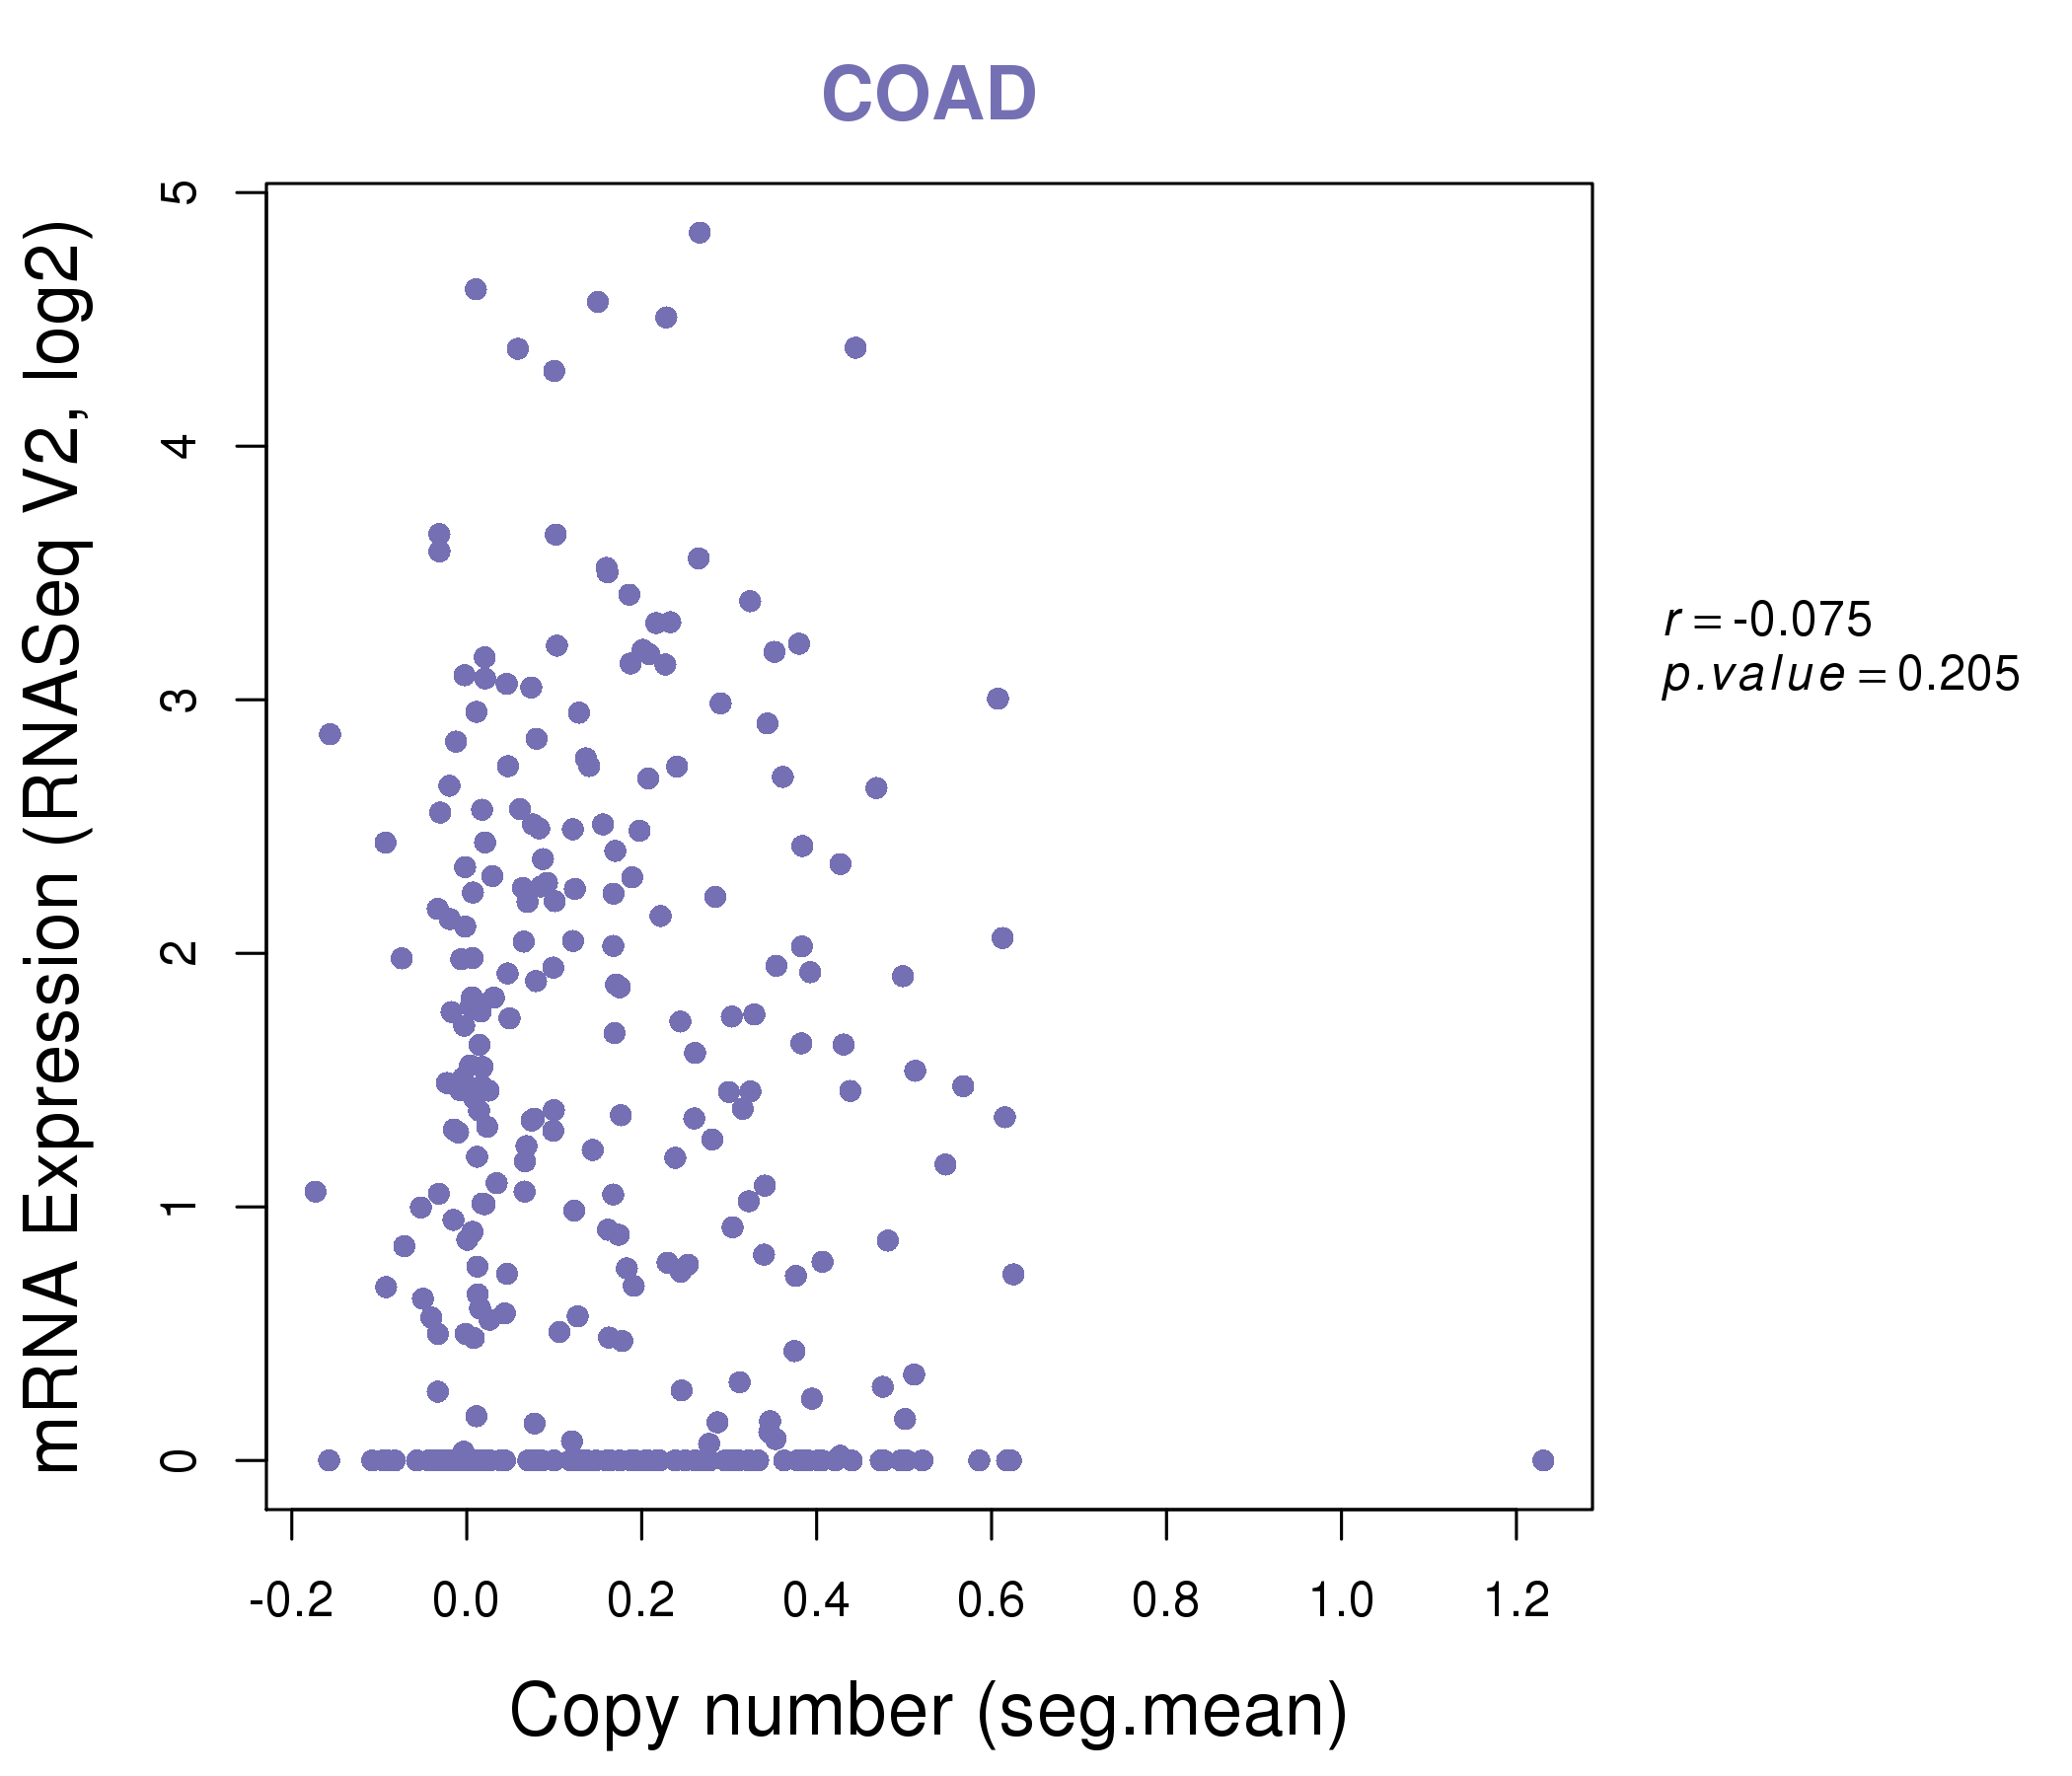
| * Copy number data were extracted from TCGA using R package TCGA-Assembler. The URLs of all public data files on TCGA DCC data server were gathered on Jan-05-2015. Function ProcessCNAData in TCGA-Assembler package was used to obtain gene-level copy number value which is calculated as the average copy number of the genomic region of a gene. |
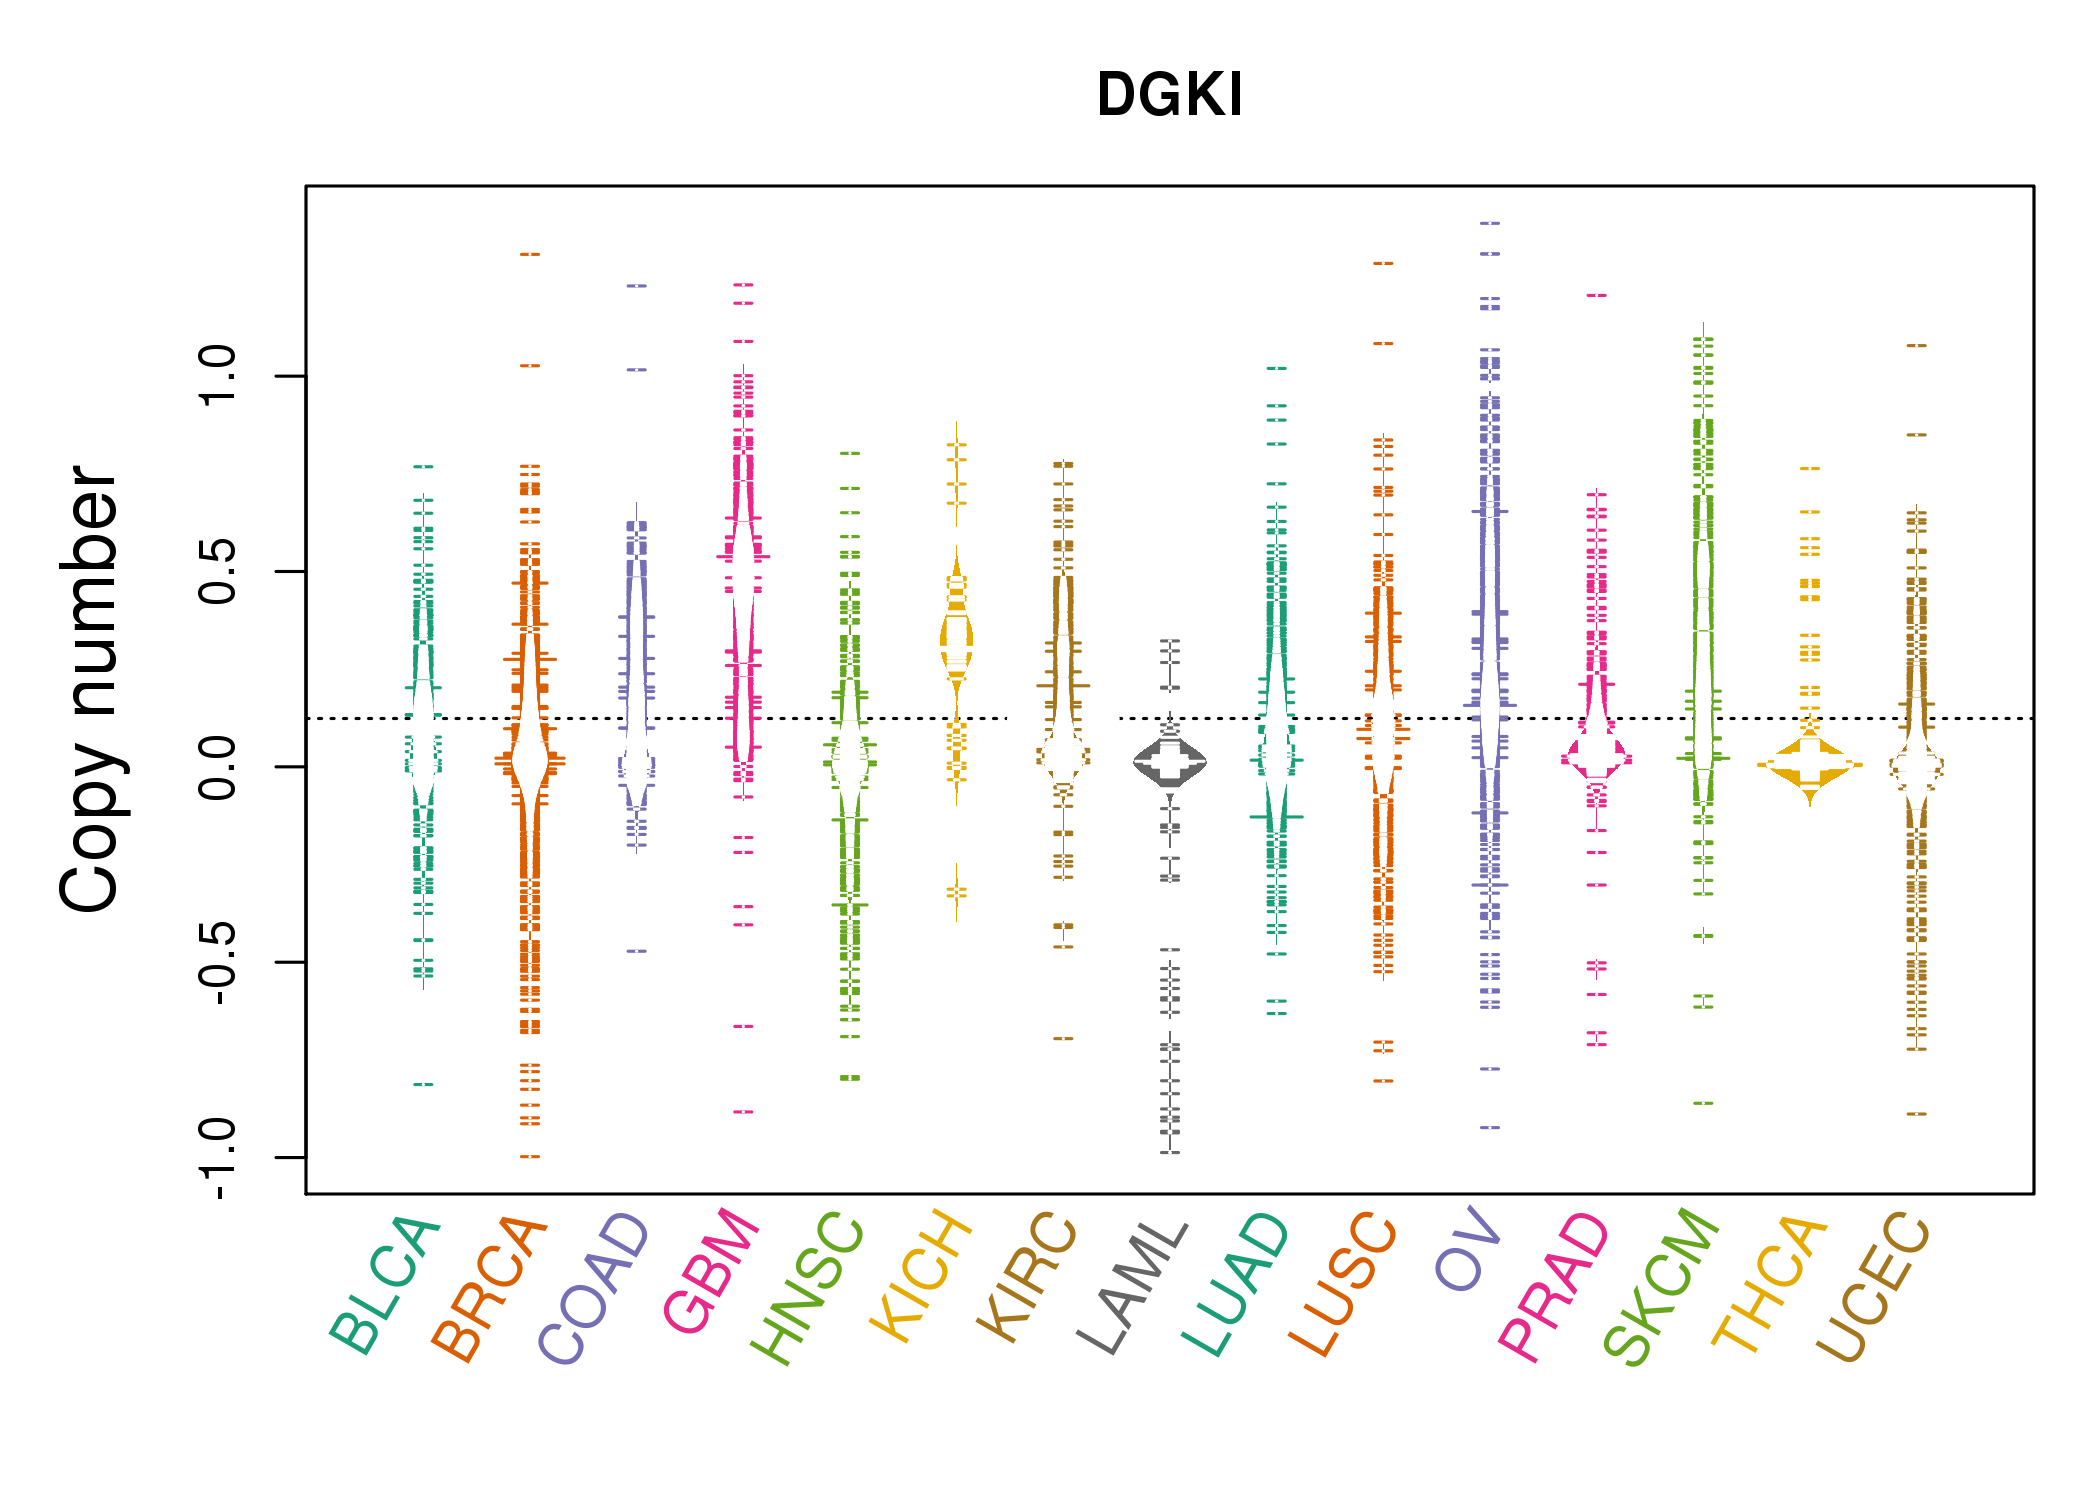 |
| cf) Tissue ID[Tissue type]: BLCA[Bladder Urothelial Carcinoma], BRCA[Breast invasive carcinoma], CESC[Cervical squamous cell carcinoma and endocervical adenocarcinoma], COAD[Colon adenocarcinoma], GBM[Glioblastoma multiforme], Glioma Low Grade, HNSC[Head and Neck squamous cell carcinoma], KICH[Kidney Chromophobe], KIRC[Kidney renal clear cell carcinoma], KIRP[Kidney renal papillary cell carcinoma], LAML[Acute Myeloid Leukemia], LUAD[Lung adenocarcinoma], LUSC[Lung squamous cell carcinoma], OV[Ovarian serous cystadenocarcinoma ], PAAD[Pancreatic adenocarcinoma], PRAD[Prostate adenocarcinoma], SKCM[Skin Cutaneous Melanoma], STAD[Stomach adenocarcinoma], THCA[Thyroid carcinoma], UCEC[Uterine Corpus Endometrial Carcinoma] |
| Top |
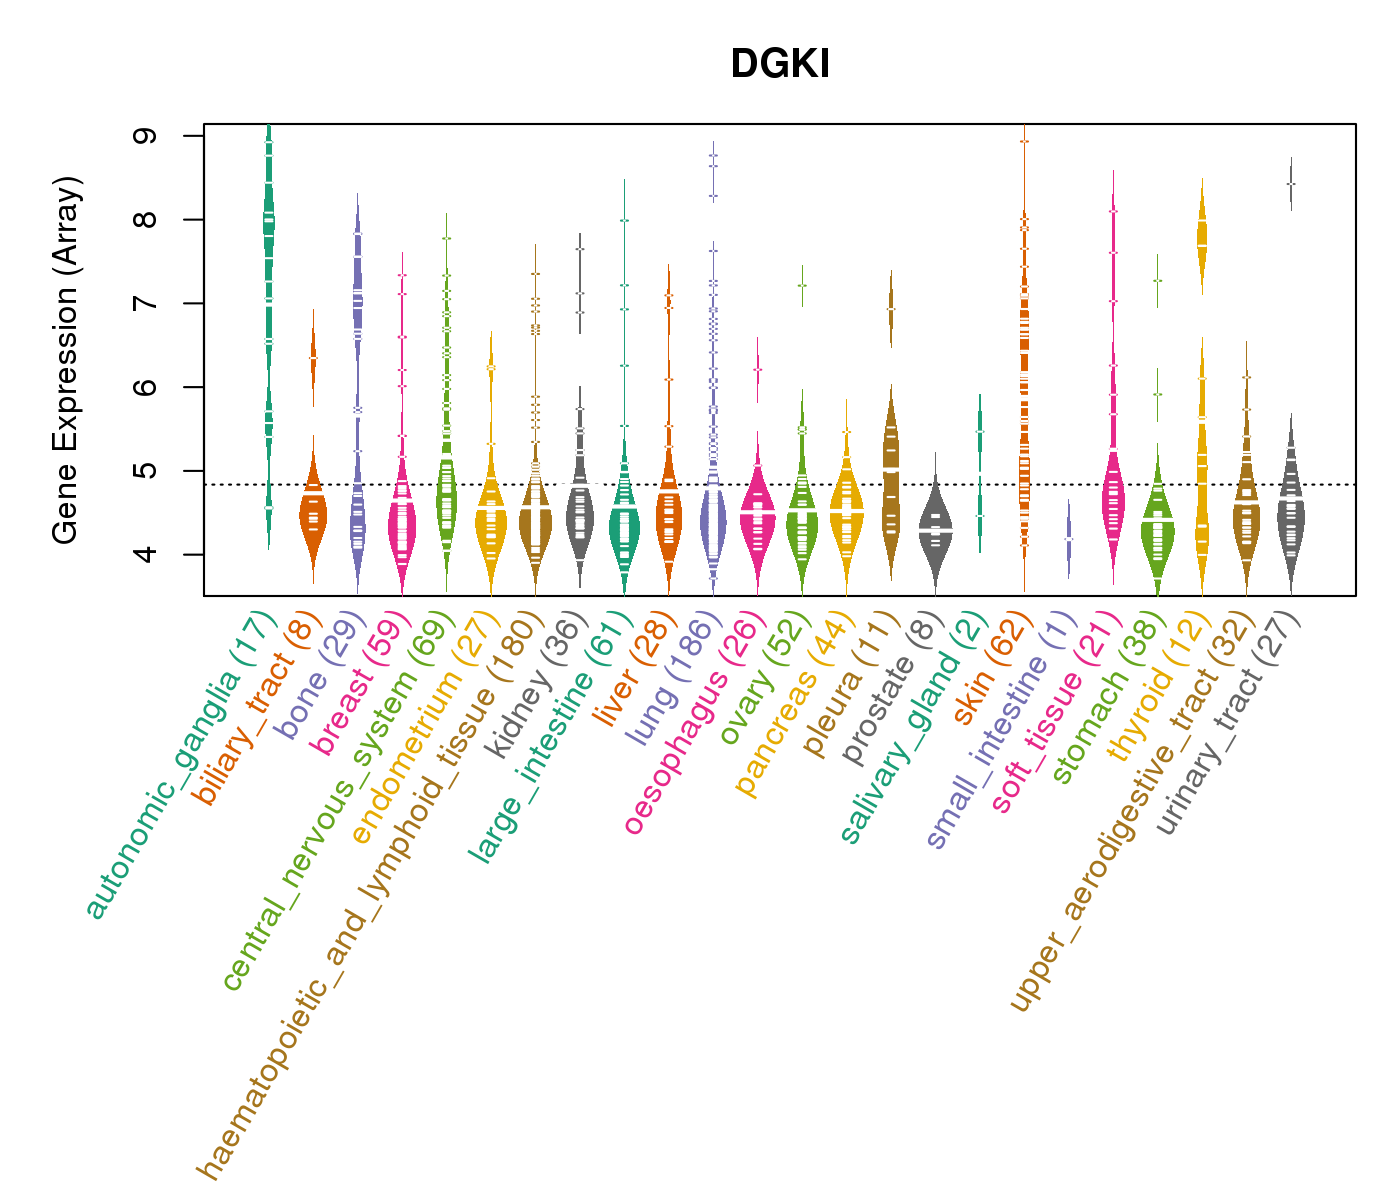
| Gene Expression for DGKI |
| * CCLE gene expression data were extracted from CCLE_Expression_Entrez_2012-10-18.res: Gene-centric RMA-normalized mRNA expression data. |
 |
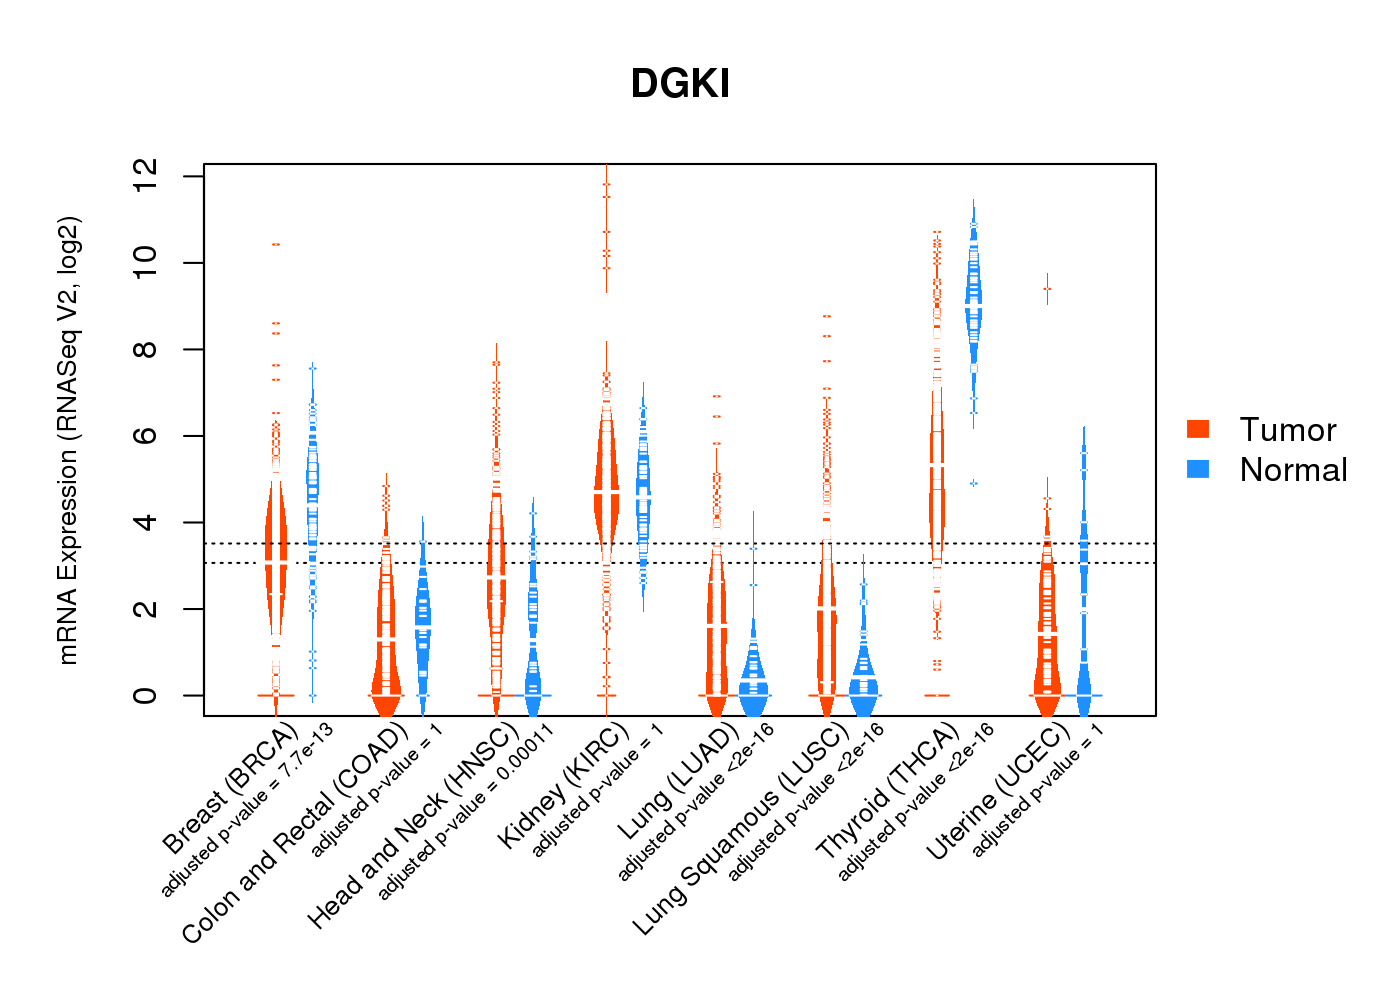
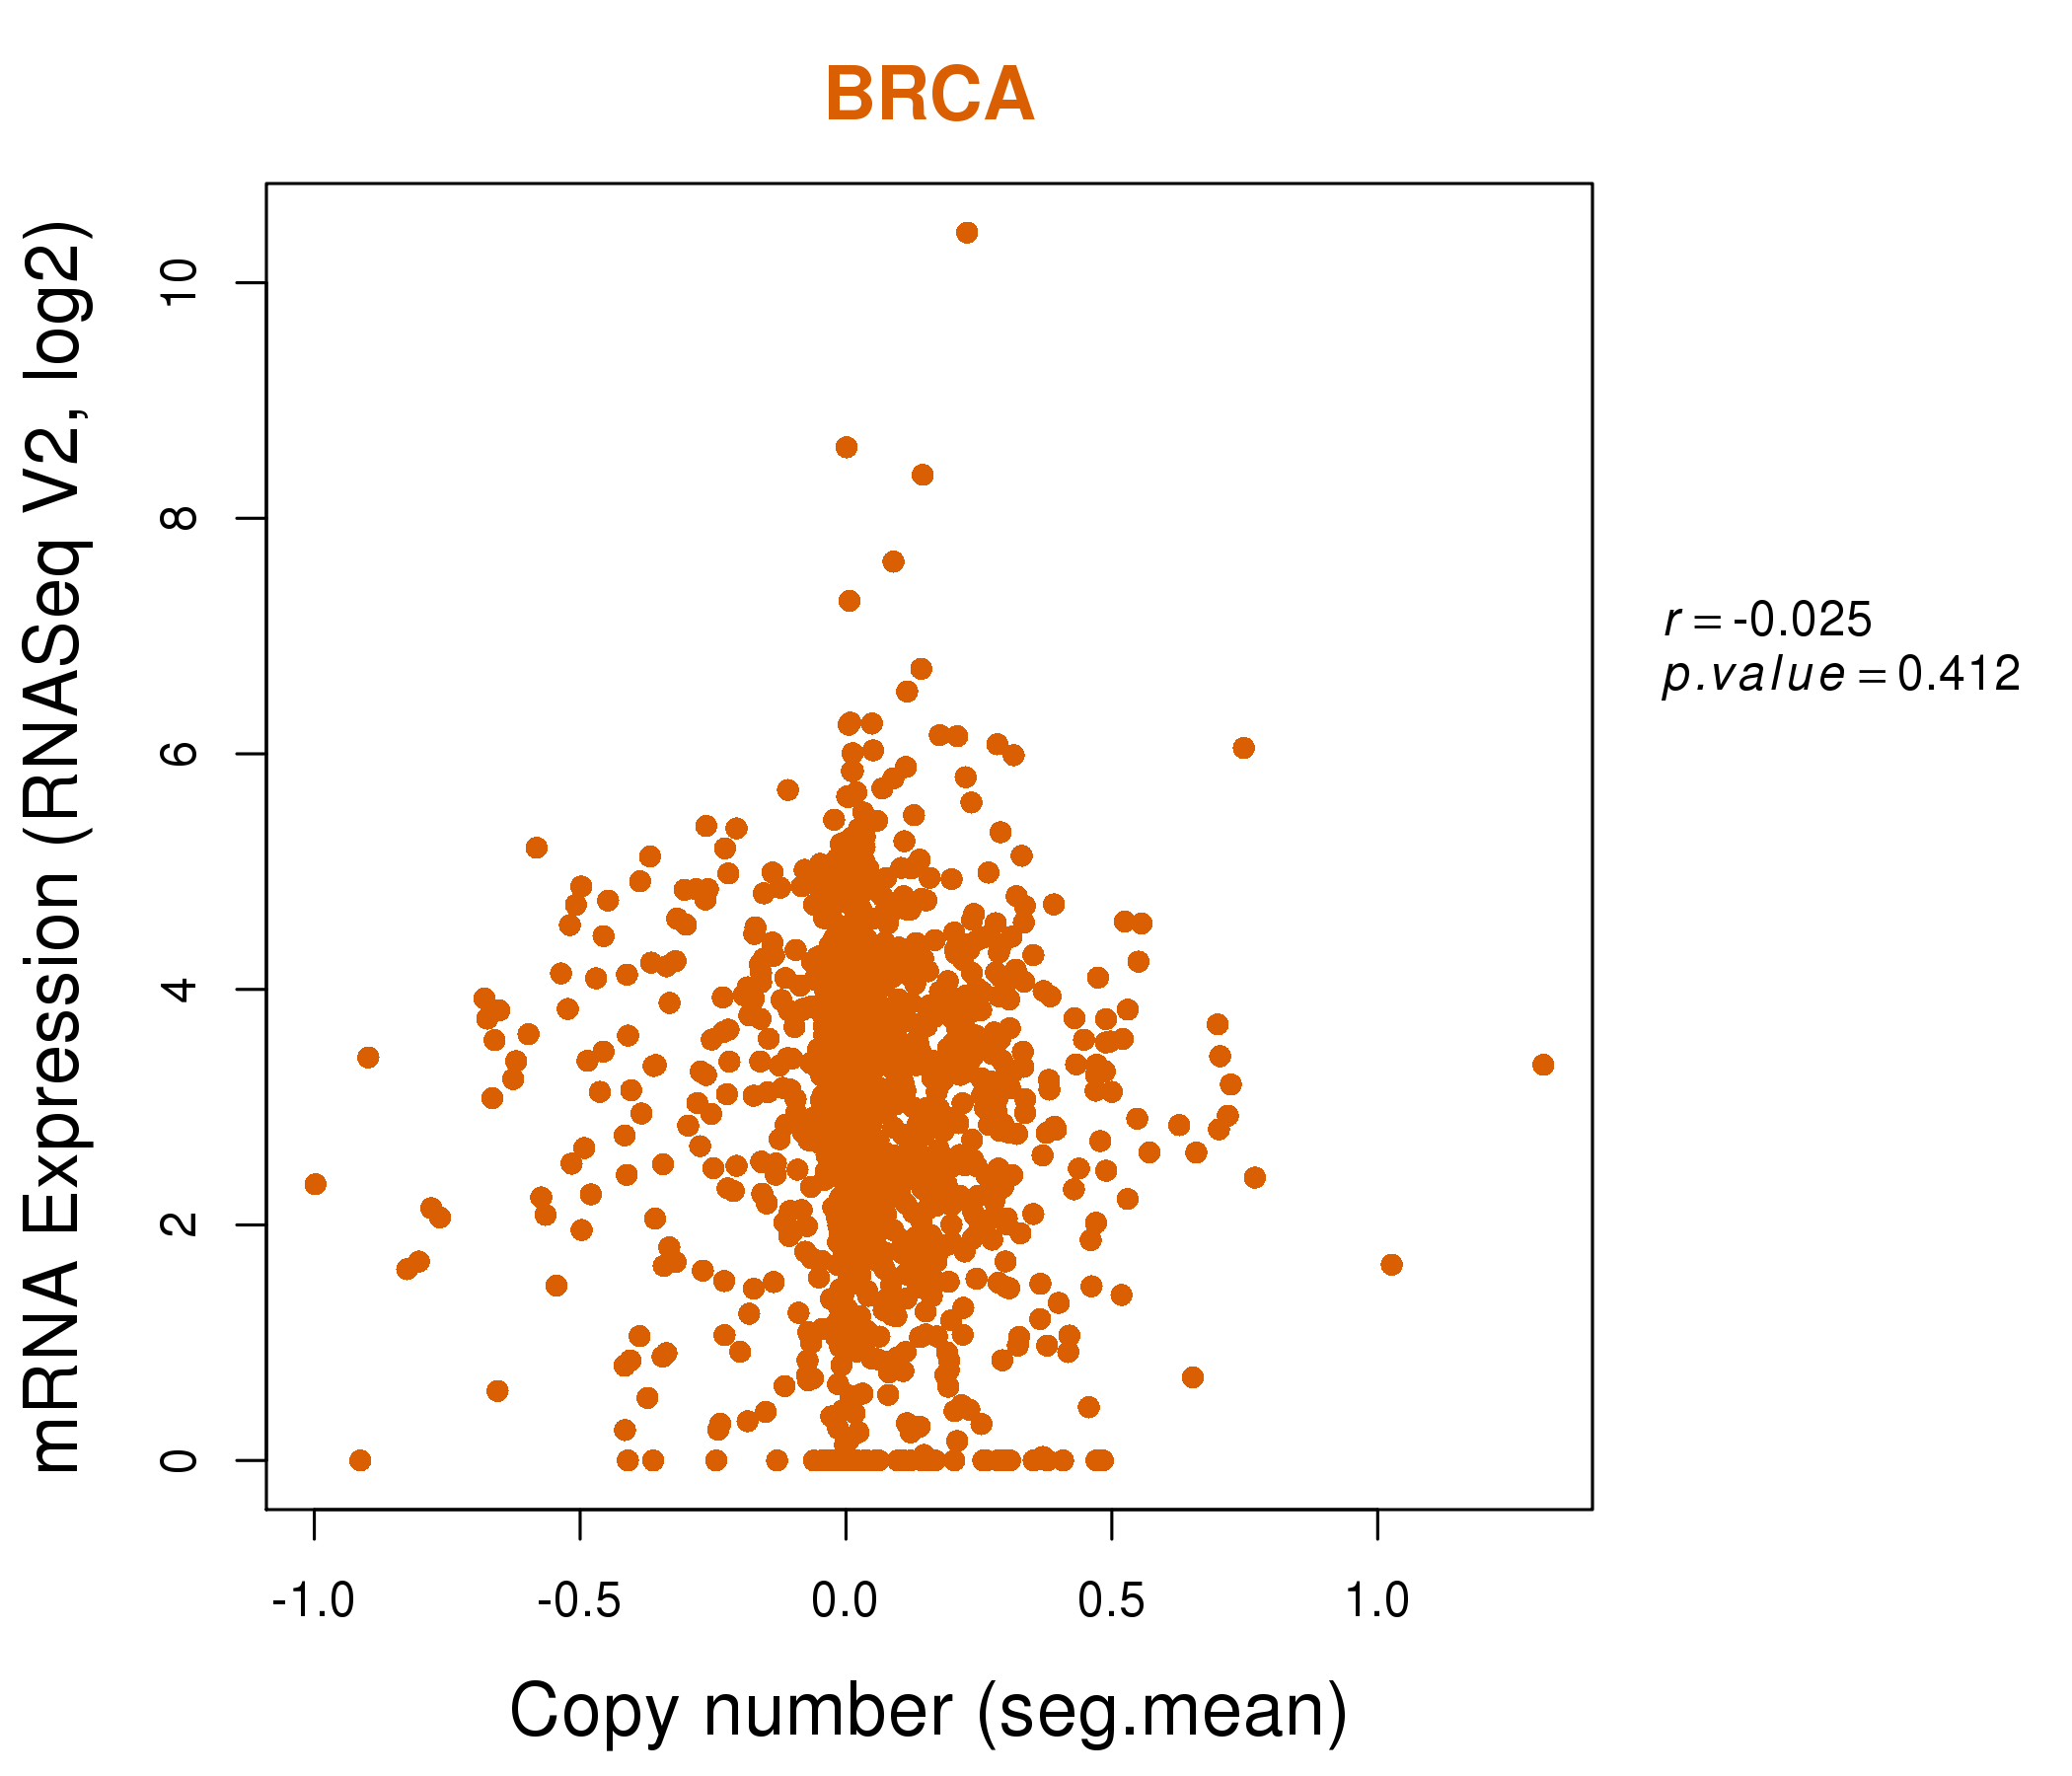
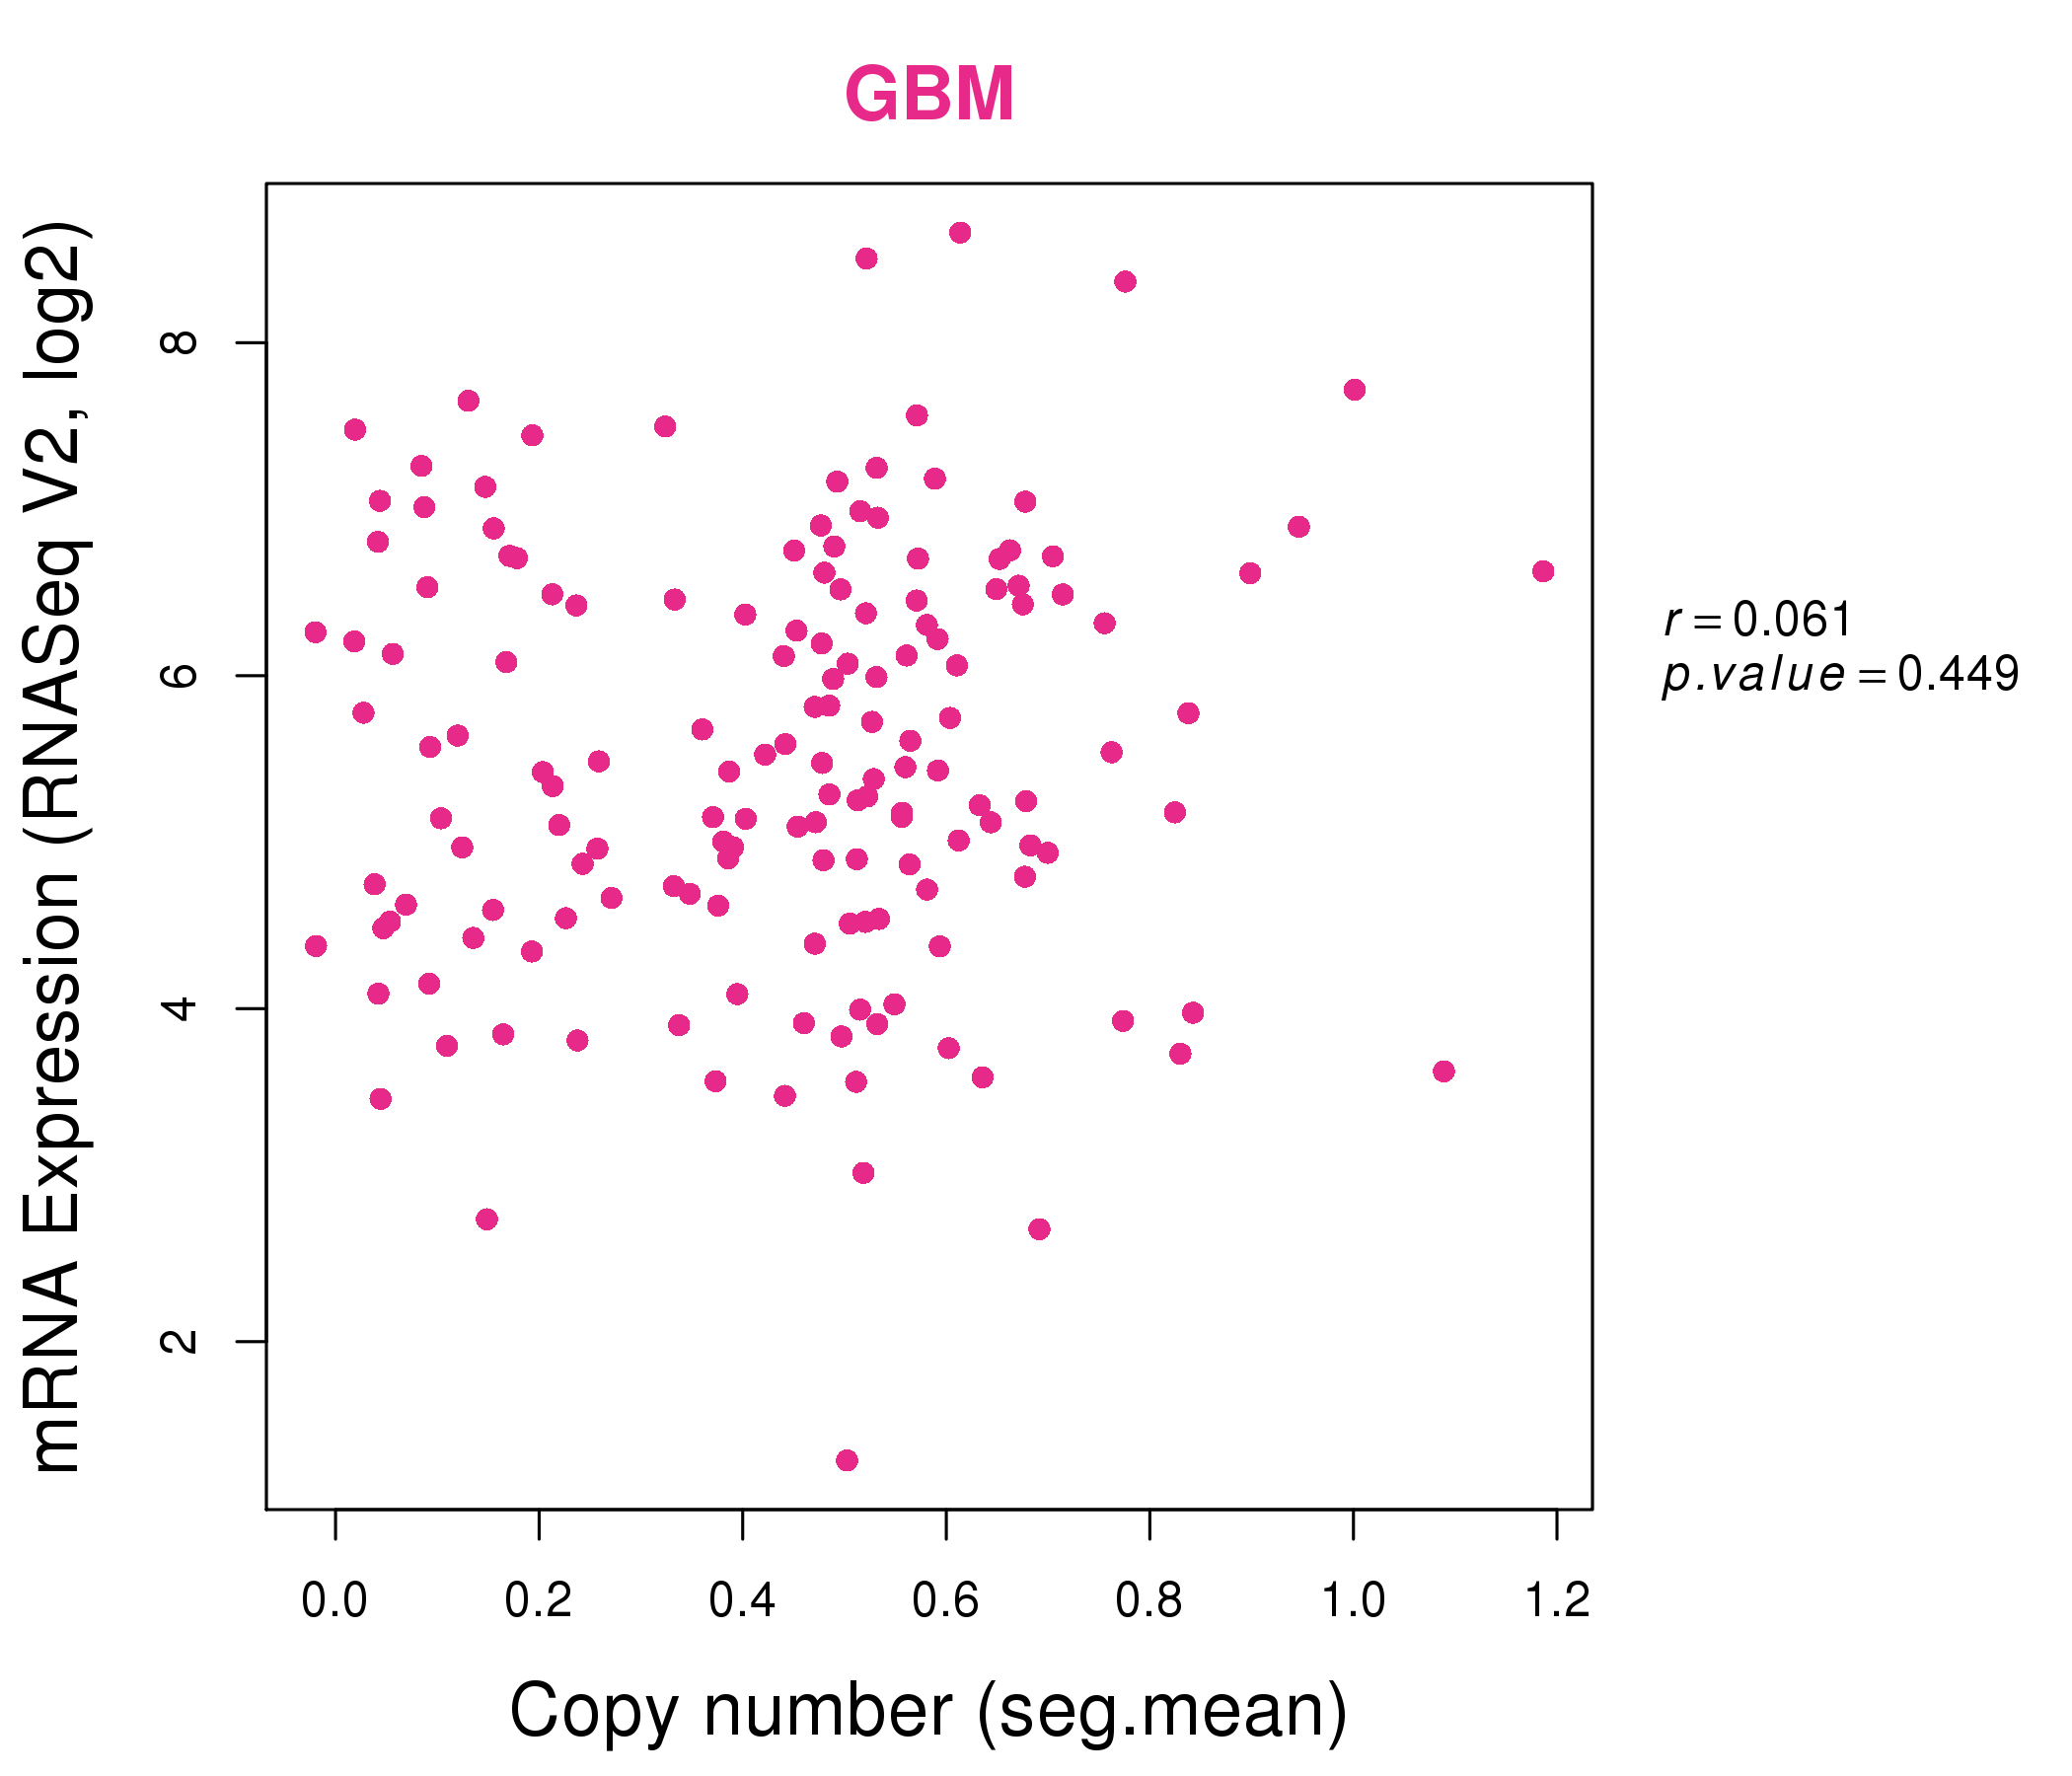
| * Normalized gene expression data of RNASeqV2 was extracted from TCGA using R package TCGA-Assembler. The URLs of all public data files on TCGA DCC data server were gathered at Jan-05-2015. Only eight cancer types have enough normal control samples for differential expression analysis. (t test, adjusted p<0.05 (using Benjamini-Hochberg FDR)) |
 |
| Top |
| * This plots show the correlation between CNV and gene expression. |
: Open all plots for all cancer types
 |
|
 |
|
| Top |
| Gene-Gene Network Information |
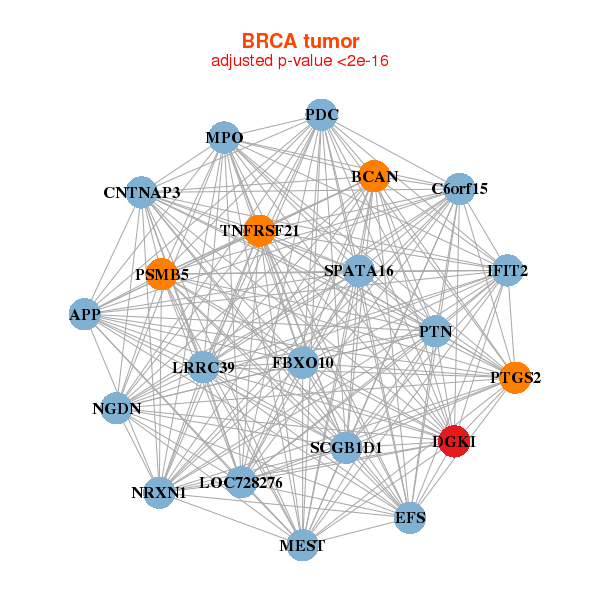
| * Co-Expression network figures were drawn using R package igraph. Only the top 20 genes with the highest correlations were shown. Red circle: input gene, orange circle: cell metabolism gene, sky circle: other gene |
: Open all plots for all cancer types
 |
|
| APP,BCAN,C6orf15,CNTNAP3,DGKI,EFS,FBXO10, IFIT2,LOC728276,LRRC39,MEST,MPO,NGDN,NRXN1, PDC,PSMB5,PTGS2,PTN,SCGB1D1,SPATA16,TNFRSF21 | AHNAK,ARHGAP21,ATL3,ATP9A,CHRDL1,COBLL1,DDR2, DGKI,ECM2,GLP2R,ITGA1,ITGB1,ITSN1,LPGAT1, PARD3B,PDZD2,PEAK1,SORBS1,SPTBN1,UTRN,CHMP3 |
 |
|
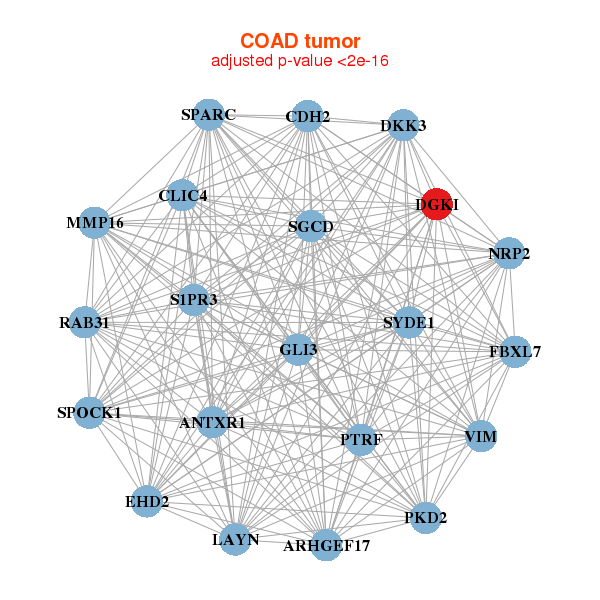
| ANTXR1,ARHGEF17,CDH2,CLIC4,DGKI,DKK3,EHD2, FBXL7,GLI3,LAYN,MMP16,NRP2,PKD2,PTRF, RAB31,S1PR3,SGCD,SPARC,SPOCK1,SYDE1,VIM | ADAM33,C20orf194,CACNA2D1,CHST3,COL6A2,COL8A1,CSDC2, DGKI,EVC,FGFR1,GLI3,MTCL1,NFATC4,NPR2, PRELP,RBMS3,RUSC2,SACS,SDK1,SSC5D,ZNF532 |
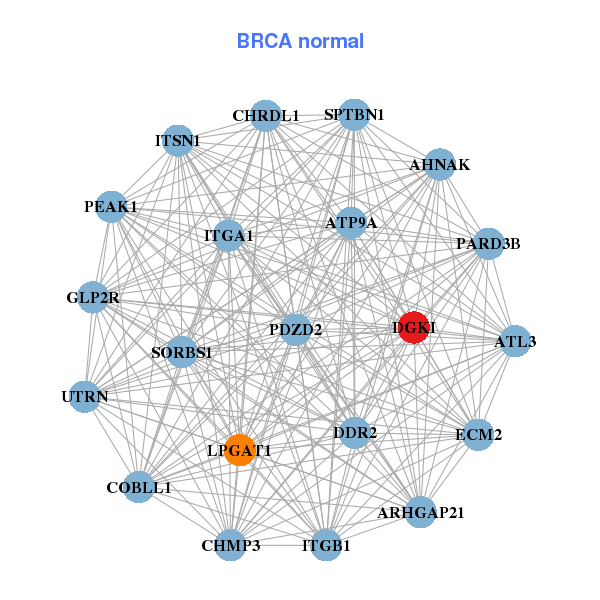
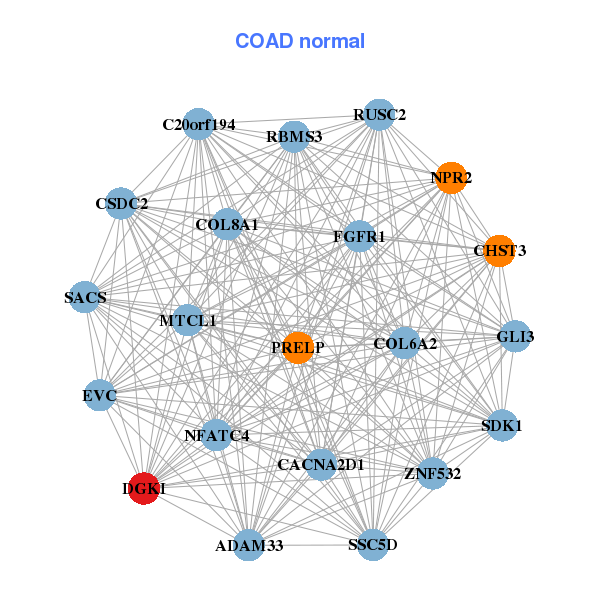
| * Co-Expression network figures were drawn using R package igraph. Only the top 20 genes with the highest correlations were shown. Red circle: input gene, orange circle: cell metabolism gene, sky circle: other gene |
: Open all plots for all cancer types
| Top |
: Open all interacting genes' information including KEGG pathway for all interacting genes from DAVID
| Top |
| Pharmacological Information for DGKI |
| There's no related Drug. |
| Top |
| Cross referenced IDs for DGKI |
| * We obtained these cross-references from Uniprot database. It covers 150 different DBs, 18 categories. http://www.uniprot.org/help/cross_references_section |
: Open all cross reference information
|
Copyright © 2016-Present - The Univsersity of Texas Health Science Center at Houston @ |