|
||||||||||||||||||||
| |
| Phenotypic Information (metabolism pathway, cancer, disease, phenome) |
| |
| |
| Gene-Gene Network Information: Co-Expression Network, Interacting Genes & KEGG |
| |
|


| Gene Summary for ACY3 |
| Basic gene info. | Gene symbol | ACY3 |
| Gene name | aspartoacylase (aminocyclase) 3 | |
| Synonyms | ACY-3|HCBP1 | |
| Cytomap | UCSC genome browser: 11q13.2 | |
| Genomic location | chr11 :67410025-67418130 | |
| Type of gene | protein-coding | |
| RefGenes | NM_080658.1, | |
| Ensembl id | ENSG00000132744 | |
| Description | HCV core-binding protein 1N-acyl-aromatic-L-amino acid amidohydrolase (carboxylate-forming)acylase IIIaminoacylase-3aspartoacylase-2hepatitis C virus core-binding protein 1 | |
| Modification date | 20141207 | |
| dbXrefs | MIM : 614413 | |
| HGNC : HGNC | ||
| Ensembl : ENSG00000132744 | ||
| HPRD : 12422 | ||
| Vega : OTTHUMG00000167283 | ||
| Protein | UniProt: go to UniProt's Cross Reference DB Table | |
| Expression | CleanEX: HS_ACY3 | |
| BioGPS: 91703 | ||
| Gene Expression Atlas: ENSG00000132744 | ||
| The Human Protein Atlas: ENSG00000132744 | ||
| Pathway | NCI Pathway Interaction Database: ACY3 | |
| KEGG: ACY3 | ||
| REACTOME: ACY3 | ||
| ConsensusPathDB | ||
| Pathway Commons: ACY3 | ||
| Metabolism | MetaCyc: ACY3 | |
| HUMANCyc: ACY3 | ||
| Regulation | Ensembl's Regulation: ENSG00000132744 | |
| miRBase: chr11 :67,410,025-67,418,130 | ||
| TargetScan: NM_080658 | ||
| cisRED: ENSG00000132744 | ||
| Context | iHOP: ACY3 | |
| cancer metabolism search in PubMed: ACY3 | ||
| UCL Cancer Institute: ACY3 | ||
| Assigned class in ccmGDB | C | |
| Top |
| Phenotypic Information for ACY3(metabolism pathway, cancer, disease, phenome) |
| Cancer | CGAP: ACY3 |
| Familial Cancer Database: ACY3 | |
| * This gene is included in those cancer gene databases. |
|
|
|
|
|
|
| ||||||||||||||
Oncogene 1 | Significant driver gene in | |||||||||||||||||||
| cf) number; DB name 1 Oncogene; http://nar.oxfordjournals.org/content/35/suppl_1/D721.long, 2 Tumor Suppressor gene; https://bioinfo.uth.edu/TSGene/, 3 Cancer Gene Census; http://www.nature.com/nrc/journal/v4/n3/abs/nrc1299.html, 4 CancerGenes; http://nar.oxfordjournals.org/content/35/suppl_1/D721.long, 5 Network of Cancer Gene; http://ncg.kcl.ac.uk/index.php, 1Therapeutic Vulnerabilities in Cancer; http://cbio.mskcc.org/cancergenomics/statius/ |
| KEGG_ALANINE_ASPARTATE_AND_GLUTAMATE_METABOLISM KEGG_HISTIDINE_METABOLISM | |
| OMIM | |
| Orphanet | |
| Disease | KEGG Disease: ACY3 |
| MedGen: ACY3 (Human Medical Genetics with Condition) | |
| ClinVar: ACY3 | |
| Phenotype | MGI: ACY3 (International Mouse Phenotyping Consortium) |
| PhenomicDB: ACY3 | |
| Mutations for ACY3 |
| * Under tables are showing count per each tissue to give us broad intuition about tissue specific mutation patterns.You can go to the detailed page for each mutation database's web site. |
| There's no structural variation information in COSMIC data for this gene. |
| * From mRNA Sanger sequences, Chitars2.0 arranged chimeric transcripts. This table shows ACY3 related fusion information. |
| ID | Head Gene | Tail Gene | Accession | Gene_a | qStart_a | qEnd_a | Chromosome_a | tStart_a | tEnd_a | Gene_a | qStart_a | qEnd_a | Chromosome_a | tStart_a | tEnd_a |
| Top |
| There's no copy number variation information in COSMIC data for this gene. |
| Top |
|
 |
| Top |
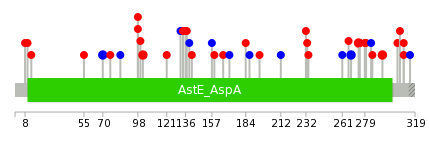
| Stat. for Non-Synonymous SNVs (# total SNVs=20) | (# total SNVs=6) |
 |  |
(# total SNVs=1) | (# total SNVs=0) |
 |
| Top |
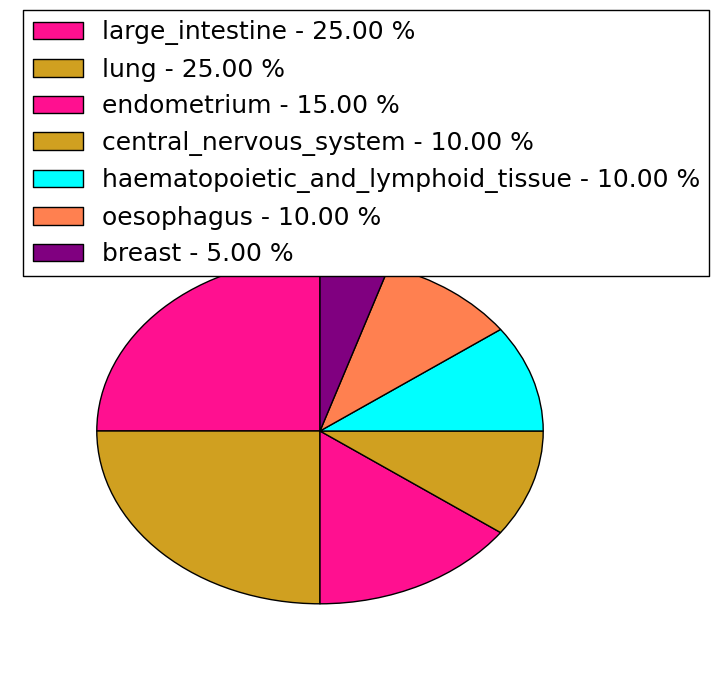
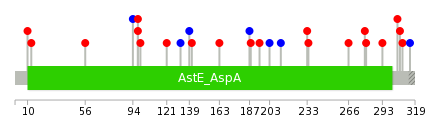
| * When you move the cursor on each content, you can see more deailed mutation information on the Tooltip. Those are primary_site,primary_histology,mutation(aa),pubmedID. |
| GRCh37 position | Mutation(aa) | Unique sampleID count |
| chr11:67410278-67410278 | p.V293I | 2 |
| chr11:67414305-67414305 | p.N70N | 2 |
| chr11:67410335-67410335 | p.G274R | 2 |
| chr11:67410351-67410351 | p.E268E | 2 |
| chr11:67413290-67413290 | p.P102L | 2 |
| chr11:67412813-67412813 | p.Y157Y | 1 |
| chr11:67413302-67413302 | p.Q98L | 1 |
| chr11:67412275-67412275 | p.T234A | 1 |
| chr11:67412828-67412828 | p.C152* | 1 |
| chr11:67410302-67410302 | p.E285K | 1 |
| Top |
|
 |
| Point Mutation/ Tissue ID | 1 | 2 | 3 | 4 | 5 | 6 | 7 | 8 | 9 | 10 | 11 | 12 | 13 | 14 | 15 | 16 | 17 | 18 | 19 | 20 |
| # sample | 1 | 3 | 1 | 4 | 1 | 3 | 3 | 1 | 4 | 1 | 4 | |||||||||
| # mutation | 1 | 3 | 1 | 4 | 1 | 4 | 3 | 1 | 4 | 1 | 4 | |||||||||
| nonsynonymous SNV | 1 | 3 | 1 | 3 | 3 | 2 | 1 | 2 | 1 | 3 | ||||||||||
| synonymous SNV | 1 | 1 | 1 | 1 | 2 | 1 |
| cf) Tissue ID; Tissue type (1; BLCA[Bladder Urothelial Carcinoma], 2; BRCA[Breast invasive carcinoma], 3; CESC[Cervical squamous cell carcinoma and endocervical adenocarcinoma], 4; COAD[Colon adenocarcinoma], 5; GBM[Glioblastoma multiforme], 6; Glioma Low Grade, 7; HNSC[Head and Neck squamous cell carcinoma], 8; KICH[Kidney Chromophobe], 9; KIRC[Kidney renal clear cell carcinoma], 10; KIRP[Kidney renal papillary cell carcinoma], 11; LAML[Acute Myeloid Leukemia], 12; LUAD[Lung adenocarcinoma], 13; LUSC[Lung squamous cell carcinoma], 14; OV[Ovarian serous cystadenocarcinoma ], 15; PAAD[Pancreatic adenocarcinoma], 16; PRAD[Prostate adenocarcinoma], 17; SKCM[Skin Cutaneous Melanoma], 18:STAD[Stomach adenocarcinoma], 19:THCA[Thyroid carcinoma], 20:UCEC[Uterine Corpus Endometrial Carcinoma]) |
| Top |
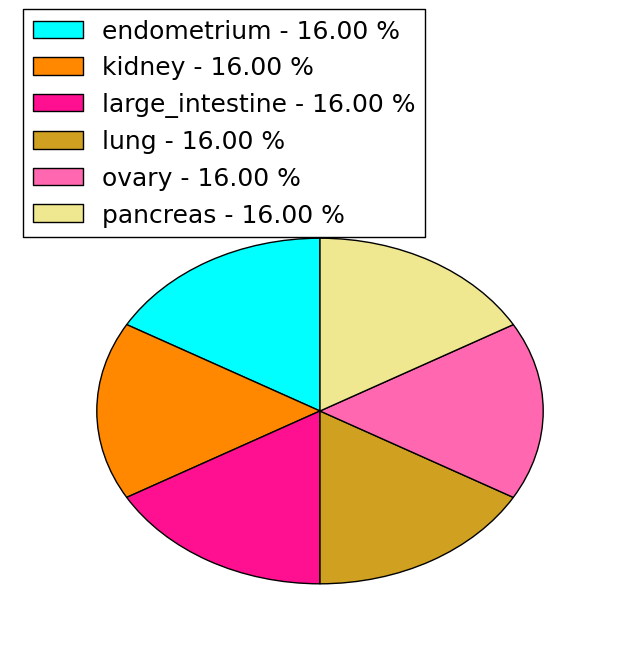
| * We represented just top 10 SNVs. When you move the cursor on each content, you can see more deailed mutation information on the Tooltip. Those are primary_site, primary_histology, mutation(aa), pubmedID. |
| Genomic Position | Mutation(aa) | Unique sampleID count |
| chr11:67414487 | p.P280S | 1 |
| chr11:67410317 | p.Q98L | 1 |
| chr11:67413173 | p.Y279C | 1 |
| chr11:67410319 | p.Q98K | 1 |
| chr11:67413180 | p.S266N | 1 |
| chr11:67410358 | p.R94R | 1 |
| chr11:67413199 | p.T234A | 1 |
| chr11:67412275 | p.A56P | 1 |
| chr11:67413233 | p.R233C | 1 |
| chr11:67412278 | p.R13H | 1 |
| * Copy number data were extracted from TCGA using R package TCGA-Assembler. The URLs of all public data files on TCGA DCC data server were gathered on Jan-05-2015. Function ProcessCNAData in TCGA-Assembler package was used to obtain gene-level copy number value which is calculated as the average copy number of the genomic region of a gene. |
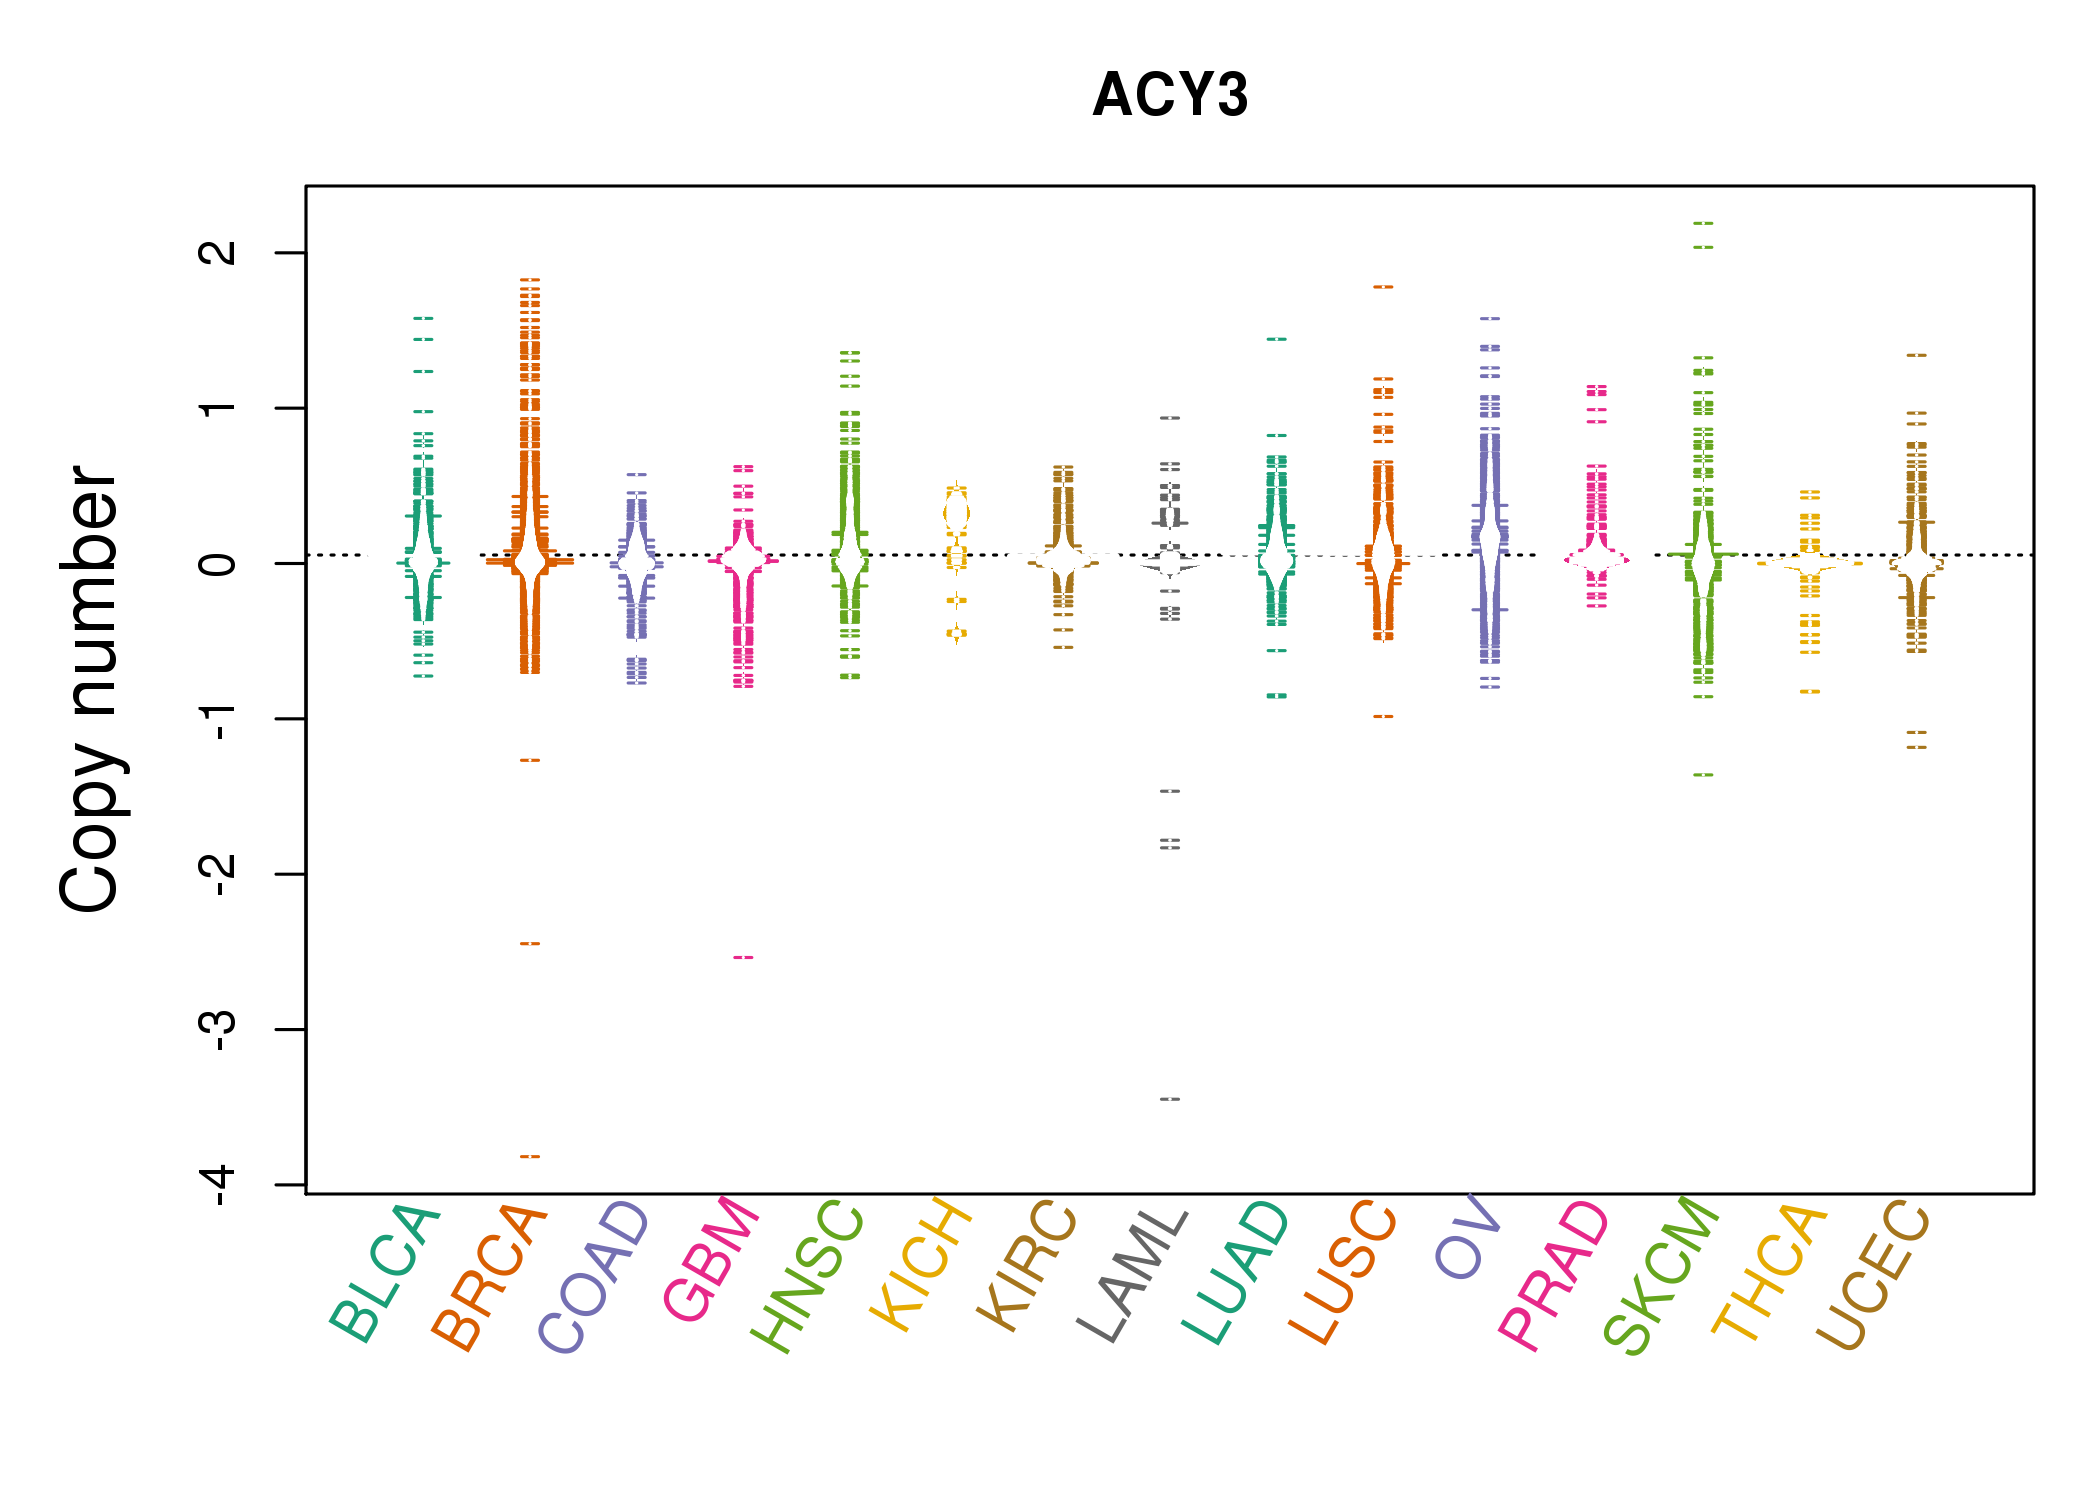 |
| cf) Tissue ID[Tissue type]: BLCA[Bladder Urothelial Carcinoma], BRCA[Breast invasive carcinoma], CESC[Cervical squamous cell carcinoma and endocervical adenocarcinoma], COAD[Colon adenocarcinoma], GBM[Glioblastoma multiforme], Glioma Low Grade, HNSC[Head and Neck squamous cell carcinoma], KICH[Kidney Chromophobe], KIRC[Kidney renal clear cell carcinoma], KIRP[Kidney renal papillary cell carcinoma], LAML[Acute Myeloid Leukemia], LUAD[Lung adenocarcinoma], LUSC[Lung squamous cell carcinoma], OV[Ovarian serous cystadenocarcinoma ], PAAD[Pancreatic adenocarcinoma], PRAD[Prostate adenocarcinoma], SKCM[Skin Cutaneous Melanoma], STAD[Stomach adenocarcinoma], THCA[Thyroid carcinoma], UCEC[Uterine Corpus Endometrial Carcinoma] |
| Top |
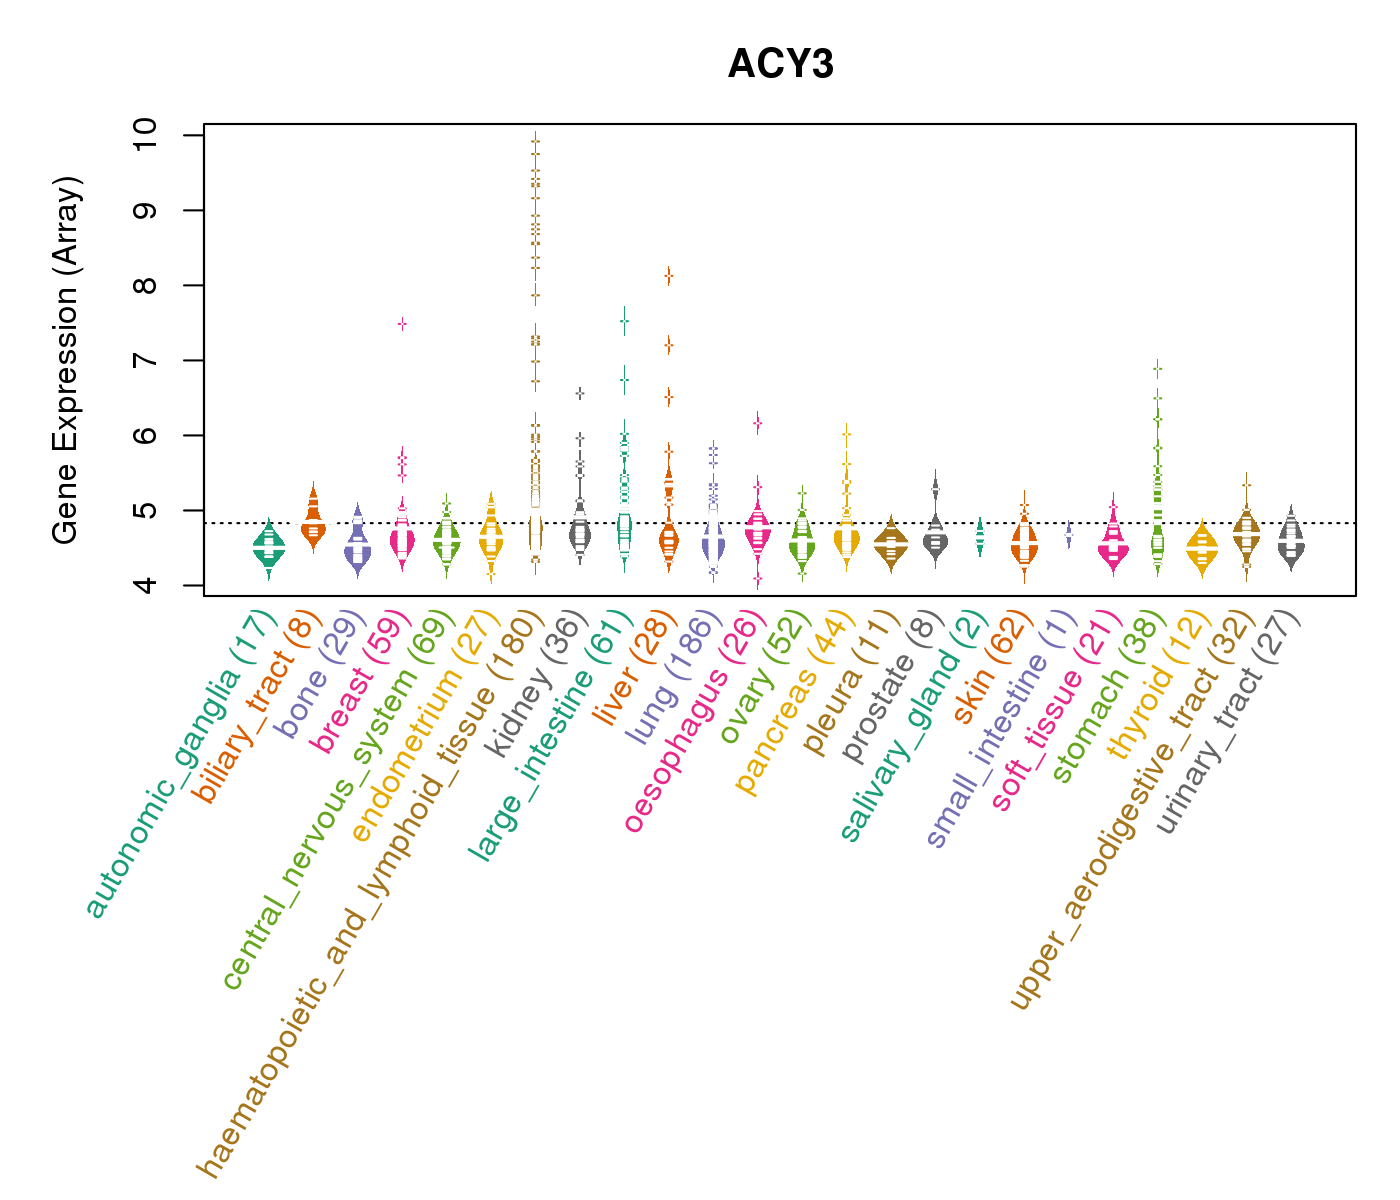
| Gene Expression for ACY3 |
| * CCLE gene expression data were extracted from CCLE_Expression_Entrez_2012-10-18.res: Gene-centric RMA-normalized mRNA expression data. |
 |
| * Normalized gene expression data of RNASeqV2 was extracted from TCGA using R package TCGA-Assembler. The URLs of all public data files on TCGA DCC data server were gathered at Jan-05-2015. Only eight cancer types have enough normal control samples for differential expression analysis. (t test, adjusted p<0.05 (using Benjamini-Hochberg FDR)) |
 |
| Top |
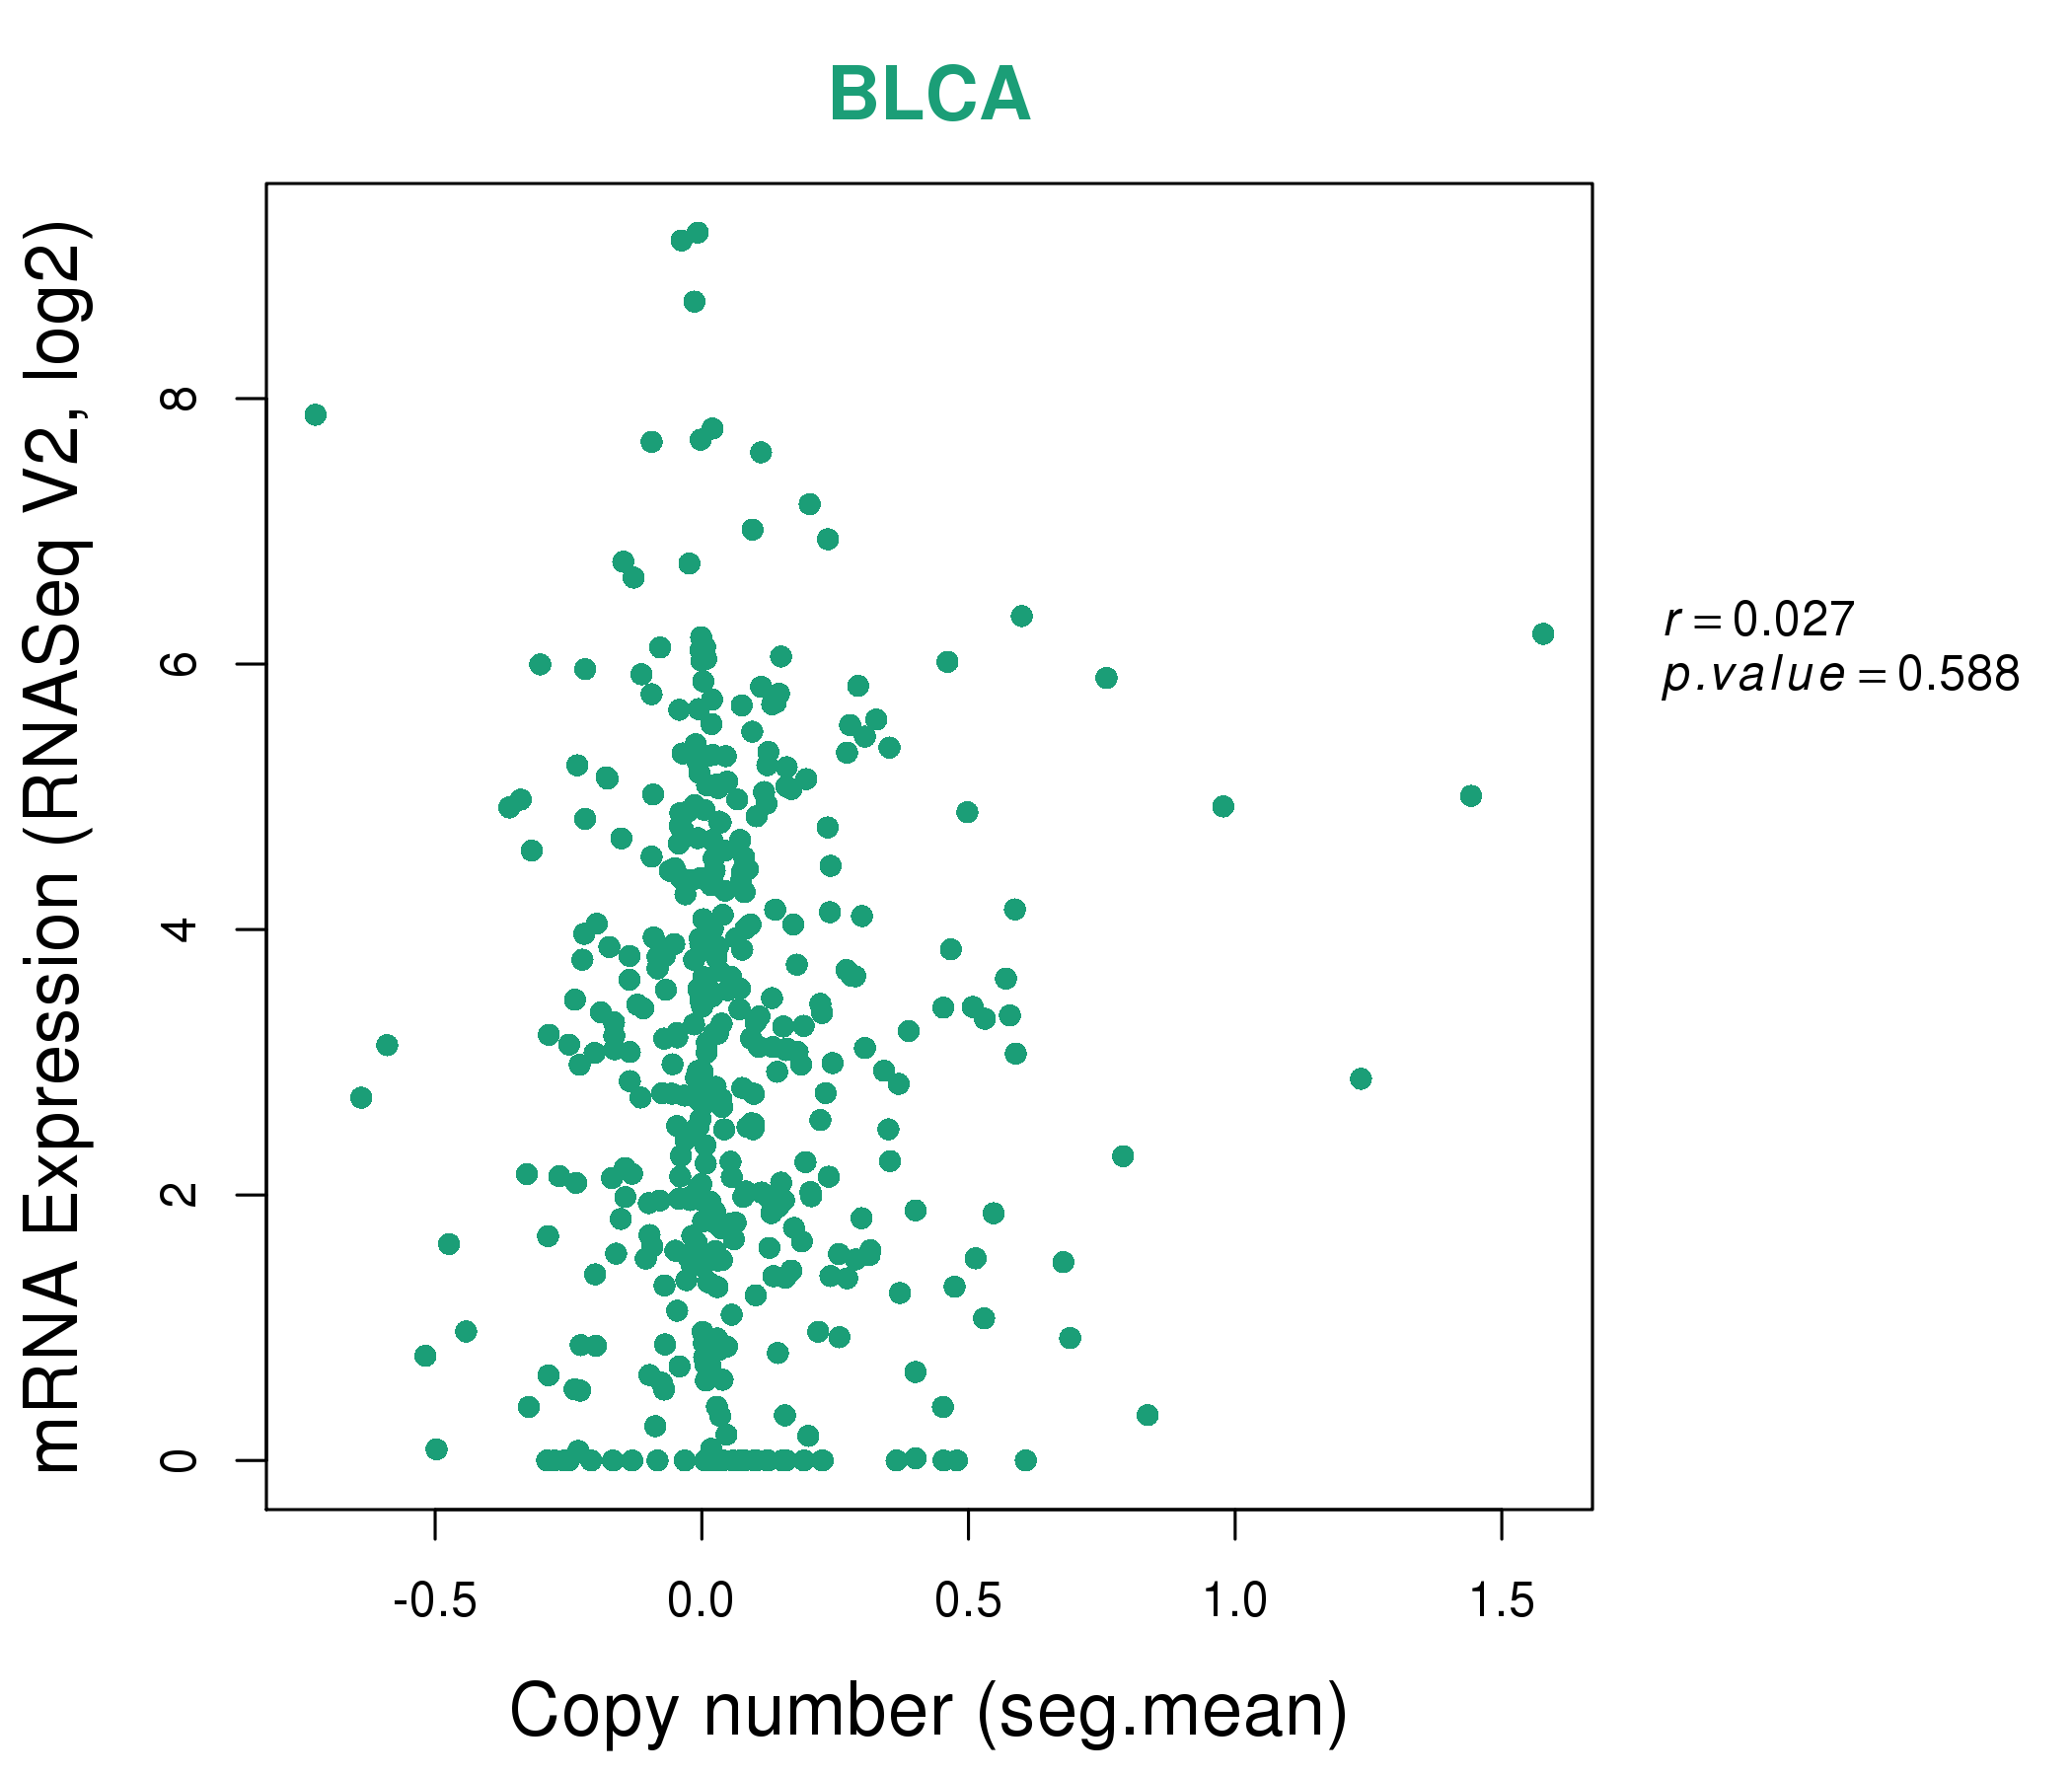
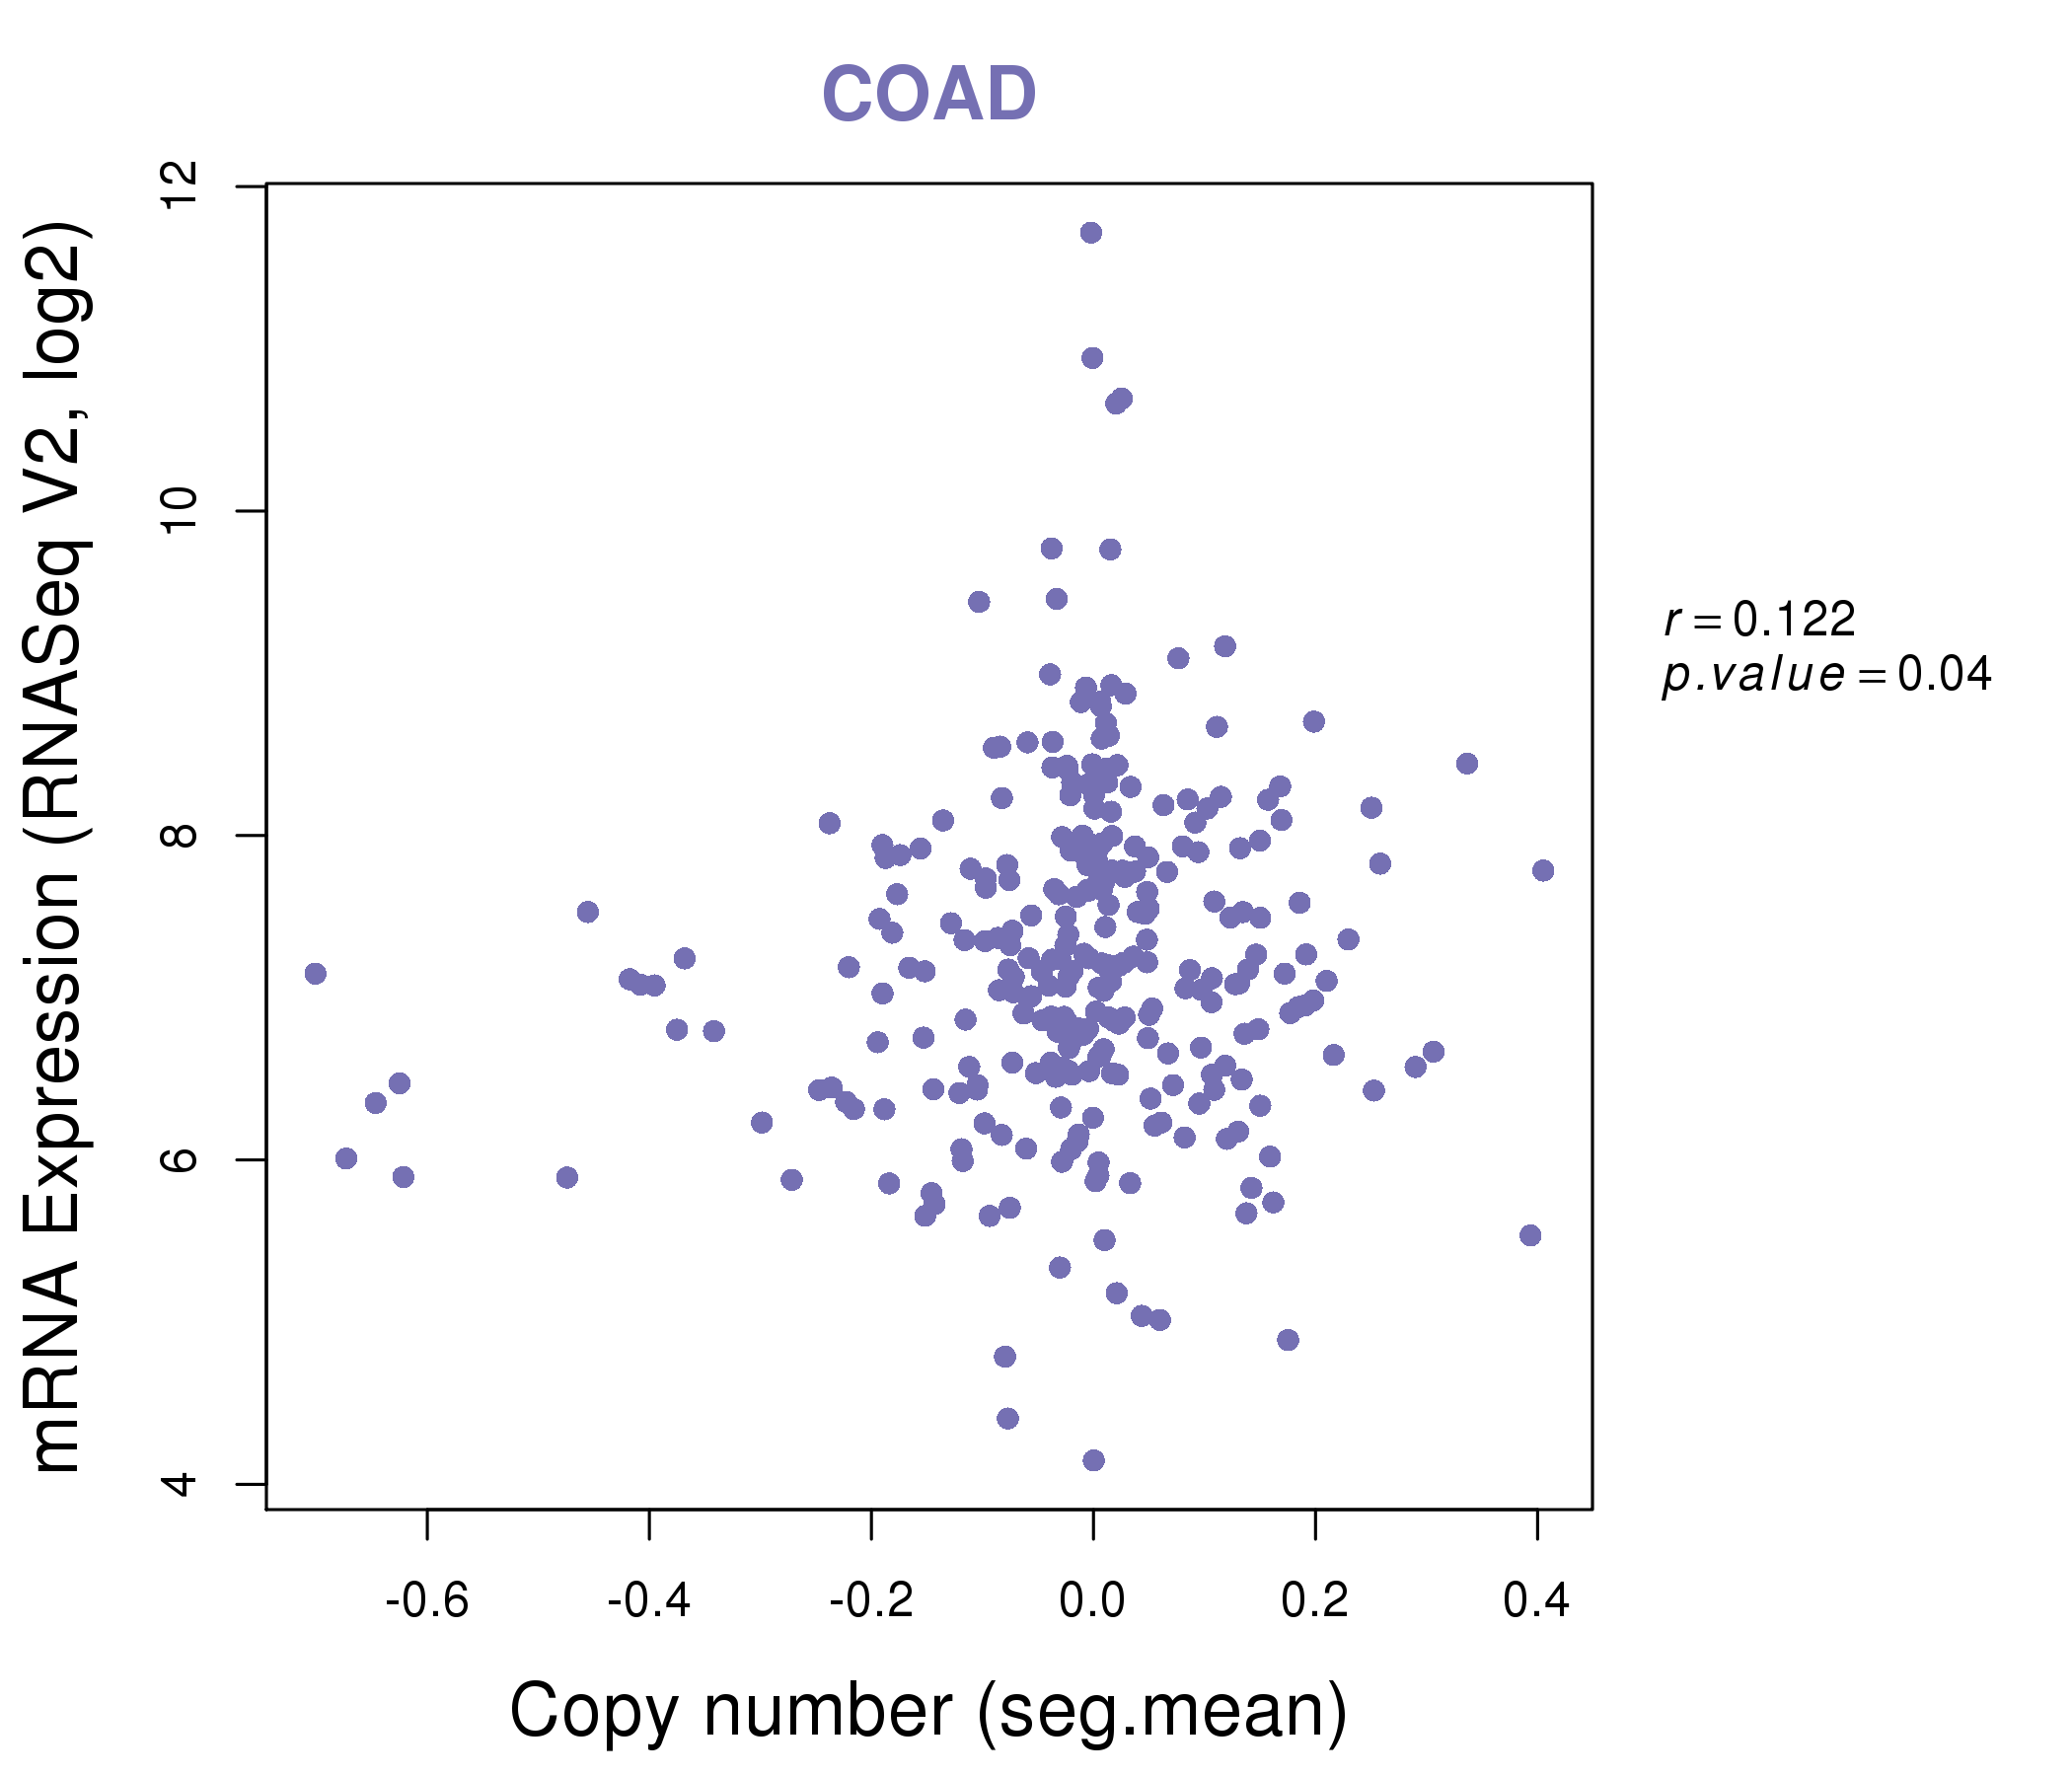
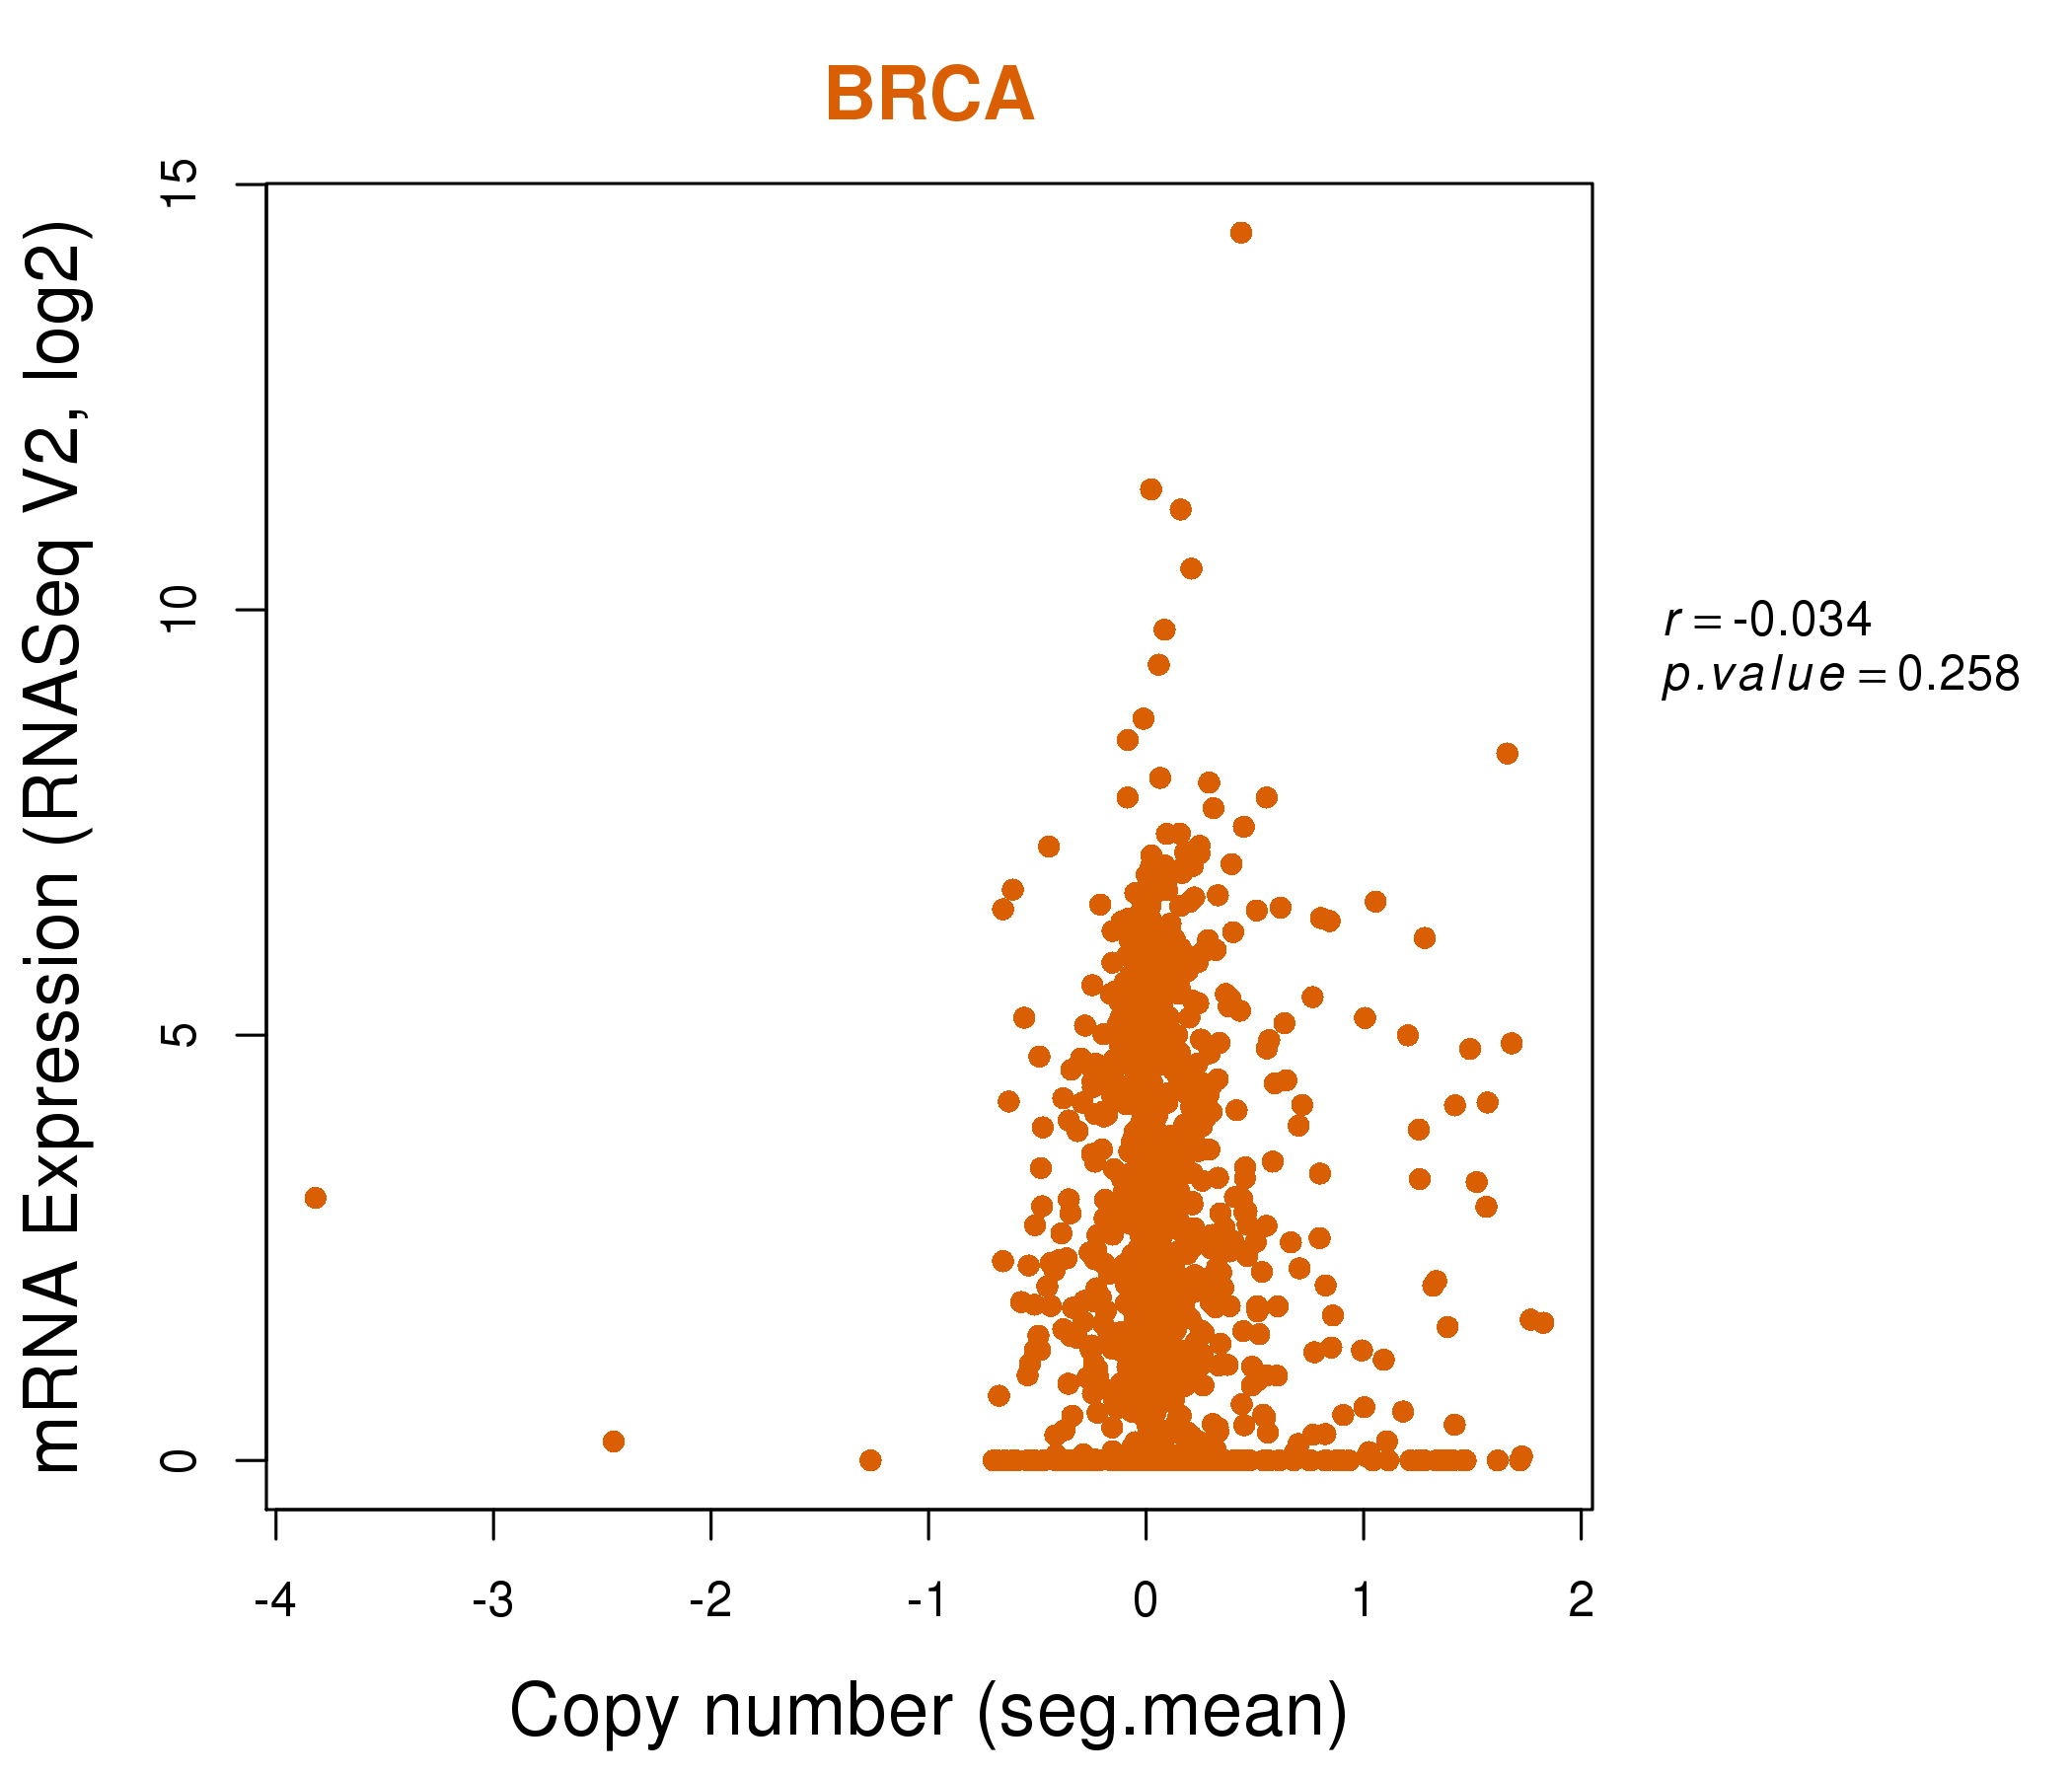
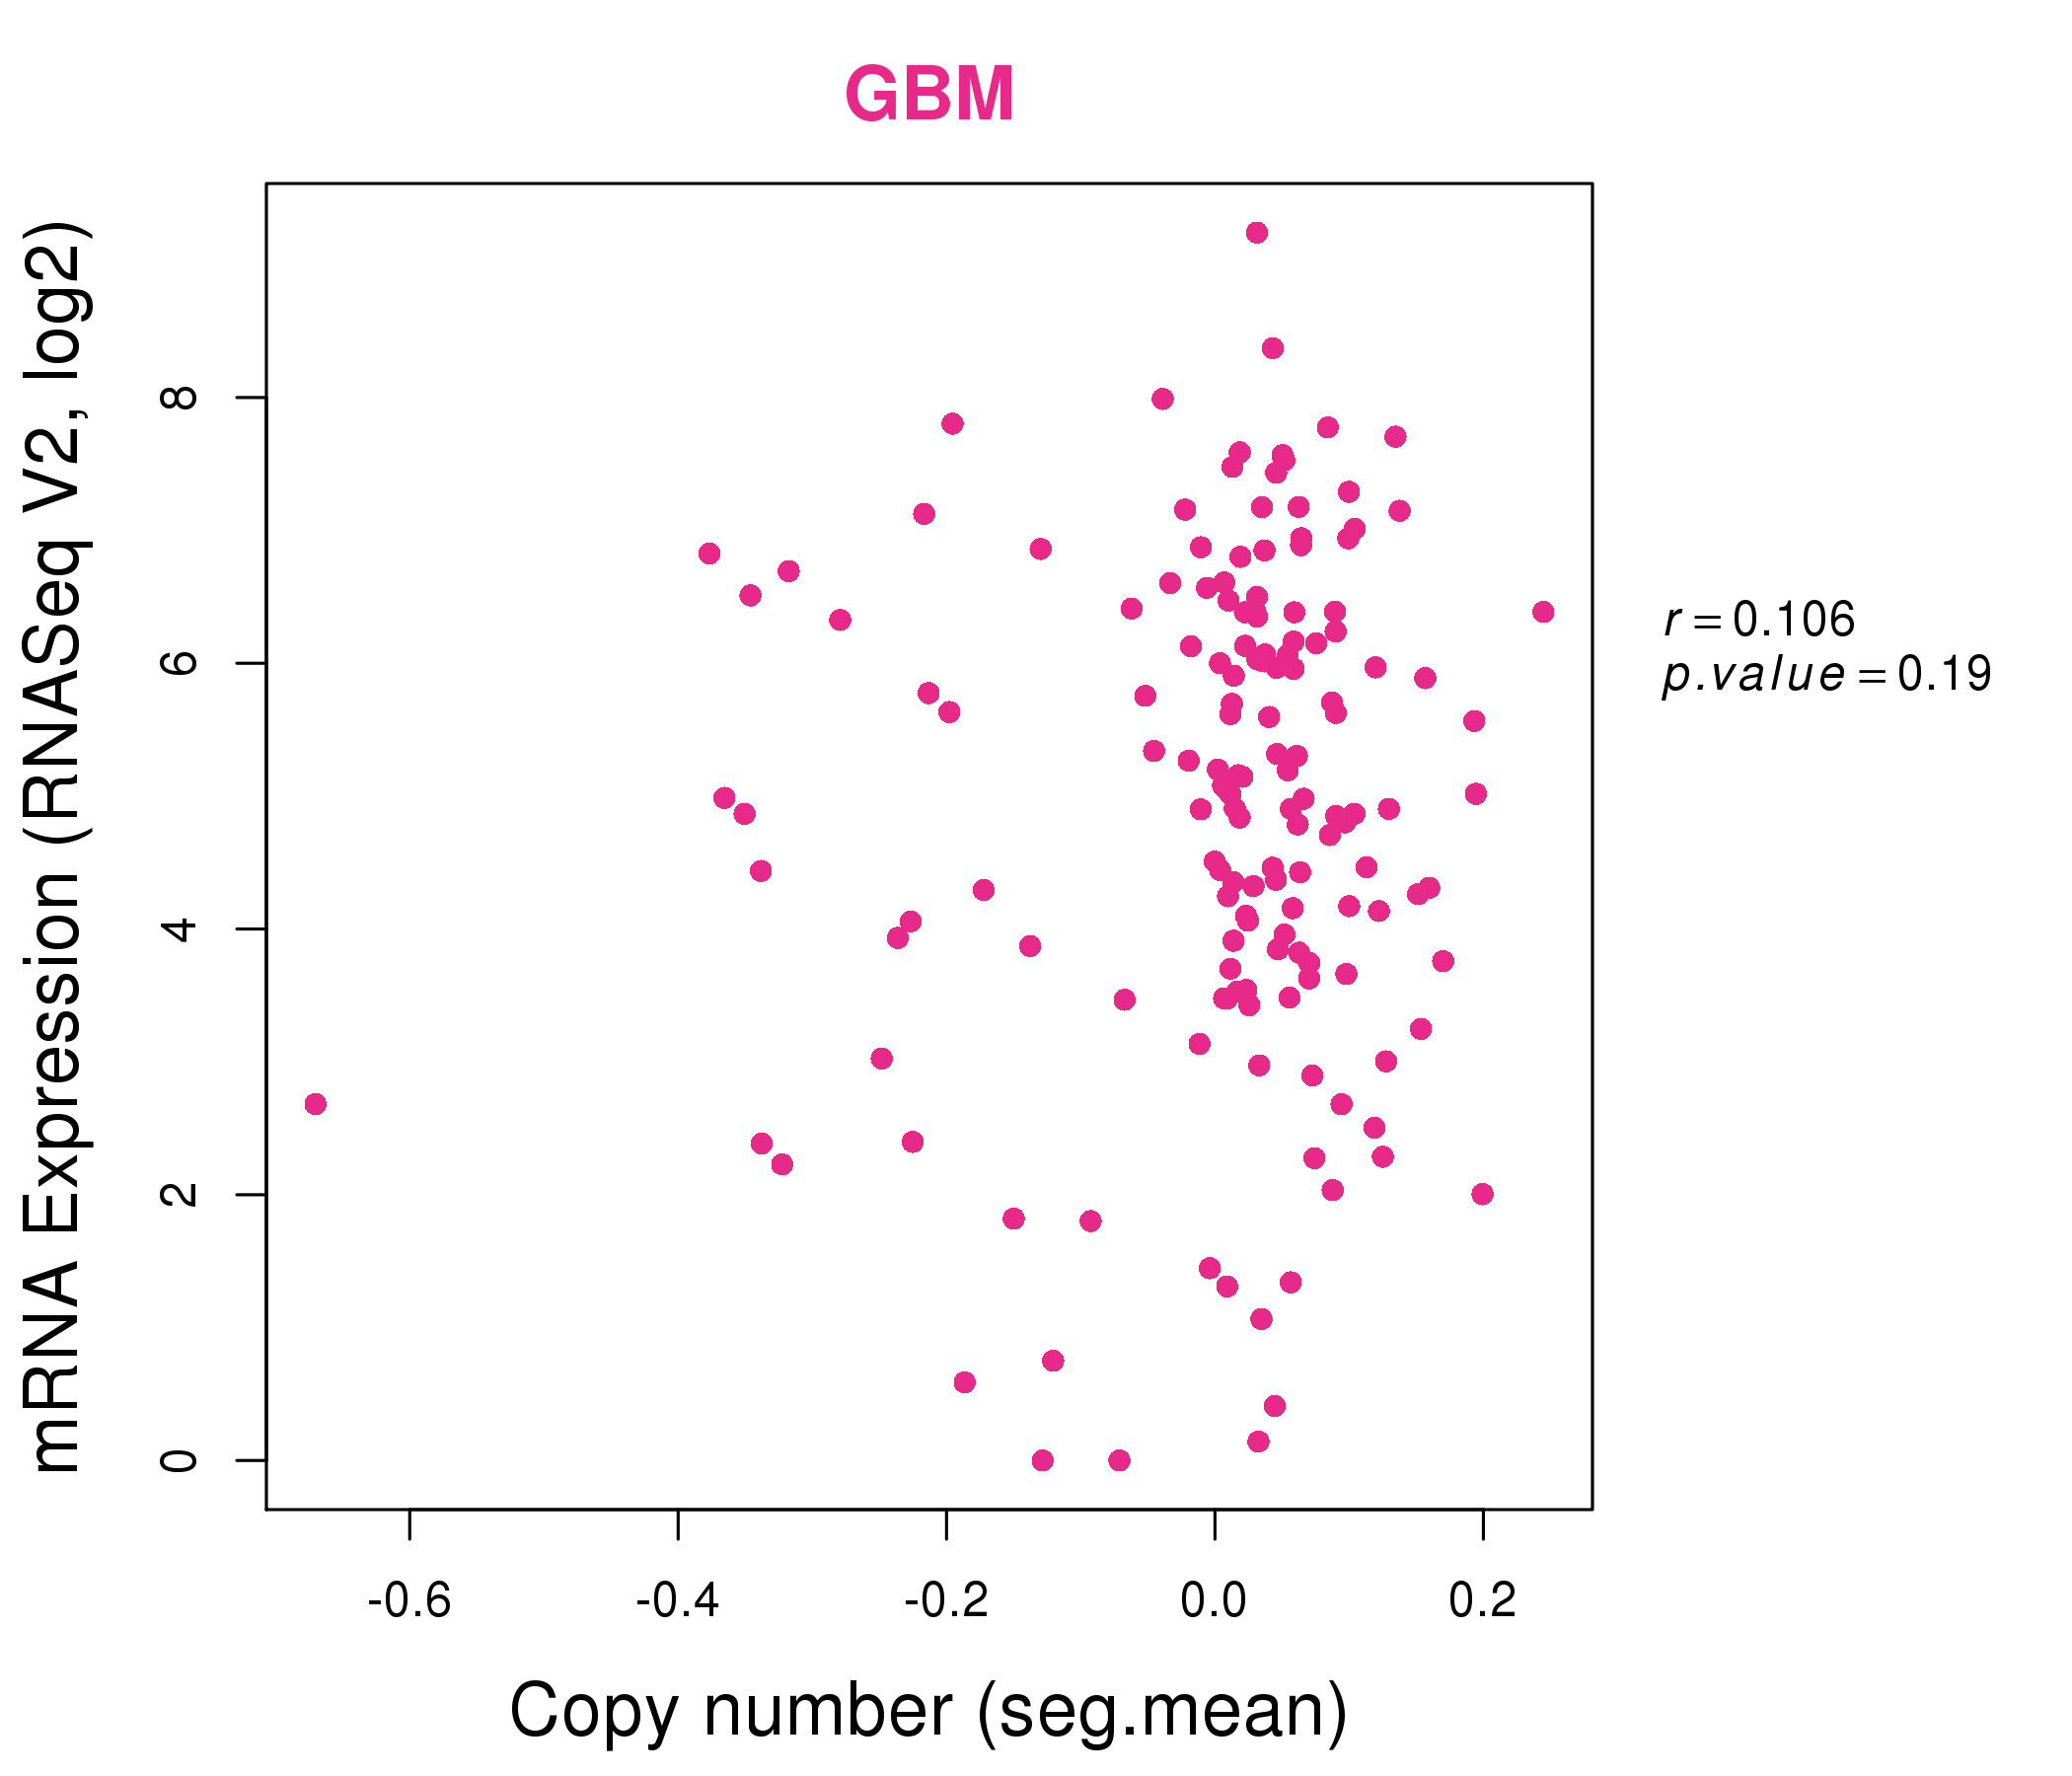
| * This plots show the correlation between CNV and gene expression. |
: Open all plots for all cancer types
 |
|
 |
|
| Top |
| Gene-Gene Network Information |
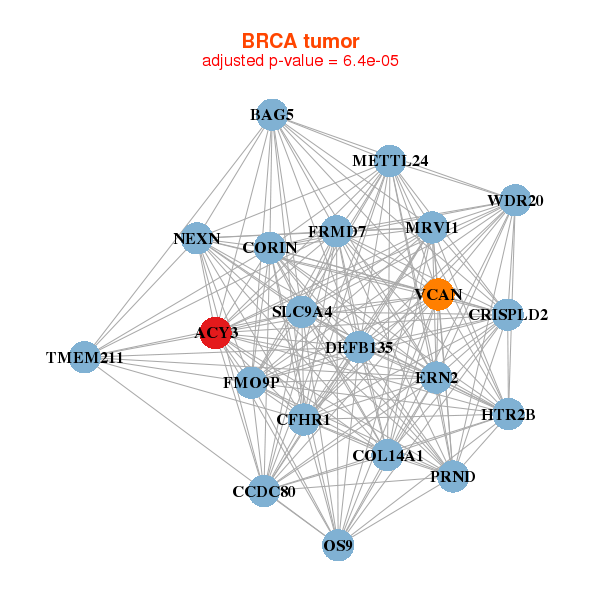
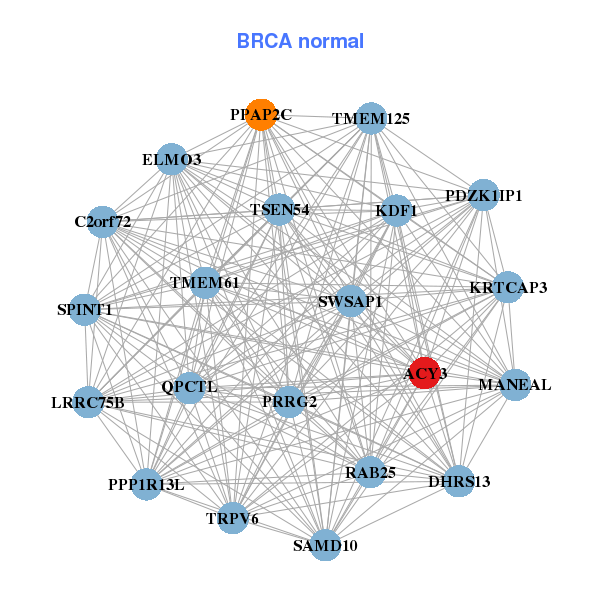
| * Co-Expression network figures were drawn using R package igraph. Only the top 20 genes with the highest correlations were shown. Red circle: input gene, orange circle: cell metabolism gene, sky circle: other gene |
: Open all plots for all cancer types
 |
| ||||
| ACY3,BAG5,METTL24,CCDC80,CFHR1,COL14A1,CORIN, CRISPLD2,DEFB135,ERN2,FMO9P,FRMD7,HTR2B,MRVI1, NEXN,OS9,PRND,SLC9A4,TMEM211,VCAN,WDR20 | ACY3,SWSAP1,KDF1,LRRC75B,C2orf72,DHRS13,ELMO3, KRTCAP3,MANEAL,PDZK1IP1,PPAP2C,PPP1R13L,PRRG2,QPCTL, RAB25,SAMD10,SPINT1,TMEM125,TMEM61,TRPV6,TSEN54 | ||||
 |
| ||||
| A4GNT,ACY3,ANXA10,BCAR4,BTBD16,CCER1,COX8C, CPS1,CYB561,FER1L5,GABRP,GATA4,KY,LIPC, LOC100128239,LOC731789,PDZK1,SERPINA4,SLC16A2,SULT1C2,ZNF488 | ACY3,SMIM24,LINC00479,DAK,DGAT1,DHDH,RMDN3, FOXD1,GALNT14,SLC52A1,GRAMD1B,LOC647121,MMEL1,MS4A10, NAT8B,NLRP6,PFKFB4,SLC5A1,SLC5A2,SLC7A7,TIGD3 |
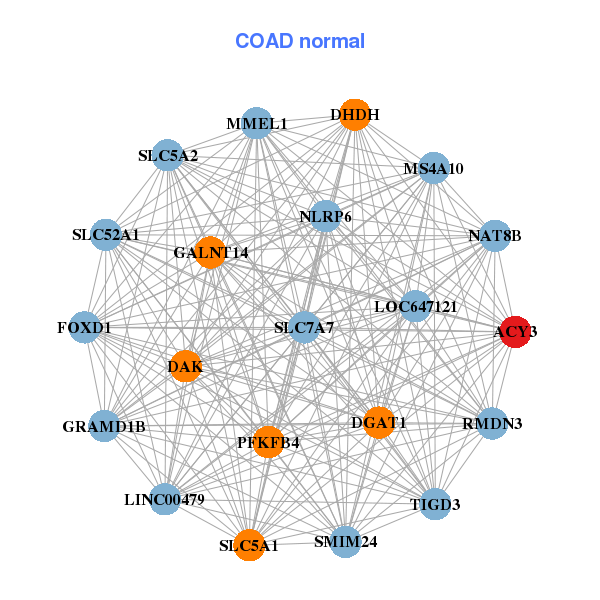
| * Co-Expression network figures were drawn using R package igraph. Only the top 20 genes with the highest correlations were shown. Red circle: input gene, orange circle: cell metabolism gene, sky circle: other gene |
: Open all plots for all cancer types
| Top |
: Open all interacting genes' information including KEGG pathway for all interacting genes from DAVID
| Top |
| Pharmacological Information for ACY3 |
| DB Category | DB Name | DB's ID and Url link |
| * Gene Centered Interaction Network. |
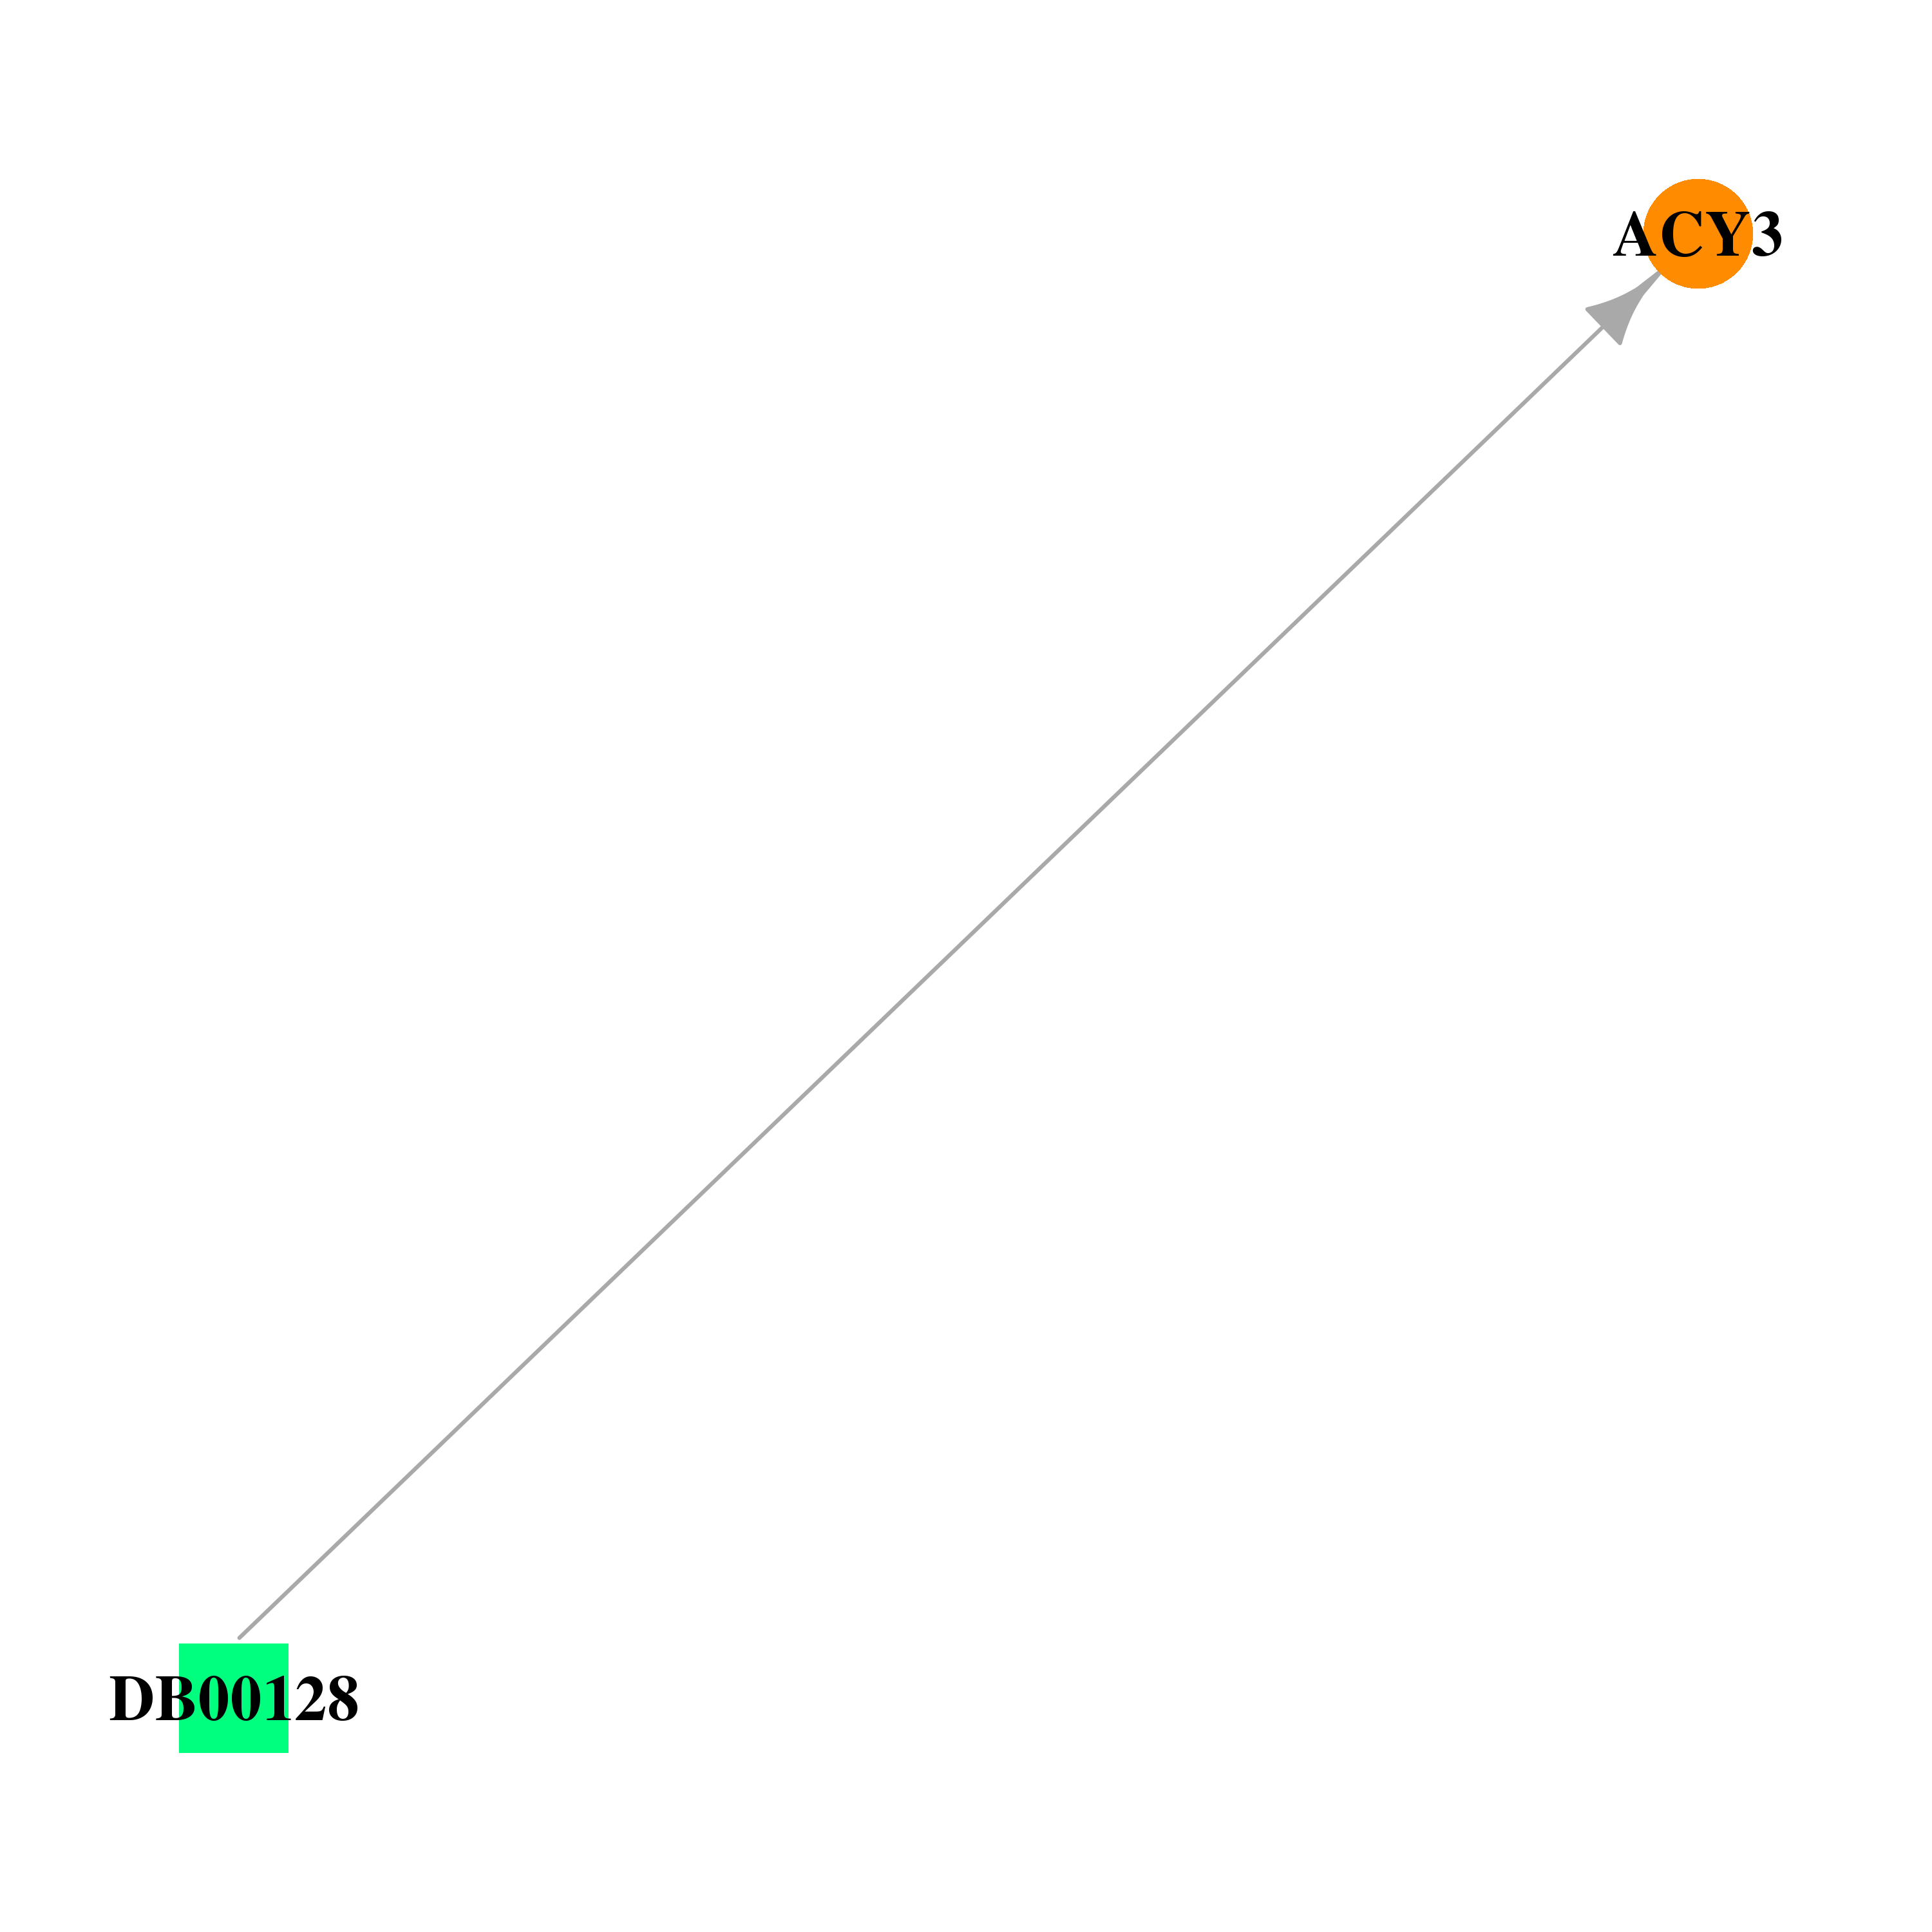 |
| * Drug Centered Interaction Network. |
| DrugBank ID | Target Name | Drug Groups | Generic Name | Drug Centered Network | Drug Structure |
| DB00128 | aspartoacylase (aminocyclase) 3 | approved; nutraceutical | L-Aspartic Acid | 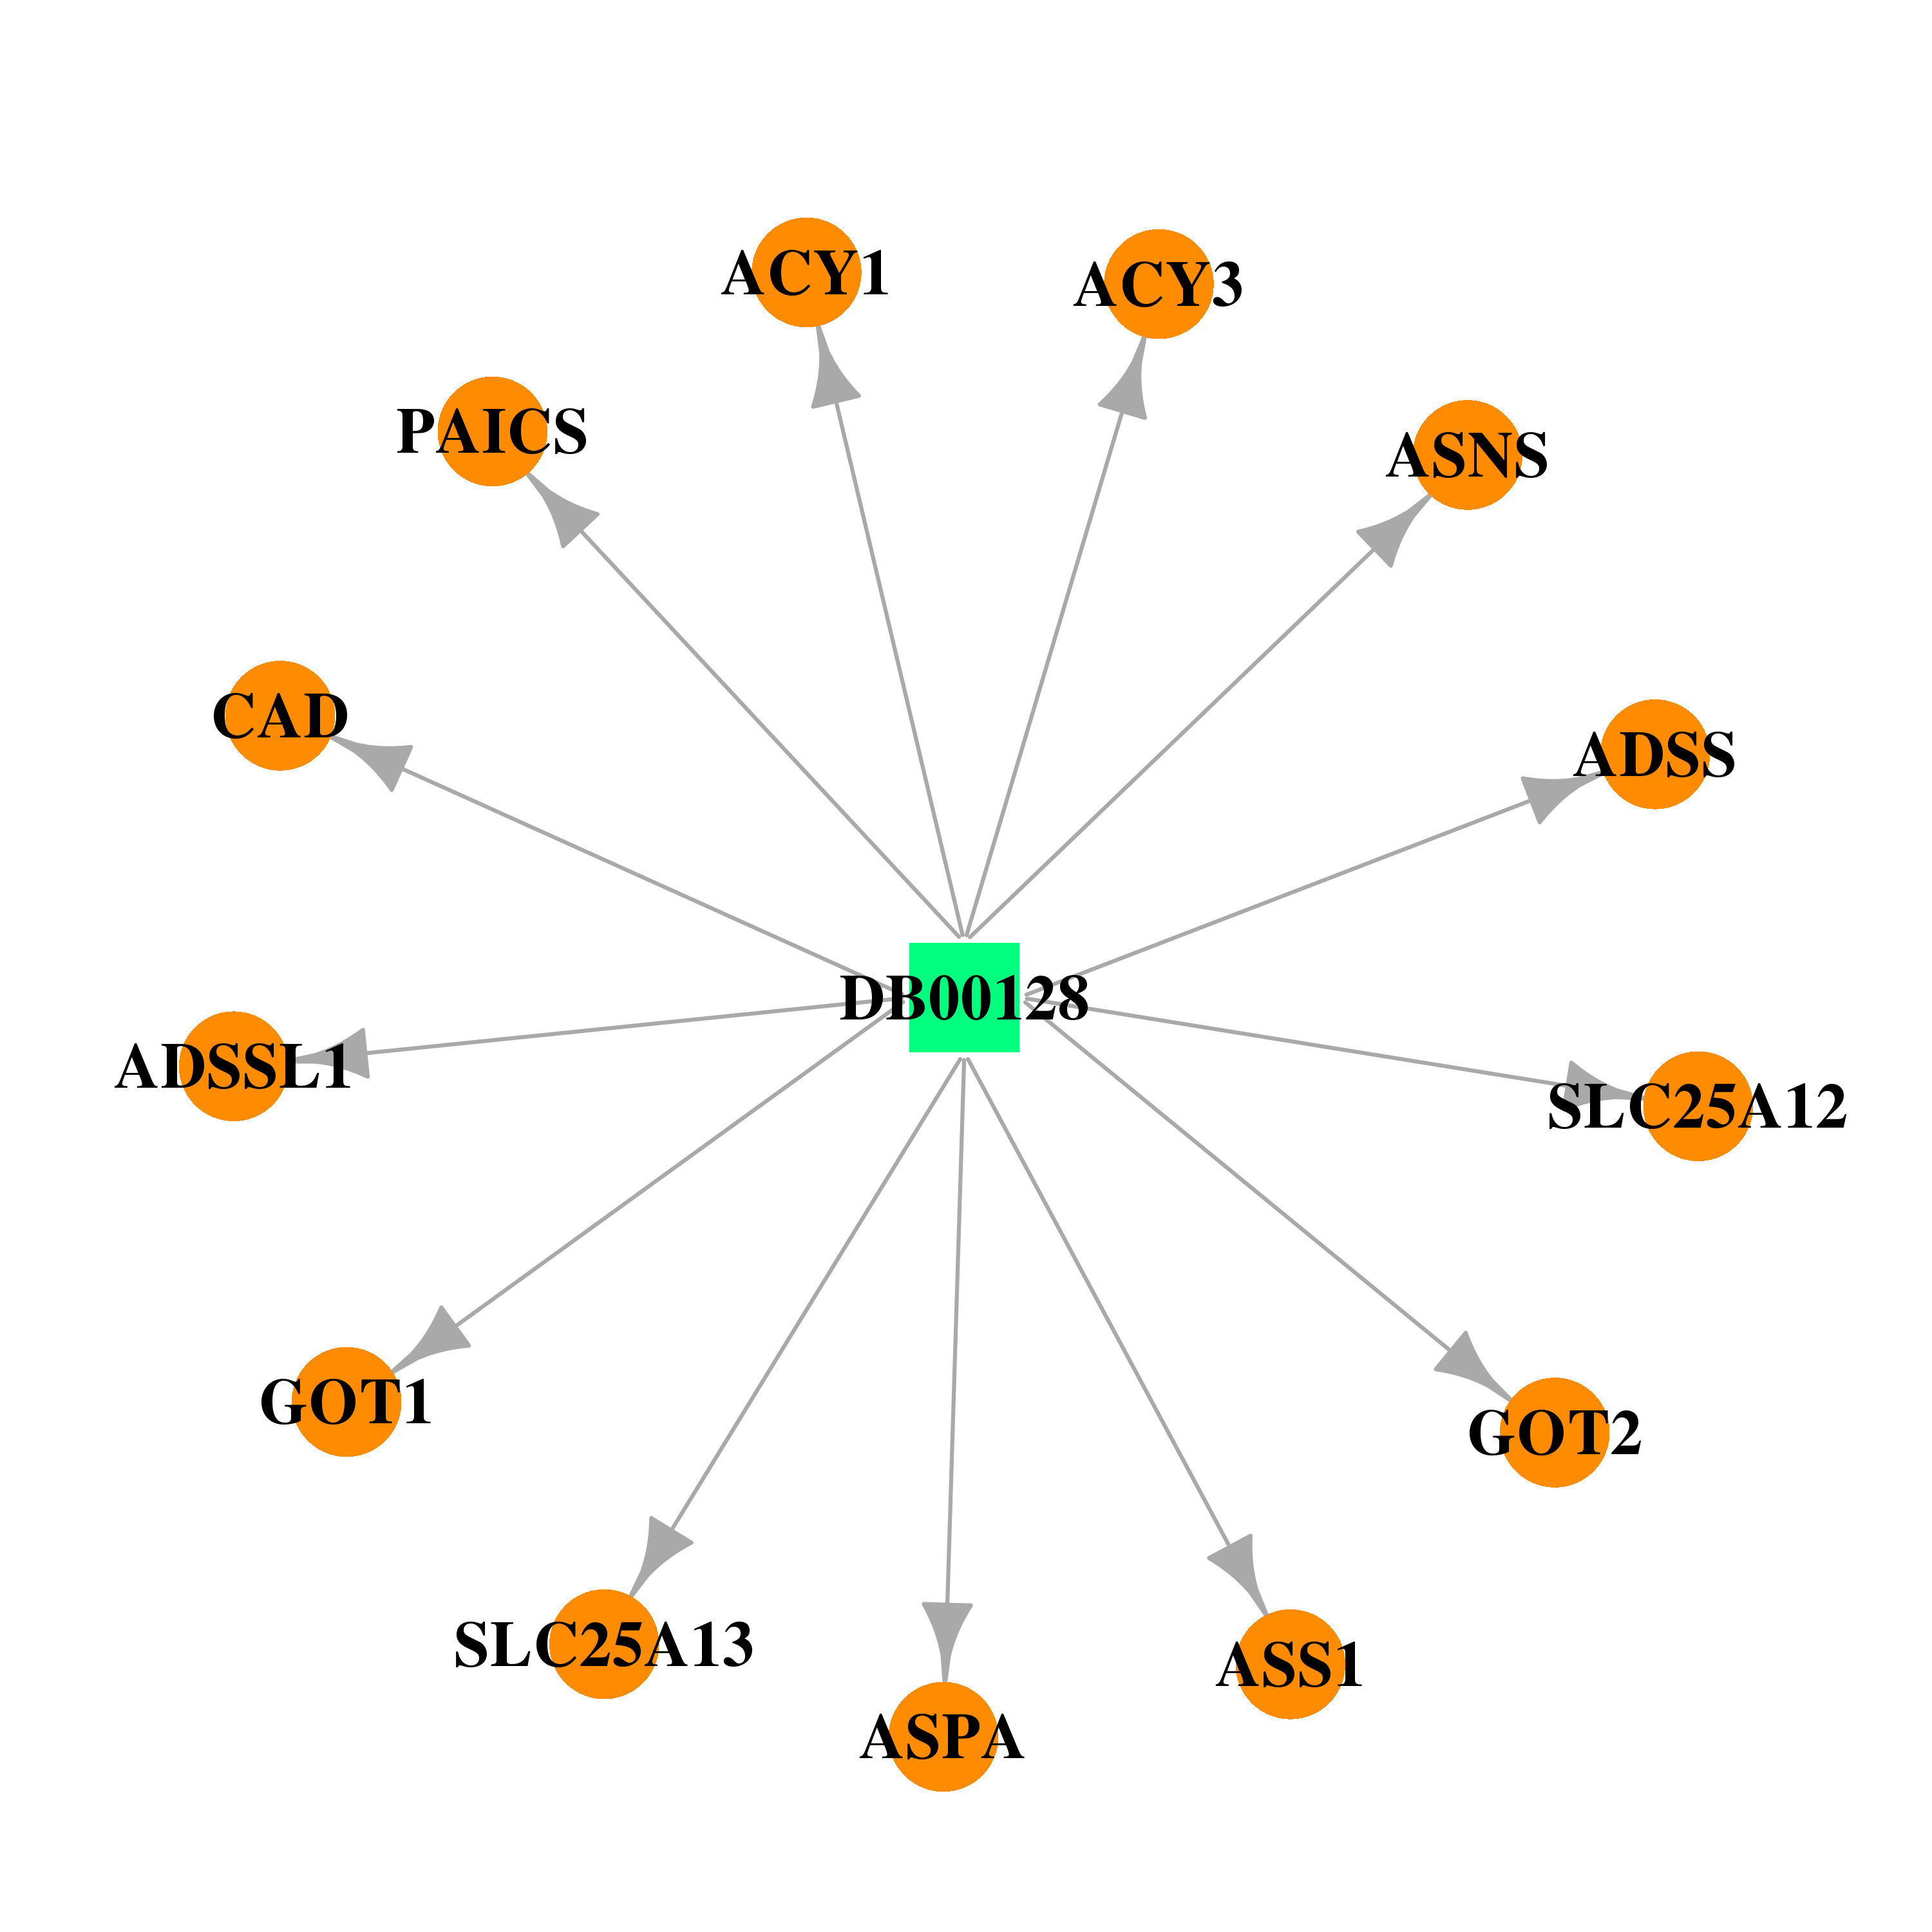 |  |
| Top |
| Cross referenced IDs for ACY3 |
| * We obtained these cross-references from Uniprot database. It covers 150 different DBs, 18 categories. http://www.uniprot.org/help/cross_references_section |
: Open all cross reference information
|
Copyright © 2016-Present - The Univsersity of Texas Health Science Center at Houston @ |