|
||||||||||||||||||||
| |
| Phenotypic Information (metabolism pathway, cancer, disease, phenome) |
| |
| |
| Gene-Gene Network Information: Co-Expression Network, Interacting Genes & KEGG |
| |
|


| Gene Summary for IDI2 |
| Basic gene info. | Gene symbol | IDI2 |
| Gene name | isopentenyl-diphosphate delta isomerase 2 | |
| Synonyms | IPPI2 | |
| Cytomap | UCSC genome browser: 10p15.3 | |
| Genomic location | chr10 :1064846-1071799 | |
| Type of gene | protein-coding | |
| RefGenes | NM_033261.2, | |
| Ensembl id | ENSG00000148377 | |
| Description | IPP isomerase 2diphosphate dimethylallyl diphosphate isomerase 2isopentenyl pyrophosphate isomerase 2isopentenyl-diphosphate Delta-isomerase 2isopentenyl-diphosphate delta-isomerase 2 | |
| Modification date | 20141207 | |
| dbXrefs | MIM : 615389 | |
| HGNC : HGNC | ||
| Ensembl : ENSG00000148377 | ||
| HPRD : 17127 | ||
| Vega : OTTHUMG00000017537 | ||
| Protein | UniProt: go to UniProt's Cross Reference DB Table | |
| Expression | CleanEX: HS_IDI2 | |
| BioGPS: 91734 | ||
| Gene Expression Atlas: ENSG00000148377 | ||
| The Human Protein Atlas: ENSG00000148377 | ||
| Pathway | NCI Pathway Interaction Database: IDI2 | |
| KEGG: IDI2 | ||
| REACTOME: IDI2 | ||
| ConsensusPathDB | ||
| Pathway Commons: IDI2 | ||
| Metabolism | MetaCyc: IDI2 | |
| HUMANCyc: IDI2 | ||
| Regulation | Ensembl's Regulation: ENSG00000148377 | |
| miRBase: chr10 :1,064,846-1,071,799 | ||
| TargetScan: NM_033261 | ||
| cisRED: ENSG00000148377 | ||
| Context | iHOP: IDI2 | |
| cancer metabolism search in PubMed: IDI2 | ||
| UCL Cancer Institute: IDI2 | ||
| Assigned class in ccmGDB | C | |
| Top |
| Phenotypic Information for IDI2(metabolism pathway, cancer, disease, phenome) |
| Cancer | CGAP: IDI2 |
| Familial Cancer Database: IDI2 | |
| * This gene is included in those cancer gene databases. |
|
|
|
|
|
|
| ||||||||||||||
Oncogene 1 | Significant driver gene in | |||||||||||||||||||
| cf) number; DB name 1 Oncogene; http://nar.oxfordjournals.org/content/35/suppl_1/D721.long, 2 Tumor Suppressor gene; https://bioinfo.uth.edu/TSGene/, 3 Cancer Gene Census; http://www.nature.com/nrc/journal/v4/n3/abs/nrc1299.html, 4 CancerGenes; http://nar.oxfordjournals.org/content/35/suppl_1/D721.long, 5 Network of Cancer Gene; http://ncg.kcl.ac.uk/index.php, 1Therapeutic Vulnerabilities in Cancer; http://cbio.mskcc.org/cancergenomics/statius/ |
| REACTOME_METABOLISM_OF_LIPIDS_AND_LIPOPROTEINS | |
| OMIM | |
| Orphanet | |
| Disease | KEGG Disease: IDI2 |
| MedGen: IDI2 (Human Medical Genetics with Condition) | |
| ClinVar: IDI2 | |
| Phenotype | MGI: IDI2 (International Mouse Phenotyping Consortium) |
| PhenomicDB: IDI2 | |
| Mutations for IDI2 |
| * Under tables are showing count per each tissue to give us broad intuition about tissue specific mutation patterns.You can go to the detailed page for each mutation database's web site. |
| There's no structural variation information in COSMIC data for this gene. |
| * From mRNA Sanger sequences, Chitars2.0 arranged chimeric transcripts. This table shows IDI2 related fusion information. |
| ID | Head Gene | Tail Gene | Accession | Gene_a | qStart_a | qEnd_a | Chromosome_a | tStart_a | tEnd_a | Gene_a | qStart_a | qEnd_a | Chromosome_a | tStart_a | tEnd_a |
| Top |
| There's no copy number variation information in COSMIC data for this gene. |
| Top |
|
 |
| Top |
| Stat. for Non-Synonymous SNVs (# total SNVs=16) | (# total SNVs=4) |
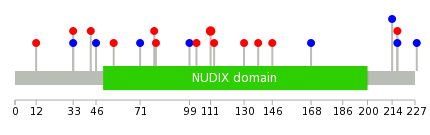
 |  |
(# total SNVs=1) | (# total SNVs=0) |
 |
| Top |
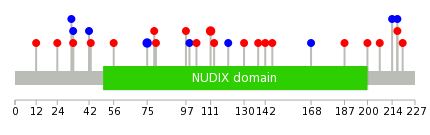
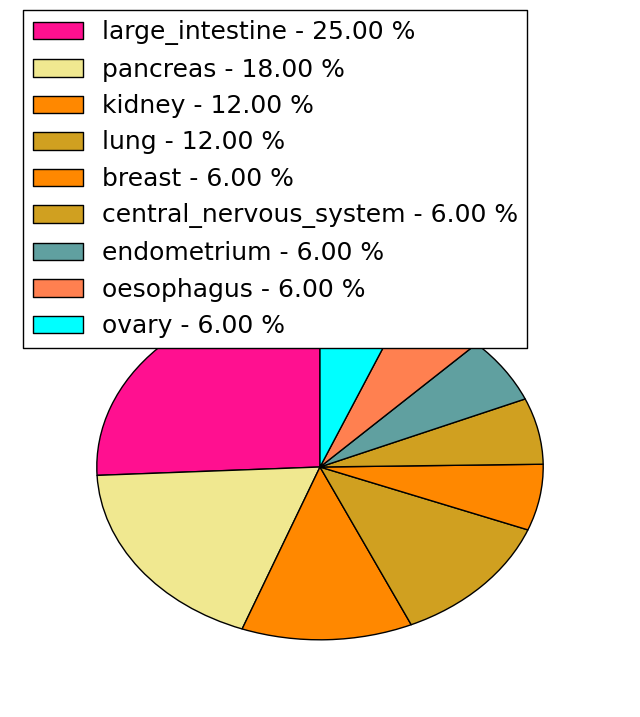
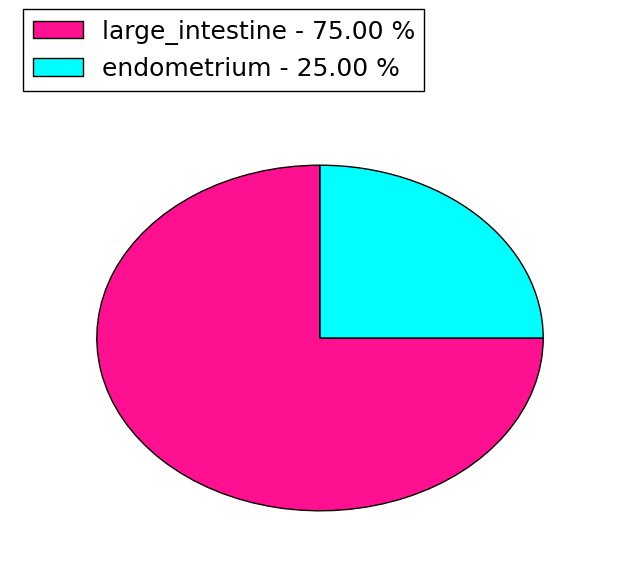
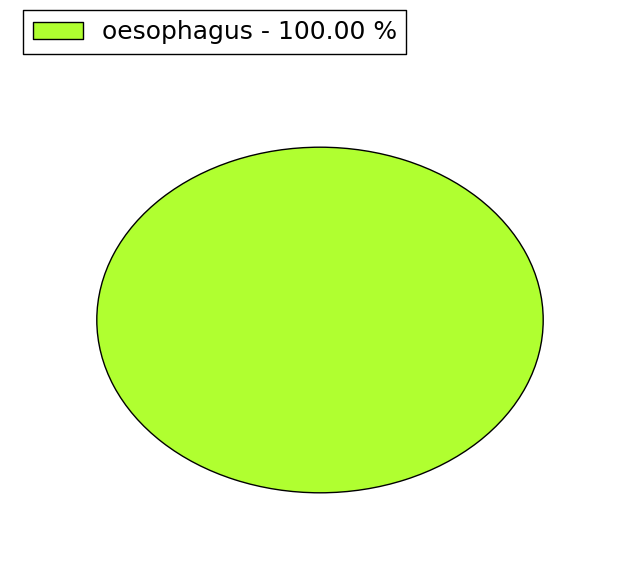
| * When you move the cursor on each content, you can see more deailed mutation information on the Tooltip. Those are primary_site,primary_histology,mutation(aa),pubmedID. |
| GRCh37 position | Mutation(aa) | Unique sampleID count |
| chr10:1068633-1068633 | p.V75V | 2 |
| chr10:1066741-1066741 | p.R111H | 2 |
| chr10:1066776-1066776 | p.K99K | 1 |
| chr10:1070565-1070565 | p.A33A | 1 |
| chr10:1065581-1065581 | p.A187G | 1 |
| chr10:1066784-1066784 | p.E97K | 1 |
| chr10:1070566-1070566 | p.A33V | 1 |
| chr10:1065637-1065637 | p.T168T | 1 |
| chr10:1066834-1066834 | p.Y80C | 1 |
| chr10:1070568-1070568 | p.G32G | 1 |
| Top |
|
 |
| Point Mutation/ Tissue ID | 1 | 2 | 3 | 4 | 5 | 6 | 7 | 8 | 9 | 10 | 11 | 12 | 13 | 14 | 15 | 16 | 17 | 18 | 19 | 20 |
| # sample | 3 | 1 | 4 | 1 | 2 | 1 | 2 | 1 | 3 | 2 | 2 | |||||||||
| # mutation | 3 | 1 | 4 | 1 | 2 | 1 | 2 | 1 | 3 | 2 | 2 | |||||||||
| nonsynonymous SNV | 3 | 2 | 1 | 2 | 2 | 1 | 1 | 1 | 1 | |||||||||||
| synonymous SNV | 1 | 2 | 1 | 2 | 1 | 1 |
| cf) Tissue ID; Tissue type (1; BLCA[Bladder Urothelial Carcinoma], 2; BRCA[Breast invasive carcinoma], 3; CESC[Cervical squamous cell carcinoma and endocervical adenocarcinoma], 4; COAD[Colon adenocarcinoma], 5; GBM[Glioblastoma multiforme], 6; Glioma Low Grade, 7; HNSC[Head and Neck squamous cell carcinoma], 8; KICH[Kidney Chromophobe], 9; KIRC[Kidney renal clear cell carcinoma], 10; KIRP[Kidney renal papillary cell carcinoma], 11; LAML[Acute Myeloid Leukemia], 12; LUAD[Lung adenocarcinoma], 13; LUSC[Lung squamous cell carcinoma], 14; OV[Ovarian serous cystadenocarcinoma ], 15; PAAD[Pancreatic adenocarcinoma], 16; PRAD[Prostate adenocarcinoma], 17; SKCM[Skin Cutaneous Melanoma], 18:STAD[Stomach adenocarcinoma], 19:THCA[Thyroid carcinoma], 20:UCEC[Uterine Corpus Endometrial Carcinoma]) |
| Top |
| * We represented just top 10 SNVs. When you move the cursor on each content, you can see more deailed mutation information on the Tooltip. Those are primary_site, primary_histology, mutation(aa), pubmedID. |
| Genomic Position | Mutation(aa) | Unique sampleID count |
| chr10:1066741 | p.R111H | 2 |
| chr10:1070565 | p.Y80C | 1 |
| chr10:1066735 | p.G79A | 1 |
| chr10:1070566 | p.S71S | 1 |
| chr10:1070630 | p.V56I | 1 |
| chr10:1066766 | p.X228X | 1 |
| chr10:1065458 | p.E46E | 1 |
| chr10:1066776 | p.P217P | 1 |
| chr10:1065490 | p.E43K | 1 |
| chr10:1066834 | p.P217Q | 1 |
| * Copy number data were extracted from TCGA using R package TCGA-Assembler. The URLs of all public data files on TCGA DCC data server were gathered on Jan-05-2015. Function ProcessCNAData in TCGA-Assembler package was used to obtain gene-level copy number value which is calculated as the average copy number of the genomic region of a gene. |
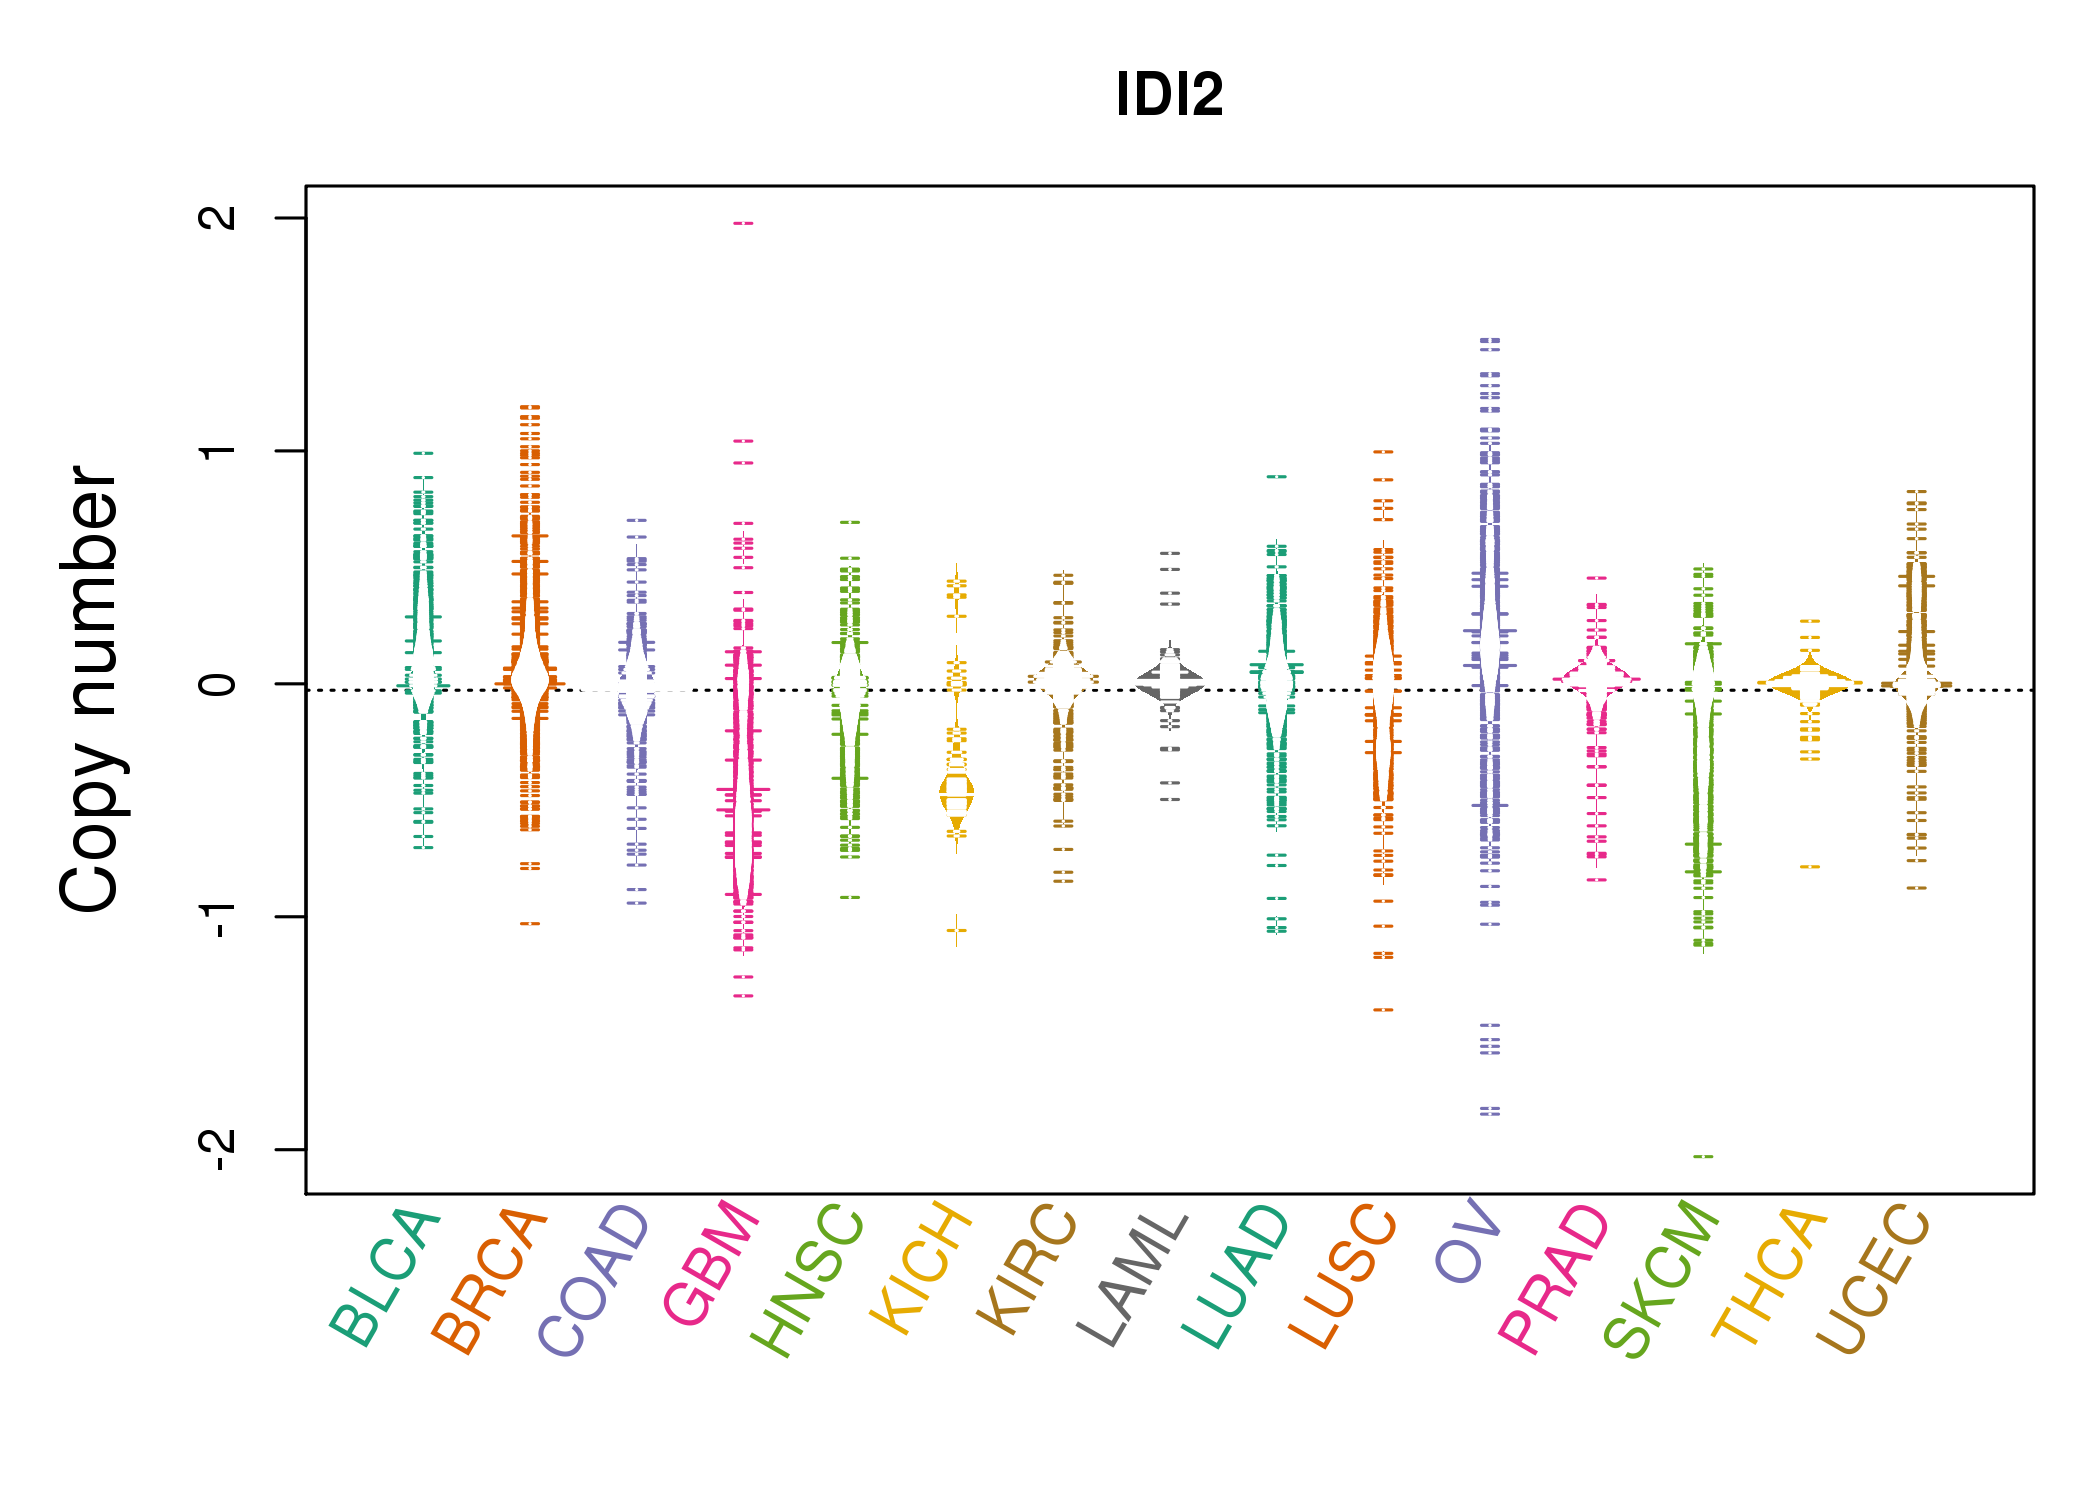 |
| cf) Tissue ID[Tissue type]: BLCA[Bladder Urothelial Carcinoma], BRCA[Breast invasive carcinoma], CESC[Cervical squamous cell carcinoma and endocervical adenocarcinoma], COAD[Colon adenocarcinoma], GBM[Glioblastoma multiforme], Glioma Low Grade, HNSC[Head and Neck squamous cell carcinoma], KICH[Kidney Chromophobe], KIRC[Kidney renal clear cell carcinoma], KIRP[Kidney renal papillary cell carcinoma], LAML[Acute Myeloid Leukemia], LUAD[Lung adenocarcinoma], LUSC[Lung squamous cell carcinoma], OV[Ovarian serous cystadenocarcinoma ], PAAD[Pancreatic adenocarcinoma], PRAD[Prostate adenocarcinoma], SKCM[Skin Cutaneous Melanoma], STAD[Stomach adenocarcinoma], THCA[Thyroid carcinoma], UCEC[Uterine Corpus Endometrial Carcinoma] |
| Top |
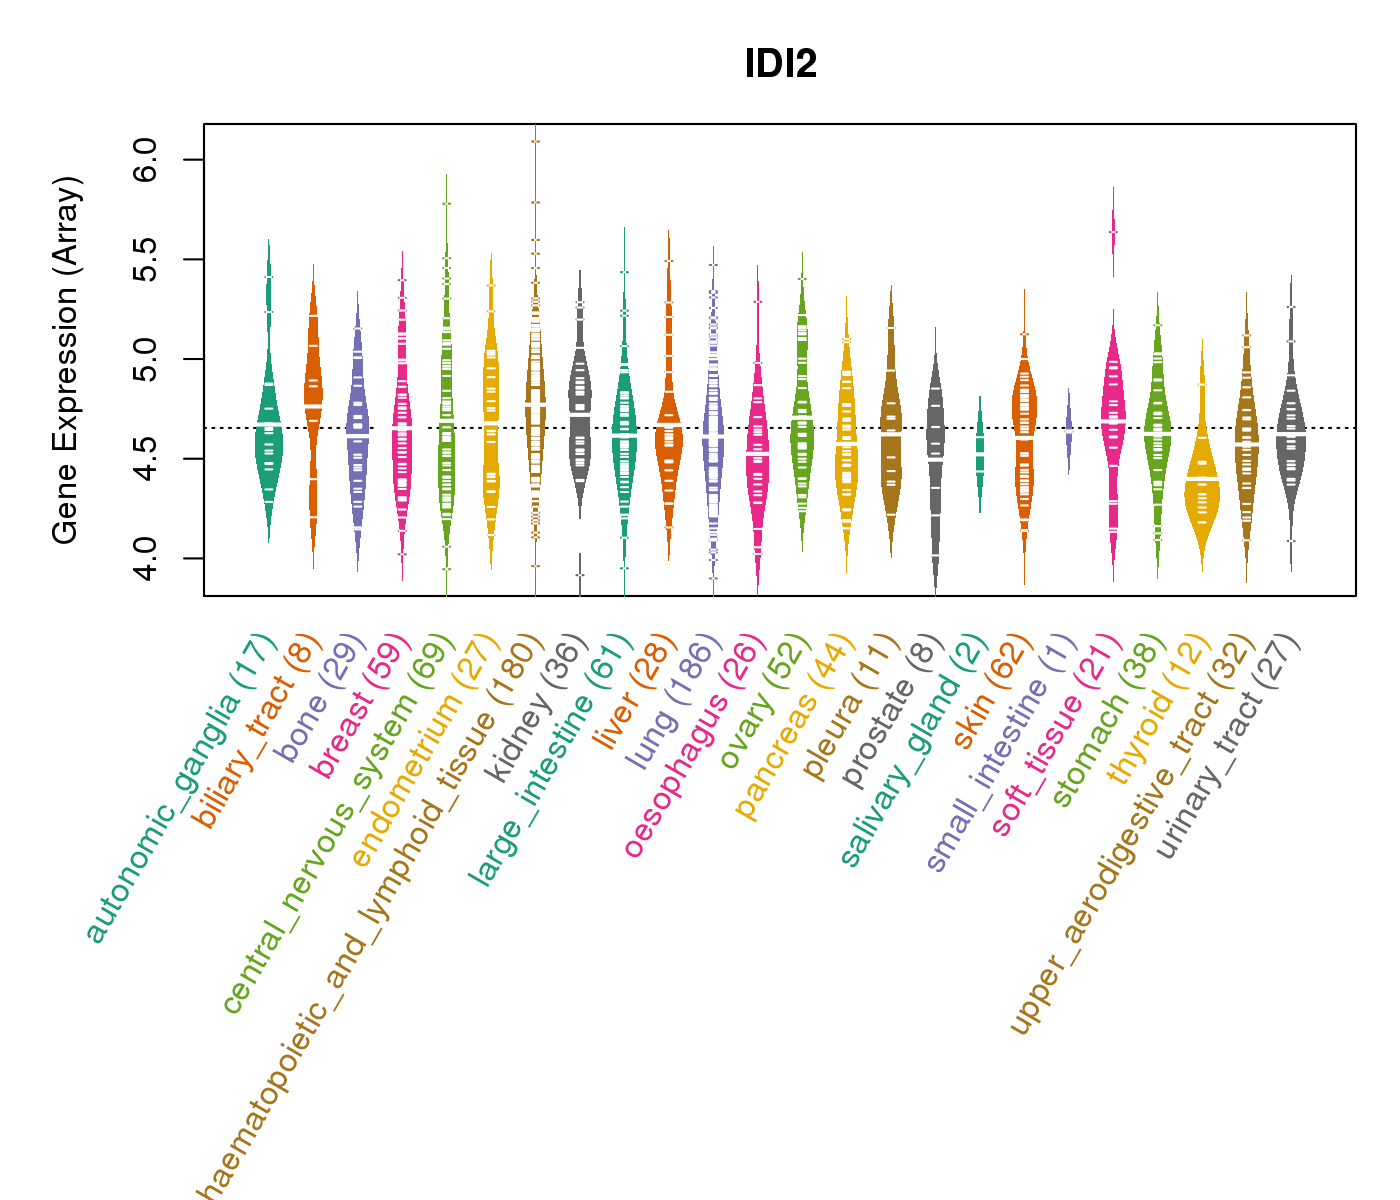
| Gene Expression for IDI2 |
| * CCLE gene expression data were extracted from CCLE_Expression_Entrez_2012-10-18.res: Gene-centric RMA-normalized mRNA expression data. |
 |
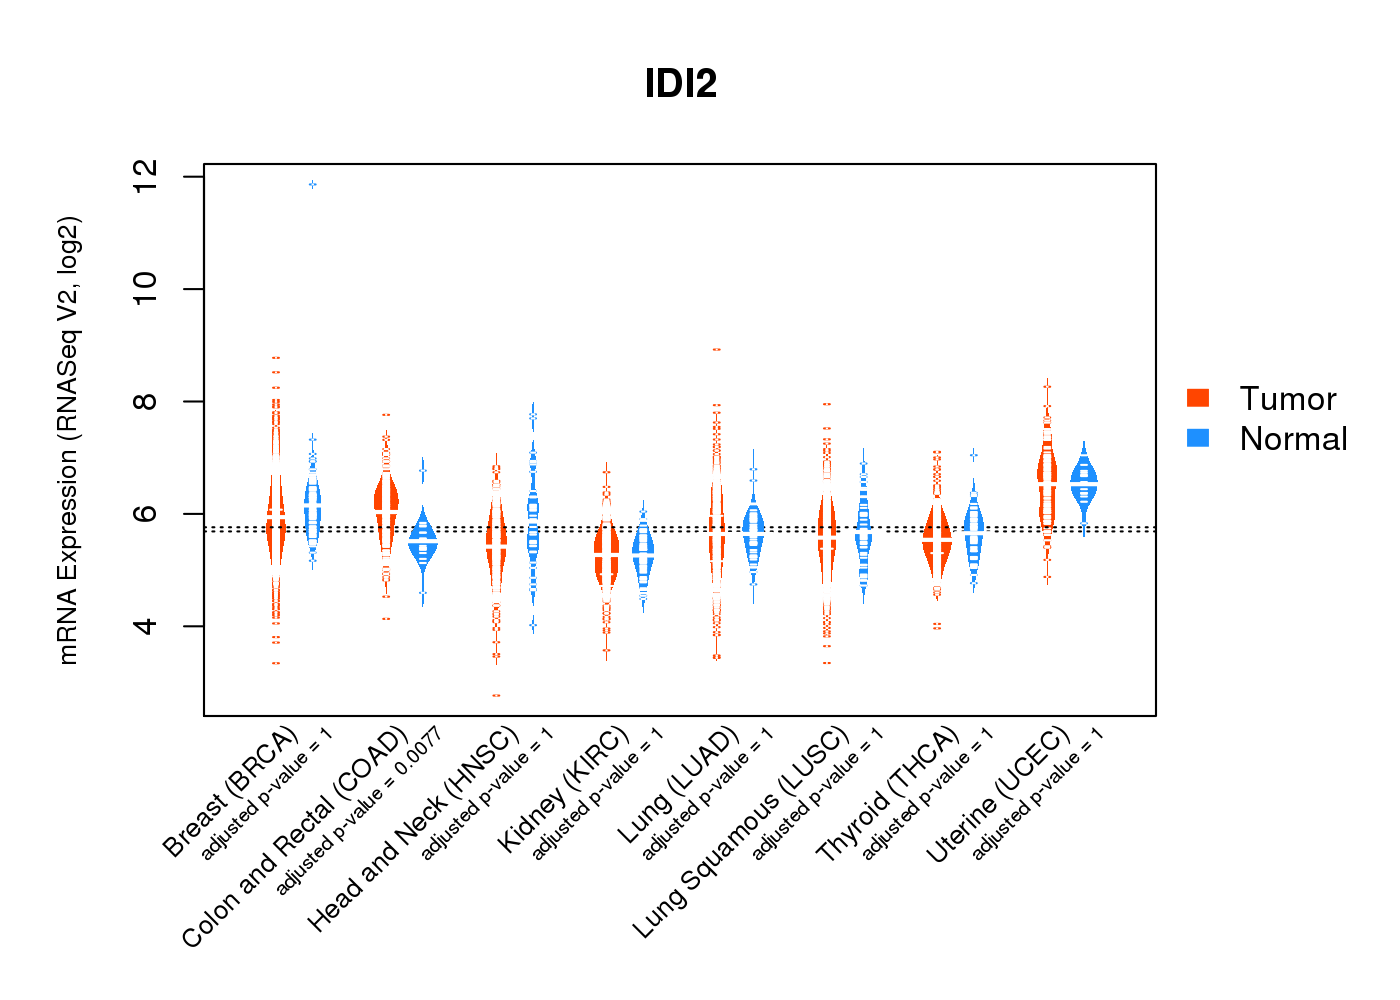
| * Normalized gene expression data of RNASeqV2 was extracted from TCGA using R package TCGA-Assembler. The URLs of all public data files on TCGA DCC data server were gathered at Jan-05-2015. Only eight cancer types have enough normal control samples for differential expression analysis. (t test, adjusted p<0.05 (using Benjamini-Hochberg FDR)) |
 |
| Top |
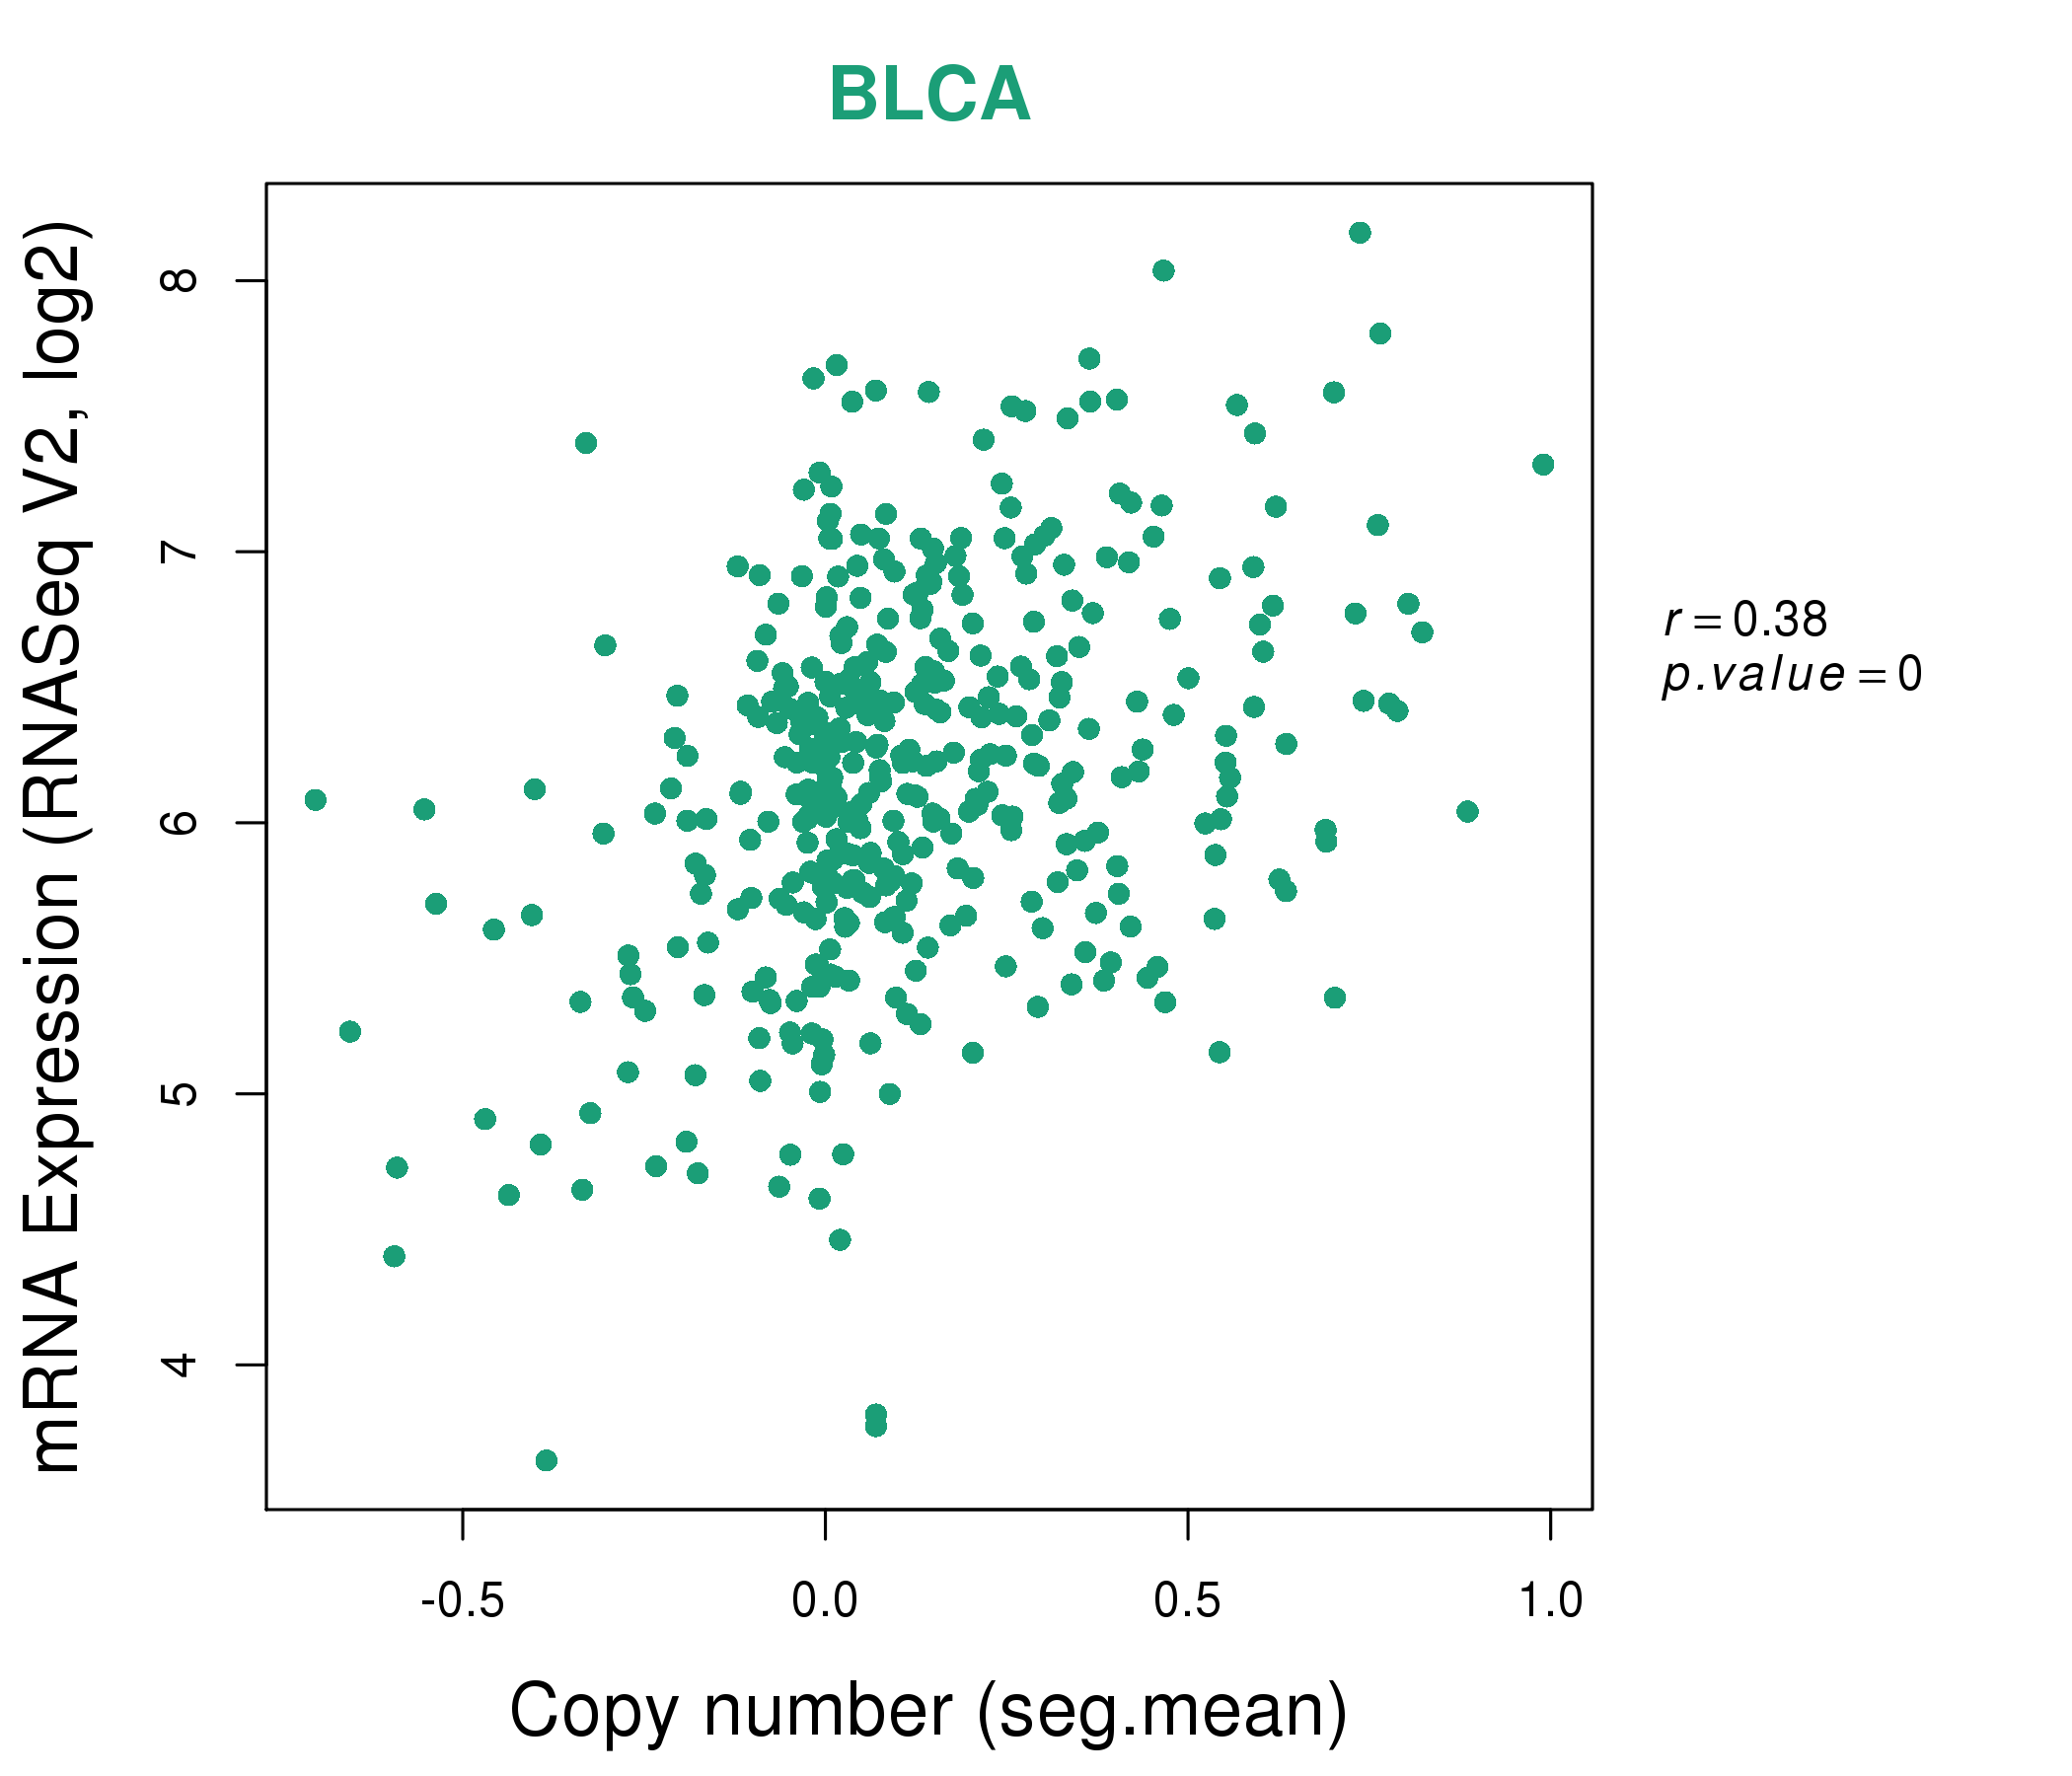
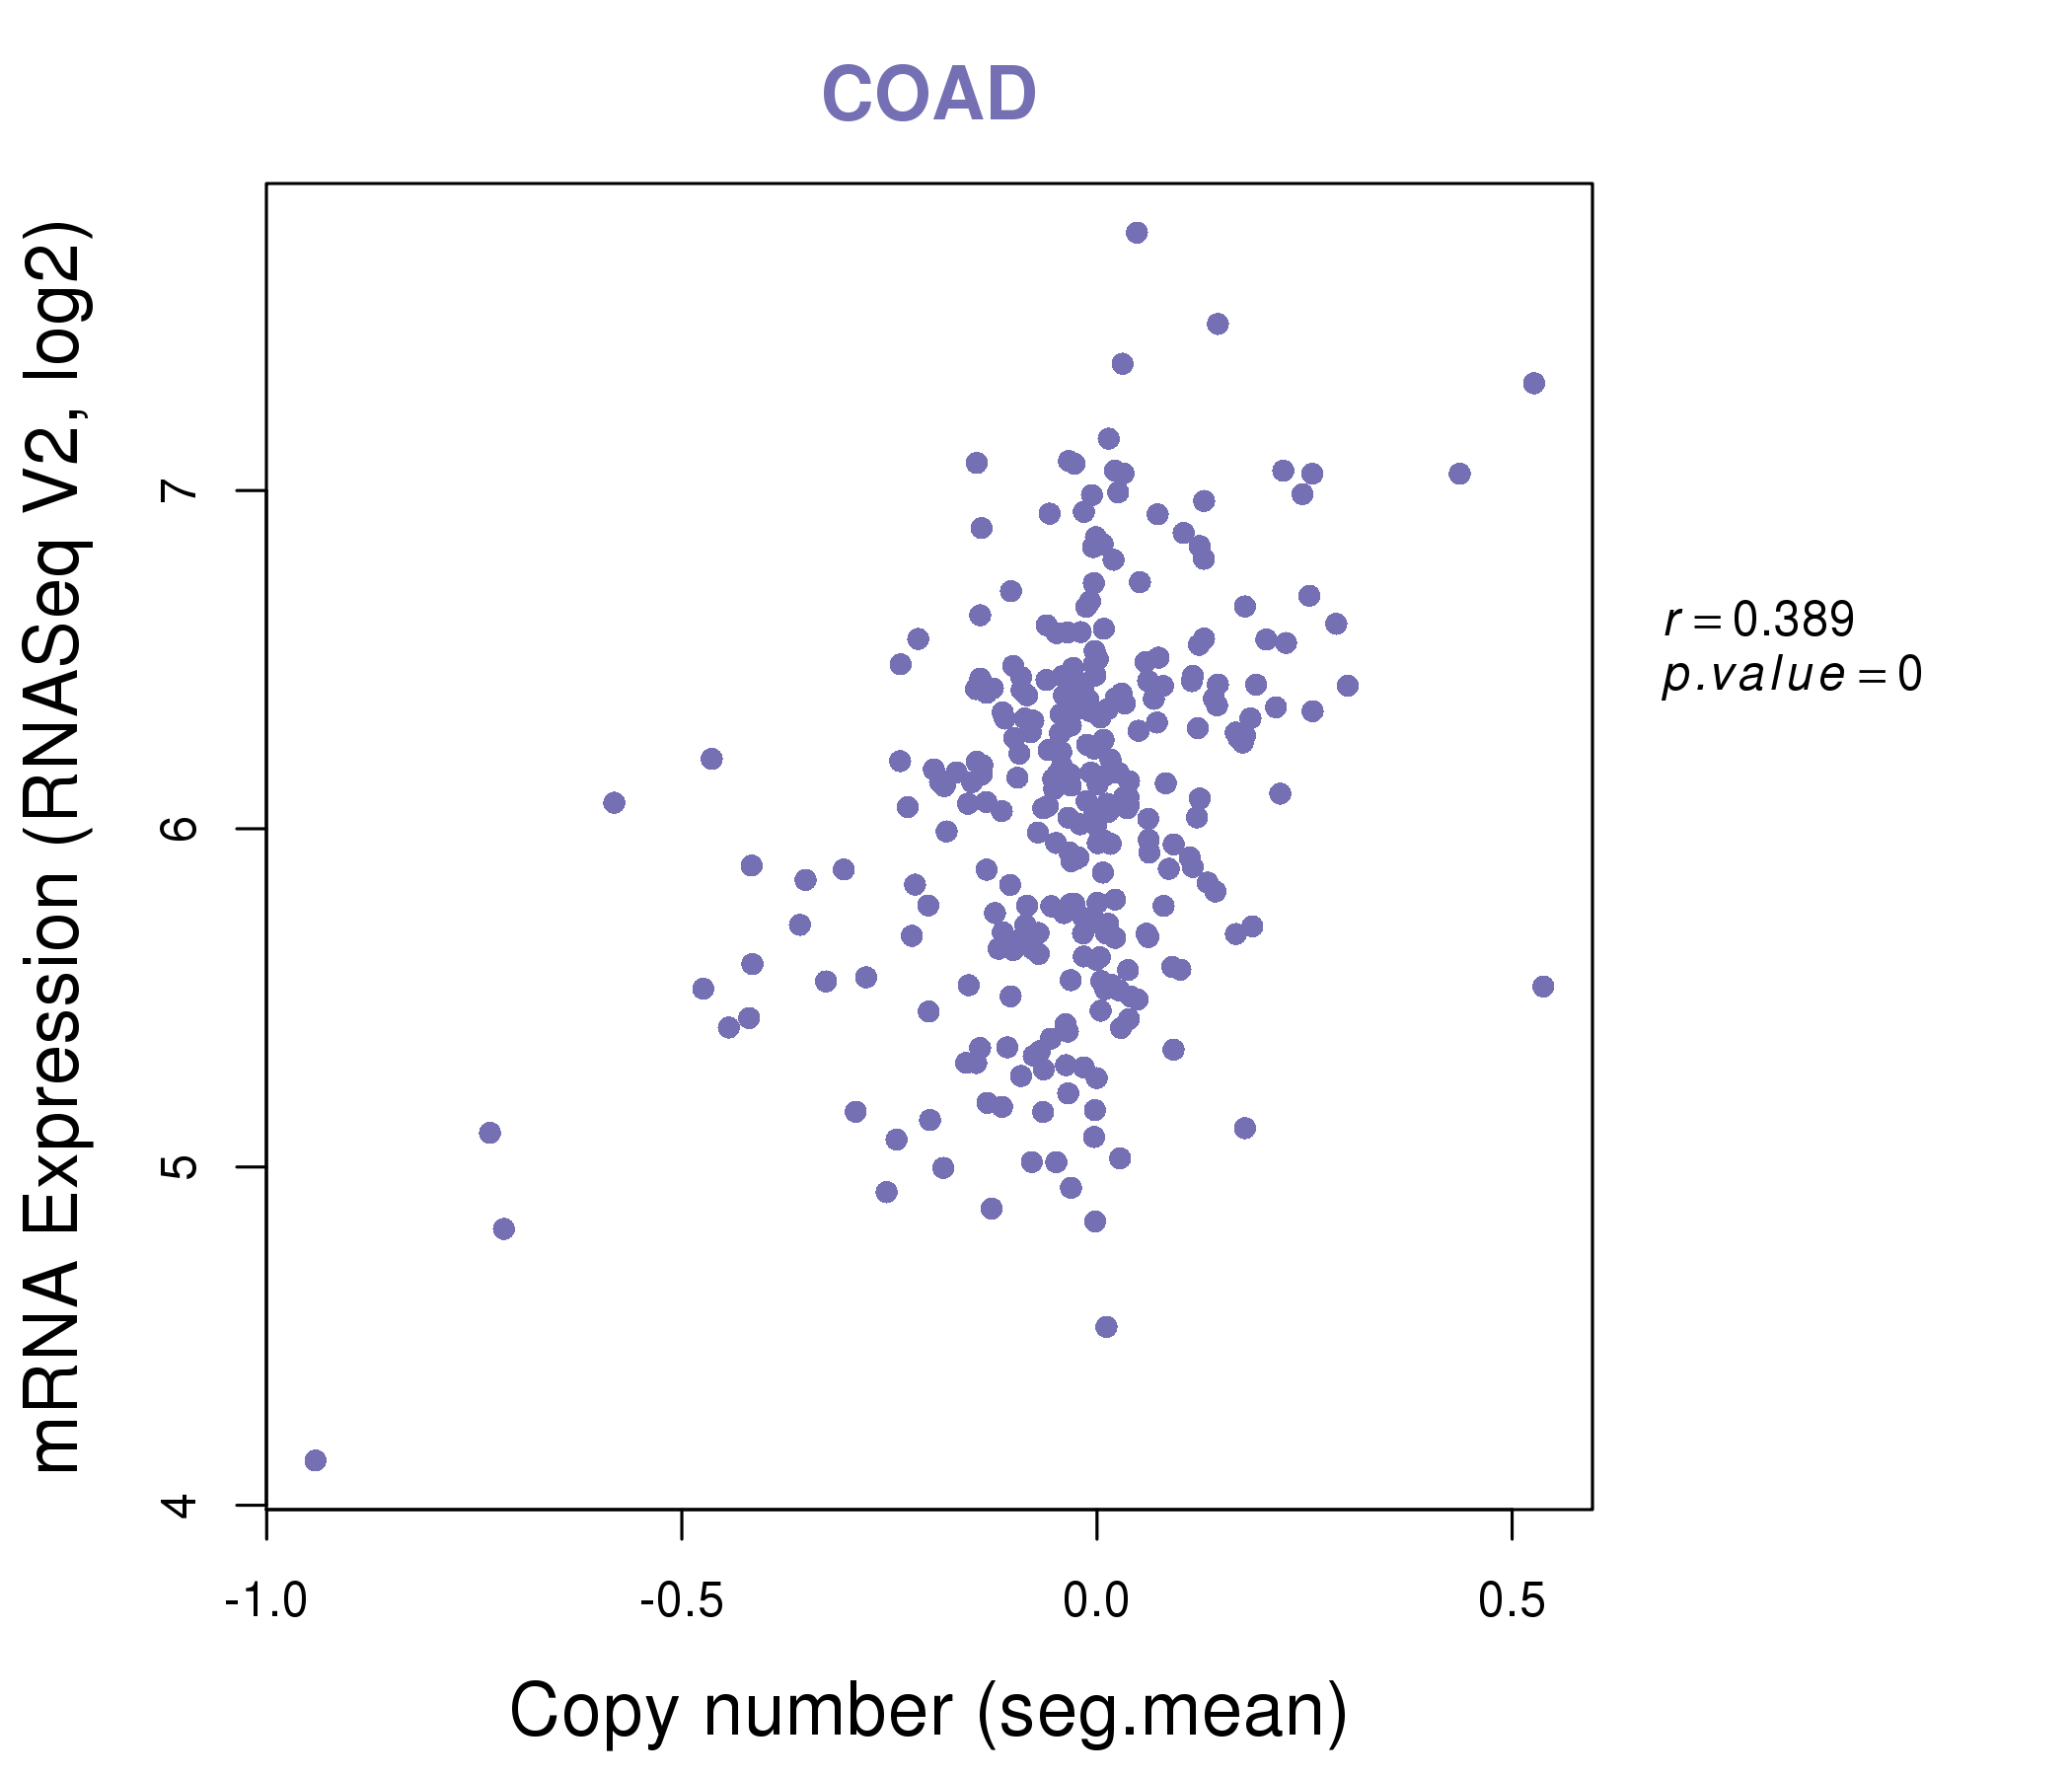
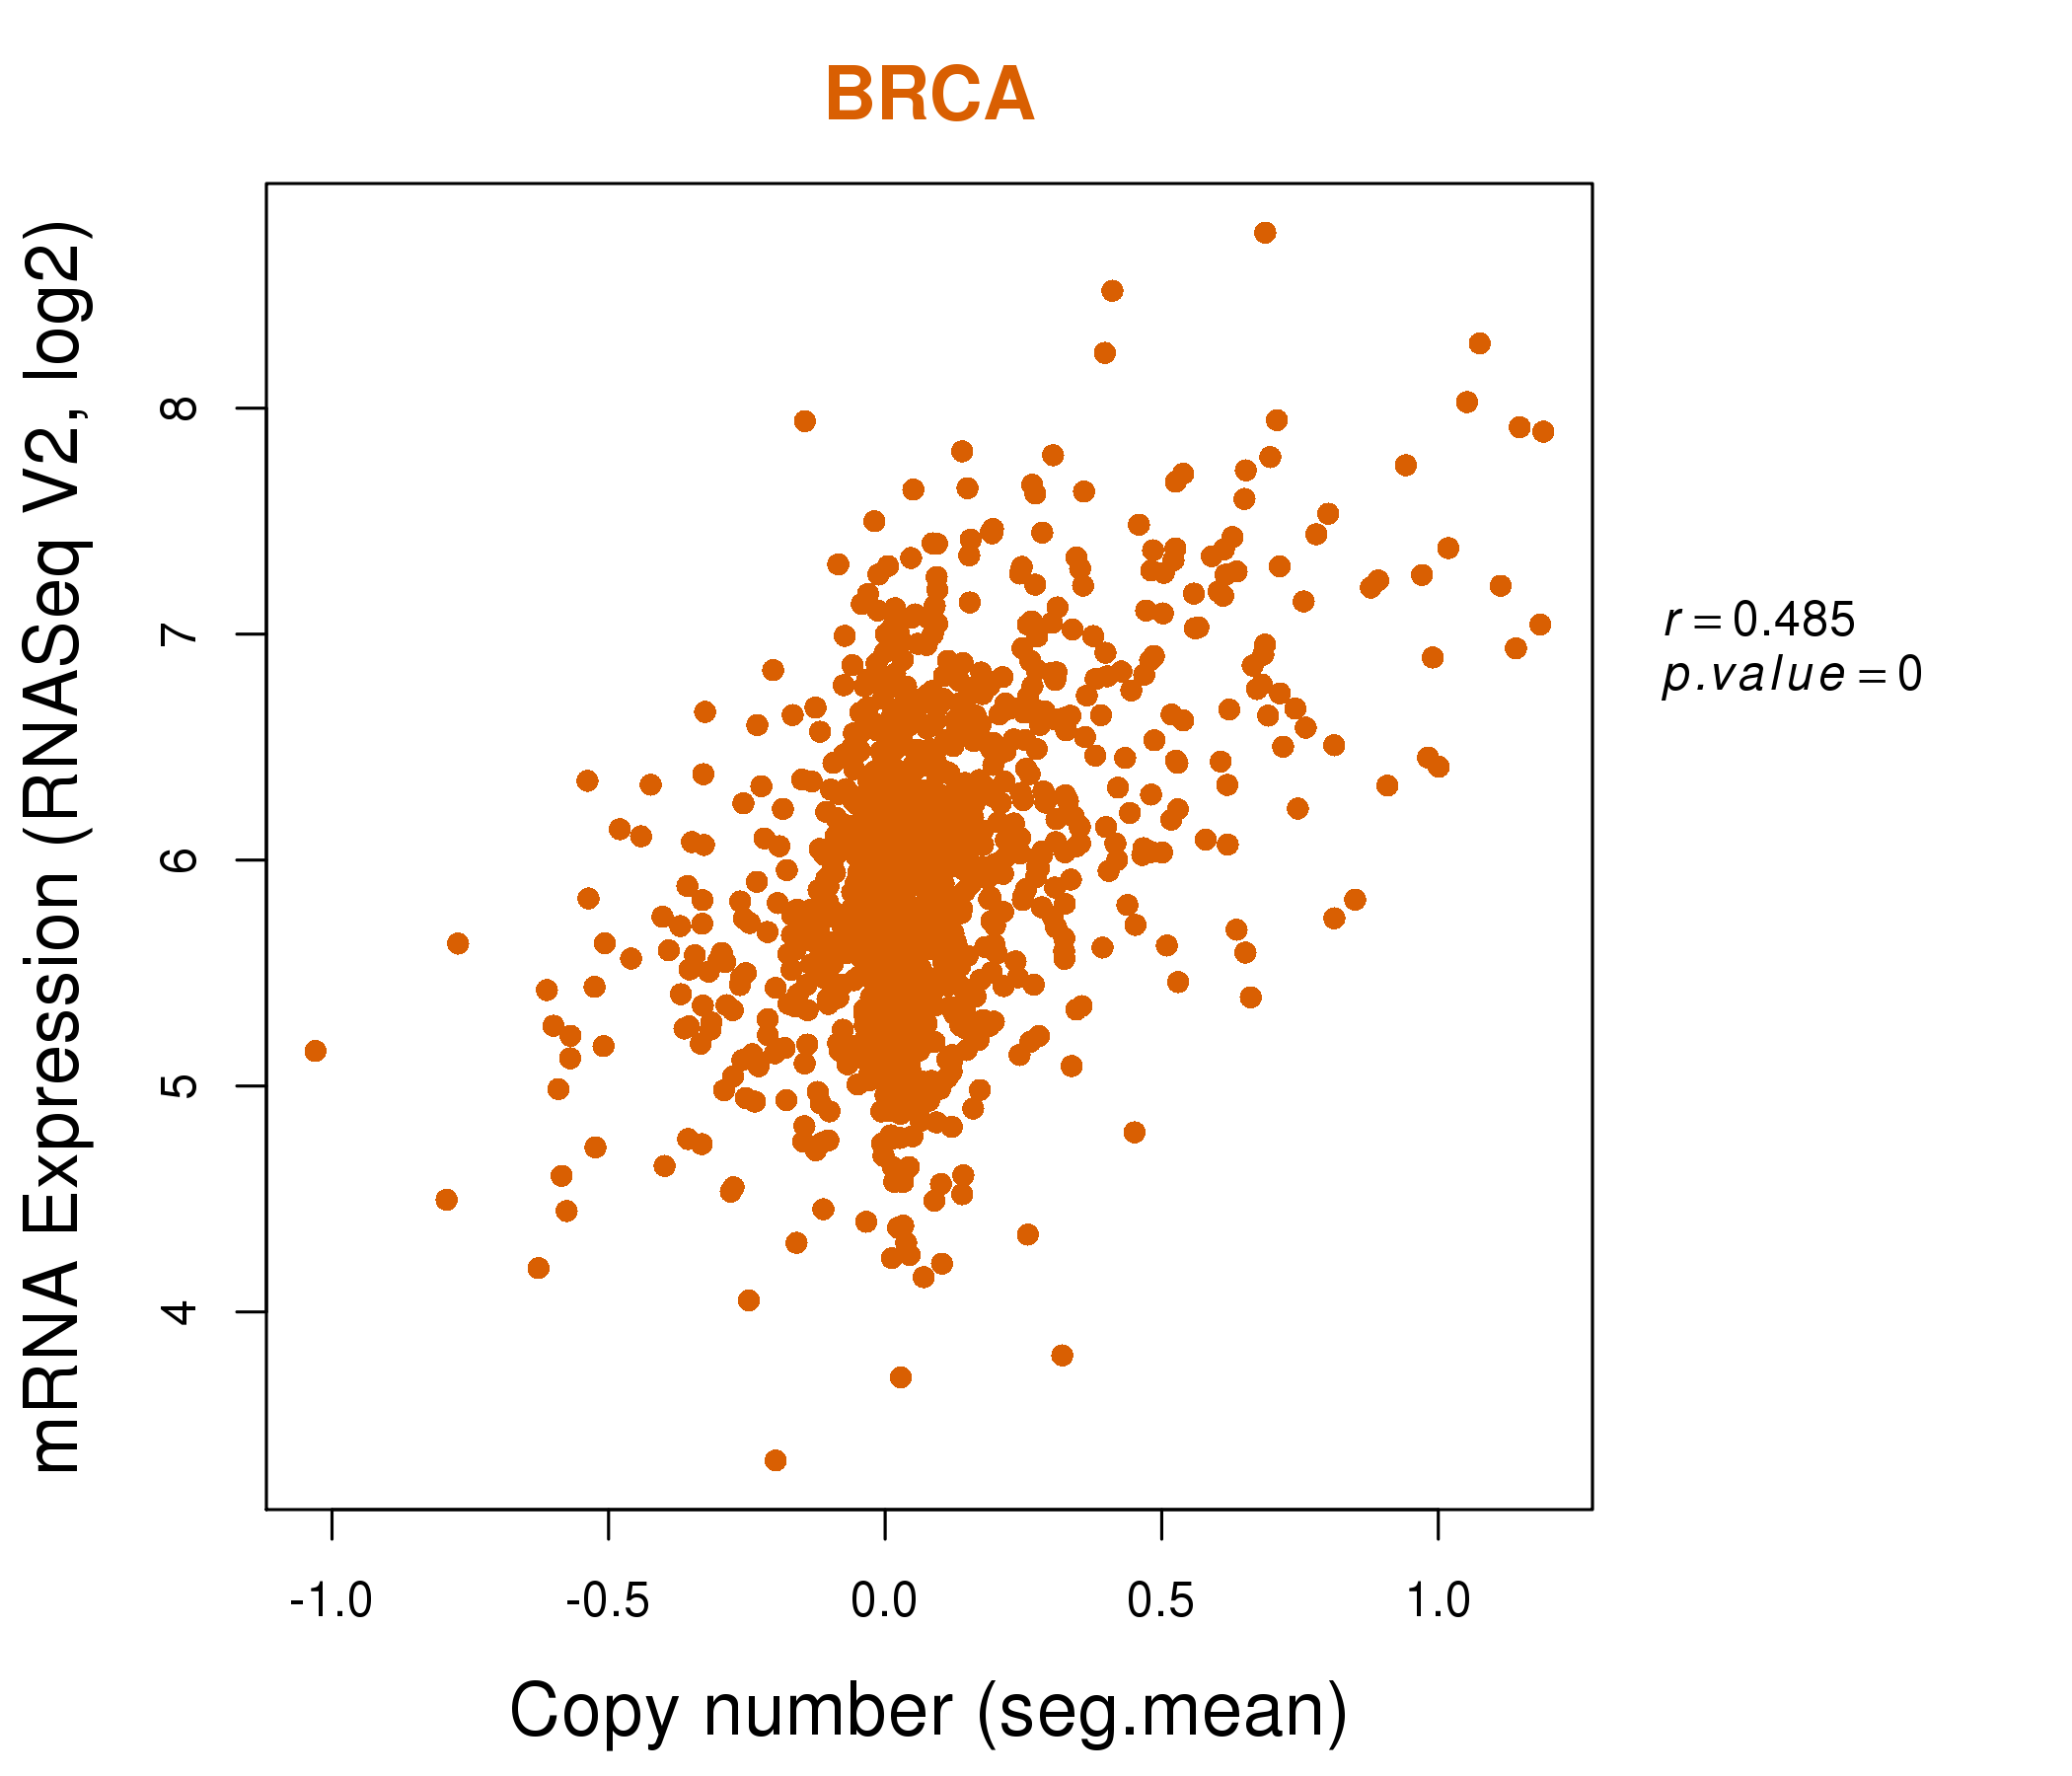
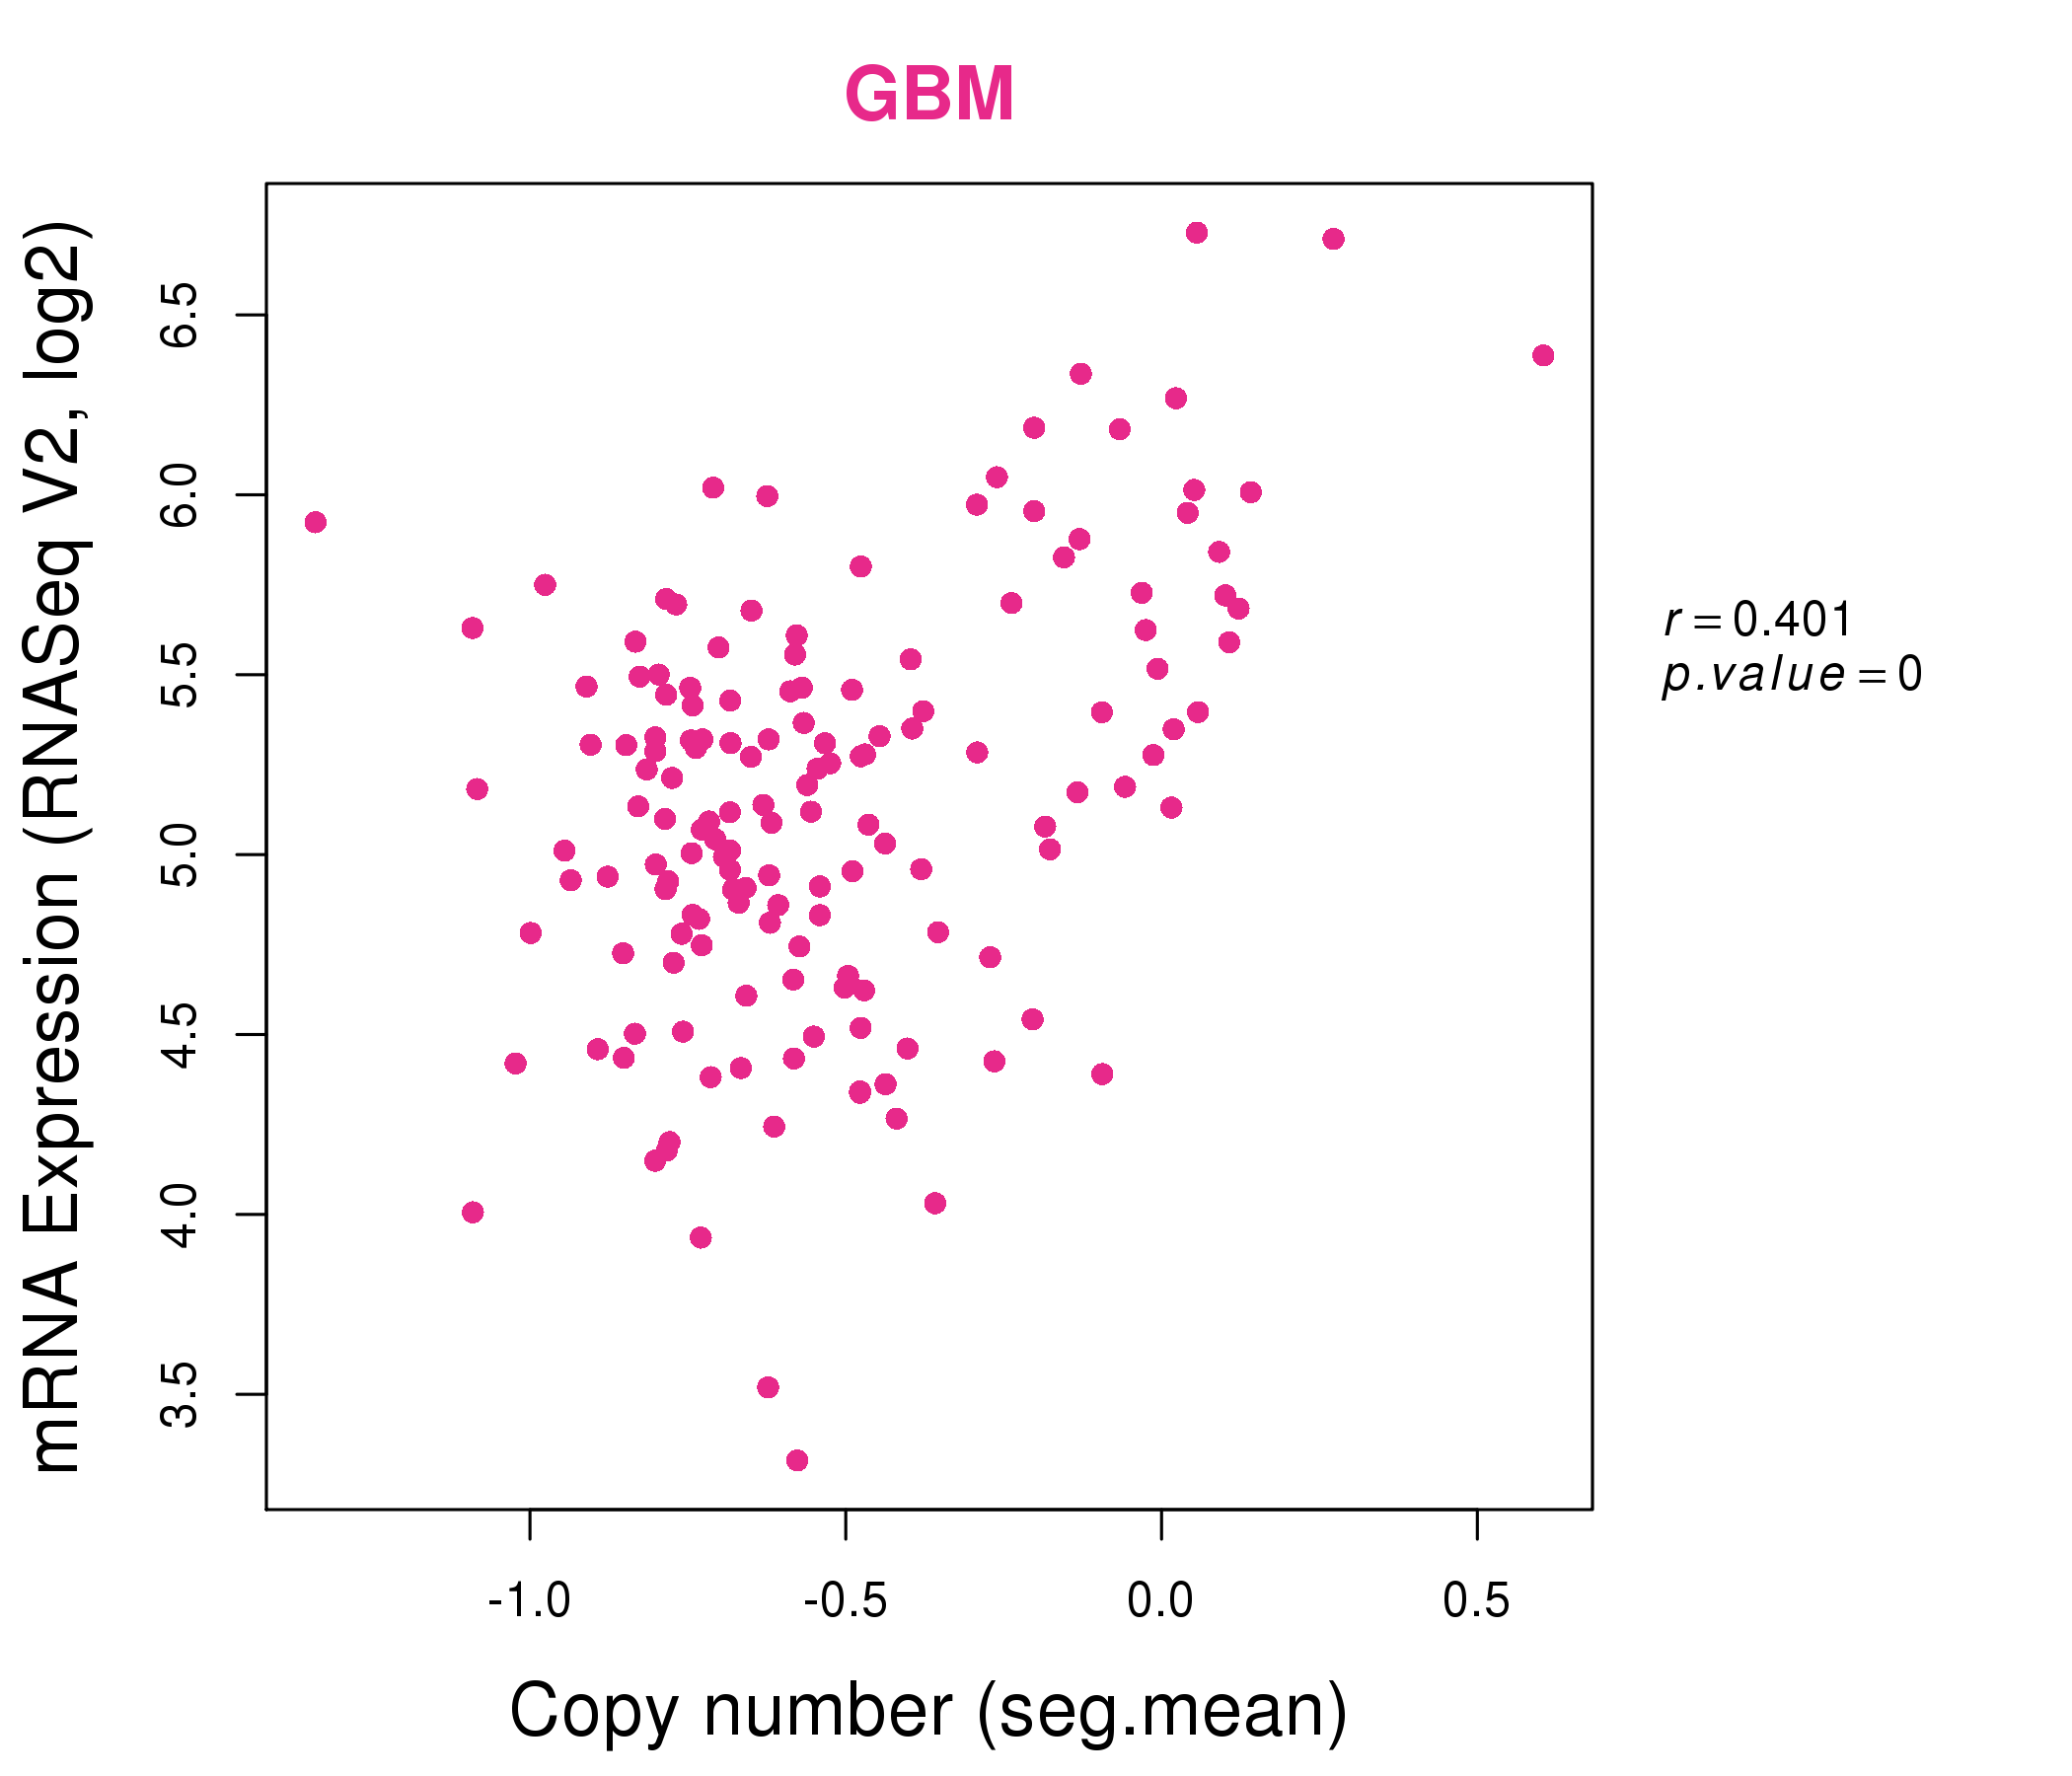
| * This plots show the correlation between CNV and gene expression. |
: Open all plots for all cancer types
 |
|
 |
|
| Top |
| Gene-Gene Network Information |
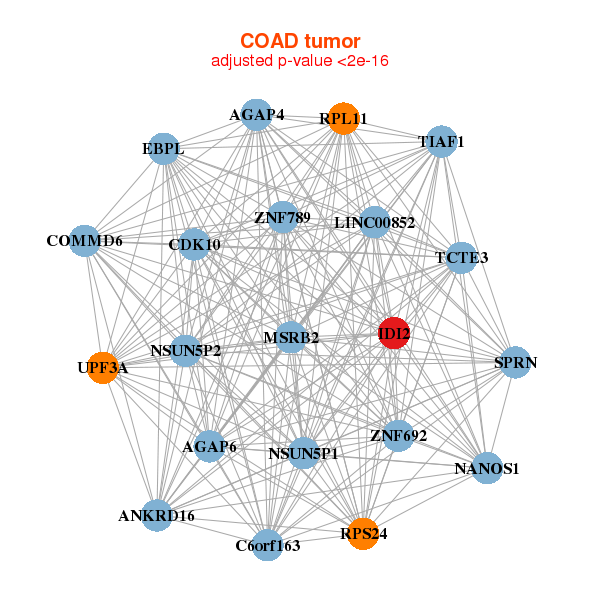
| * Co-Expression network figures were drawn using R package igraph. Only the top 20 genes with the highest correlations were shown. Red circle: input gene, orange circle: cell metabolism gene, sky circle: other gene |
: Open all plots for all cancer types
 |
|
| ATP5C1,SNHG15,CCT4,CDC123,DGUOK,FAM136A,GTPBP4, IDI2,KIN,LARP4B,LOC388796,MRTO4,NDUFAF4,NOP58, PDSS1,RANBP1,RBM17,RPIA,RPP38,RPS27A,SF3B14 | ANKRD23,ASB12,ASB5,CACNG1,CAPN3,DUSP26,FITM1, IDI2,JPH1,KCNA7,LRRC39,MB,MYADML2,MYBPH, MYH8,RYR1,SRPK3,TMEM38A,TNNI1,TNNI2,YIPF7 |
 |
|
| AGAP4,AGAP6,ANKRD16,LINC00852,C6orf163,CDK10,COMMD6, EBPL,IDI2,MSRB2,NANOS1,NSUN5P1,NSUN5P2,RPL11, RPS24,SPRN,TCTE3,TIAF1,UPF3A,ZNF692,ZNF789 | AKAP8,BCL3,BPY2,C6orf141,CHSY1,EGR4,EPHA2, FOSL1,FUT4,FUT5,IDI2,KIAA0040,KRT78,MESDC1, MMP13,OR2T12,OR52M1,PHLDA1,PNPLA5,SYCN,YTHDF1 |
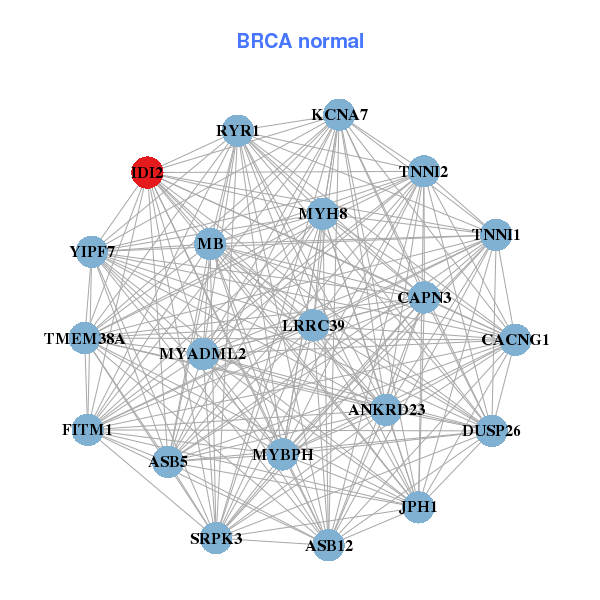
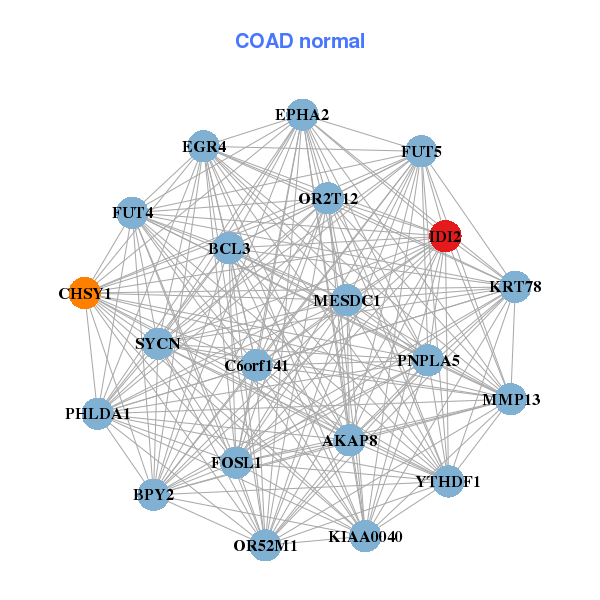
| * Co-Expression network figures were drawn using R package igraph. Only the top 20 genes with the highest correlations were shown. Red circle: input gene, orange circle: cell metabolism gene, sky circle: other gene |
: Open all plots for all cancer types
| Top |
: Open all interacting genes' information including KEGG pathway for all interacting genes from DAVID
| Top |
| Pharmacological Information for IDI2 |
| There's no related Drug. |
| Top |
| Cross referenced IDs for IDI2 |
| * We obtained these cross-references from Uniprot database. It covers 150 different DBs, 18 categories. http://www.uniprot.org/help/cross_references_section |
: Open all cross reference information
|
Copyright © 2016-Present - The Univsersity of Texas Health Science Center at Houston @ |