|
||||||||||||||||||||||||||||||||||||||||||||||||||||||||||||||||||||||||||||||||||||||||||||||||||||||||||||||||||||||||||||||||||||||||||||||||||||||||||||||||||||||||||||||||||||||||||||||||||||||||||||||||||||||||||||||||||||||||||||||||||||||||||||||||||||||||||||||||||||||||||||||||||||||||||||||||||||||||||
| |
| Phenotypic Information (metabolism pathway, cancer, disease, phenome) |
| |
| |
| Gene-Gene Network Information: Co-Expression Network, Interacting Genes & KEGG |
| |
|


| Gene Summary for VAPA |
| Basic gene info. | Gene symbol | VAPA |
| Gene name | VAMP (vesicle-associated membrane protein)-associated protein A, 33kDa | |
| Synonyms | VAP-33|VAP-A|VAP33|hVAP-33 | |
| Cytomap | UCSC genome browser: 18p11.22 | |
| Genomic location | chr18 :9913954-9960018 | |
| Type of gene | protein-coding | |
| RefGenes | NM_003574.5, NM_194434.2, | |
| Ensembl id | ENSG00000101558 | |
| Description | 33 kDa VAMP-associated proteinVAMP-AVAMP-associated protein Avesicle-associated membrane protein-associated protein A | |
| Modification date | 20141207 | |
| dbXrefs | MIM : 605703 | |
| HGNC : HGNC | ||
| Ensembl : ENSG00000101558 | ||
| HPRD : 09299 | ||
| Vega : OTTHUMG00000131603 | ||
| Protein | UniProt: go to UniProt's Cross Reference DB Table | |
| Expression | CleanEX: HS_VAPA | |
| BioGPS: 9218 | ||
| Gene Expression Atlas: ENSG00000101558 | ||
| The Human Protein Atlas: ENSG00000101558 | ||
| Pathway | NCI Pathway Interaction Database: VAPA | |
| KEGG: VAPA | ||
| REACTOME: VAPA | ||
| ConsensusPathDB | ||
| Pathway Commons: VAPA | ||
| Metabolism | MetaCyc: VAPA | |
| HUMANCyc: VAPA | ||
| Regulation | Ensembl's Regulation: ENSG00000101558 | |
| miRBase: chr18 :9,913,954-9,960,018 | ||
| TargetScan: NM_003574 | ||
| cisRED: ENSG00000101558 | ||
| Context | iHOP: VAPA | |
| cancer metabolism search in PubMed: VAPA | ||
| UCL Cancer Institute: VAPA | ||
| Assigned class in ccmGDB | C | |
| Top |
| Phenotypic Information for VAPA(metabolism pathway, cancer, disease, phenome) |
| Cancer | CGAP: VAPA |
| Familial Cancer Database: VAPA | |
| * This gene is included in those cancer gene databases. |
|
|
|
|
|
|
| ||||||||||||||||||||||||||||||||||||||||||||||||||||||||||||||||||||||||||||||||||||||||||||||||||||||||||||||||||||||||||||||||||||||||||||||||||||||||||||||||||||||||||||||||||||||||||||||||||||||||||||||||||||||||||||||||||||||||||||||||||||||||||||||||||||||||||||||||||||||||||||||||||||||||||||||||||||
Oncogene 1 | Significant driver gene in | |||||||||||||||||||||||||||||||||||||||||||||||||||||||||||||||||||||||||||||||||||||||||||||||||||||||||||||||||||||||||||||||||||||||||||||||||||||||||||||||||||||||||||||||||||||||||||||||||||||||||||||||||||||||||||||||||||||||||||||||||||||||||||||||||||||||||||||||||||||||||||||||||||||||||||||||||||||||||
| cf) number; DB name 1 Oncogene; http://nar.oxfordjournals.org/content/35/suppl_1/D721.long, 2 Tumor Suppressor gene; https://bioinfo.uth.edu/TSGene/, 3 Cancer Gene Census; http://www.nature.com/nrc/journal/v4/n3/abs/nrc1299.html, 4 CancerGenes; http://nar.oxfordjournals.org/content/35/suppl_1/D721.long, 5 Network of Cancer Gene; http://ncg.kcl.ac.uk/index.php, 1Therapeutic Vulnerabilities in Cancer; http://cbio.mskcc.org/cancergenomics/statius/ |
| REACTOME_PHOSPHOLIPID_METABOLISM REACTOME_SPHINGOLIPID_METABOLISM REACTOME_METABOLISM_OF_LIPIDS_AND_LIPOPROTEINS | |
| OMIM | |
| Orphanet | |
| Disease | KEGG Disease: VAPA |
| MedGen: VAPA (Human Medical Genetics with Condition) | |
| ClinVar: VAPA | |
| Phenotype | MGI: VAPA (International Mouse Phenotyping Consortium) |
| PhenomicDB: VAPA | |
| Mutations for VAPA |
| * Under tables are showing count per each tissue to give us broad intuition about tissue specific mutation patterns.You can go to the detailed page for each mutation database's web site. |
| There's no structural variation information in COSMIC data for this gene. |
| * From mRNA Sanger sequences, Chitars2.0 arranged chimeric transcripts. This table shows VAPA related fusion information. |
| ID | Head Gene | Tail Gene | Accession | Gene_a | qStart_a | qEnd_a | Chromosome_a | tStart_a | tEnd_a | Gene_a | qStart_a | qEnd_a | Chromosome_a | tStart_a | tEnd_a |
| BM836599 | LOC100507412 | 1 | 55 | ? | 110110 | 110164 | VAPA | 56 | 398 | 18 | 9914022 | 9931838 | |
| AU117419 | TMEM38B | 1 | 353 | 9 | 108537038 | 108537390 | VAPA | 354 | 808 | 18 | 9931864 | 9950566 | |
| BF094407 | VAPA | 13 | 121 | 18 | 9954319 | 9954428 | SEC11A | 120 | 348 | 15 | 85223946 | 85230966 | |
| AK000918 | TMEM38B | 1 | 353 | 9 | 108537038 | 108537390 | VAPA | 354 | 1579 | 18 | 9931864 | 9954820 | |
| BF094402 | VAPA | 4 | 310 | 18 | 9954310 | 9954623 | VAPA | 300 | 362 | 18 | 9954370 | 9954432 | |
| Top |
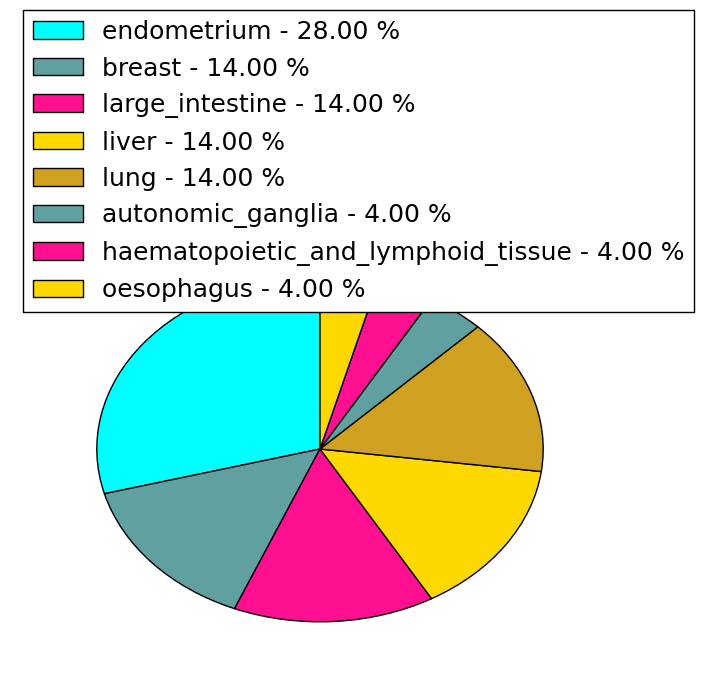
| Mutation type/ Tissue ID | brca | cns | cerv | endome | haematopo | kidn | Lintest | liver | lung | ns | ovary | pancre | prost | skin | stoma | thyro | urina | |||
| Total # sample | 1 | 1 | ||||||||||||||||||
| GAIN (# sample) | 1 | 1 | ||||||||||||||||||
| LOSS (# sample) |
| cf) Tissue ID; Tissue type (1; Breast, 2; Central_nervous_system, 3; Cervix, 4; Endometrium, 5; Haematopoietic_and_lymphoid_tissue, 6; Kidney, 7; Large_intestine, 8; Liver, 9; Lung, 10; NS, 11; Ovary, 12; Pancreas, 13; Prostate, 14; Skin, 15; Stomach, 16; Thyroid, 17; Urinary_tract) |
| Top |
|
 |
| Top |
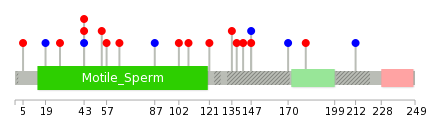
| Stat. for Non-Synonymous SNVs (# total SNVs=21) | (# total SNVs=8) |
 |  |
(# total SNVs=0) | (# total SNVs=0) |
| Top |
| * When you move the cursor on each content, you can see more deailed mutation information on the Tooltip. Those are primary_site,primary_histology,mutation(aa),pubmedID. |
| GRCh37 position | Mutation(aa) | Unique sampleID count |
| chr18:9944924-9944924 | p.I141V | 2 |
| chr18:9937030-9937030 | p.C128C | 2 |
| chr18:9950516-9950516 | p.R226I | 1 |
| chr18:9931961-9931961 | p.? | 1 |
| chr18:9944943-9944943 | p.A147V | 1 |
| chr18:9914267-9914267 | p.S5L | 1 |
| chr18:9950521-9950521 | p.Q228* | 1 |
| chr18:9936135-9936135 | p.P87P | 1 |
| chr18:9944956-9944956 | p.T151T | 1 |
| chr18:9914299-9914299 | p.V16L | 1 |
| Top |
|
 |
| Point Mutation/ Tissue ID | 1 | 2 | 3 | 4 | 5 | 6 | 7 | 8 | 9 | 10 | 11 | 12 | 13 | 14 | 15 | 16 | 17 | 18 | 19 | 20 |
| # sample | 2 | 1 | 1 | 2 | 1 | 1 | 1 | 1 | 2 | 4 | ||||||||||
| # mutation | 2 | 1 | 1 | 2 | 1 | 1 | 1 | 1 | 2 | 9 | ||||||||||
| nonsynonymous SNV | 2 | 1 | 2 | 1 | 1 | 1 | 1 | 6 | ||||||||||||
| synonymous SNV | 1 | 1 | 1 | 3 |
| cf) Tissue ID; Tissue type (1; BLCA[Bladder Urothelial Carcinoma], 2; BRCA[Breast invasive carcinoma], 3; CESC[Cervical squamous cell carcinoma and endocervical adenocarcinoma], 4; COAD[Colon adenocarcinoma], 5; GBM[Glioblastoma multiforme], 6; Glioma Low Grade, 7; HNSC[Head and Neck squamous cell carcinoma], 8; KICH[Kidney Chromophobe], 9; KIRC[Kidney renal clear cell carcinoma], 10; KIRP[Kidney renal papillary cell carcinoma], 11; LAML[Acute Myeloid Leukemia], 12; LUAD[Lung adenocarcinoma], 13; LUSC[Lung squamous cell carcinoma], 14; OV[Ovarian serous cystadenocarcinoma ], 15; PAAD[Pancreatic adenocarcinoma], 16; PRAD[Prostate adenocarcinoma], 17; SKCM[Skin Cutaneous Melanoma], 18:STAD[Stomach adenocarcinoma], 19:THCA[Thyroid carcinoma], 20:UCEC[Uterine Corpus Endometrial Carcinoma]) |
| Top |
| * We represented just top 10 SNVs. When you move the cursor on each content, you can see more deailed mutation information on the Tooltip. Those are primary_site, primary_histology, mutation(aa), pubmedID. |
| Genomic Position | Mutation(aa) | Unique sampleID count |
| chr18:9931855 | p.S43L,VAPA | 2 |
| chr18:9936135 | p.L121V,VAPA | 1 |
| chr18:9954094 | p.E135D,VAPA | 1 |
| chr18:9936179 | p.K138T,VAPA | 1 |
| chr18:9936196 | p.A147V | 1 |
| chr18:9914267 | p.M142T,VAPA | 1 |
| chr18:9937007 | p.S5L,VAPA | 1 |
| chr18:9914310 | p.A147A,VAPA | 1 |
| chr18:9937051 | p.P19P,VAPA | 1 |
| chr18:9931810 | p.T170T,VAPA | 1 |
| * Copy number data were extracted from TCGA using R package TCGA-Assembler. The URLs of all public data files on TCGA DCC data server were gathered on Jan-05-2015. Function ProcessCNAData in TCGA-Assembler package was used to obtain gene-level copy number value which is calculated as the average copy number of the genomic region of a gene. |
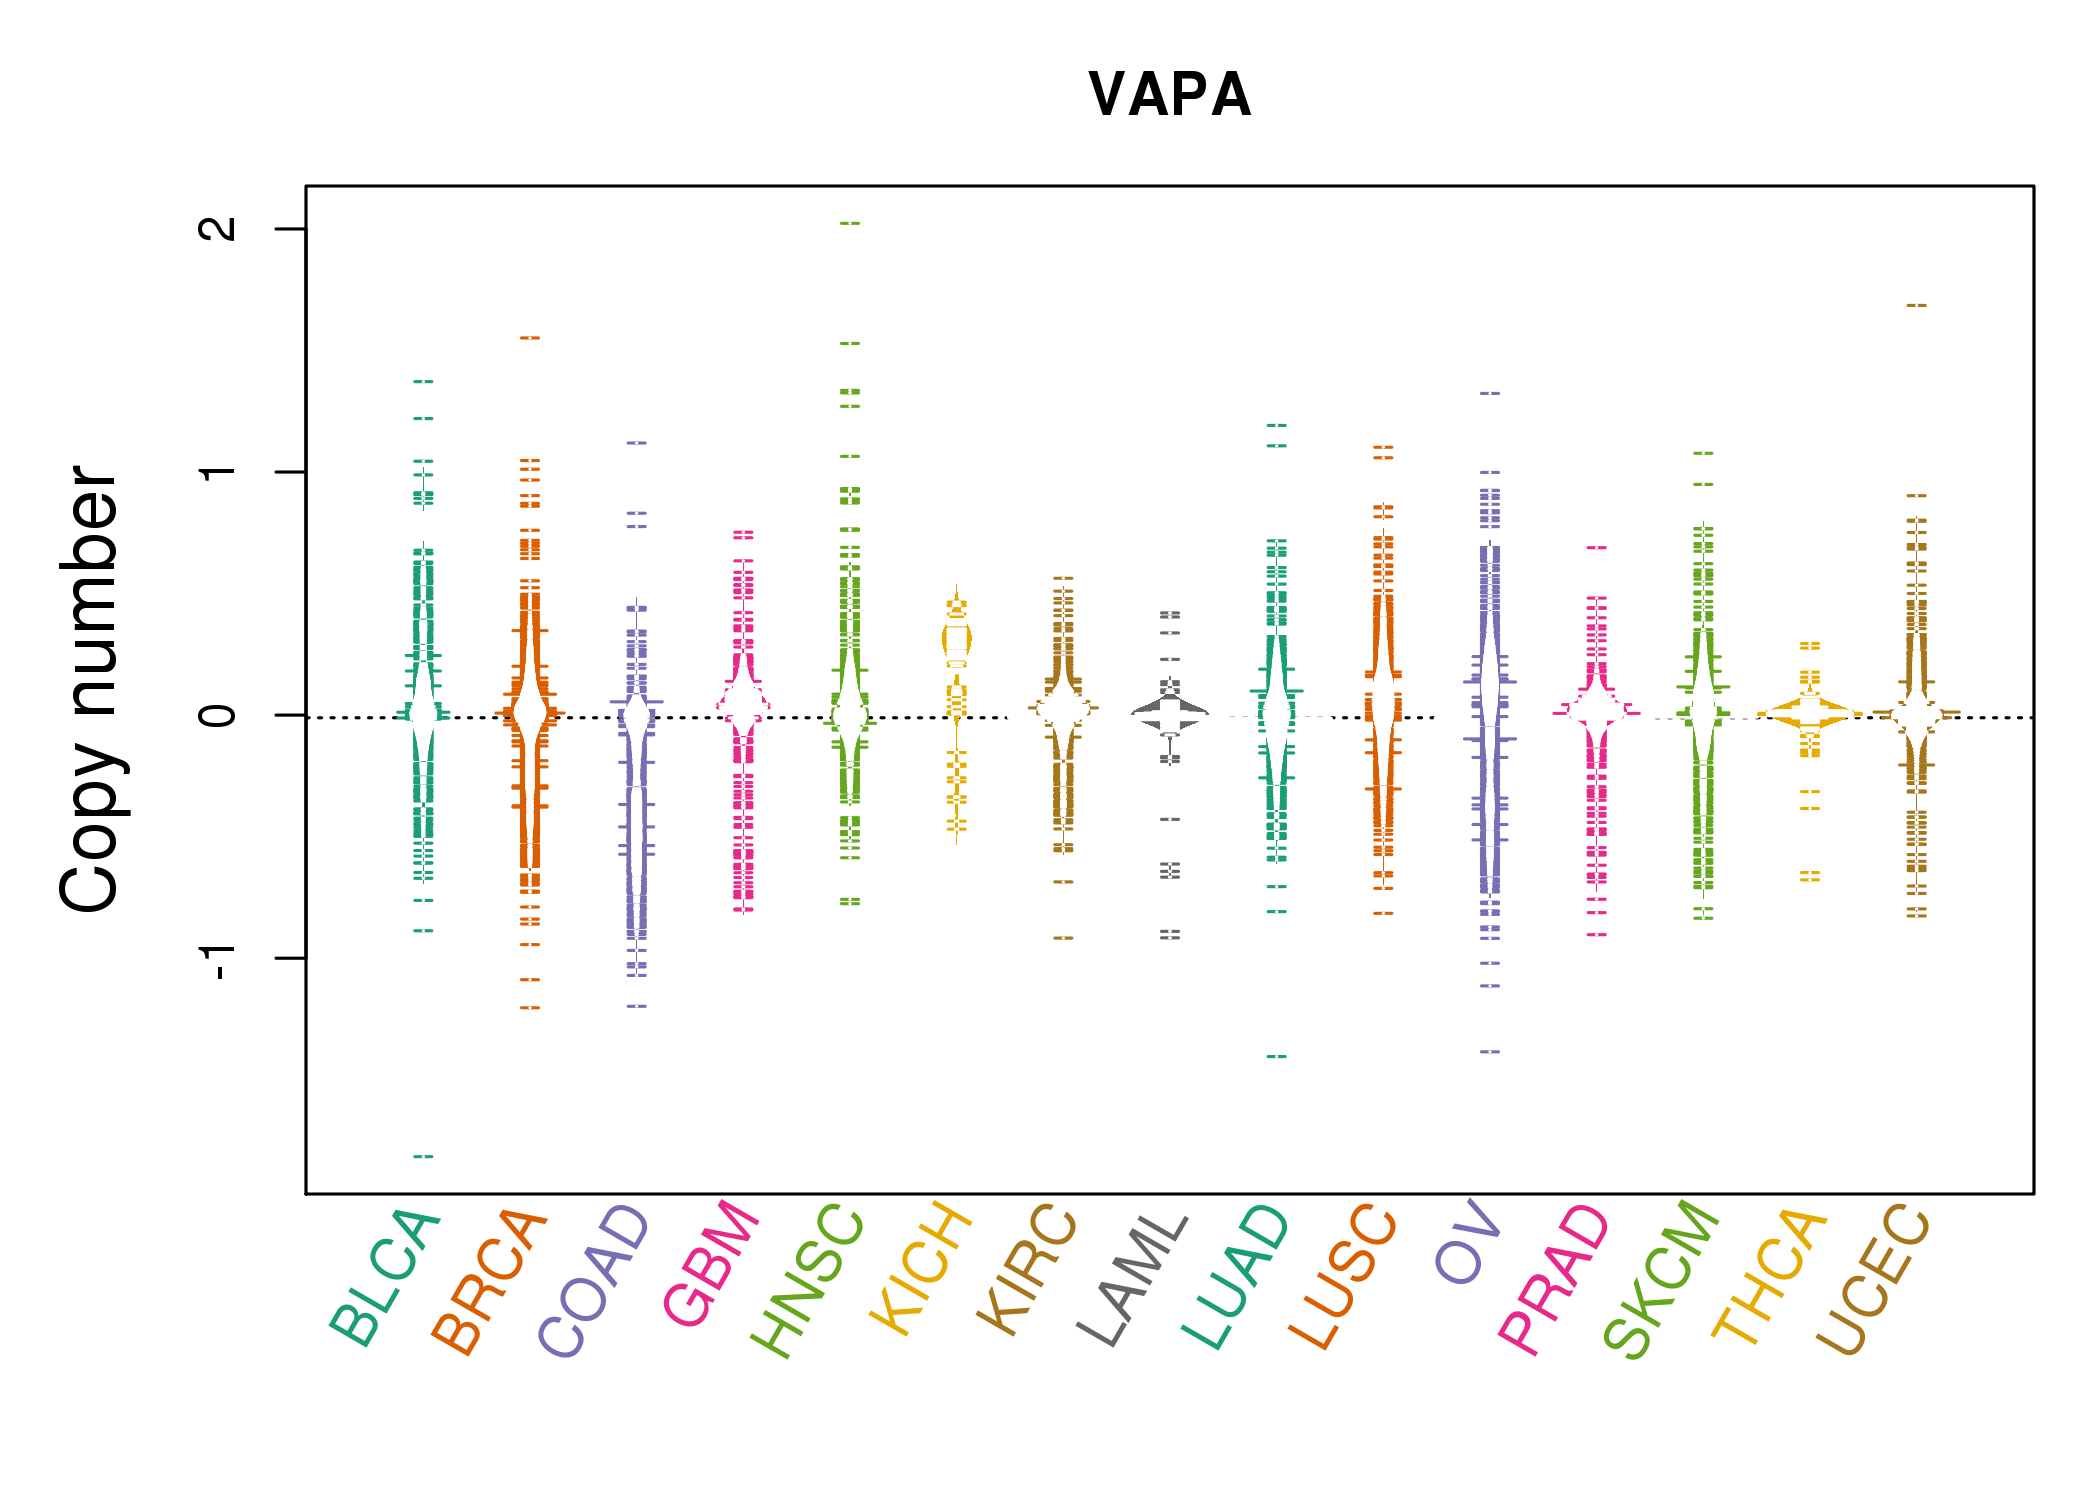 |
| cf) Tissue ID[Tissue type]: BLCA[Bladder Urothelial Carcinoma], BRCA[Breast invasive carcinoma], CESC[Cervical squamous cell carcinoma and endocervical adenocarcinoma], COAD[Colon adenocarcinoma], GBM[Glioblastoma multiforme], Glioma Low Grade, HNSC[Head and Neck squamous cell carcinoma], KICH[Kidney Chromophobe], KIRC[Kidney renal clear cell carcinoma], KIRP[Kidney renal papillary cell carcinoma], LAML[Acute Myeloid Leukemia], LUAD[Lung adenocarcinoma], LUSC[Lung squamous cell carcinoma], OV[Ovarian serous cystadenocarcinoma ], PAAD[Pancreatic adenocarcinoma], PRAD[Prostate adenocarcinoma], SKCM[Skin Cutaneous Melanoma], STAD[Stomach adenocarcinoma], THCA[Thyroid carcinoma], UCEC[Uterine Corpus Endometrial Carcinoma] |
| Top |
| Gene Expression for VAPA |
| * CCLE gene expression data were extracted from CCLE_Expression_Entrez_2012-10-18.res: Gene-centric RMA-normalized mRNA expression data. |
 |
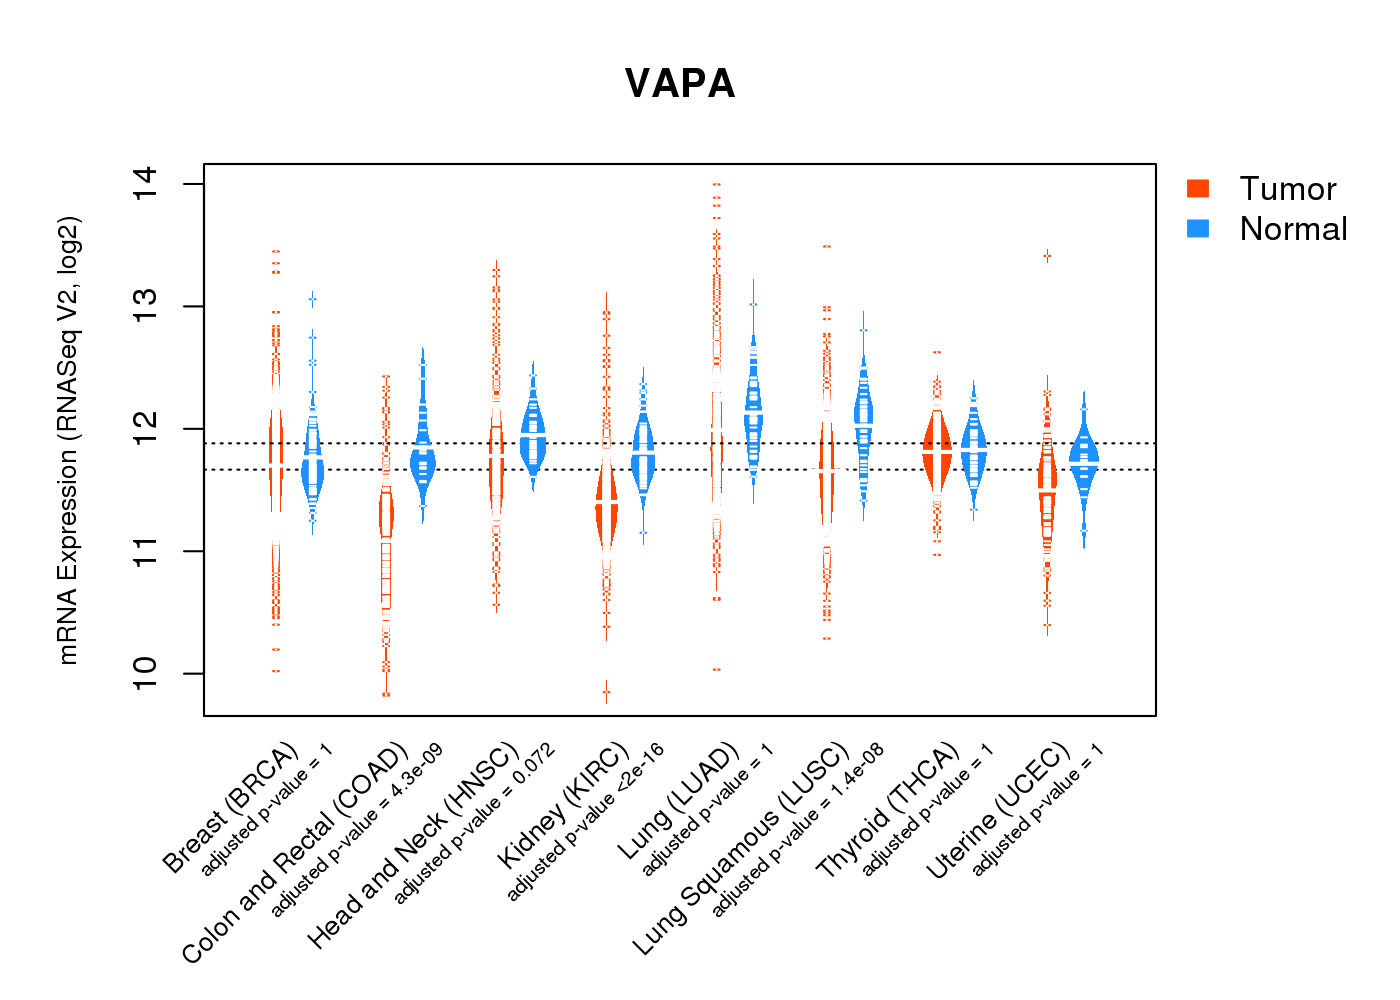
| * Normalized gene expression data of RNASeqV2 was extracted from TCGA using R package TCGA-Assembler. The URLs of all public data files on TCGA DCC data server were gathered at Jan-05-2015. Only eight cancer types have enough normal control samples for differential expression analysis. (t test, adjusted p<0.05 (using Benjamini-Hochberg FDR)) |
 |
| Top |
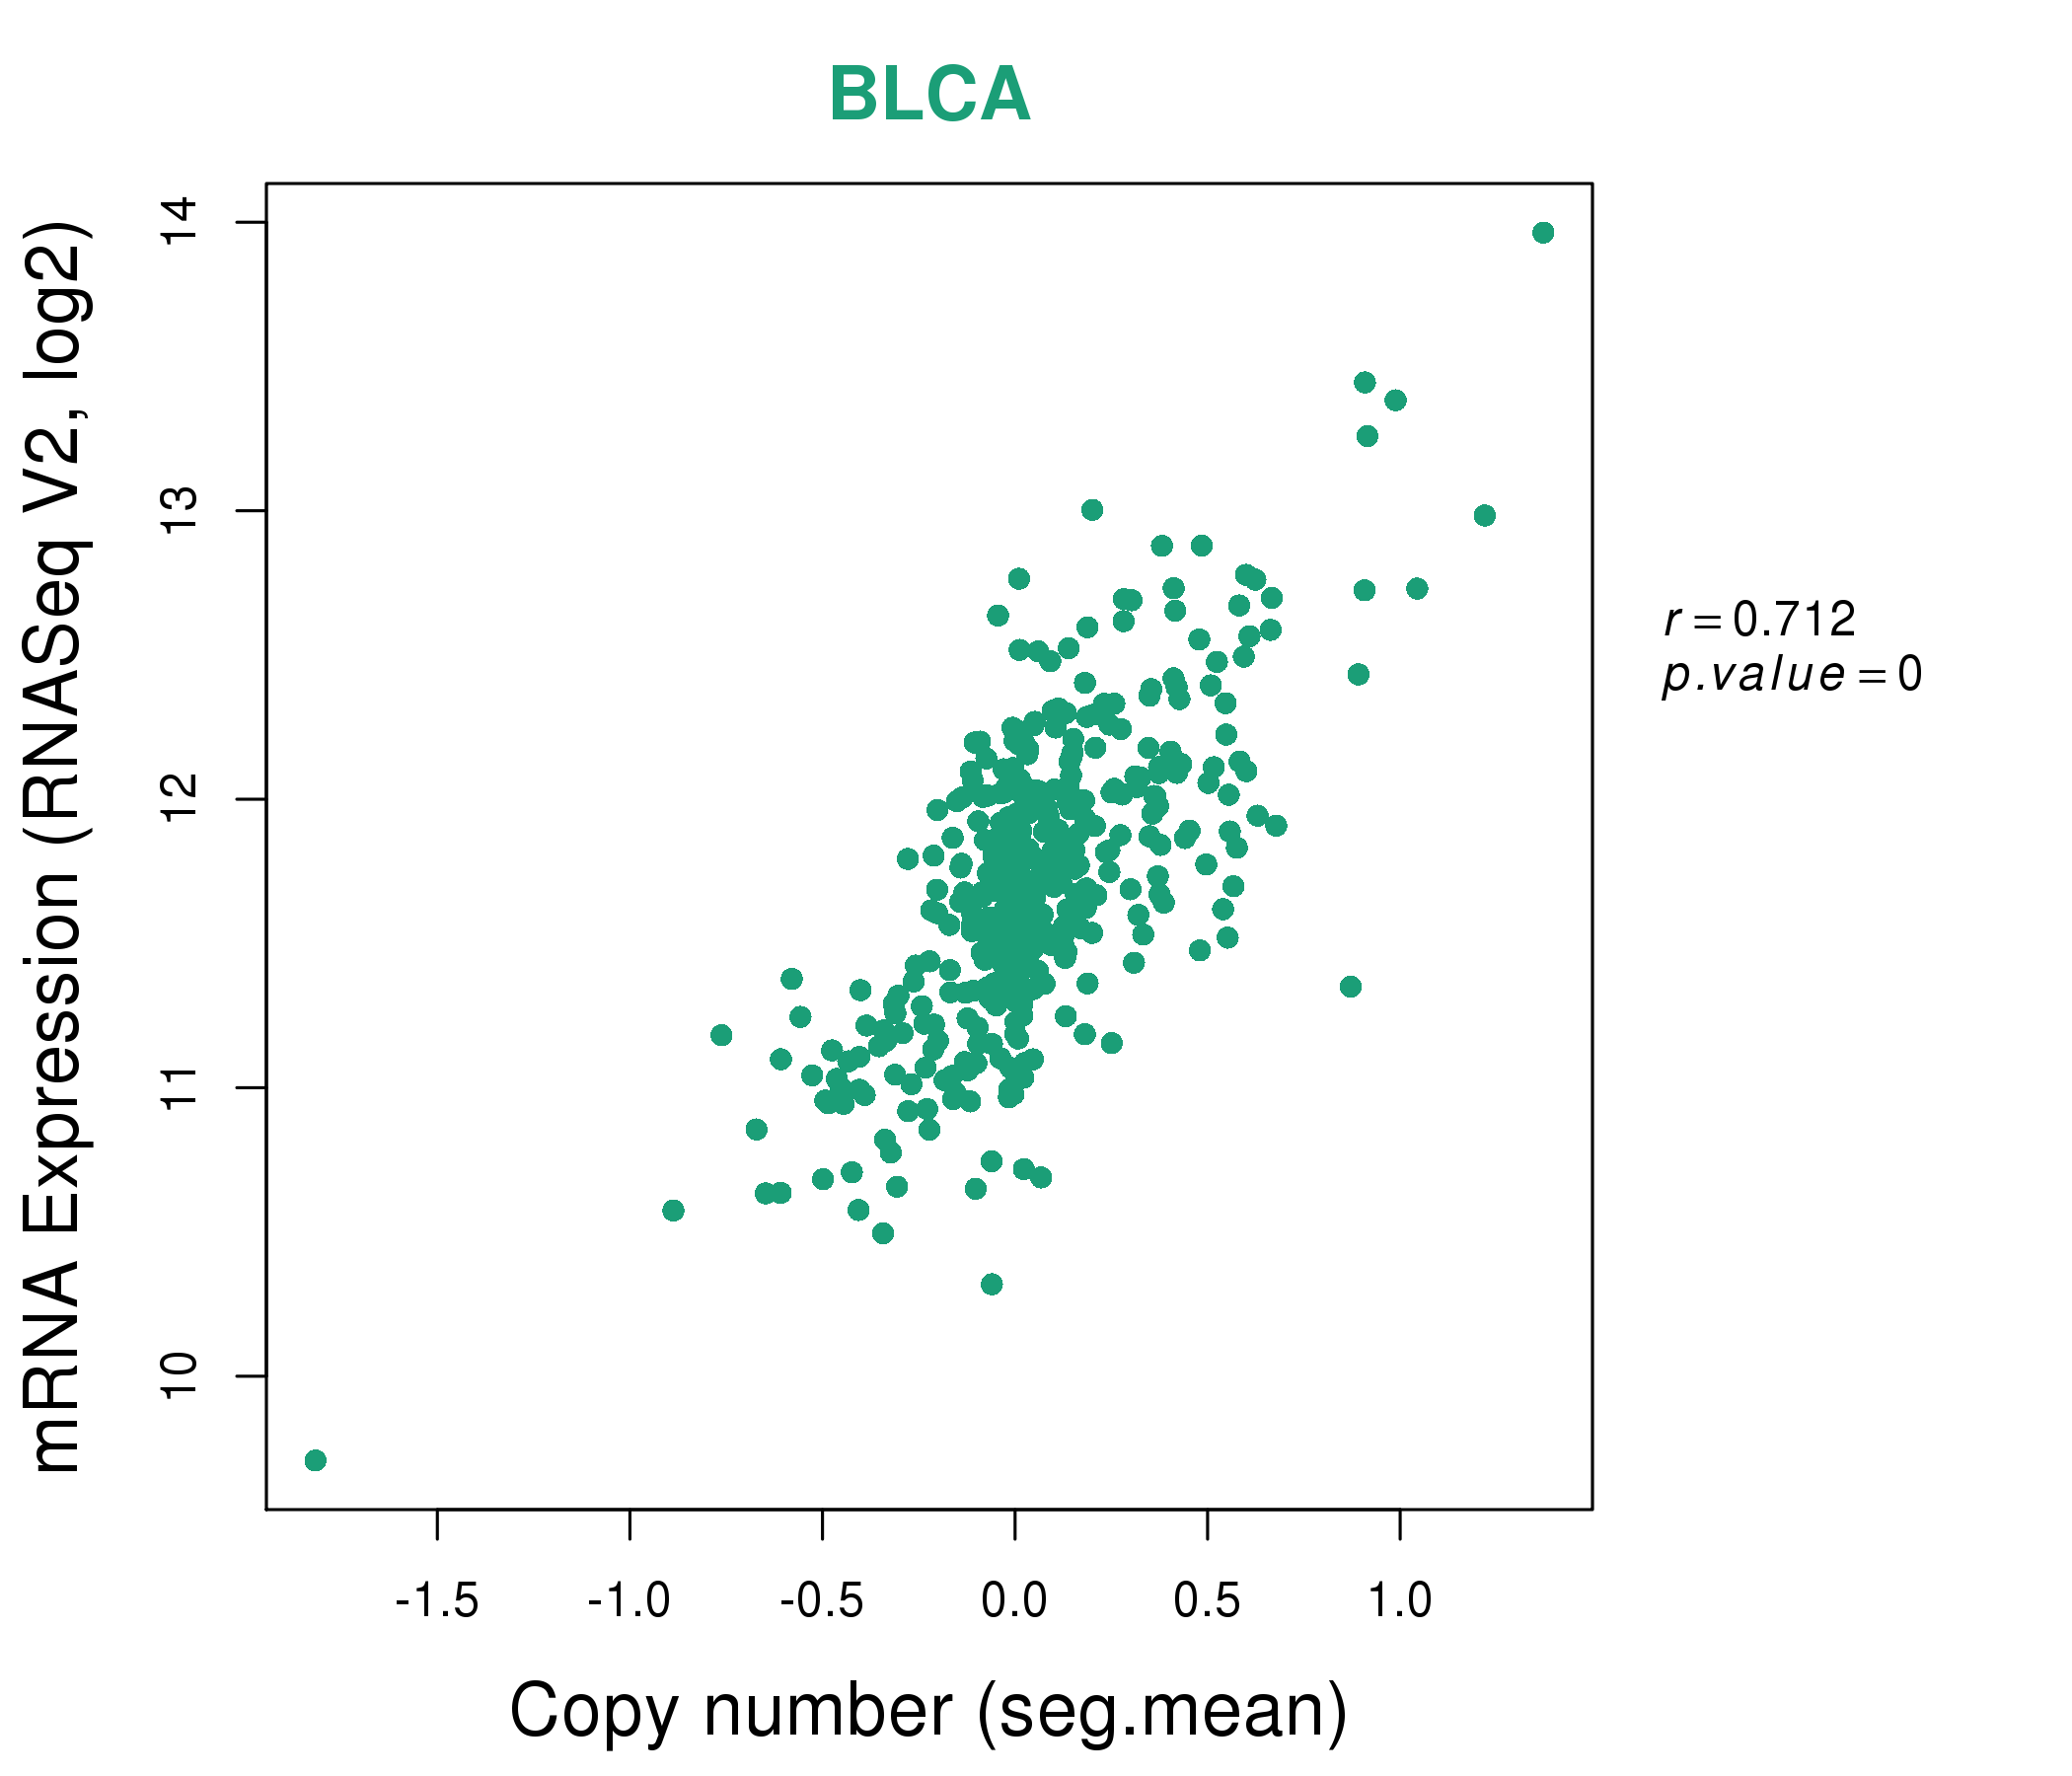
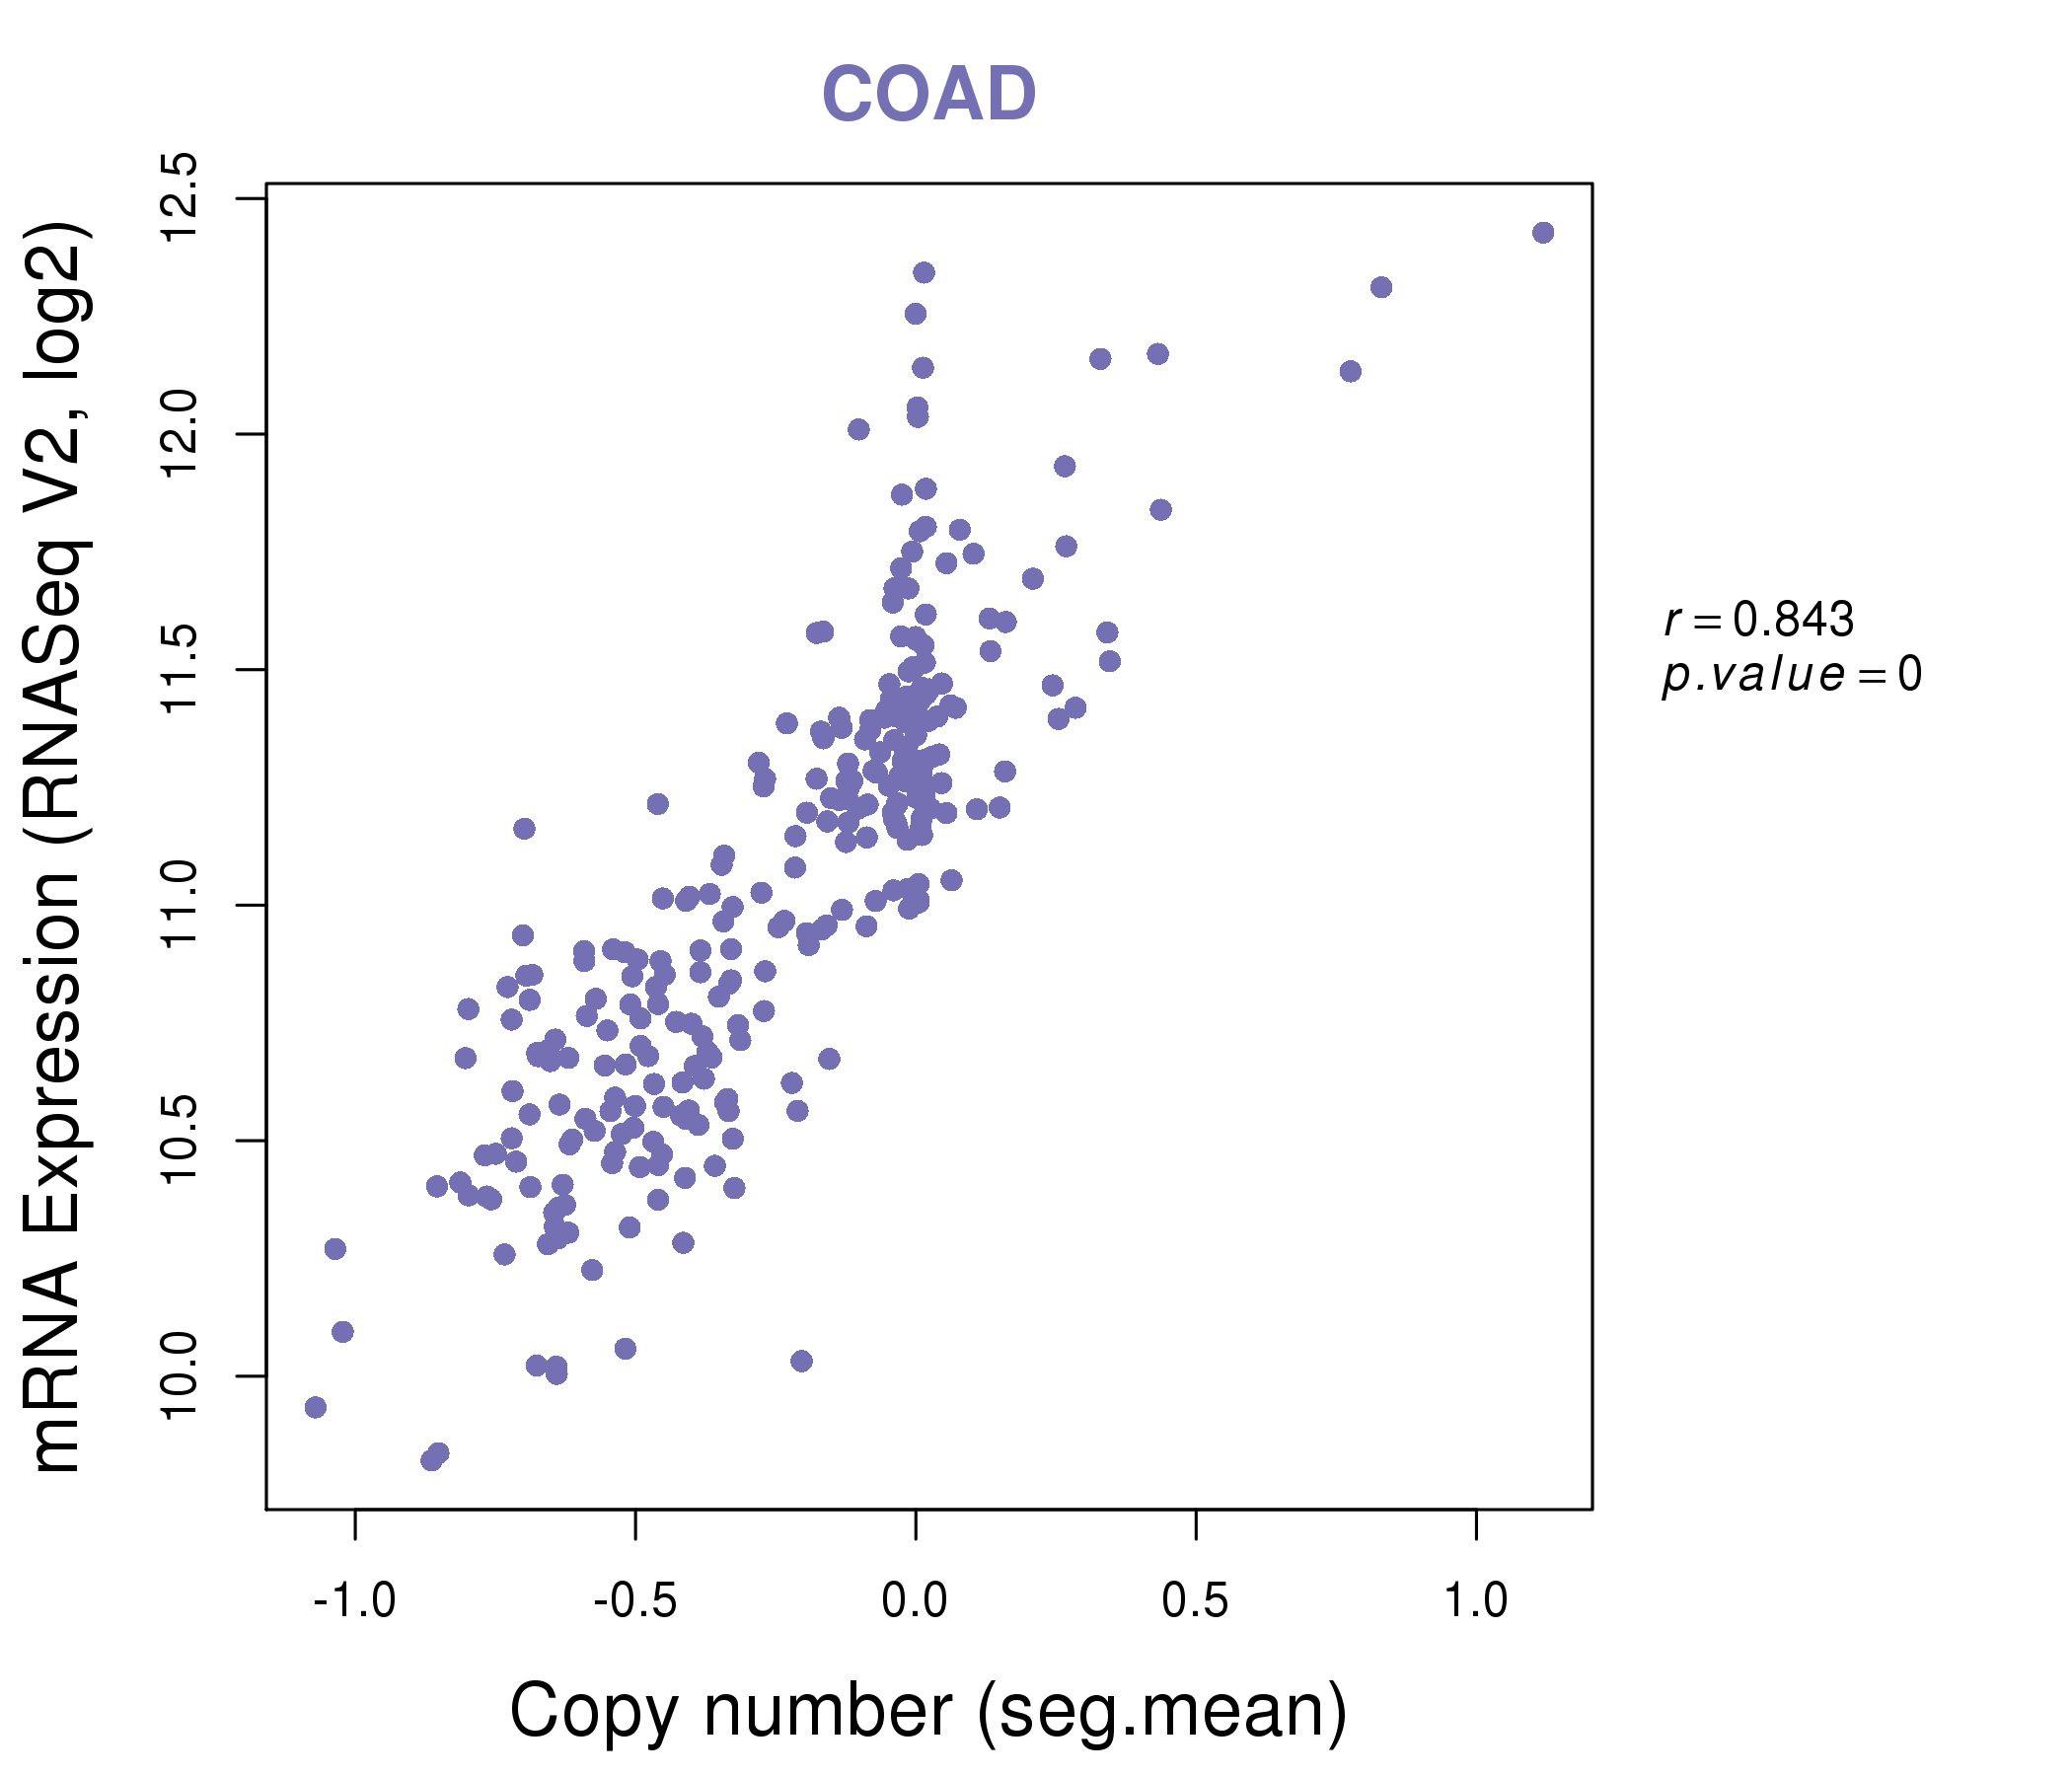
| * This plots show the correlation between CNV and gene expression. |
: Open all plots for all cancer types
 |
|
 |
|


| Top |
| Gene-Gene Network Information |
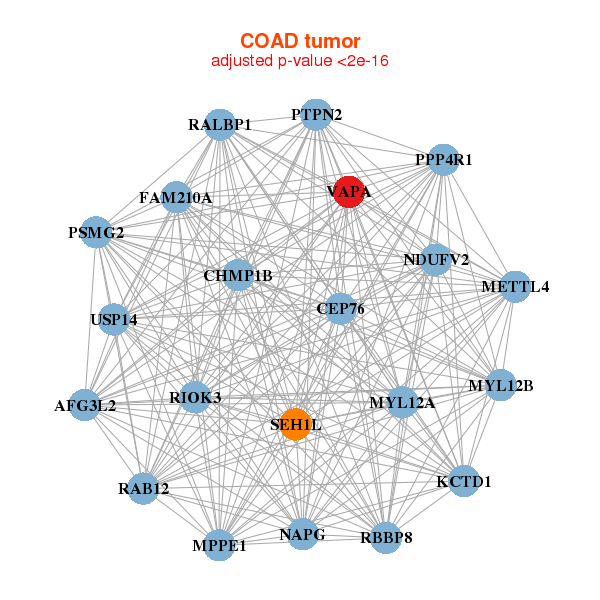
| * Co-Expression network figures were drawn using R package igraph. Only the top 20 genes with the highest correlations were shown. Red circle: input gene, orange circle: cell metabolism gene, sky circle: other gene |
: Open all plots for all cancer types
 |
|
| ANKRD12,FAM210A,C18orf32,TMEM241,CHMP1B,IER3IP1,IMPACT, METTL4,MPPE1,MYL12A,MYL12B,NAPG,NDUFV2,PPP4R1, PSMG2,RAB12,RALBP1,SEH1L,SMAD2,TGIF1,VAPA | COX11,EIF1AX,IER3IP1,LSM5,MAPK1IP1L,MMADHC,MOB4, MOSPD1,PPP2CA,PTGES3,RAB14,TRMT10C,RWDD4,SYPL1, TPRKB,UBE2D2,UBE2D3,UBE2E1,UBE2N,VAPA,VTA1 |
 |
|
| AFG3L2,FAM210A,CEP76,CHMP1B,KCTD1,METTL4,MPPE1, MYL12A,MYL12B,NAPG,NDUFV2,PPP4R1,PSMG2,PTPN2, RAB12,RALBP1,RBBP8,RIOK3,SEH1L,USP14,VAPA | APPL2,ATP1B3,B3GNT2,SPRYD7,CAB39,EPS8,ABHD17C, GCNT3,GNA13,GRAMD3,KCTD9,PIP5K1B,PPP1R11,PPP2CB, RND3,SHOC2,SLC26A3,TSC22D1,UGP2,VAPA,WASL |


| * Co-Expression network figures were drawn using R package igraph. Only the top 20 genes with the highest correlations were shown. Red circle: input gene, orange circle: cell metabolism gene, sky circle: other gene |
: Open all plots for all cancer types
| Top |
: Open all interacting genes' information including KEGG pathway for all interacting genes from DAVID
| Top |
| Pharmacological Information for VAPA |
| There's no related Drug. |
| Top |
| Cross referenced IDs for VAPA |
| * We obtained these cross-references from Uniprot database. It covers 150 different DBs, 18 categories. http://www.uniprot.org/help/cross_references_section |
: Open all cross reference information
|
Copyright © 2016-Present - The Univsersity of Texas Health Science Center at Houston @ |