|
||||||||||||||||||||
| |
| Phenotypic Information (metabolism pathway, cancer, disease, phenome) |
| |
| |
| Gene-Gene Network Information: Co-Expression Network, Interacting Genes & KEGG |
| |
|


| Gene Summary for LRAT |
| Top |
| Phenotypic Information for LRAT(metabolism pathway, cancer, disease, phenome) |
| Cancer | CGAP: LRAT |
| Familial Cancer Database: LRAT | |
| * This gene is included in those cancer gene databases. |
|
|
|
|
|
| . | ||||||||||||||
Oncogene 1 | Significant driver gene in | |||||||||||||||||||
| cf) number; DB name 1 Oncogene; http://nar.oxfordjournals.org/content/35/suppl_1/D721.long, 2 Tumor Suppressor gene; https://bioinfo.uth.edu/TSGene/, 3 Cancer Gene Census; http://www.nature.com/nrc/journal/v4/n3/abs/nrc1299.html, 4 CancerGenes; http://nar.oxfordjournals.org/content/35/suppl_1/D721.long, 5 Network of Cancer Gene; http://ncg.kcl.ac.uk/index.php, 1Therapeutic Vulnerabilities in Cancer; http://cbio.mskcc.org/cancergenomics/statius/ |
| KEGG_RETINOL_METABOLISM REACTOME_METABOLISM_OF_STEROID_HORMONES_AND_VITAMINS_A_AND_D REACTOME_METABOLISM_OF_LIPIDS_AND_LIPOPROTEINS | |
| OMIM | |
| Orphanet | |
| Disease | KEGG Disease: LRAT |
| MedGen: LRAT (Human Medical Genetics with Condition) | |
| ClinVar: LRAT | |
| Phenotype | MGI: LRAT (International Mouse Phenotyping Consortium) |
| PhenomicDB: LRAT | |
| Mutations for LRAT |
| * Under tables are showing count per each tissue to give us broad intuition about tissue specific mutation patterns.You can go to the detailed page for each mutation database's web site. |
| There's no structural variation information in COSMIC data for this gene. |
| * From mRNA Sanger sequences, Chitars2.0 arranged chimeric transcripts. This table shows LRAT related fusion information. |
| ID | Head Gene | Tail Gene | Accession | Gene_a | qStart_a | qEnd_a | Chromosome_a | tStart_a | tEnd_a | Gene_a | qStart_a | qEnd_a | Chromosome_a | tStart_a | tEnd_a |
| BX093249 | AVL9 | 35 | 168 | 7 | 32800309 | 32800442 | LRAT | 165 | 748 | 4 | 155672877 | 155673456 | |
| Top |
| There's no copy number variation information in COSMIC data for this gene. |
| Top |
|
 |
| Top |
| Stat. for Non-Synonymous SNVs (# total SNVs=23) | (# total SNVs=6) |
 |  |
(# total SNVs=0) | (# total SNVs=0) |
| Top |
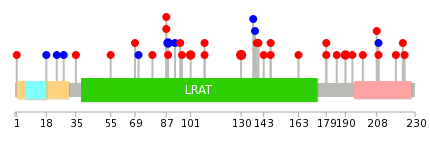
| * When you move the cursor on each content, you can see more deailed mutation information on the Tooltip. Those are primary_site,primary_histology,mutation(aa),pubmedID. |
| GRCh37 position | Mutation(aa) | Unique sampleID count |
| chr4:155665867-155665867 | p.S130F | 3 |
| chr4:155666013-155666013 | p.D179Y | 2 |
| chr4:155670163-155670163 | p.R190C | 2 |
| chr4:155665742-155665742 | p.T88T | 2 |
| chr4:155665779-155665779 | p.V101I | 2 |
| chr4:155665691-155665691 | p.A71A | 1 |
| chr4:155665804-155665804 | p.R109H | 1 |
| chr4:155670149-155670149 | p.V185A | 1 |
| chr4:155665715-155665715 | p.L79F | 1 |
| chr4:155665737-155665737 | p.R87C | 1 |
| Top |
|
 |
| Point Mutation/ Tissue ID | 1 | 2 | 3 | 4 | 5 | 6 | 7 | 8 | 9 | 10 | 11 | 12 | 13 | 14 | 15 | 16 | 17 | 18 | 19 | 20 |
| # sample | 1 | 1 | 4 | 1 | 5 | 1 | 6 | 2 | 3 | 5 | 6 | |||||||||
| # mutation | 1 | 1 | 4 | 1 | 5 | 1 | 6 | 2 | 3 | 5 | 6 | |||||||||
| nonsynonymous SNV | 3 | 1 | 5 | 1 | 4 | 2 | 3 | 3 | 4 | |||||||||||
| synonymous SNV | 1 | 1 | 1 | 2 | 2 | 2 |
| cf) Tissue ID; Tissue type (1; BLCA[Bladder Urothelial Carcinoma], 2; BRCA[Breast invasive carcinoma], 3; CESC[Cervical squamous cell carcinoma and endocervical adenocarcinoma], 4; COAD[Colon adenocarcinoma], 5; GBM[Glioblastoma multiforme], 6; Glioma Low Grade, 7; HNSC[Head and Neck squamous cell carcinoma], 8; KICH[Kidney Chromophobe], 9; KIRC[Kidney renal clear cell carcinoma], 10; KIRP[Kidney renal papillary cell carcinoma], 11; LAML[Acute Myeloid Leukemia], 12; LUAD[Lung adenocarcinoma], 13; LUSC[Lung squamous cell carcinoma], 14; OV[Ovarian serous cystadenocarcinoma ], 15; PAAD[Pancreatic adenocarcinoma], 16; PRAD[Prostate adenocarcinoma], 17; SKCM[Skin Cutaneous Melanoma], 18:STAD[Stomach adenocarcinoma], 19:THCA[Thyroid carcinoma], 20:UCEC[Uterine Corpus Endometrial Carcinoma]) |
| Top |
| * We represented just top 10 SNVs. When you move the cursor on each content, you can see more deailed mutation information on the Tooltip. Those are primary_site, primary_histology, mutation(aa), pubmedID. |
| Genomic Position | Mutation(aa) | Unique sampleID count |
| chr4:155670222 | p.R87L | 2 |
| chr4:155665738 | p.T209T | 2 |
| chr4:155670176 | p.V185A | 1 |
| chr4:155665684 | p.L79F | 1 |
| chr4:155665794 | p.R190C | 1 |
| chr4:155670218 | p.R87C | 1 |
| chr4:155665691 | p.S194I | 1 |
| chr4:155665867 | p.C208F | 1 |
| chr4:155670221 | p.T88T | 1 |
| chr4:155665697 | p.T209M | 1 |
| * Copy number data were extracted from TCGA using R package TCGA-Assembler. The URLs of all public data files on TCGA DCC data server were gathered on Jan-05-2015. Function ProcessCNAData in TCGA-Assembler package was used to obtain gene-level copy number value which is calculated as the average copy number of the genomic region of a gene. |
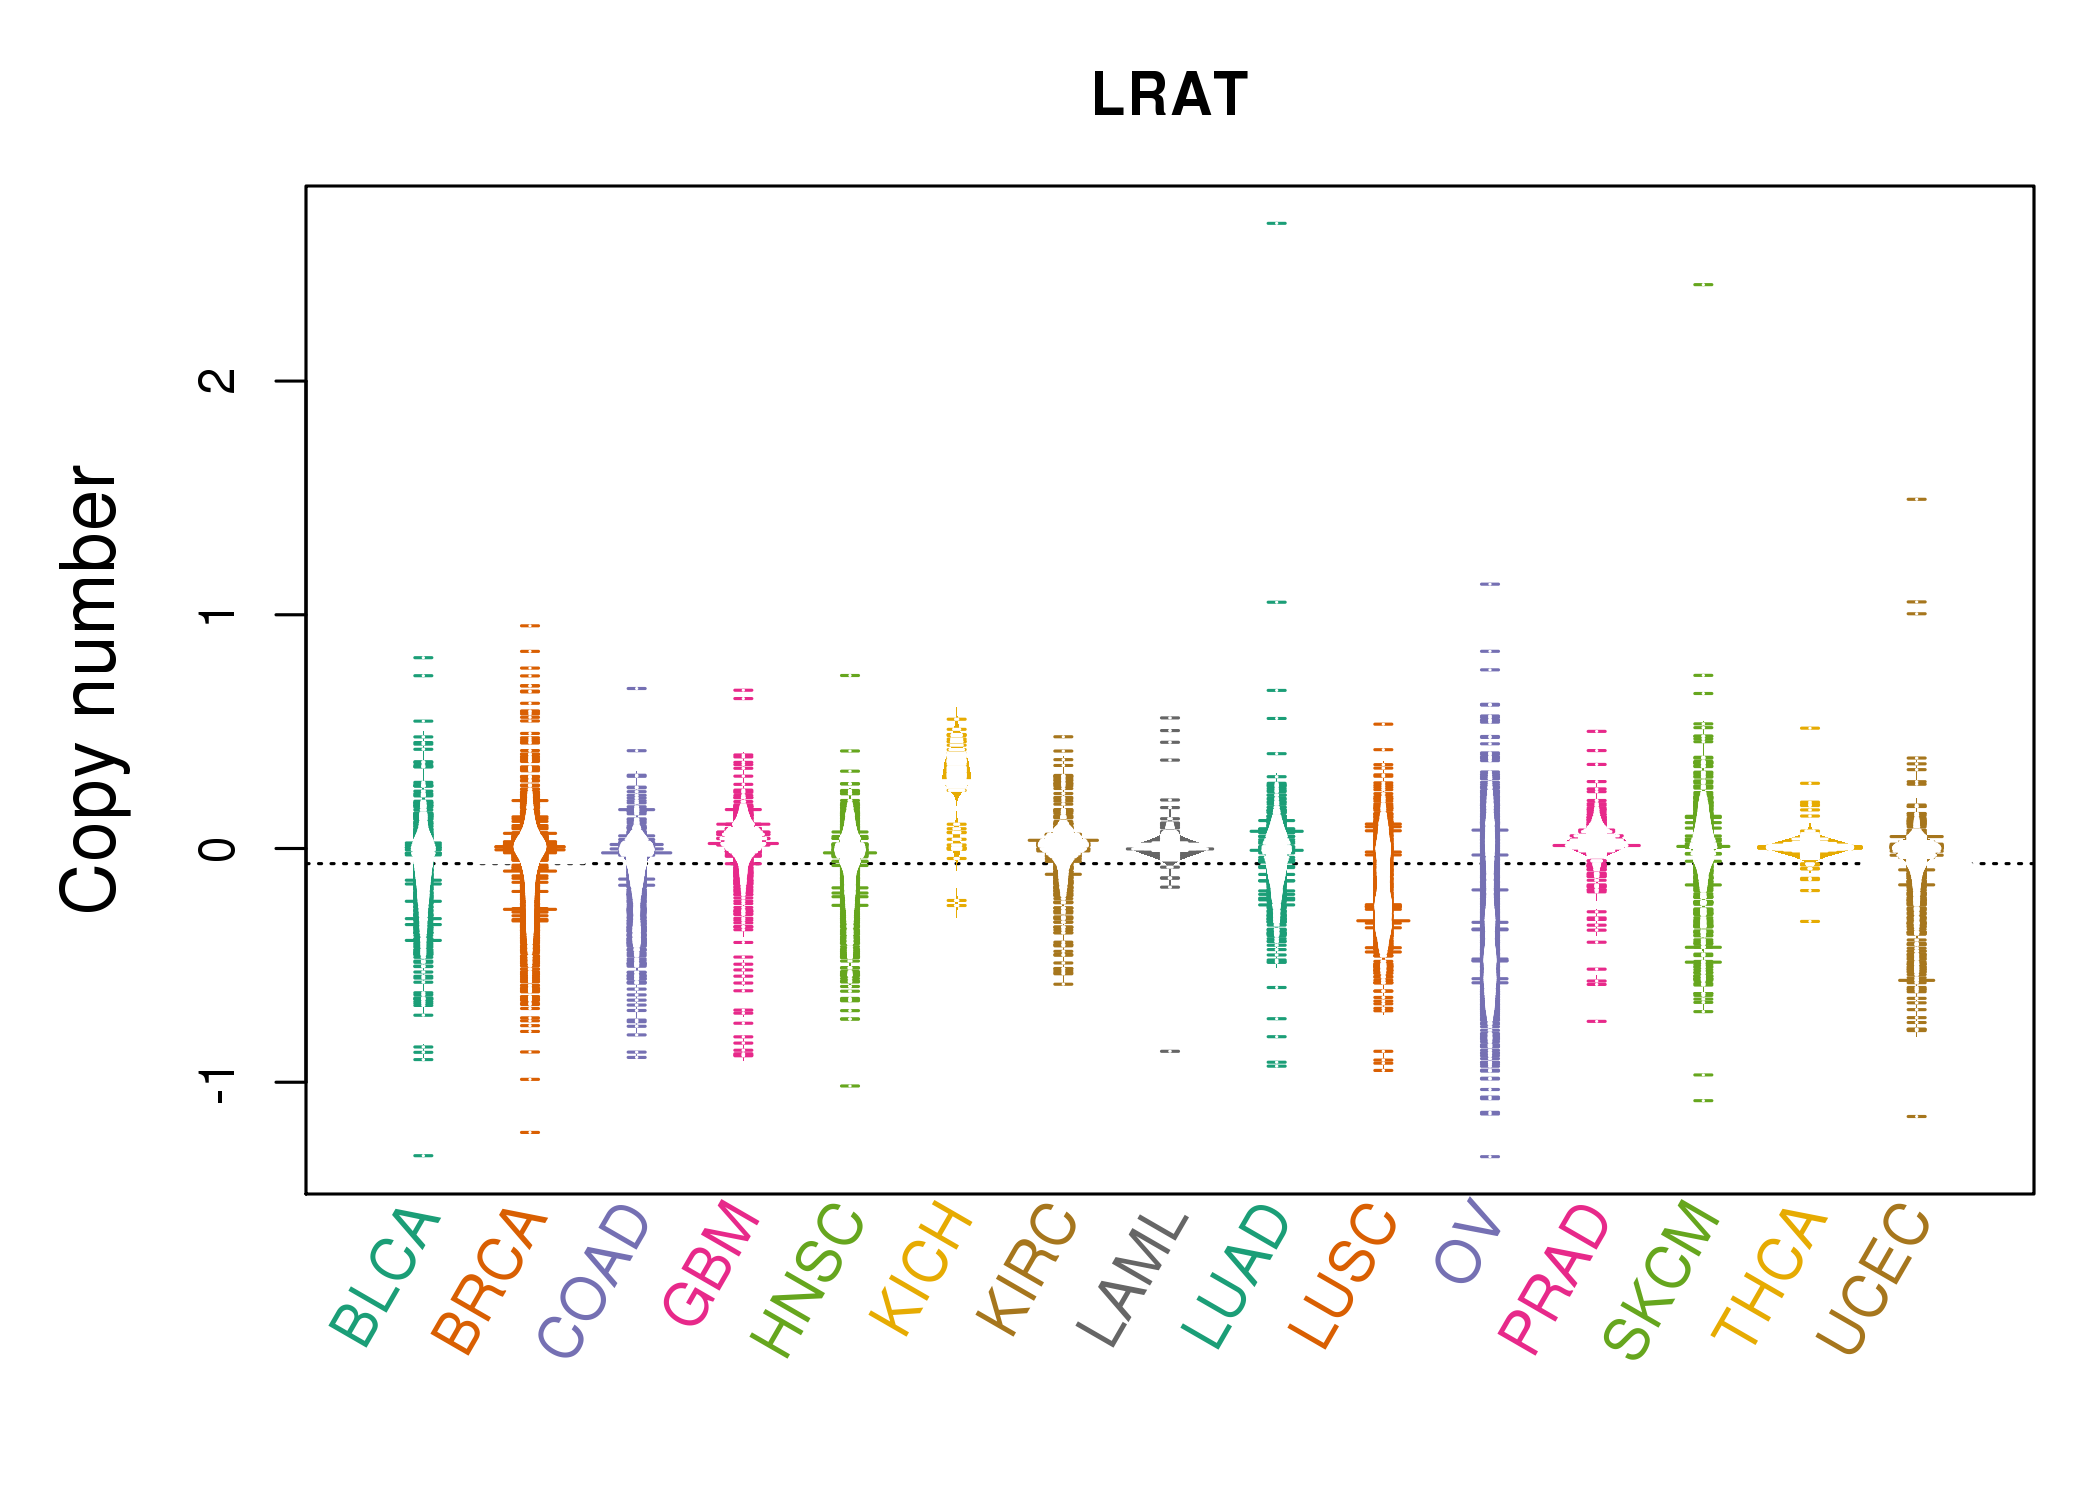 |
| cf) Tissue ID[Tissue type]: BLCA[Bladder Urothelial Carcinoma], BRCA[Breast invasive carcinoma], CESC[Cervical squamous cell carcinoma and endocervical adenocarcinoma], COAD[Colon adenocarcinoma], GBM[Glioblastoma multiforme], Glioma Low Grade, HNSC[Head and Neck squamous cell carcinoma], KICH[Kidney Chromophobe], KIRC[Kidney renal clear cell carcinoma], KIRP[Kidney renal papillary cell carcinoma], LAML[Acute Myeloid Leukemia], LUAD[Lung adenocarcinoma], LUSC[Lung squamous cell carcinoma], OV[Ovarian serous cystadenocarcinoma ], PAAD[Pancreatic adenocarcinoma], PRAD[Prostate adenocarcinoma], SKCM[Skin Cutaneous Melanoma], STAD[Stomach adenocarcinoma], THCA[Thyroid carcinoma], UCEC[Uterine Corpus Endometrial Carcinoma] |
| Top |
| Gene Expression for LRAT |
| * CCLE gene expression data were extracted from CCLE_Expression_Entrez_2012-10-18.res: Gene-centric RMA-normalized mRNA expression data. |
 |
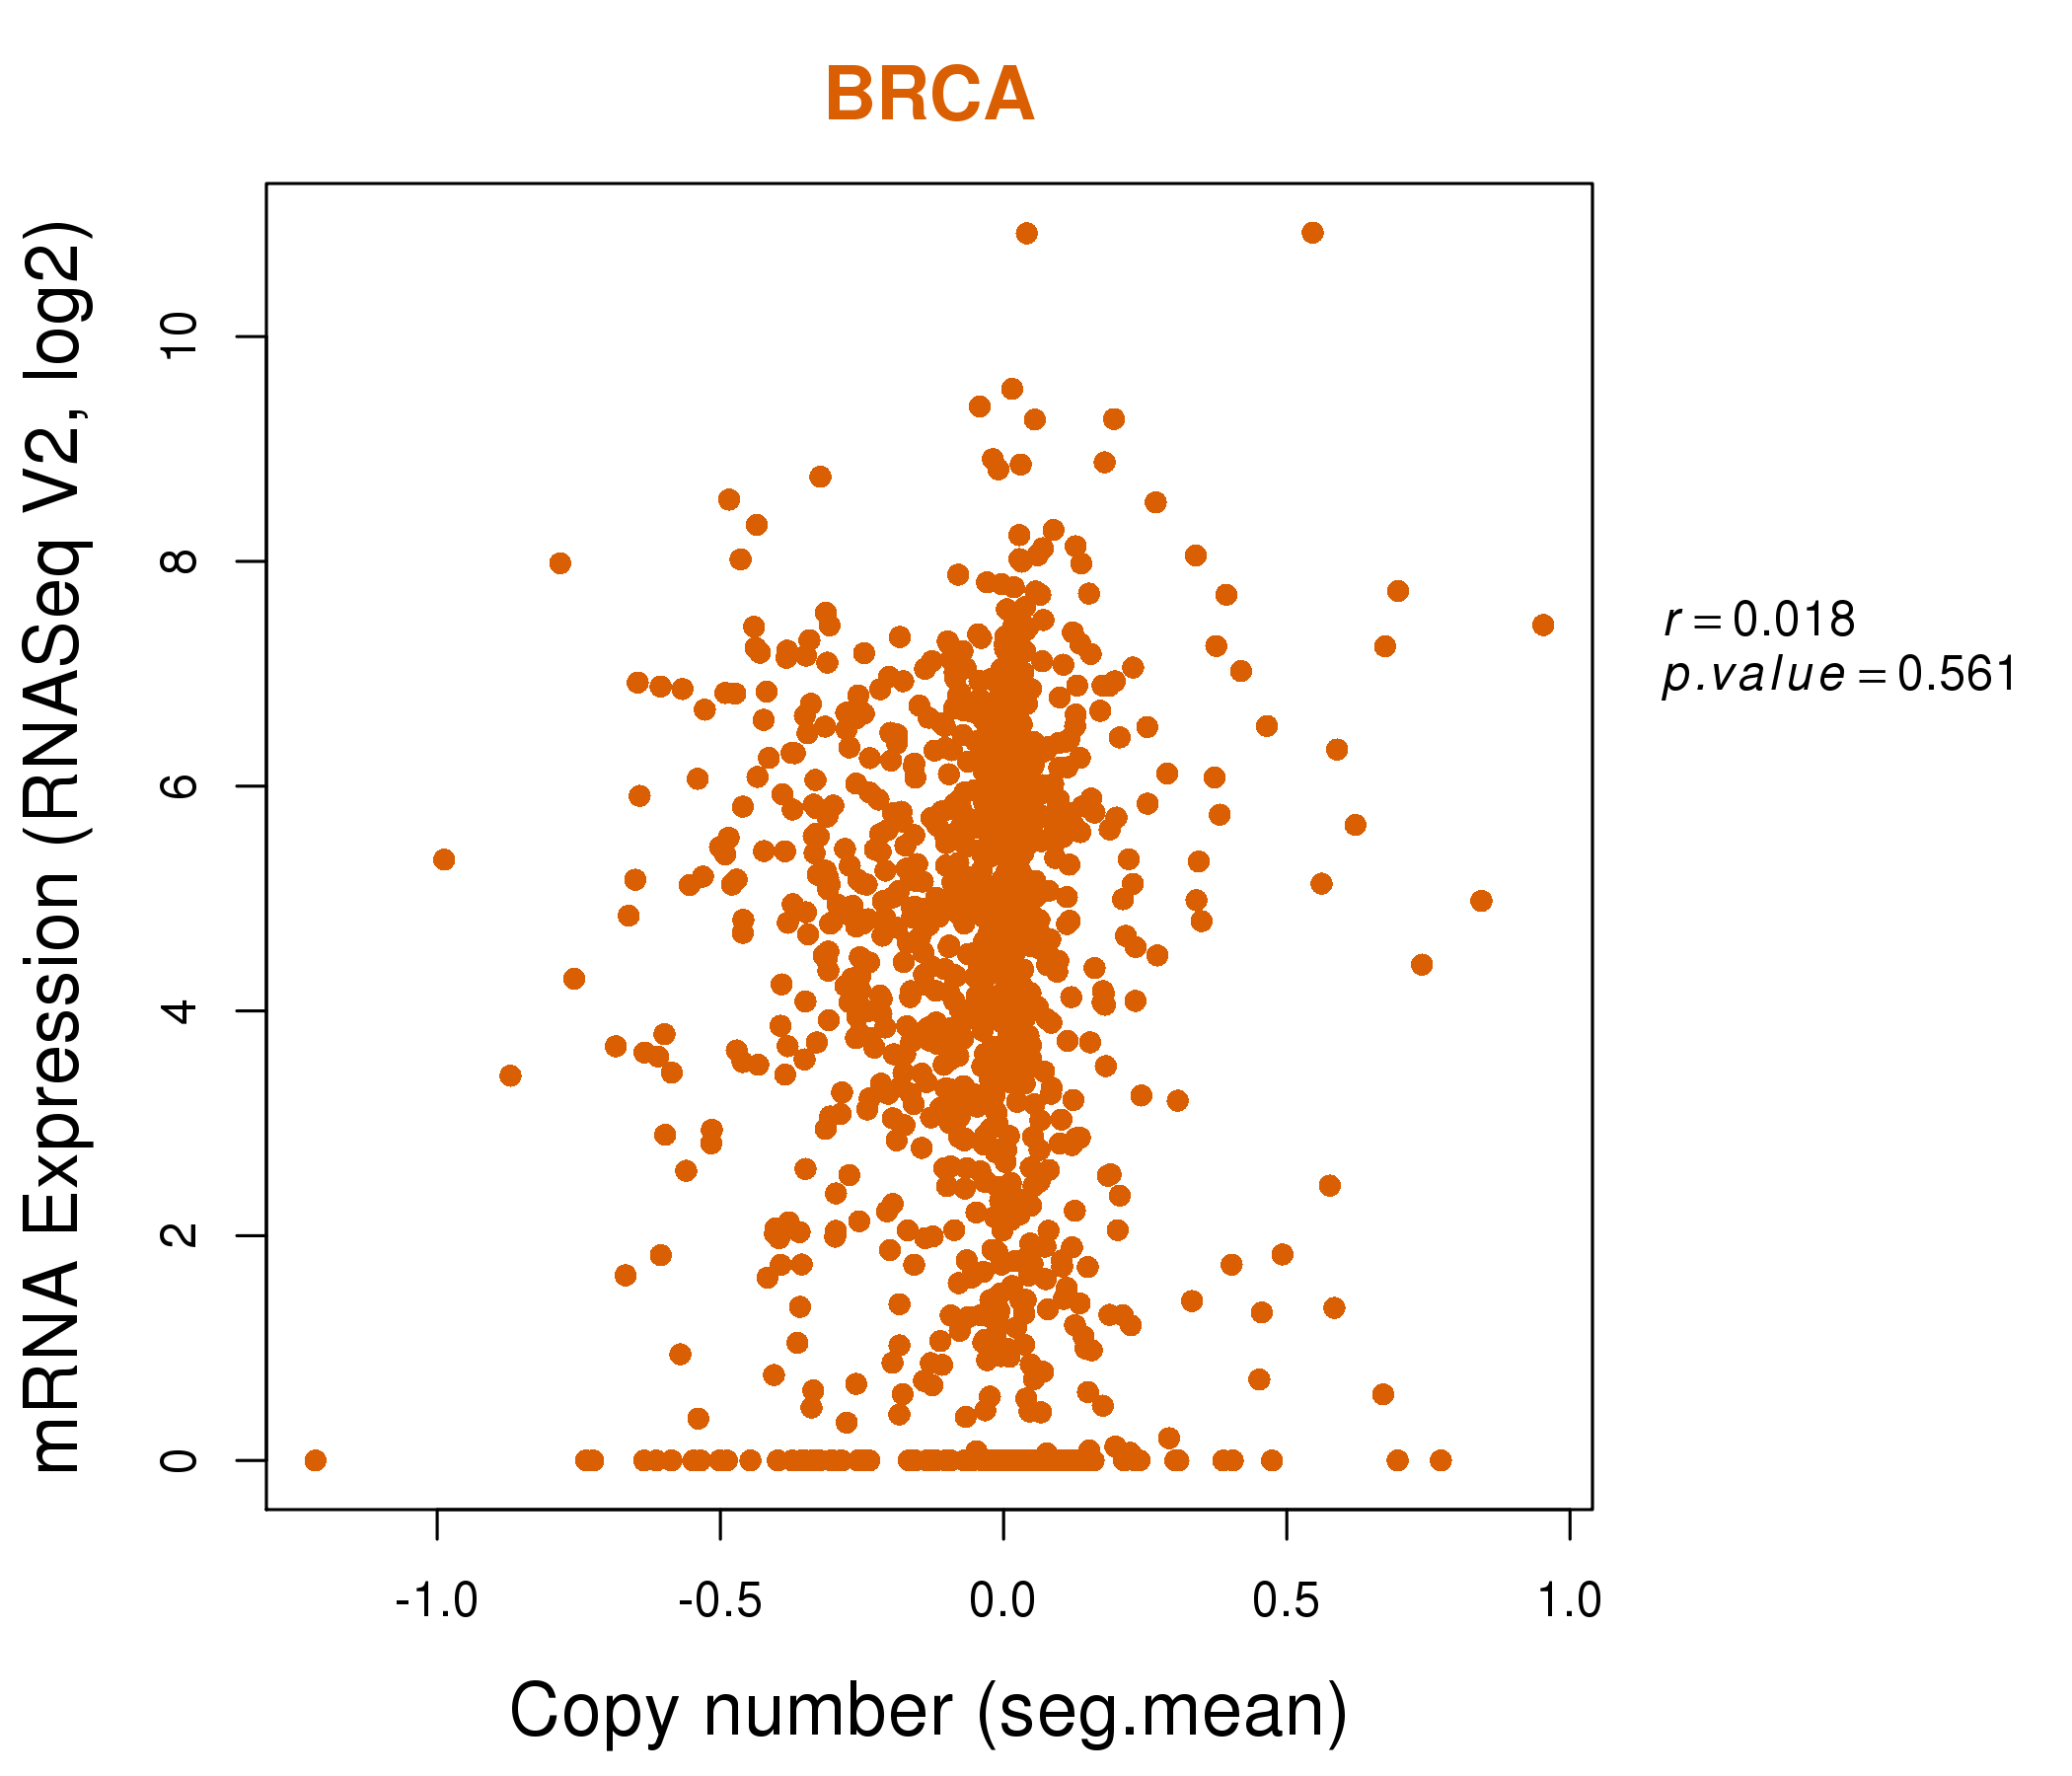
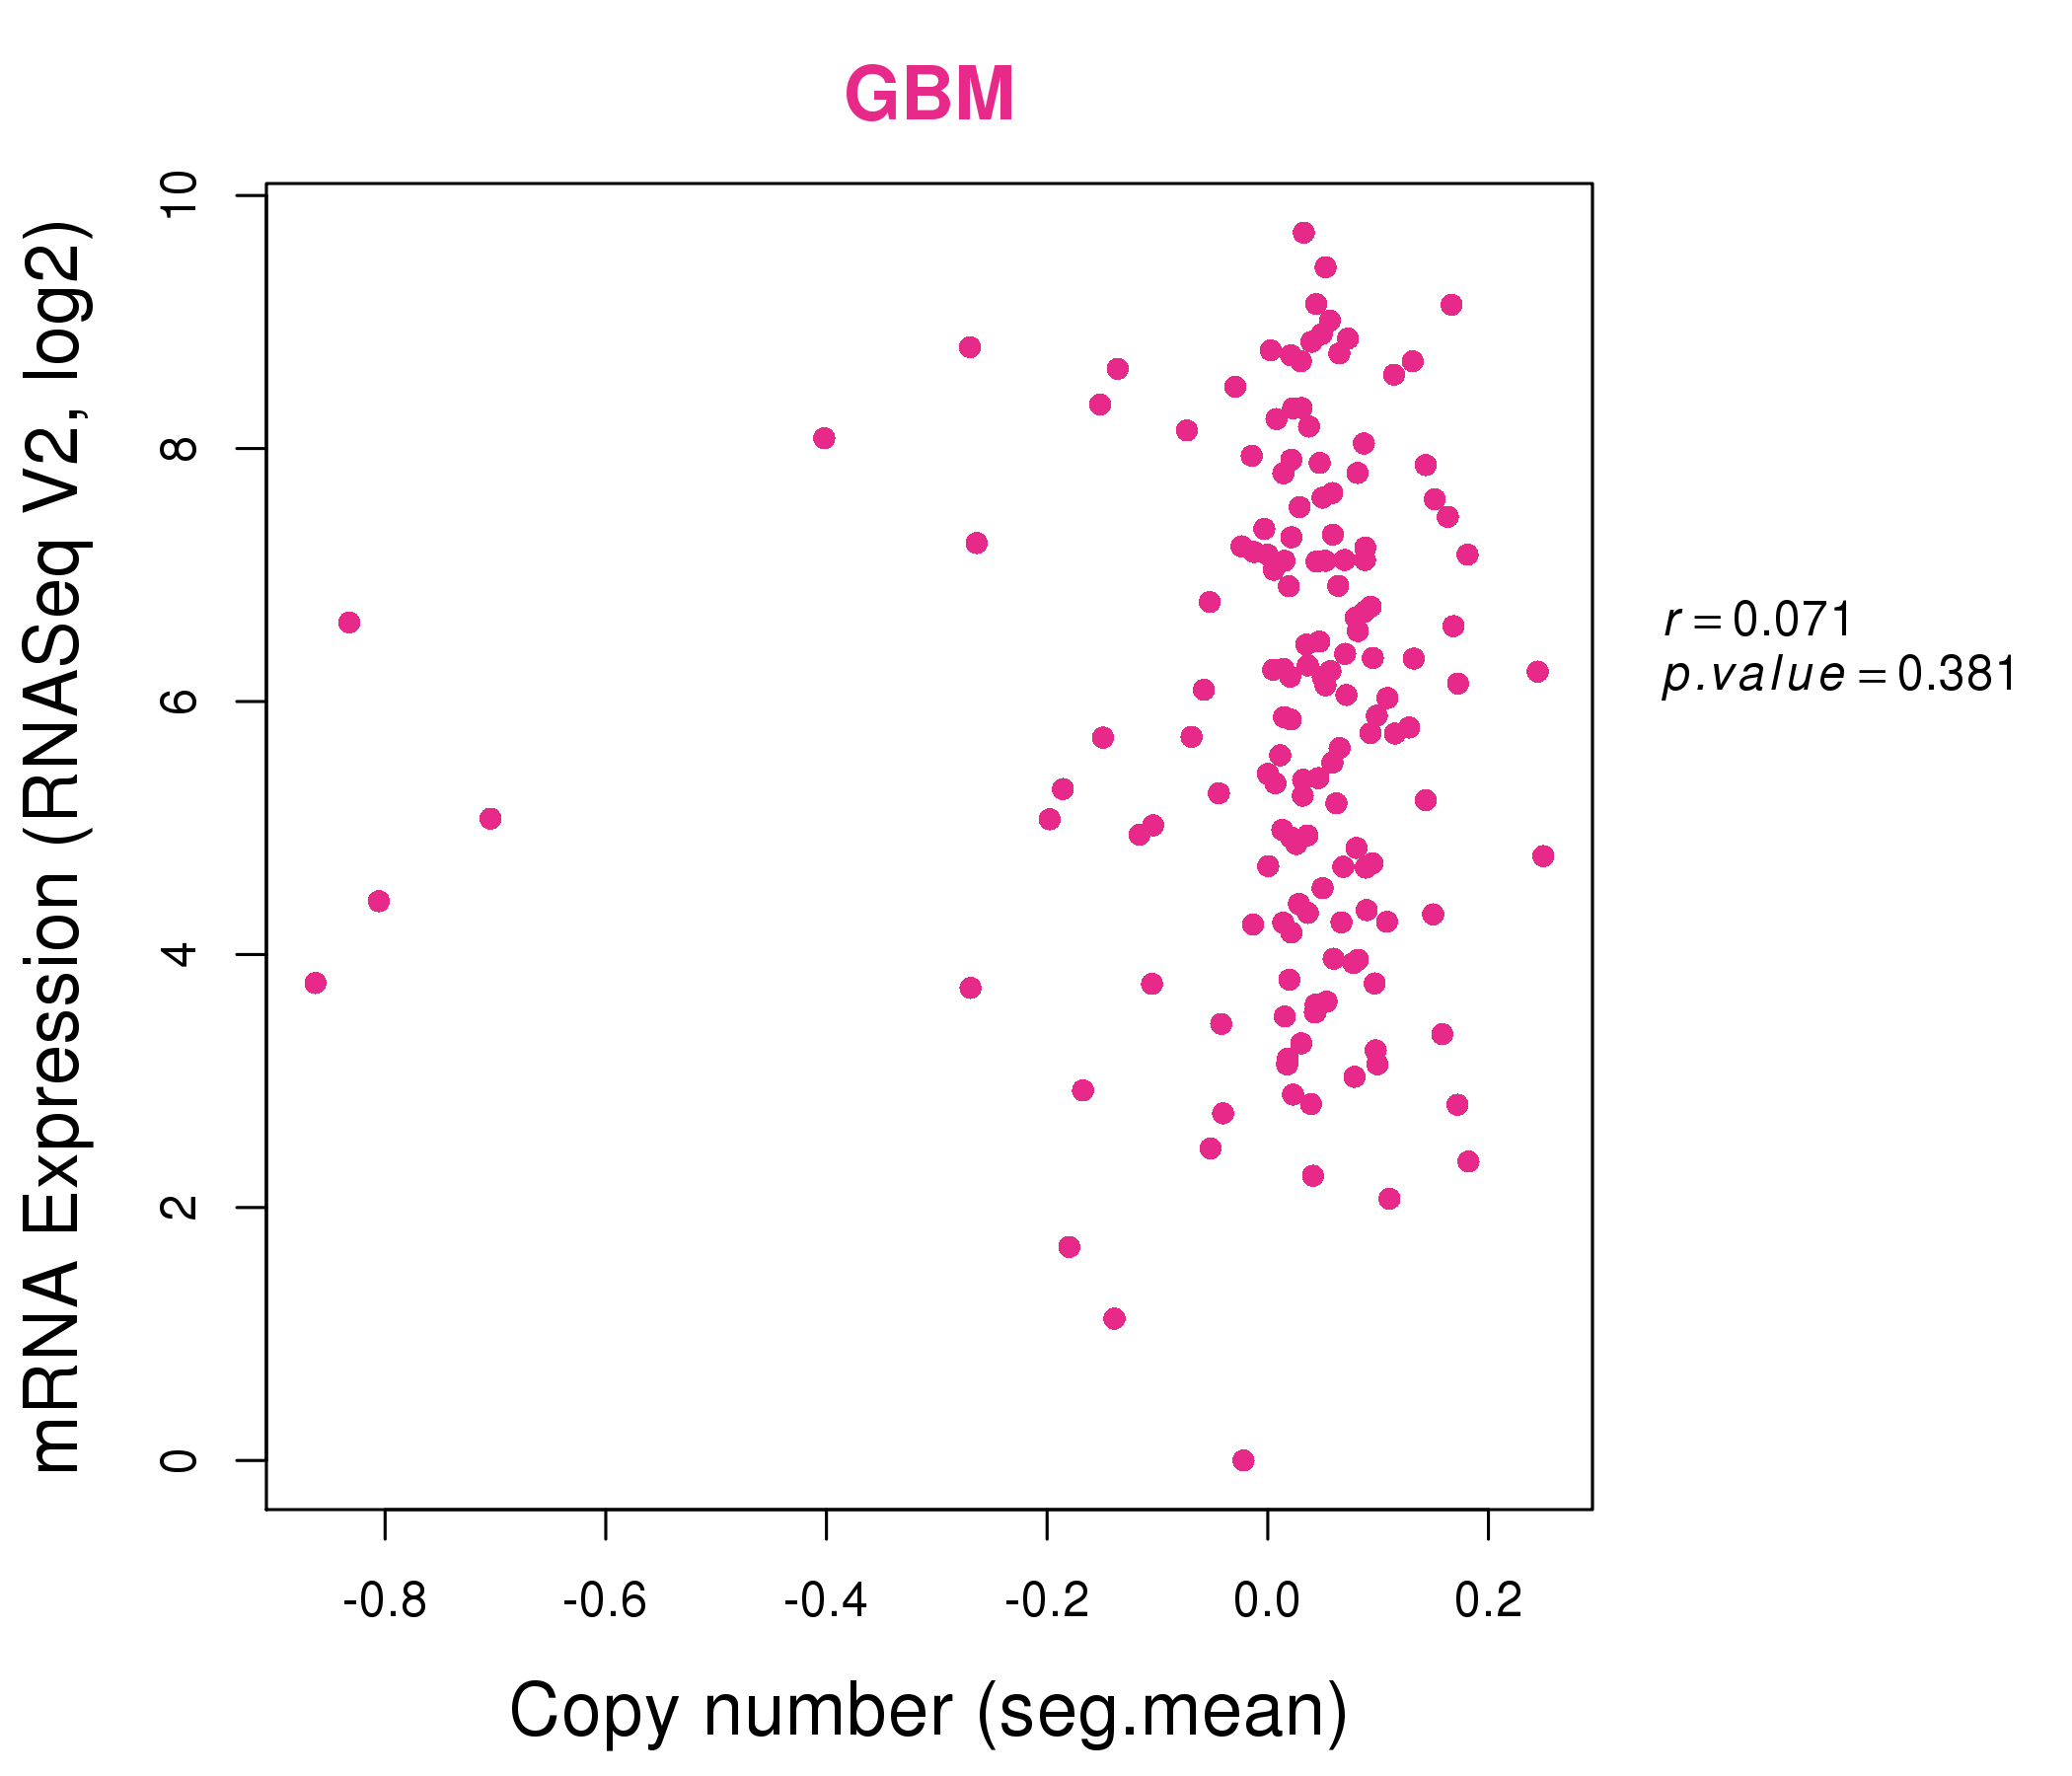
| * Normalized gene expression data of RNASeqV2 was extracted from TCGA using R package TCGA-Assembler. The URLs of all public data files on TCGA DCC data server were gathered at Jan-05-2015. Only eight cancer types have enough normal control samples for differential expression analysis. (t test, adjusted p<0.05 (using Benjamini-Hochberg FDR)) |
 |
| Top |
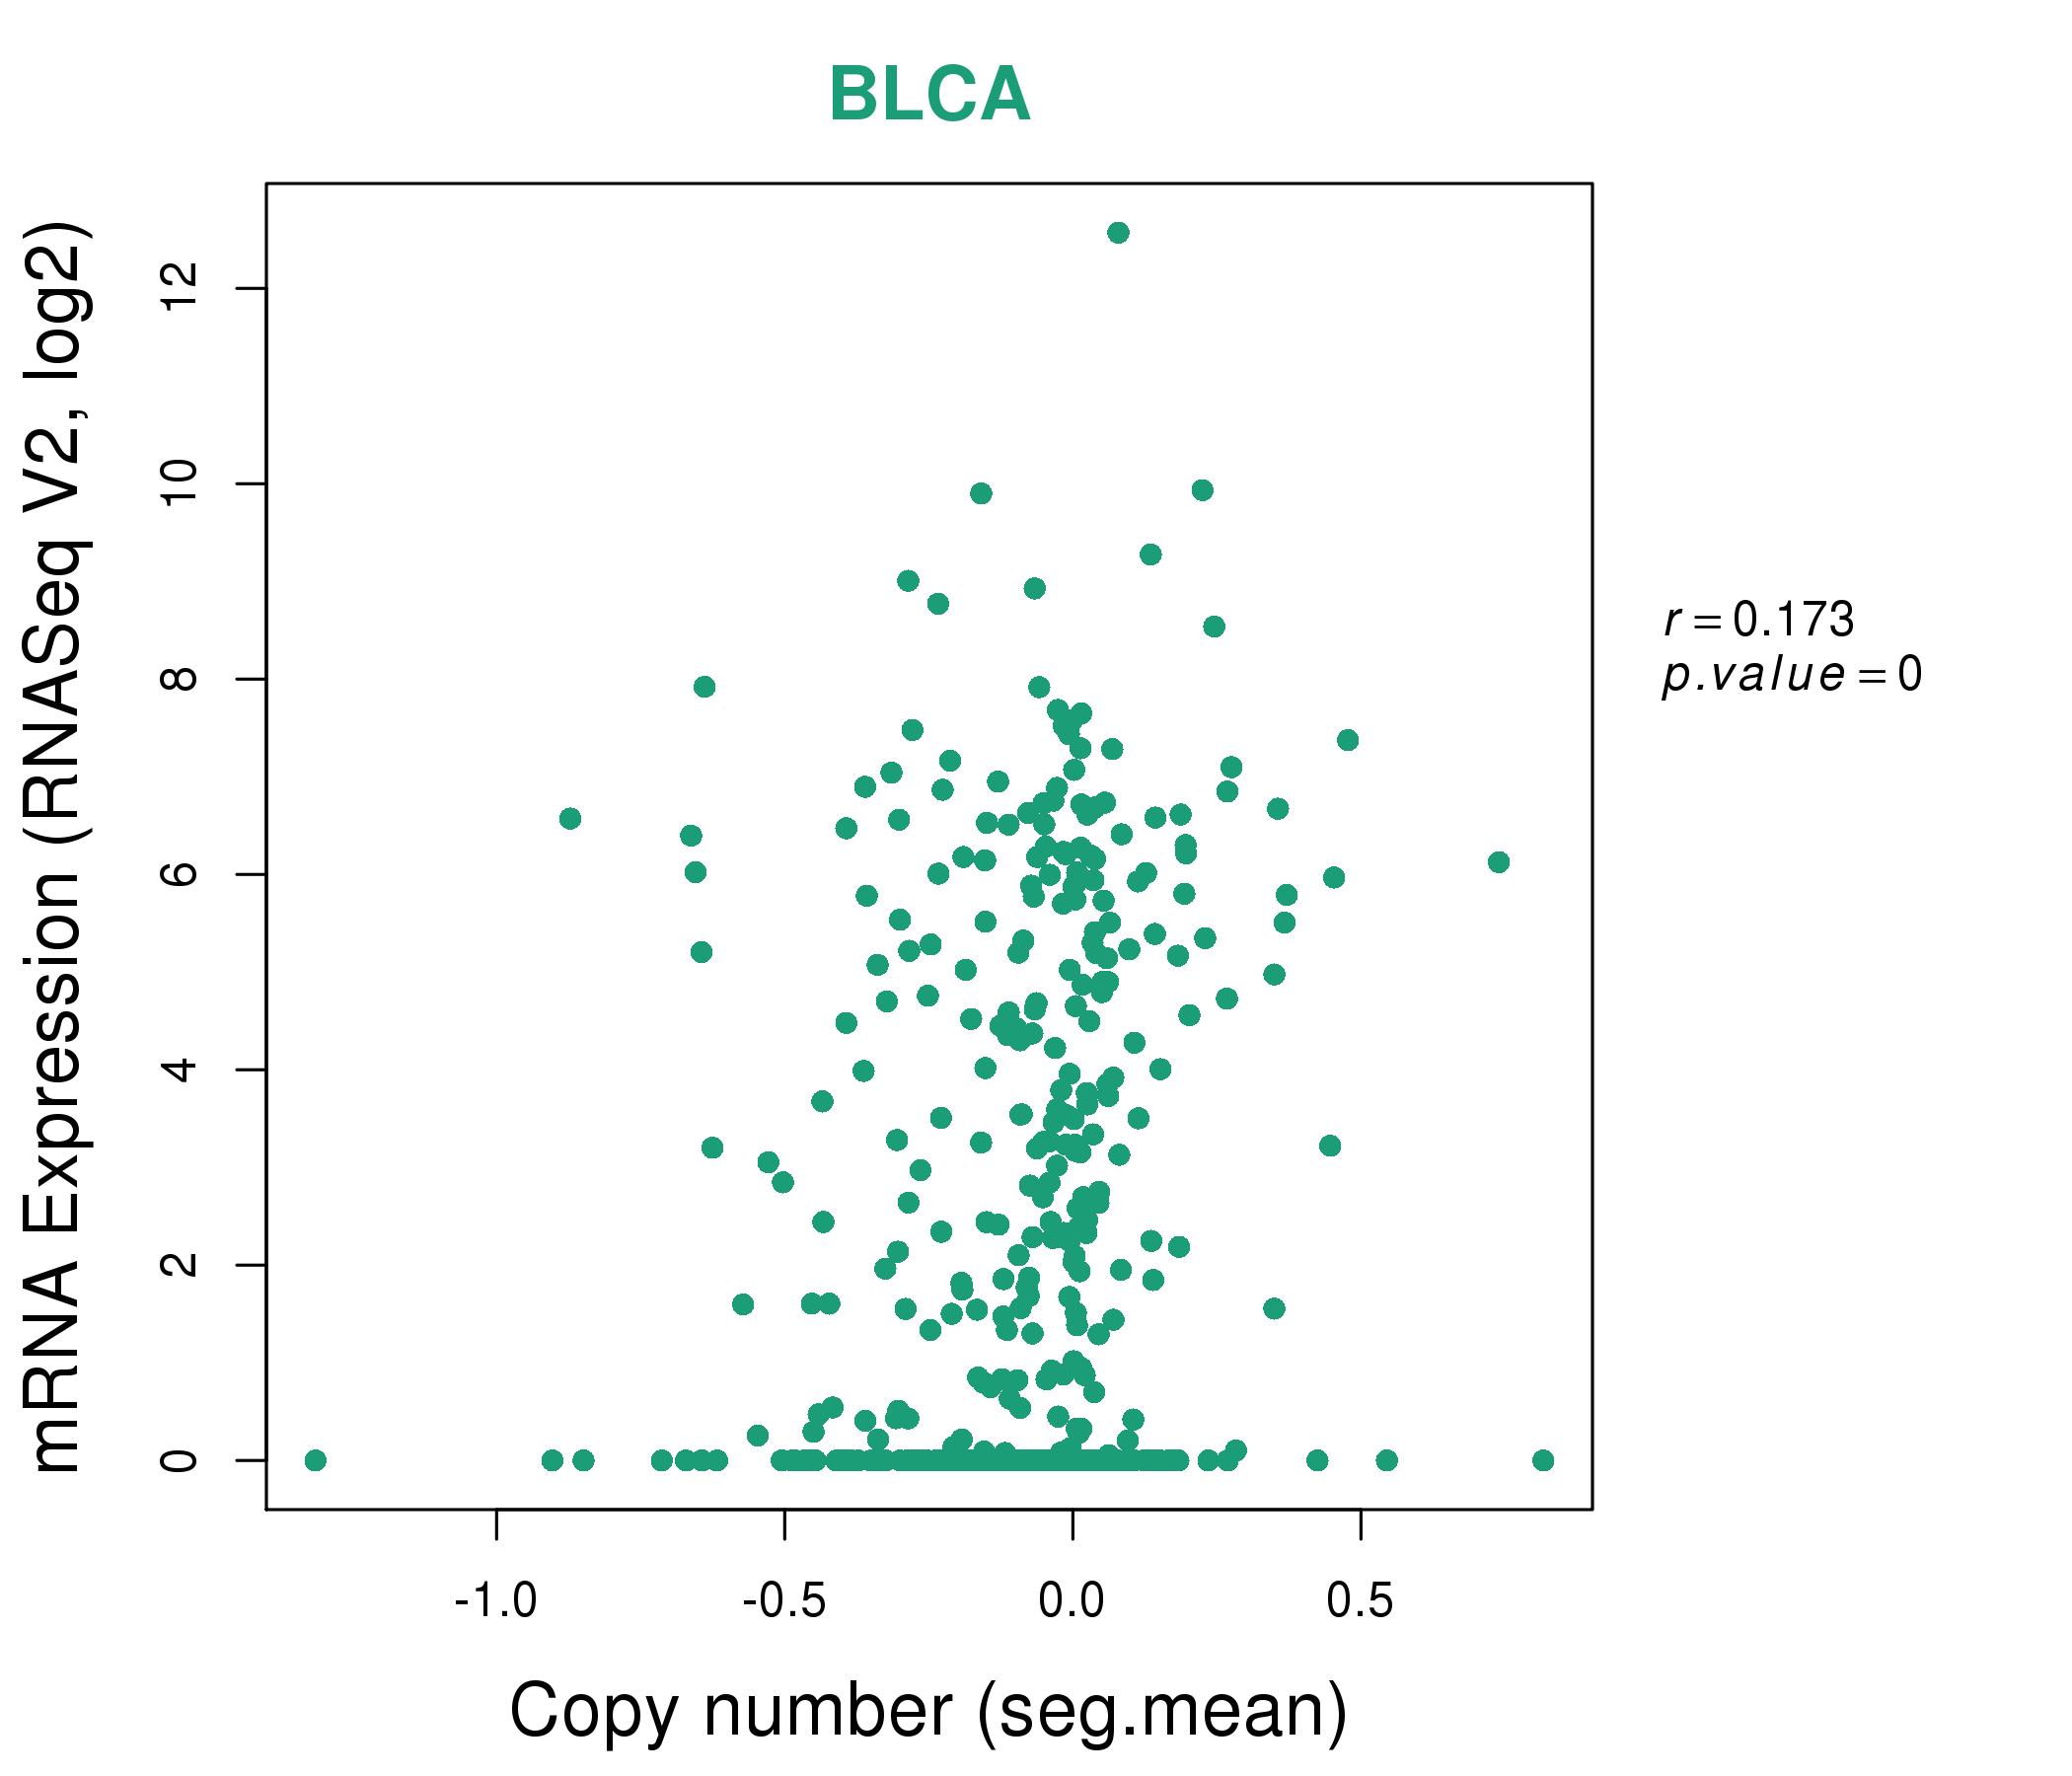
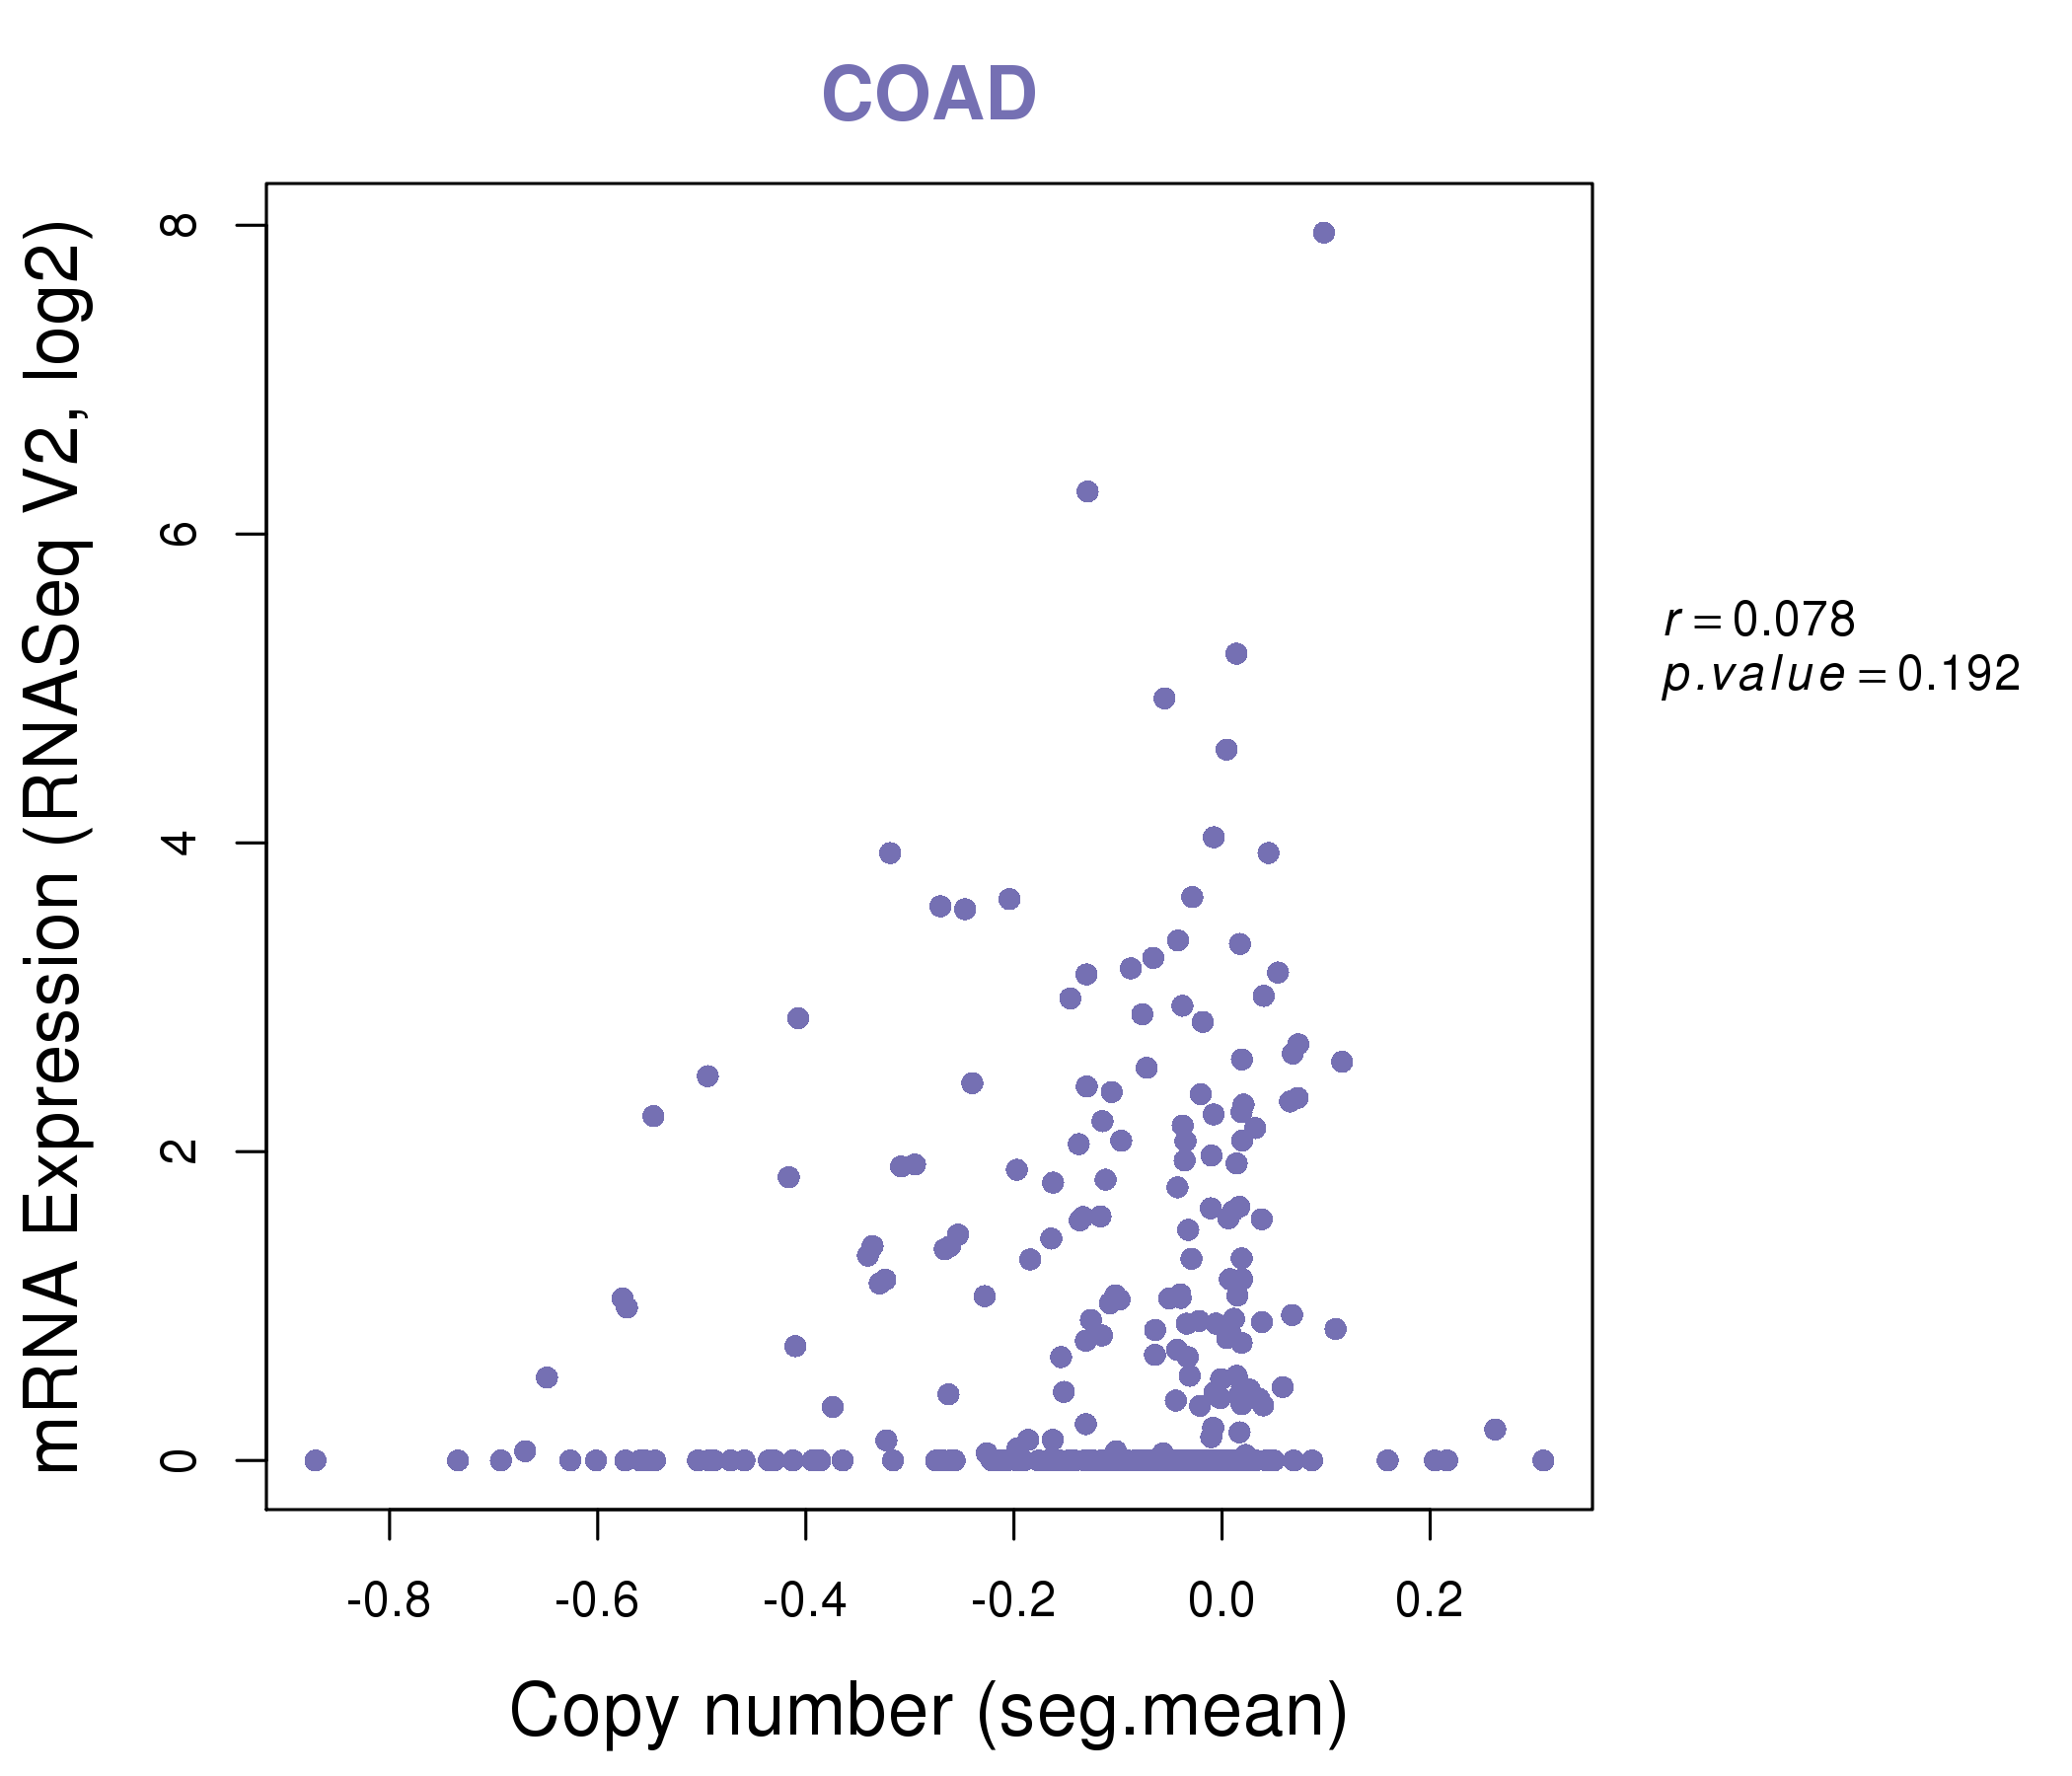
| * This plots show the correlation between CNV and gene expression. |
: Open all plots for all cancer types
 |
|
 |
|
| Top |
| Gene-Gene Network Information |
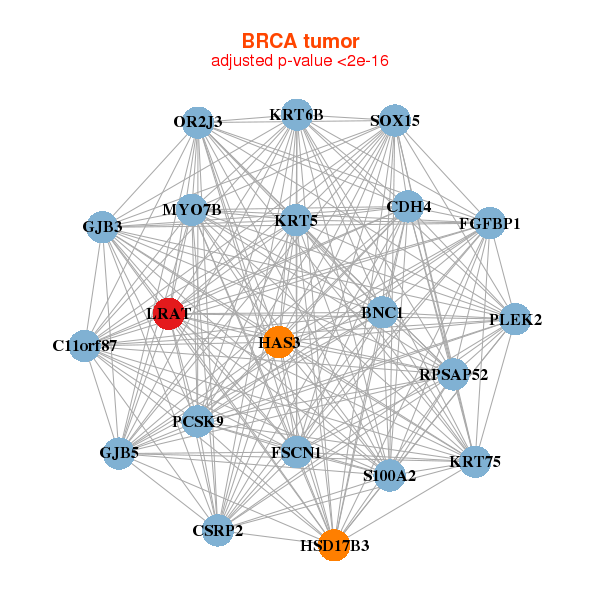
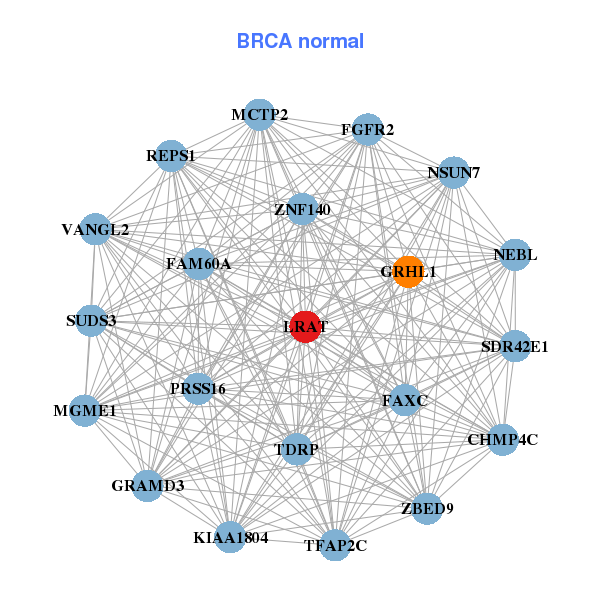
| * Co-Expression network figures were drawn using R package igraph. Only the top 20 genes with the highest correlations were shown. Red circle: input gene, orange circle: cell metabolism gene, sky circle: other gene |
: Open all plots for all cancer types
 |
| ||||
| BNC1,C11orf87,CDH4,CSRP2,FGFBP1,FSCN1,GJB3, GJB5,HAS3,HSD17B3,KRT5,KRT6B,KRT75,LRAT, MYO7B,OR2J3,PCSK9,PLEK2,RPSAP52,S100A2,SOX15 | MGME1,FAXC,TDRP,CHMP4C,FAM60A,FGFR2,GRAMD3, GRHL1,KIAA1804,LRAT,MCTP2,NEBL,NSUN7,PRSS16, REPS1,ZBED9,SDR42E1,SUDS3,TFAP2C,VANGL2,ZNF140 | ||||
 |
| ||||
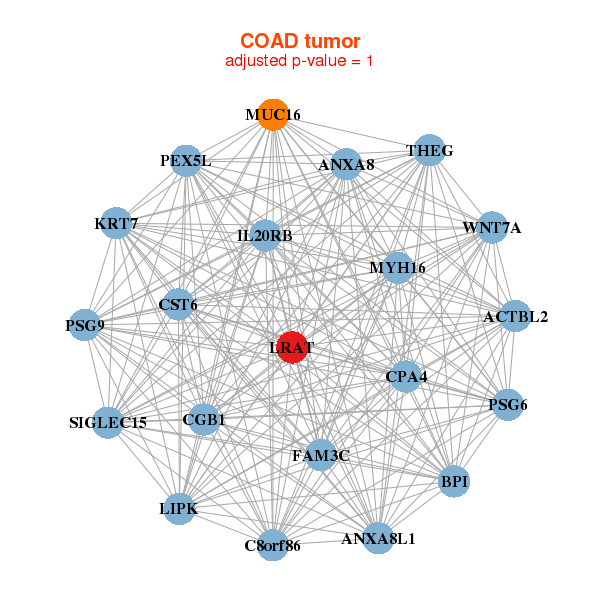
| ACTBL2,ANXA8,ANXA8L1,BPI,C8orf86,CGB1,CPA4, CST6,FAM3C,IL20RB,KRT7,LIPK,LRAT,MUC16, MYH16,PEX5L,PSG6,PSG9,SIGLEC15,THEG,WNT7A | APOB,CPO,CPS1,CUBN,DAB1,DFNA5,ENPEP, FMO1,KCNJ13,KHK,LOC285733,LRAT,MTTP,OAT, PDZD7,SEC14L2,SLC28A1,SLC5A4,SOAT2,TMPRSS15,UGT3A1 |
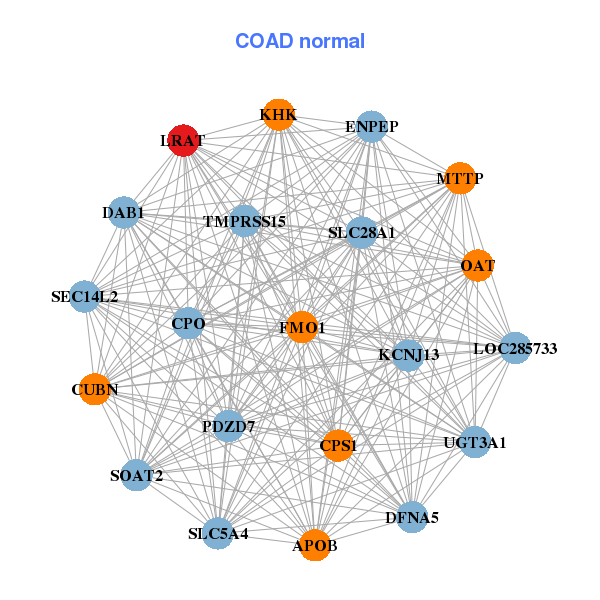
| * Co-Expression network figures were drawn using R package igraph. Only the top 20 genes with the highest correlations were shown. Red circle: input gene, orange circle: cell metabolism gene, sky circle: other gene |
: Open all plots for all cancer types
| Top |
: Open all interacting genes' information including KEGG pathway for all interacting genes from DAVID
| Top |
| Pharmacological Information for LRAT |
| DB Category | DB Name | DB's ID and Url link |
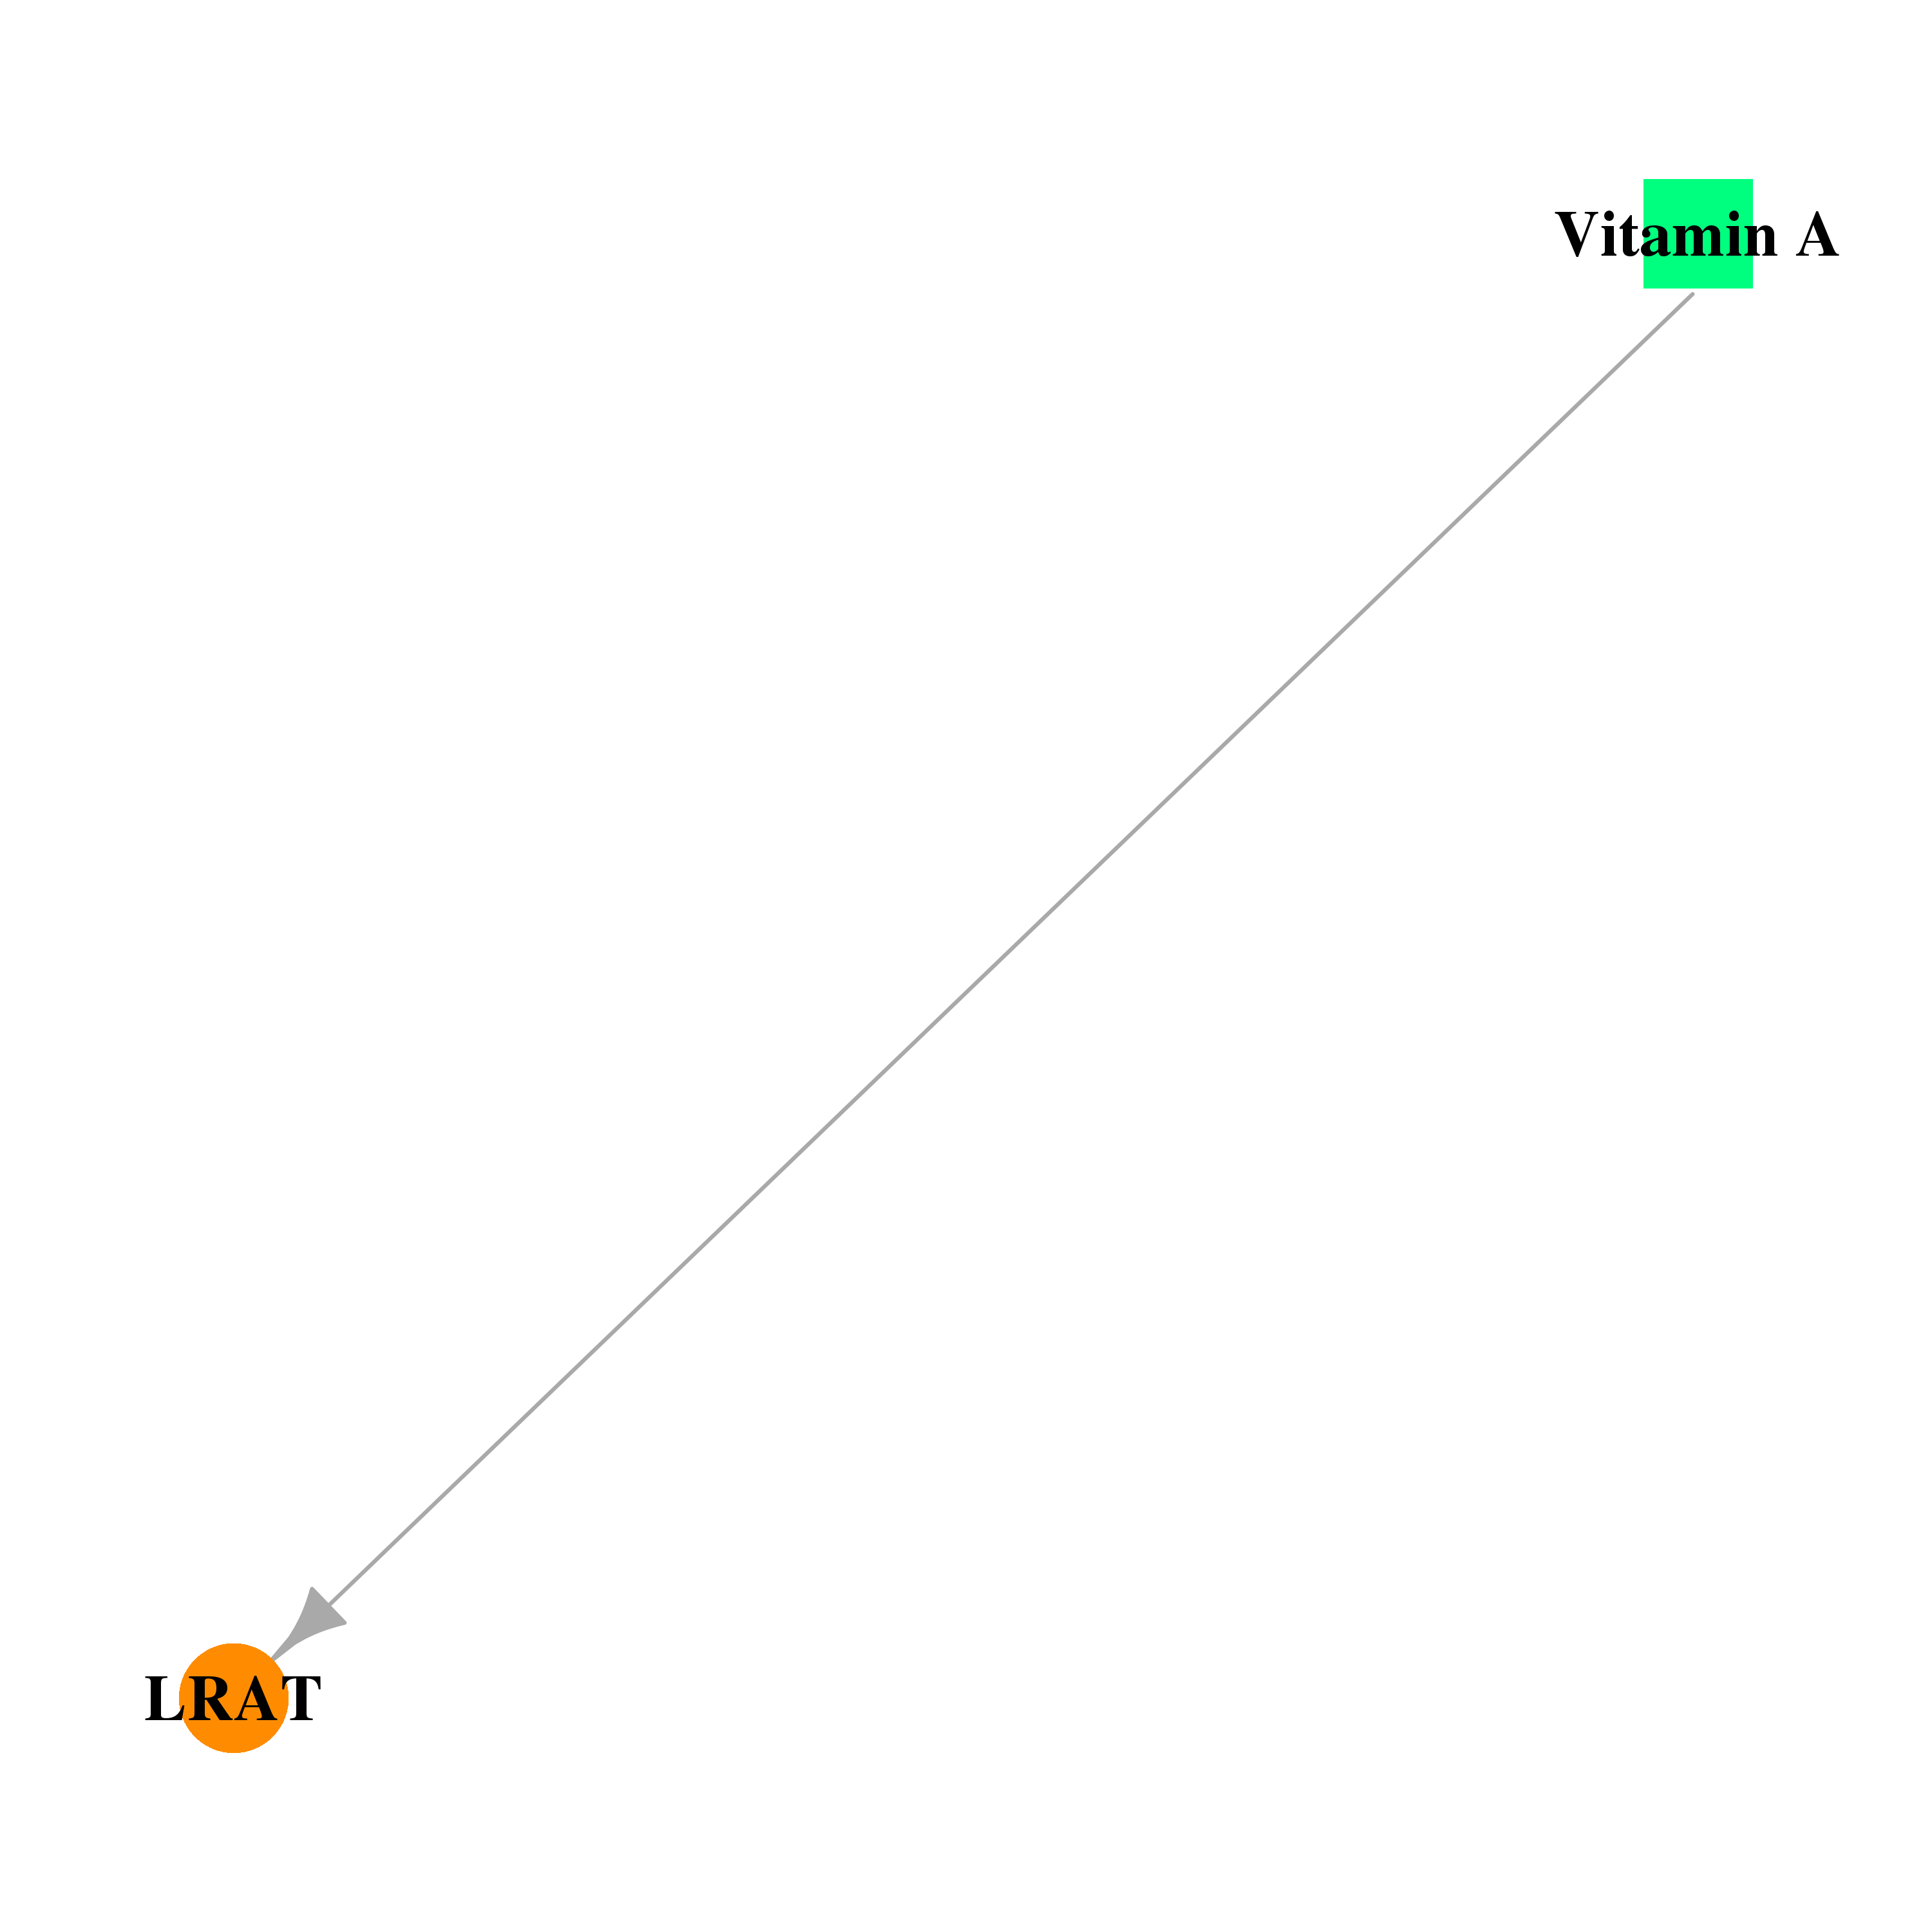
| * Gene Centered Interaction Network. |
 |
| * Drug Centered Interaction Network. |
| DrugBank ID | Target Name | Drug Groups | Generic Name | Drug Centered Network | Drug Structure |
| DB00162 | lecithin retinol acyltransferase (phosphatidylcholine--retinol O-acyltransferase) | approved; nutraceutical | Vitamin A | 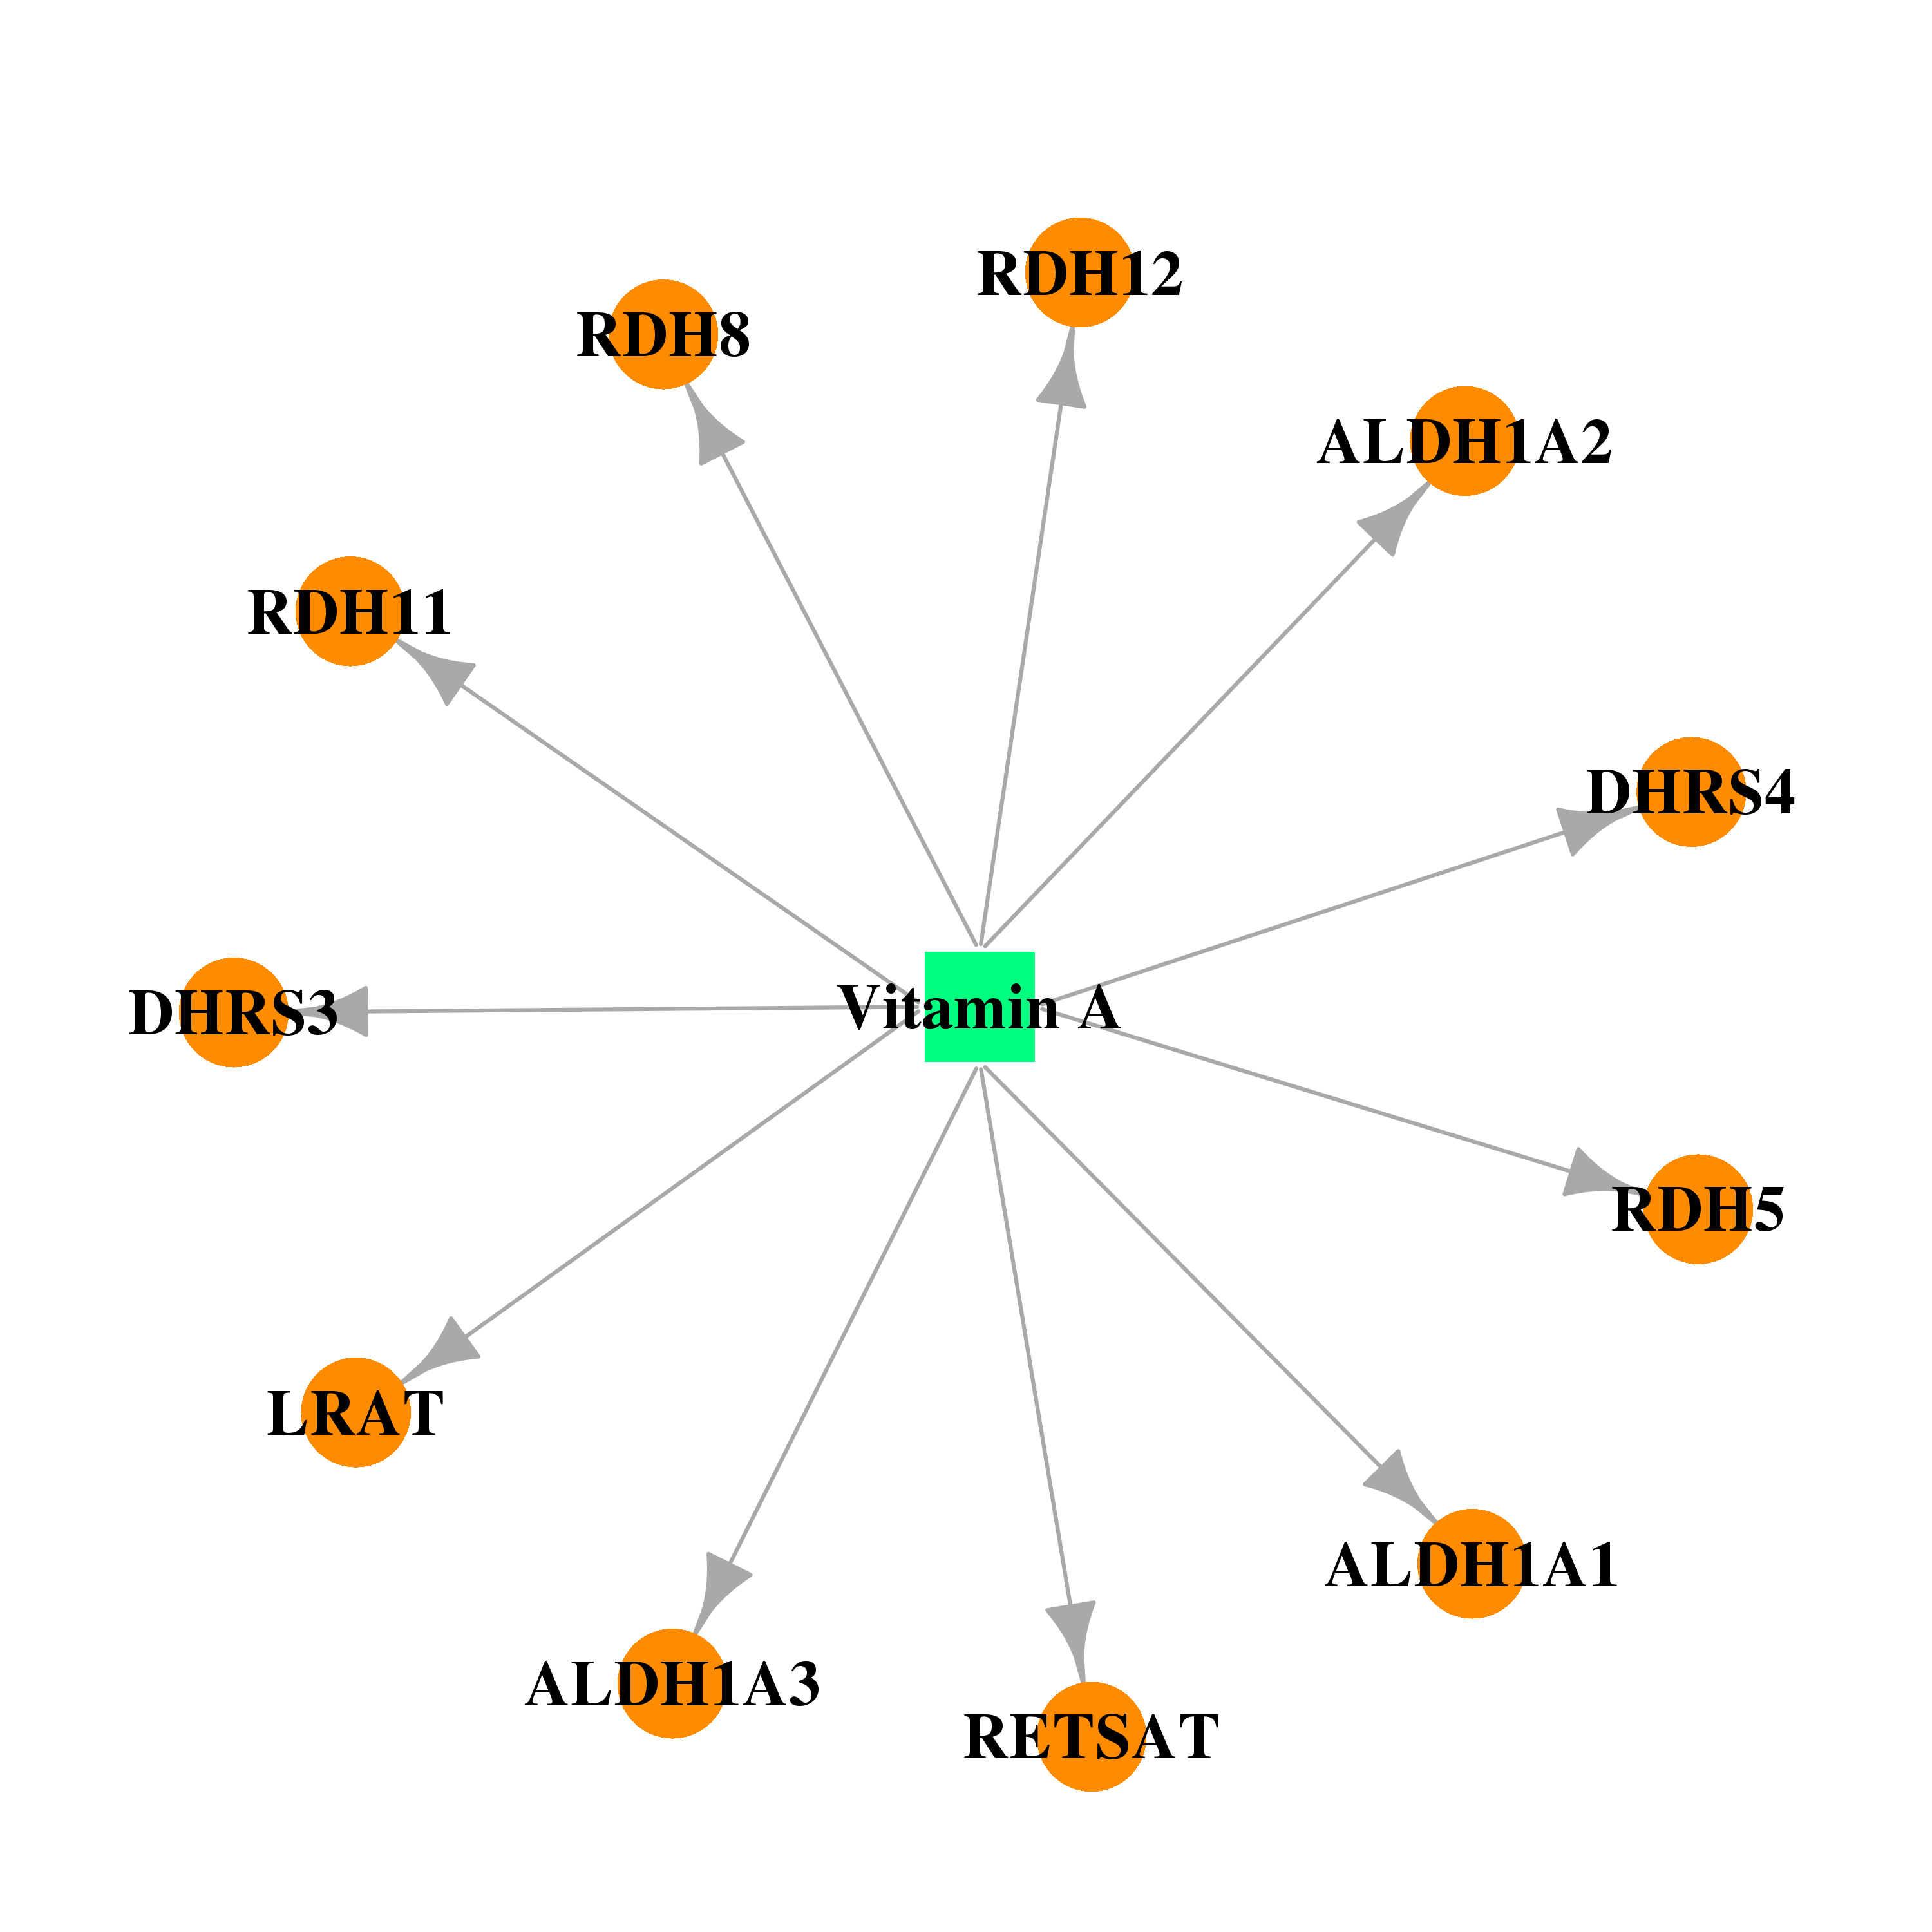 | 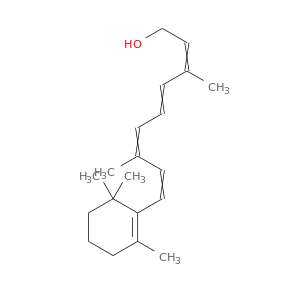 |
| Top |
| Cross referenced IDs for LRAT |
| * We obtained these cross-references from Uniprot database. It covers 150 different DBs, 18 categories. http://www.uniprot.org/help/cross_references_section |
: Open all cross reference information
|
Copyright © 2016-Present - The Univsersity of Texas Health Science Center at Houston @ |