|
||||||||||||||||||||
| |
| Phenotypic Information (metabolism pathway, cancer, disease, phenome) |
| |
| |
| Gene-Gene Network Information: Co-Expression Network, Interacting Genes & KEGG |
| |
|


| Gene Summary for GCNT3 |
| Basic gene info. | Gene symbol | GCNT3 |
| Gene name | glucosaminyl (N-acetyl) transferase 3, mucin type | |
| Synonyms | C2/4GnT|C24GNT|C2GNT2|C2GNTM|GNTM | |
| Cytomap | UCSC genome browser: 15q21.3 | |
| Genomic location | chr15 :59903981-59912210 | |
| Type of gene | protein-coding | |
| RefGenes | NM_004751.2, | |
| Ensembl id | ENSG00000140297 | |
| Description | C2GnT-mucin typebeta-1,3-galactosyl-O-glycosyl-glycoprotein beta-1,6-N-acetylglucosaminyltransferase 3beta1,6-N-acetylglucosaminyltransferase-Mbeta1,6GlcNAc-transferasecore 2/core 4 beta-1,6-N-acetylglucosaminyltransferasehC2GnT-Mmucus-type core 2 b | |
| Modification date | 20141207 | |
| dbXrefs | MIM : 606836 | |
| HGNC : HGNC | ||
| Ensembl : ENSG00000140297 | ||
| HPRD : 06018 | ||
| Vega : OTTHUMG00000132726 | ||
| Protein | UniProt: go to UniProt's Cross Reference DB Table | |
| Expression | CleanEX: HS_GCNT3 | |
| BioGPS: 9245 | ||
| Gene Expression Atlas: ENSG00000140297 | ||
| The Human Protein Atlas: ENSG00000140297 | ||
| Pathway | NCI Pathway Interaction Database: GCNT3 | |
| KEGG: GCNT3 | ||
| REACTOME: GCNT3 | ||
| ConsensusPathDB | ||
| Pathway Commons: GCNT3 | ||
| Metabolism | MetaCyc: GCNT3 | |
| HUMANCyc: GCNT3 | ||
| Regulation | Ensembl's Regulation: ENSG00000140297 | |
| miRBase: chr15 :59,903,981-59,912,210 | ||
| TargetScan: NM_004751 | ||
| cisRED: ENSG00000140297 | ||
| Context | iHOP: GCNT3 | |
| cancer metabolism search in PubMed: GCNT3 | ||
| UCL Cancer Institute: GCNT3 | ||
| Assigned class in ccmGDB | C | |
| Top |
| Phenotypic Information for GCNT3(metabolism pathway, cancer, disease, phenome) |
| Cancer | CGAP: GCNT3 |
| Familial Cancer Database: GCNT3 | |
| * This gene is included in those cancer gene databases. |
|
|
|
|
|
| . | ||||||||||||||
Oncogene 1 | Significant driver gene in | |||||||||||||||||||
| cf) number; DB name 1 Oncogene; http://nar.oxfordjournals.org/content/35/suppl_1/D721.long, 2 Tumor Suppressor gene; https://bioinfo.uth.edu/TSGene/, 3 Cancer Gene Census; http://www.nature.com/nrc/journal/v4/n3/abs/nrc1299.html, 4 CancerGenes; http://nar.oxfordjournals.org/content/35/suppl_1/D721.long, 5 Network of Cancer Gene; http://ncg.kcl.ac.uk/index.php, 1Therapeutic Vulnerabilities in Cancer; http://cbio.mskcc.org/cancergenomics/statius/ |
| REACTOME_METABOLISM_OF_PROTEINS | |
| OMIM | |
| Orphanet | |
| Disease | KEGG Disease: GCNT3 |
| MedGen: GCNT3 (Human Medical Genetics with Condition) | |
| ClinVar: GCNT3 | |
| Phenotype | MGI: GCNT3 (International Mouse Phenotyping Consortium) |
| PhenomicDB: GCNT3 | |
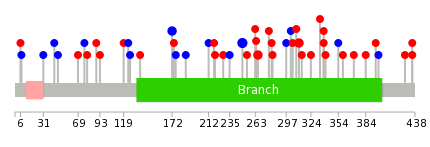
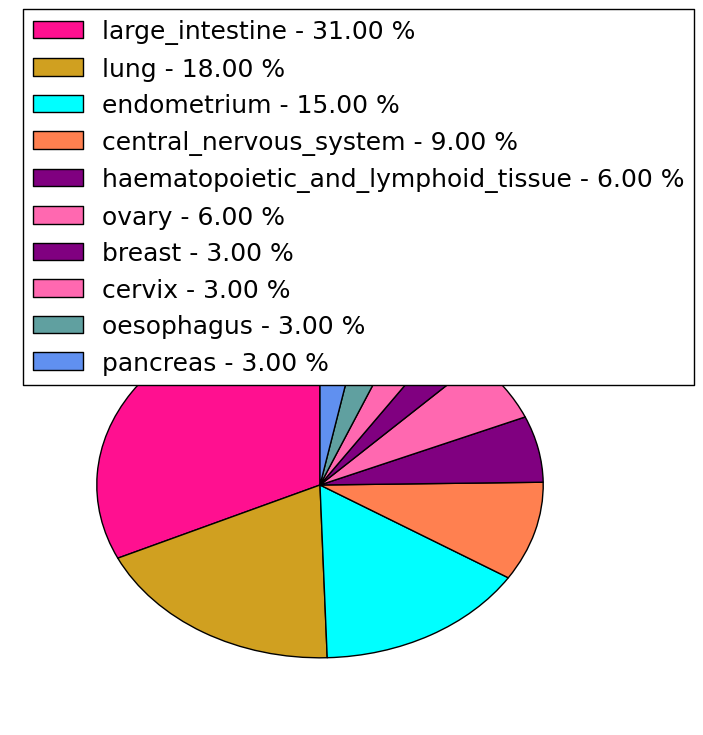
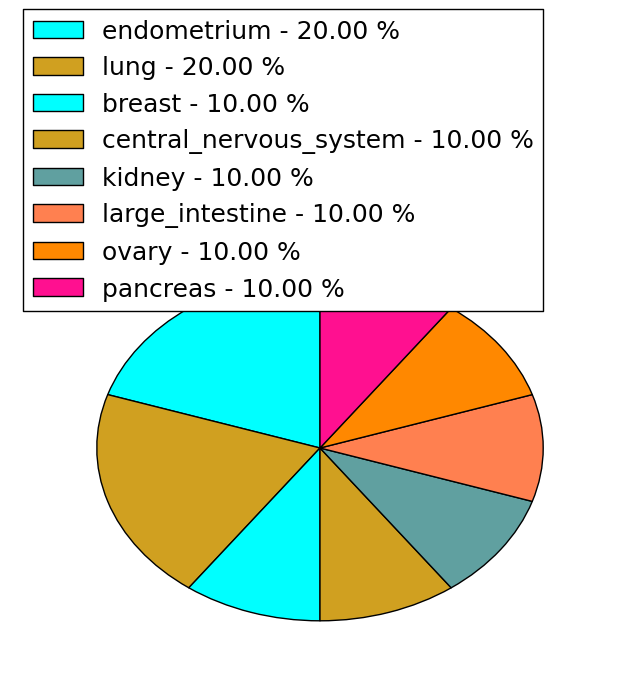
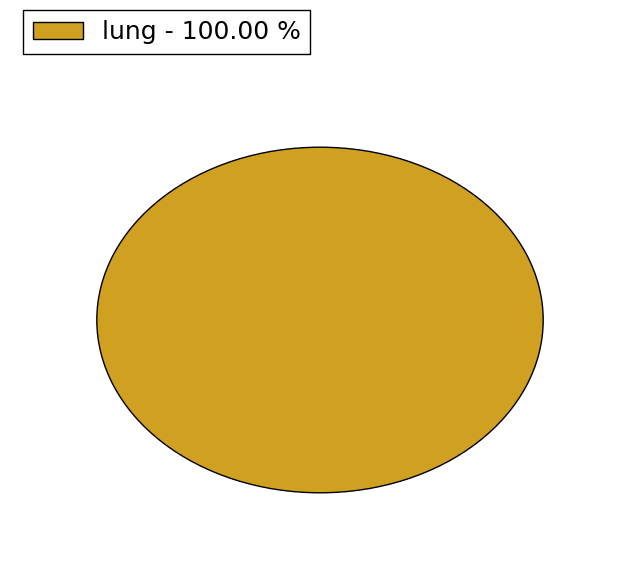
| Mutations for GCNT3 |
| * Under tables are showing count per each tissue to give us broad intuition about tissue specific mutation patterns.You can go to the detailed page for each mutation database's web site. |
| There's no structural variation information in COSMIC data for this gene. |
| * From mRNA Sanger sequences, Chitars2.0 arranged chimeric transcripts. This table shows GCNT3 related fusion information. |
| ID | Head Gene | Tail Gene | Accession | Gene_a | qStart_a | qEnd_a | Chromosome_a | tStart_a | tEnd_a | Gene_a | qStart_a | qEnd_a | Chromosome_a | tStart_a | tEnd_a |
| AW842590 | GCNT3 | 11 | 360 | 15 | 59910926 | 59911275 | HSP90B1 | 352 | 428 | 12 | 104336852 | 104336928 | |
| Top |
| There's no copy number variation information in COSMIC data for this gene. |
| Top |
|
 |
| Top |
| Stat. for Non-Synonymous SNVs (# total SNVs=32) | (# total SNVs=10) |
 |  |
(# total SNVs=0) | (# total SNVs=1) |
 |
| Top |
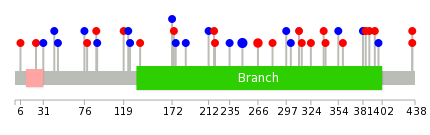
| * When you move the cursor on each content, you can see more deailed mutation information on the Tooltip. Those are primary_site,primary_histology,mutation(aa),pubmedID. |
| GRCh37 position | Mutation(aa) | Unique sampleID count |
| chr15:59911184-59911184 | p.R249R | 3 |
| chr15:59911232-59911232 | p.W265* | 2 |
| chr15:59911235-59911235 | p.K266N | 2 |
| chr15:59911701-59911701 | p.Q422* | 2 |
| chr15:59911741-59911741 | p.G435V | 2 |
| chr15:59910953-59910953 | p.F172F | 2 |
| chr15:59911535-59911535 | p.W366* | 2 |
| chr15:59911370-59911370 | p.K311N | 2 |
| chr15:59910672-59910672 | p.E79Q | 2 |
| chr15:59911549-59911549 | p.G371E | 1 |
| Top |
|
 |
| Point Mutation/ Tissue ID | 1 | 2 | 3 | 4 | 5 | 6 | 7 | 8 | 9 | 10 | 11 | 12 | 13 | 14 | 15 | 16 | 17 | 18 | 19 | 20 |
| # sample | 1 | 1 | 1 | 4 | 1 | 1 | 3 | 5 | 3 | 13 | 2 | 4 | ||||||||
| # mutation | 2 | 1 | 1 | 4 | 1 | 1 | 3 | 5 | 3 | 13 | 2 | 5 | ||||||||
| nonsynonymous SNV | 1 | 4 | 3 | 3 | 2 | 5 | 2 | 3 | ||||||||||||
| synonymous SNV | 2 | 1 | 1 | 1 | 2 | 1 | 8 | 2 |
| cf) Tissue ID; Tissue type (1; BLCA[Bladder Urothelial Carcinoma], 2; BRCA[Breast invasive carcinoma], 3; CESC[Cervical squamous cell carcinoma and endocervical adenocarcinoma], 4; COAD[Colon adenocarcinoma], 5; GBM[Glioblastoma multiforme], 6; Glioma Low Grade, 7; HNSC[Head and Neck squamous cell carcinoma], 8; KICH[Kidney Chromophobe], 9; KIRC[Kidney renal clear cell carcinoma], 10; KIRP[Kidney renal papillary cell carcinoma], 11; LAML[Acute Myeloid Leukemia], 12; LUAD[Lung adenocarcinoma], 13; LUSC[Lung squamous cell carcinoma], 14; OV[Ovarian serous cystadenocarcinoma ], 15; PAAD[Pancreatic adenocarcinoma], 16; PRAD[Prostate adenocarcinoma], 17; SKCM[Skin Cutaneous Melanoma], 18:STAD[Stomach adenocarcinoma], 19:THCA[Thyroid carcinoma], 20:UCEC[Uterine Corpus Endometrial Carcinoma]) |
| Top |
| * We represented just top 10 SNVs. When you move the cursor on each content, you can see more deailed mutation information on the Tooltip. Those are primary_site, primary_histology, mutation(aa), pubmedID. |
| Genomic Position | Mutation(aa) | Unique sampleID count |
| chr15:59911184 | p.R249R | 3 |
| chr15:59911235 | p.K266N | 2 |
| chr15:59911741 | p.G435E | 2 |
| chr15:59911142 | p.I354I | 1 |
| chr15:59911499 | p.V176V | 1 |
| chr15:59910809 | p.S359C | 1 |
| chr15:59911513 | p.R6K | 1 |
| chr15:59910454 | p.F187F | 1 |
| chr15:59910815 | p.P381P | 1 |
| chr15:59911580 | p.A23T | 1 |
| * Copy number data were extracted from TCGA using R package TCGA-Assembler. The URLs of all public data files on TCGA DCC data server were gathered on Jan-05-2015. Function ProcessCNAData in TCGA-Assembler package was used to obtain gene-level copy number value which is calculated as the average copy number of the genomic region of a gene. |
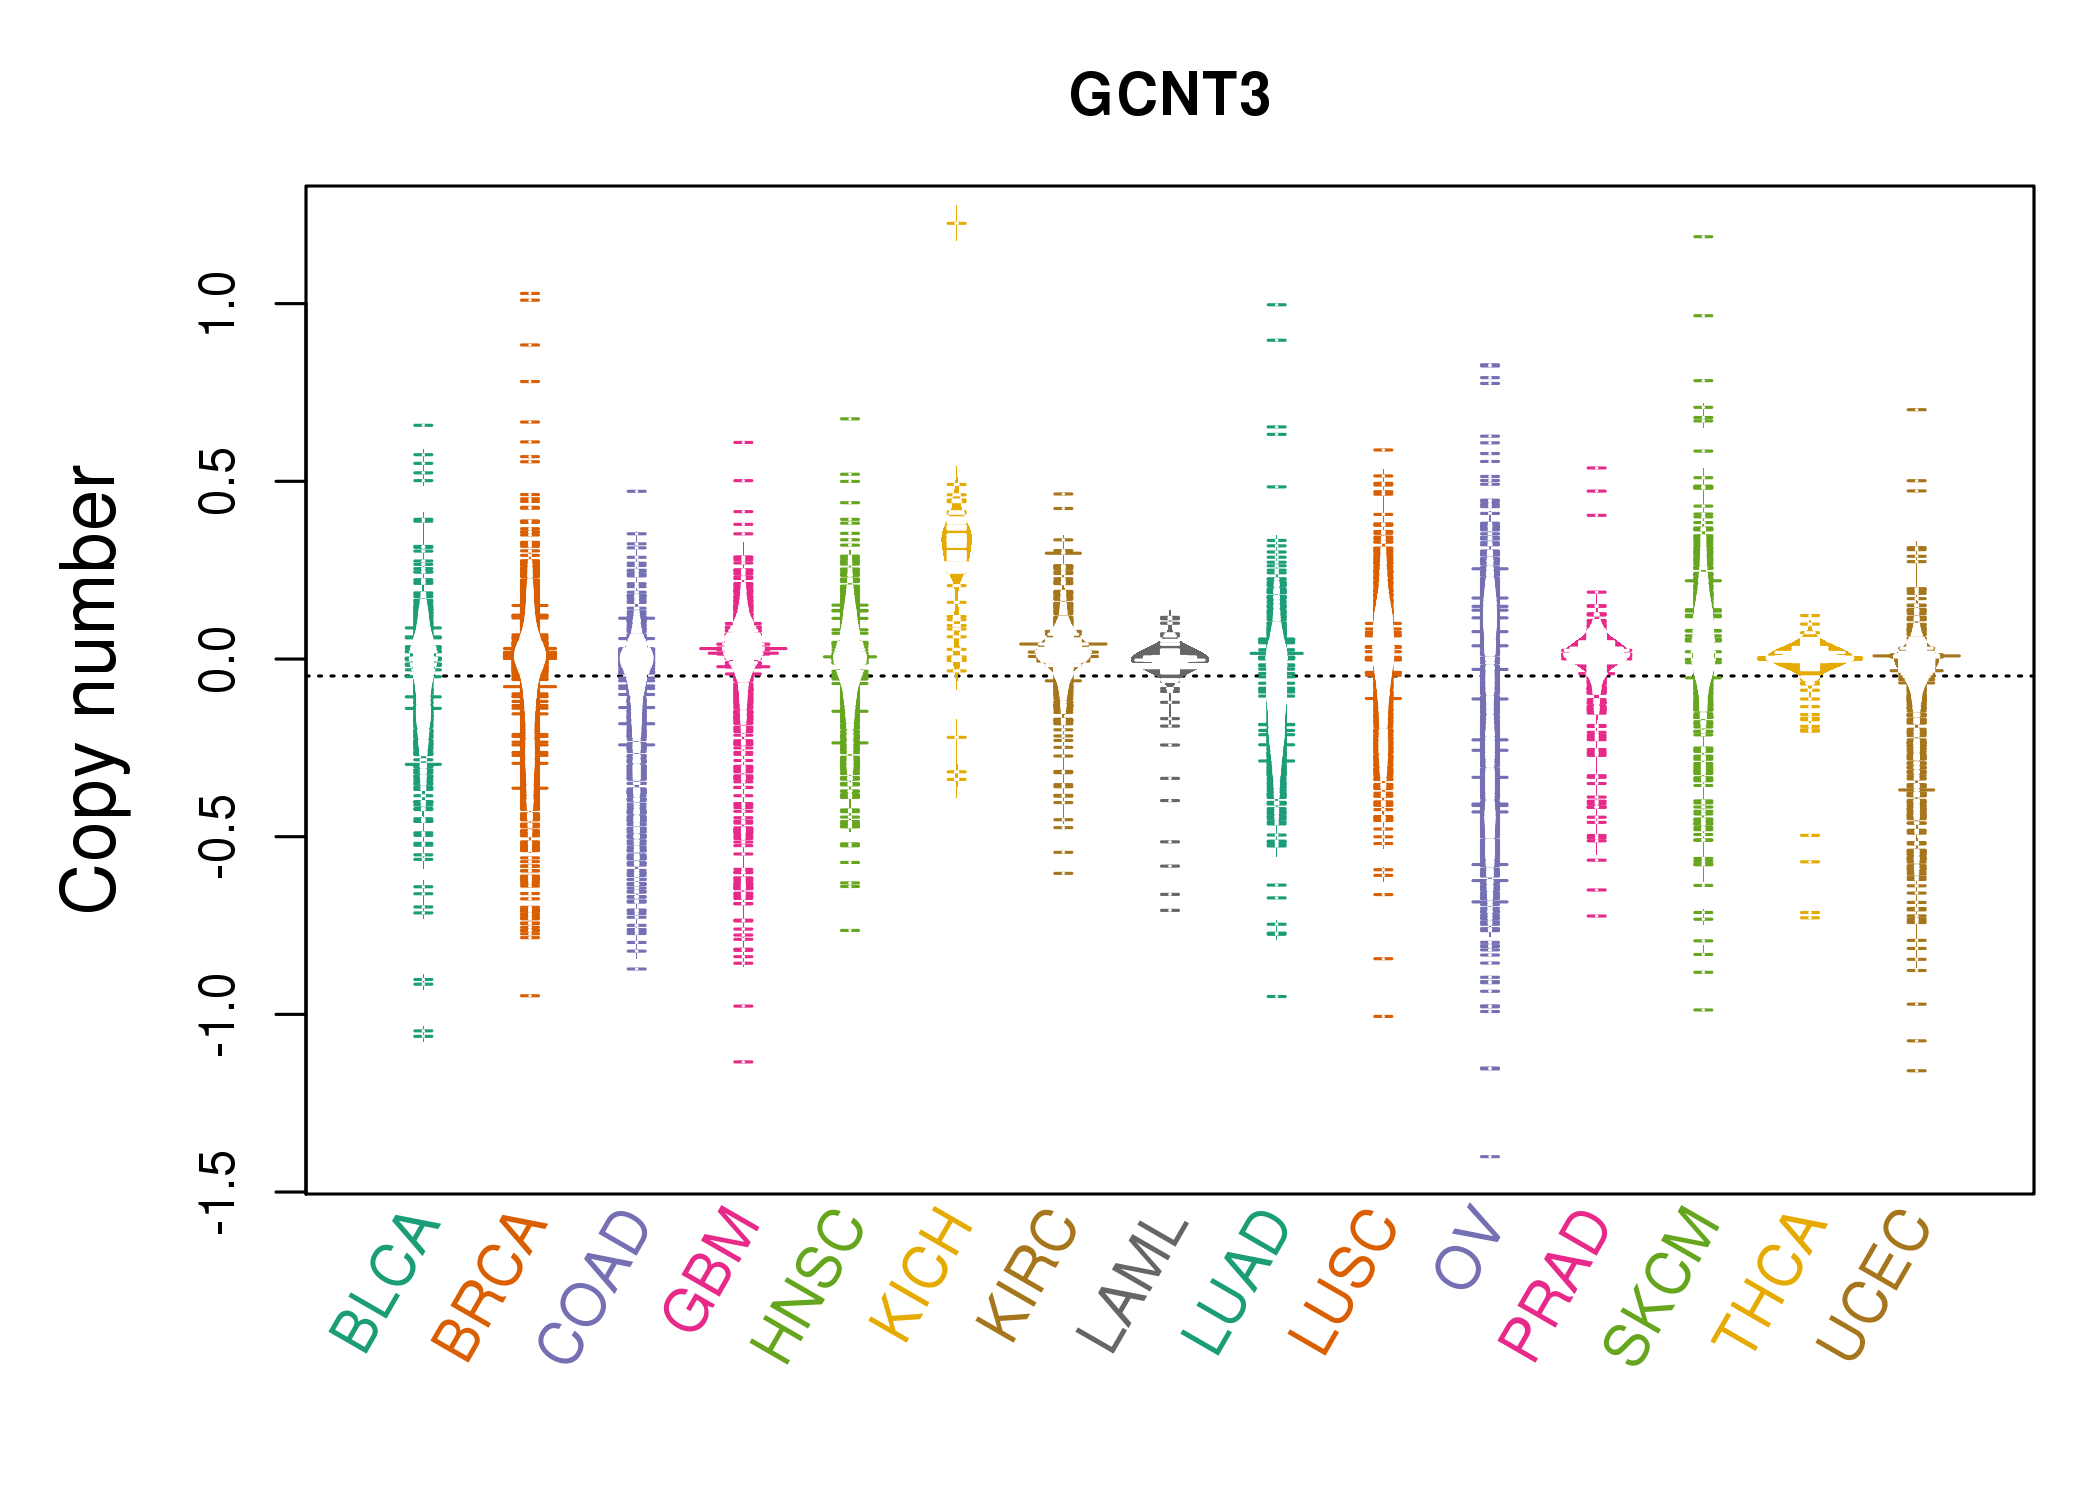 |
| cf) Tissue ID[Tissue type]: BLCA[Bladder Urothelial Carcinoma], BRCA[Breast invasive carcinoma], CESC[Cervical squamous cell carcinoma and endocervical adenocarcinoma], COAD[Colon adenocarcinoma], GBM[Glioblastoma multiforme], Glioma Low Grade, HNSC[Head and Neck squamous cell carcinoma], KICH[Kidney Chromophobe], KIRC[Kidney renal clear cell carcinoma], KIRP[Kidney renal papillary cell carcinoma], LAML[Acute Myeloid Leukemia], LUAD[Lung adenocarcinoma], LUSC[Lung squamous cell carcinoma], OV[Ovarian serous cystadenocarcinoma ], PAAD[Pancreatic adenocarcinoma], PRAD[Prostate adenocarcinoma], SKCM[Skin Cutaneous Melanoma], STAD[Stomach adenocarcinoma], THCA[Thyroid carcinoma], UCEC[Uterine Corpus Endometrial Carcinoma] |
| Top |
| Gene Expression for GCNT3 |
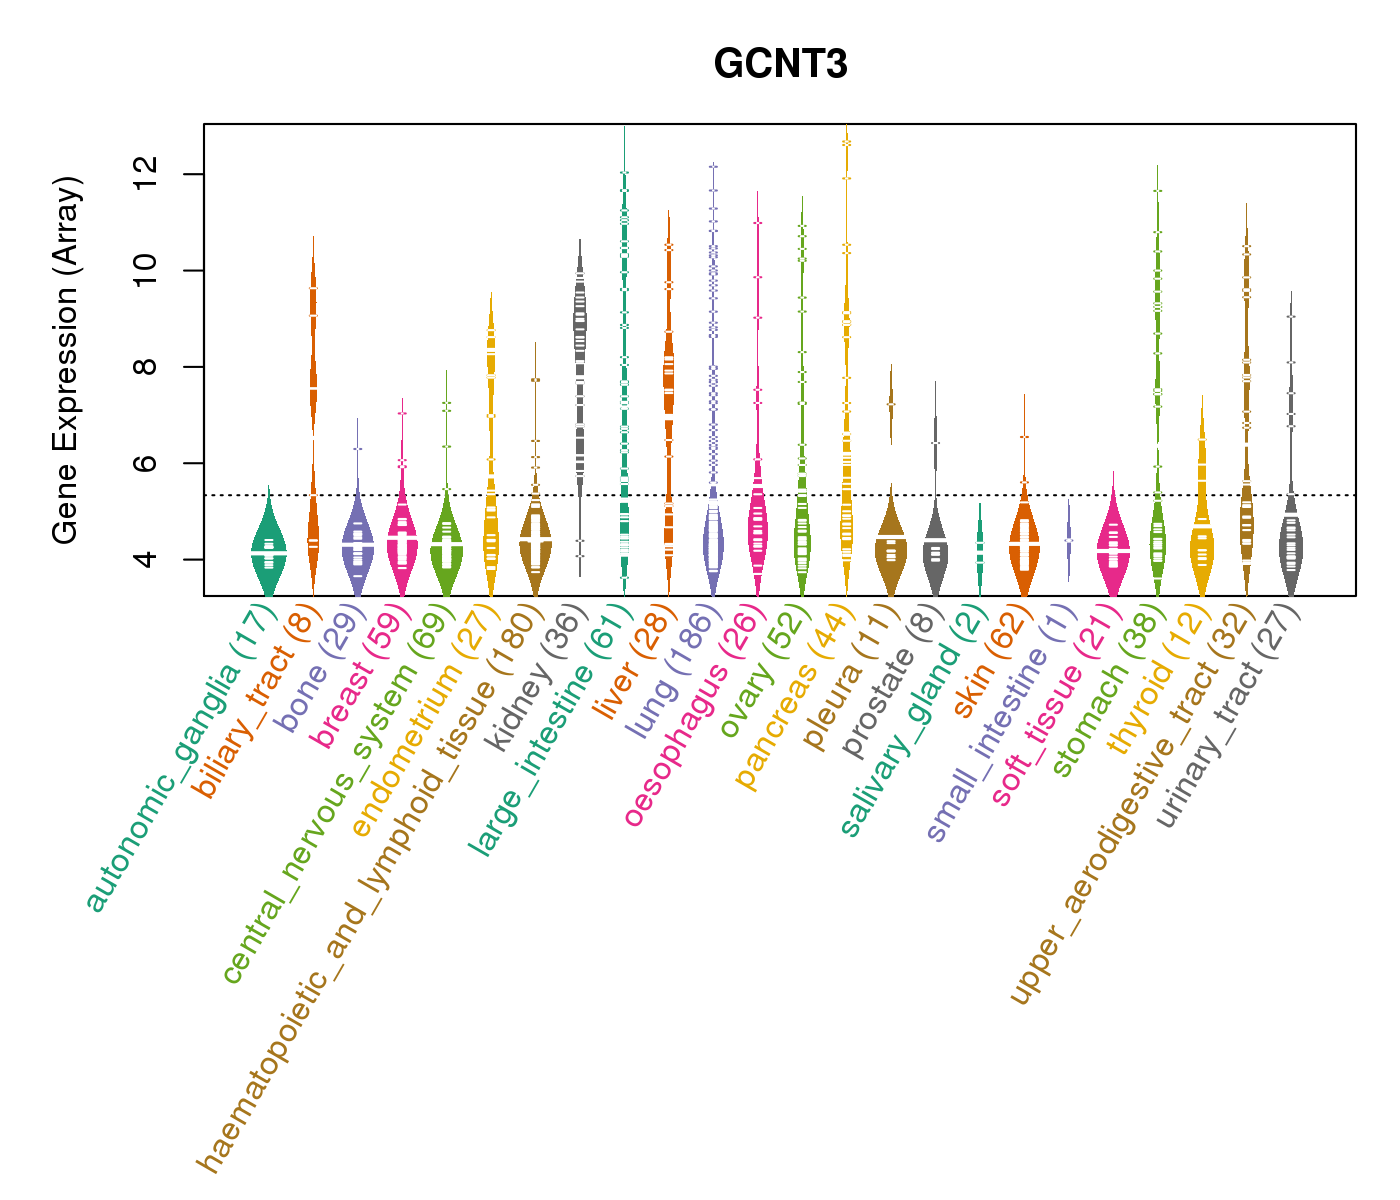
| * CCLE gene expression data were extracted from CCLE_Expression_Entrez_2012-10-18.res: Gene-centric RMA-normalized mRNA expression data. |
 |
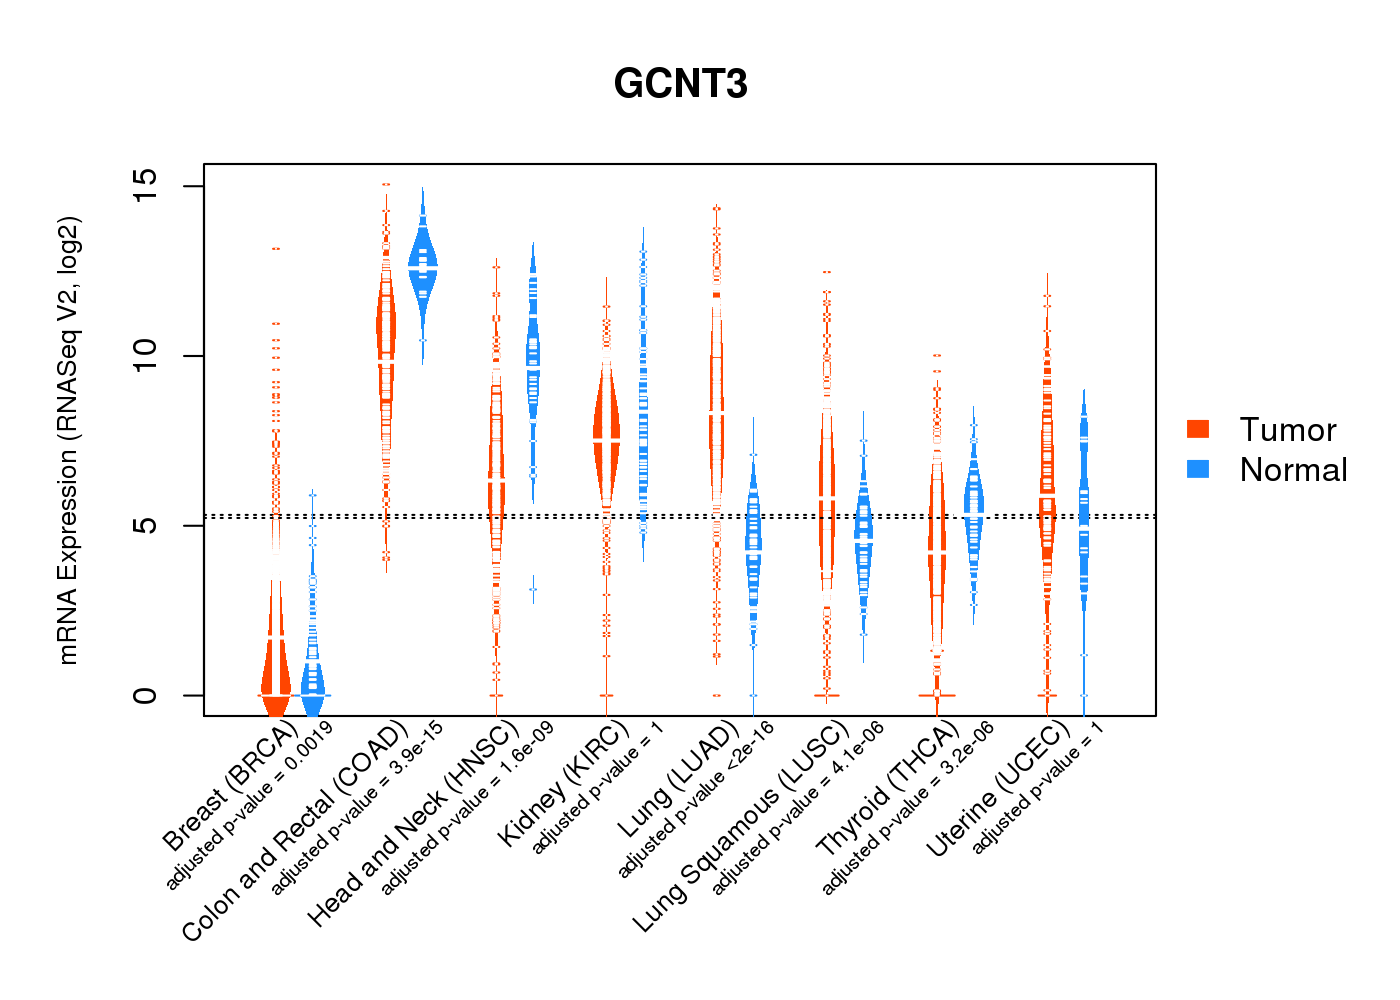
| * Normalized gene expression data of RNASeqV2 was extracted from TCGA using R package TCGA-Assembler. The URLs of all public data files on TCGA DCC data server were gathered at Jan-05-2015. Only eight cancer types have enough normal control samples for differential expression analysis. (t test, adjusted p<0.05 (using Benjamini-Hochberg FDR)) |
 |
| Top |
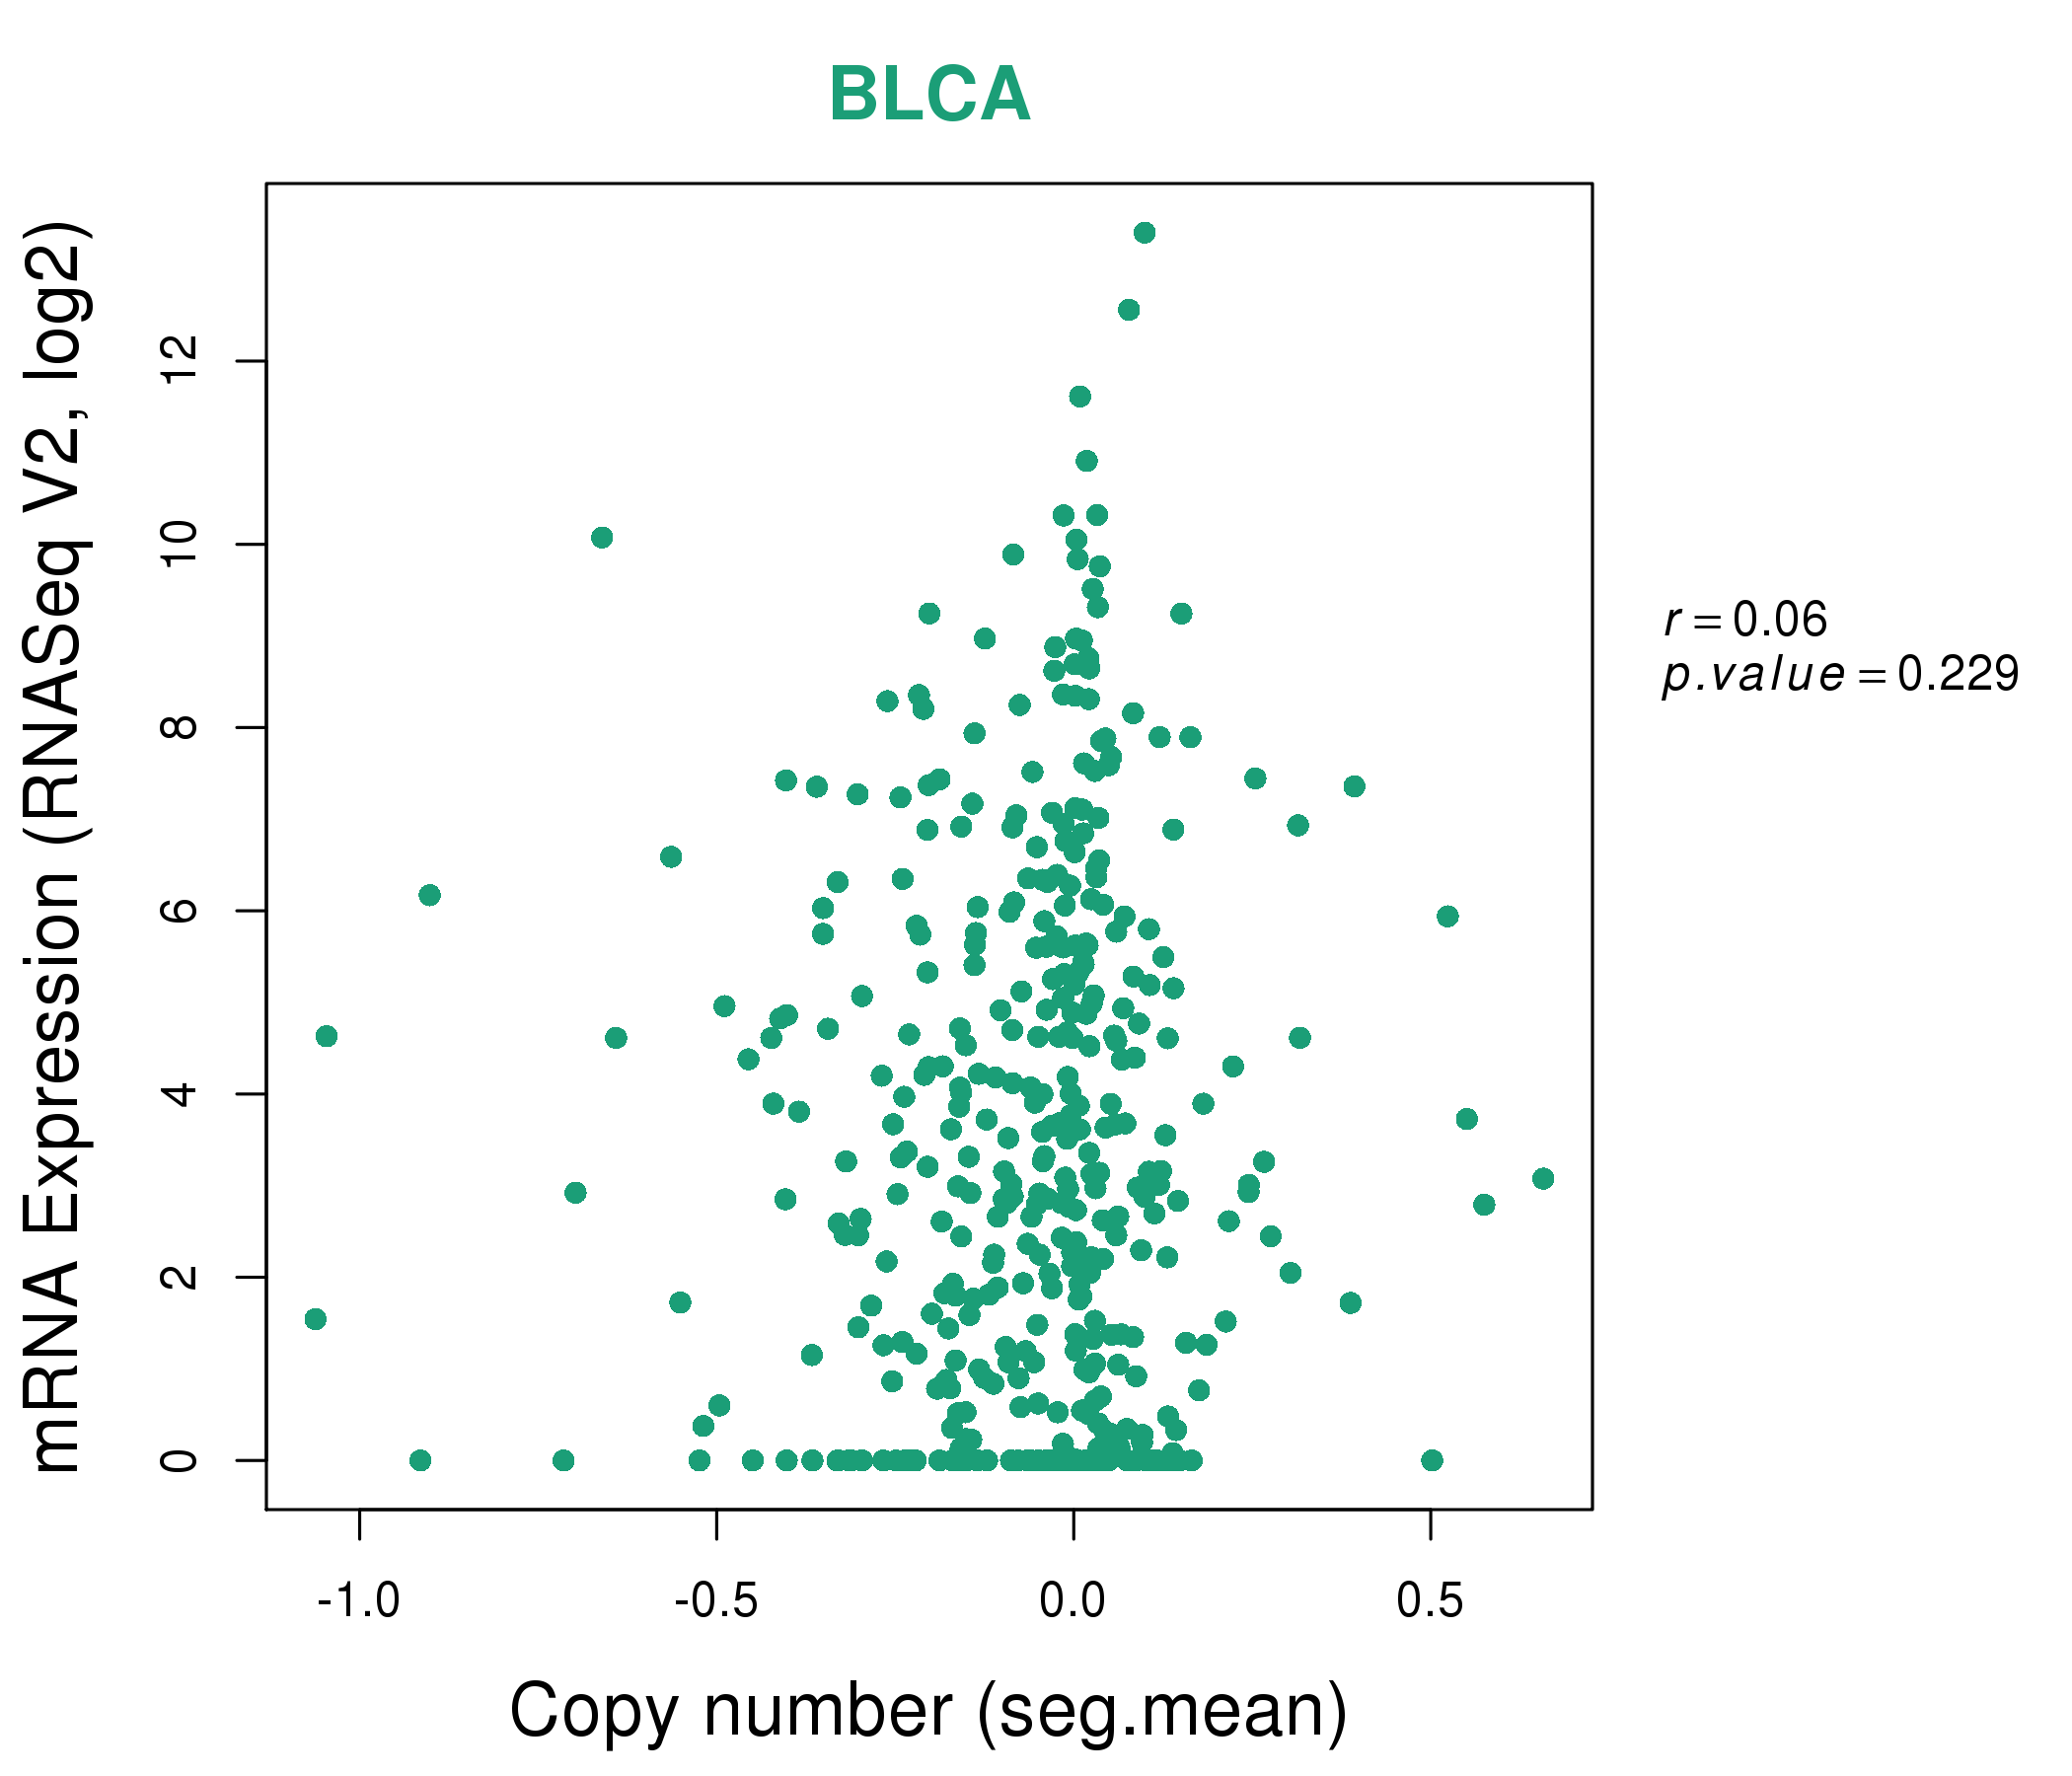
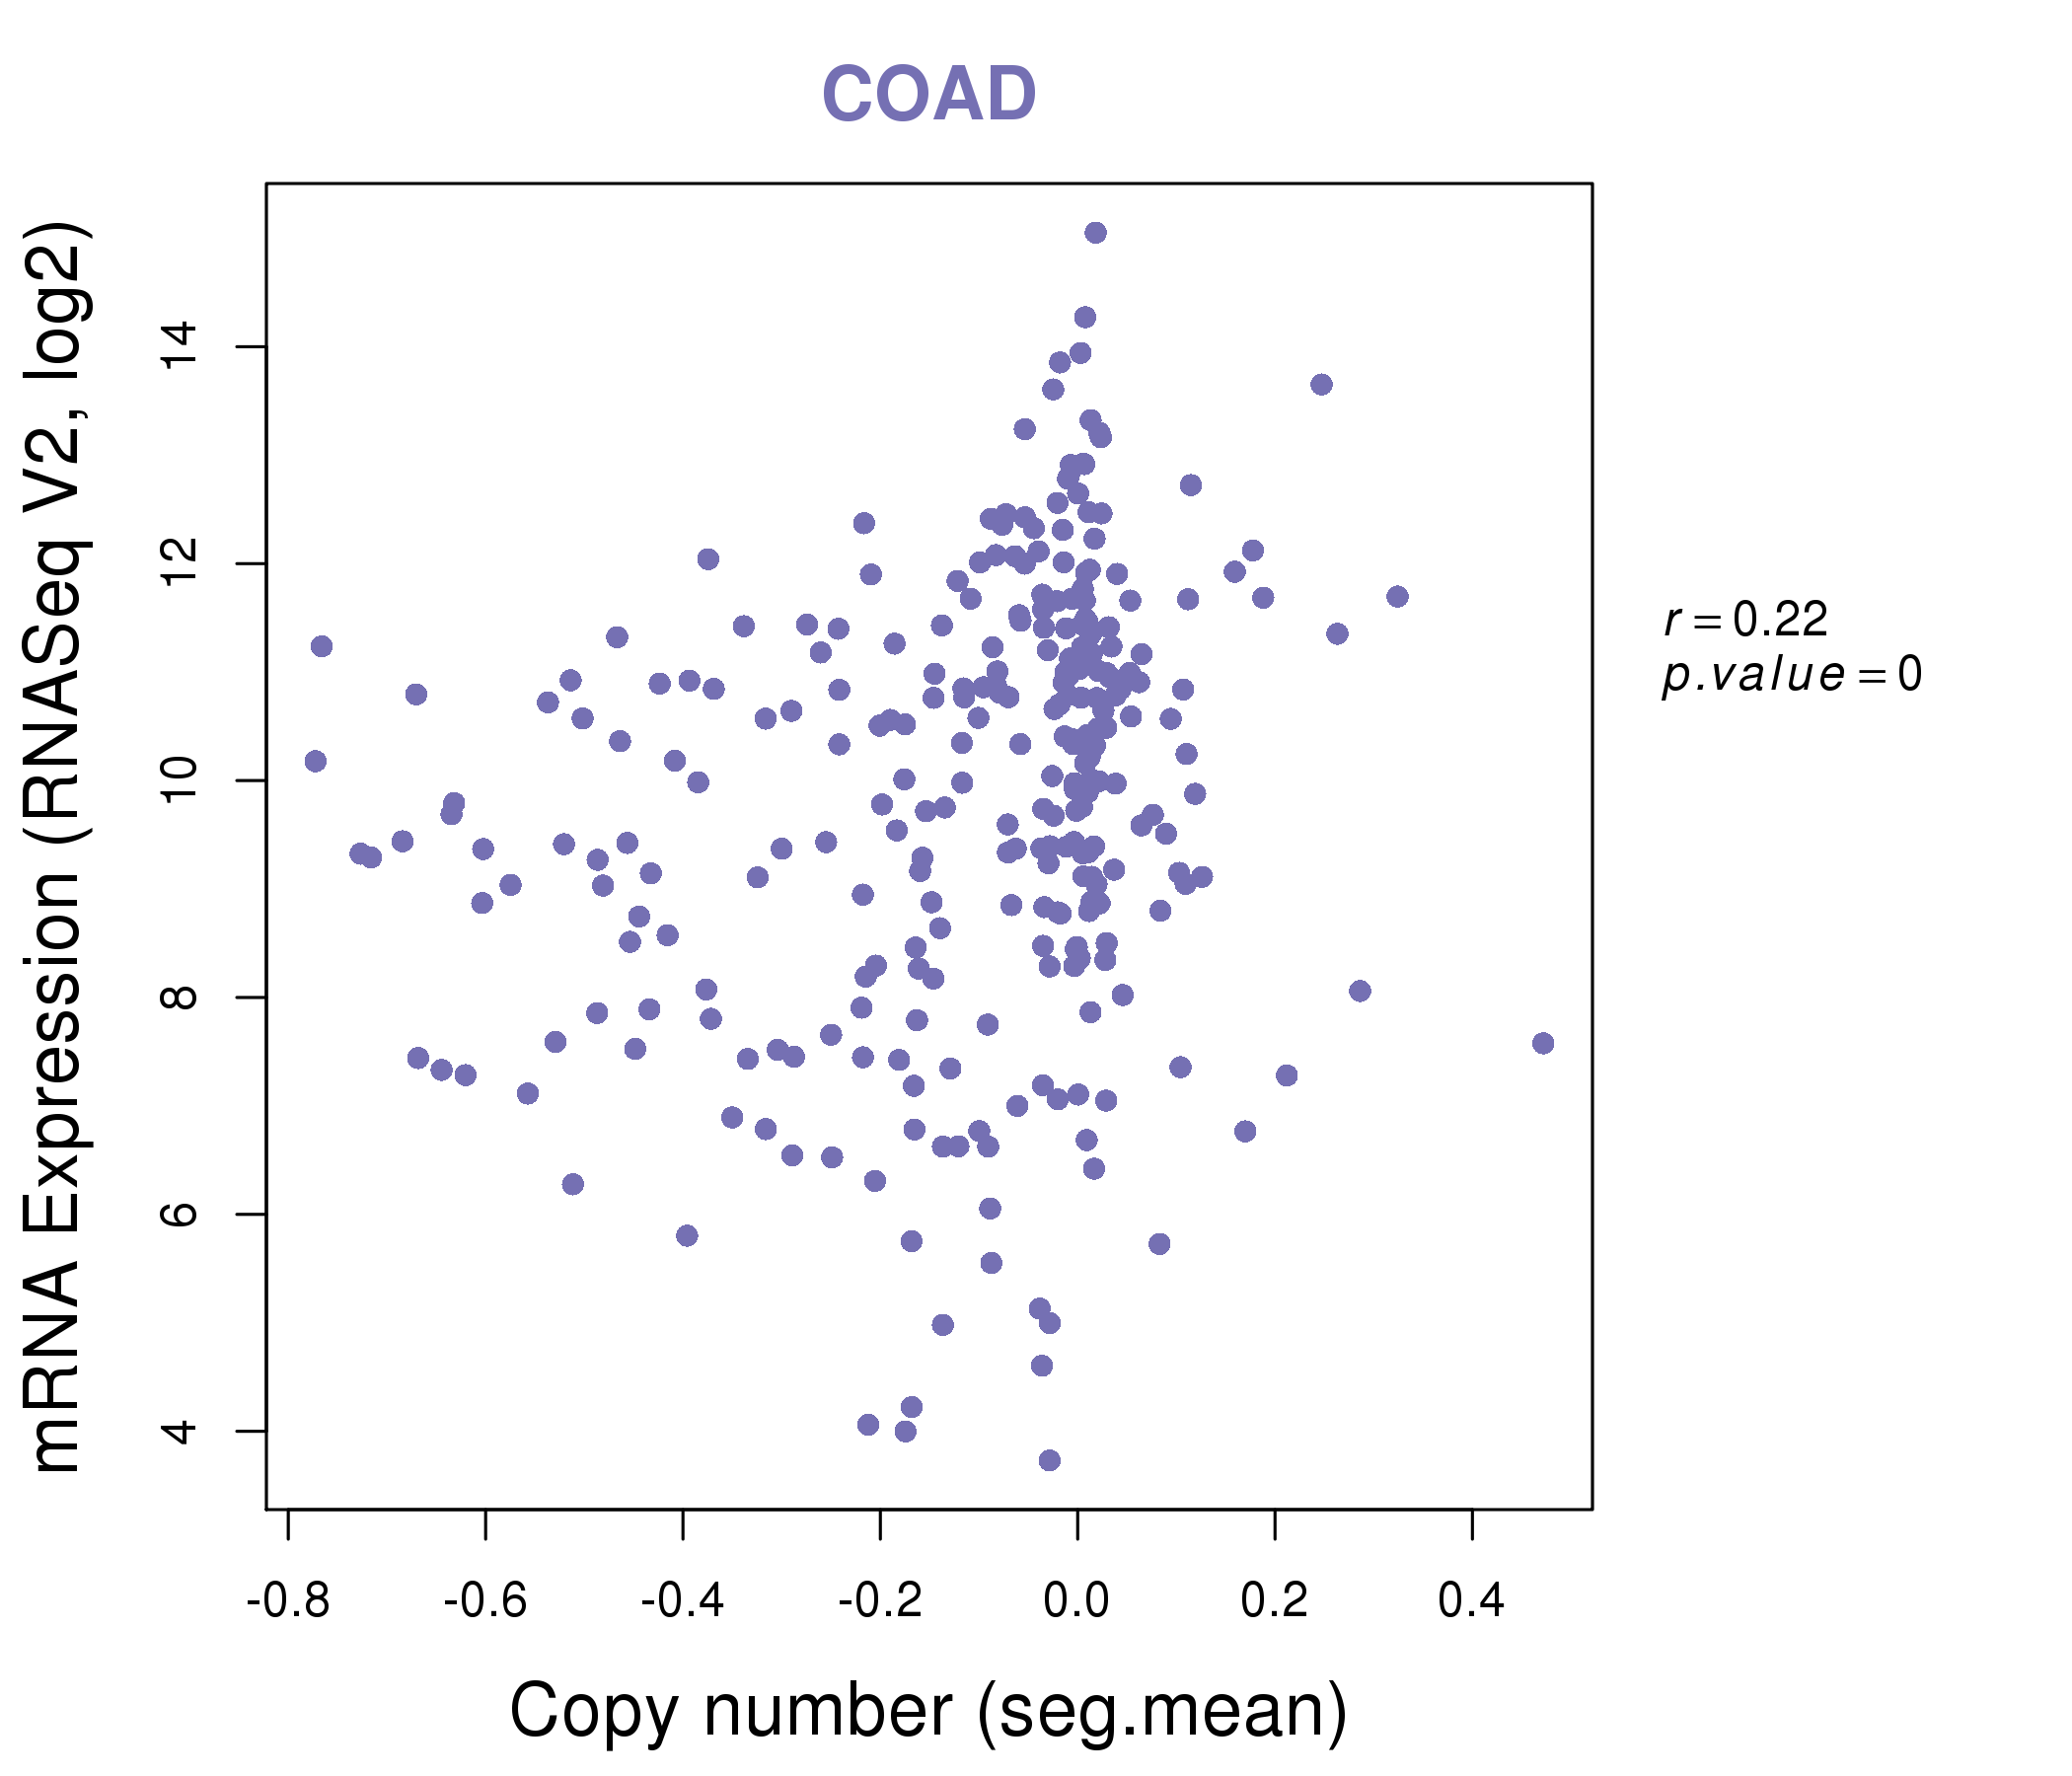
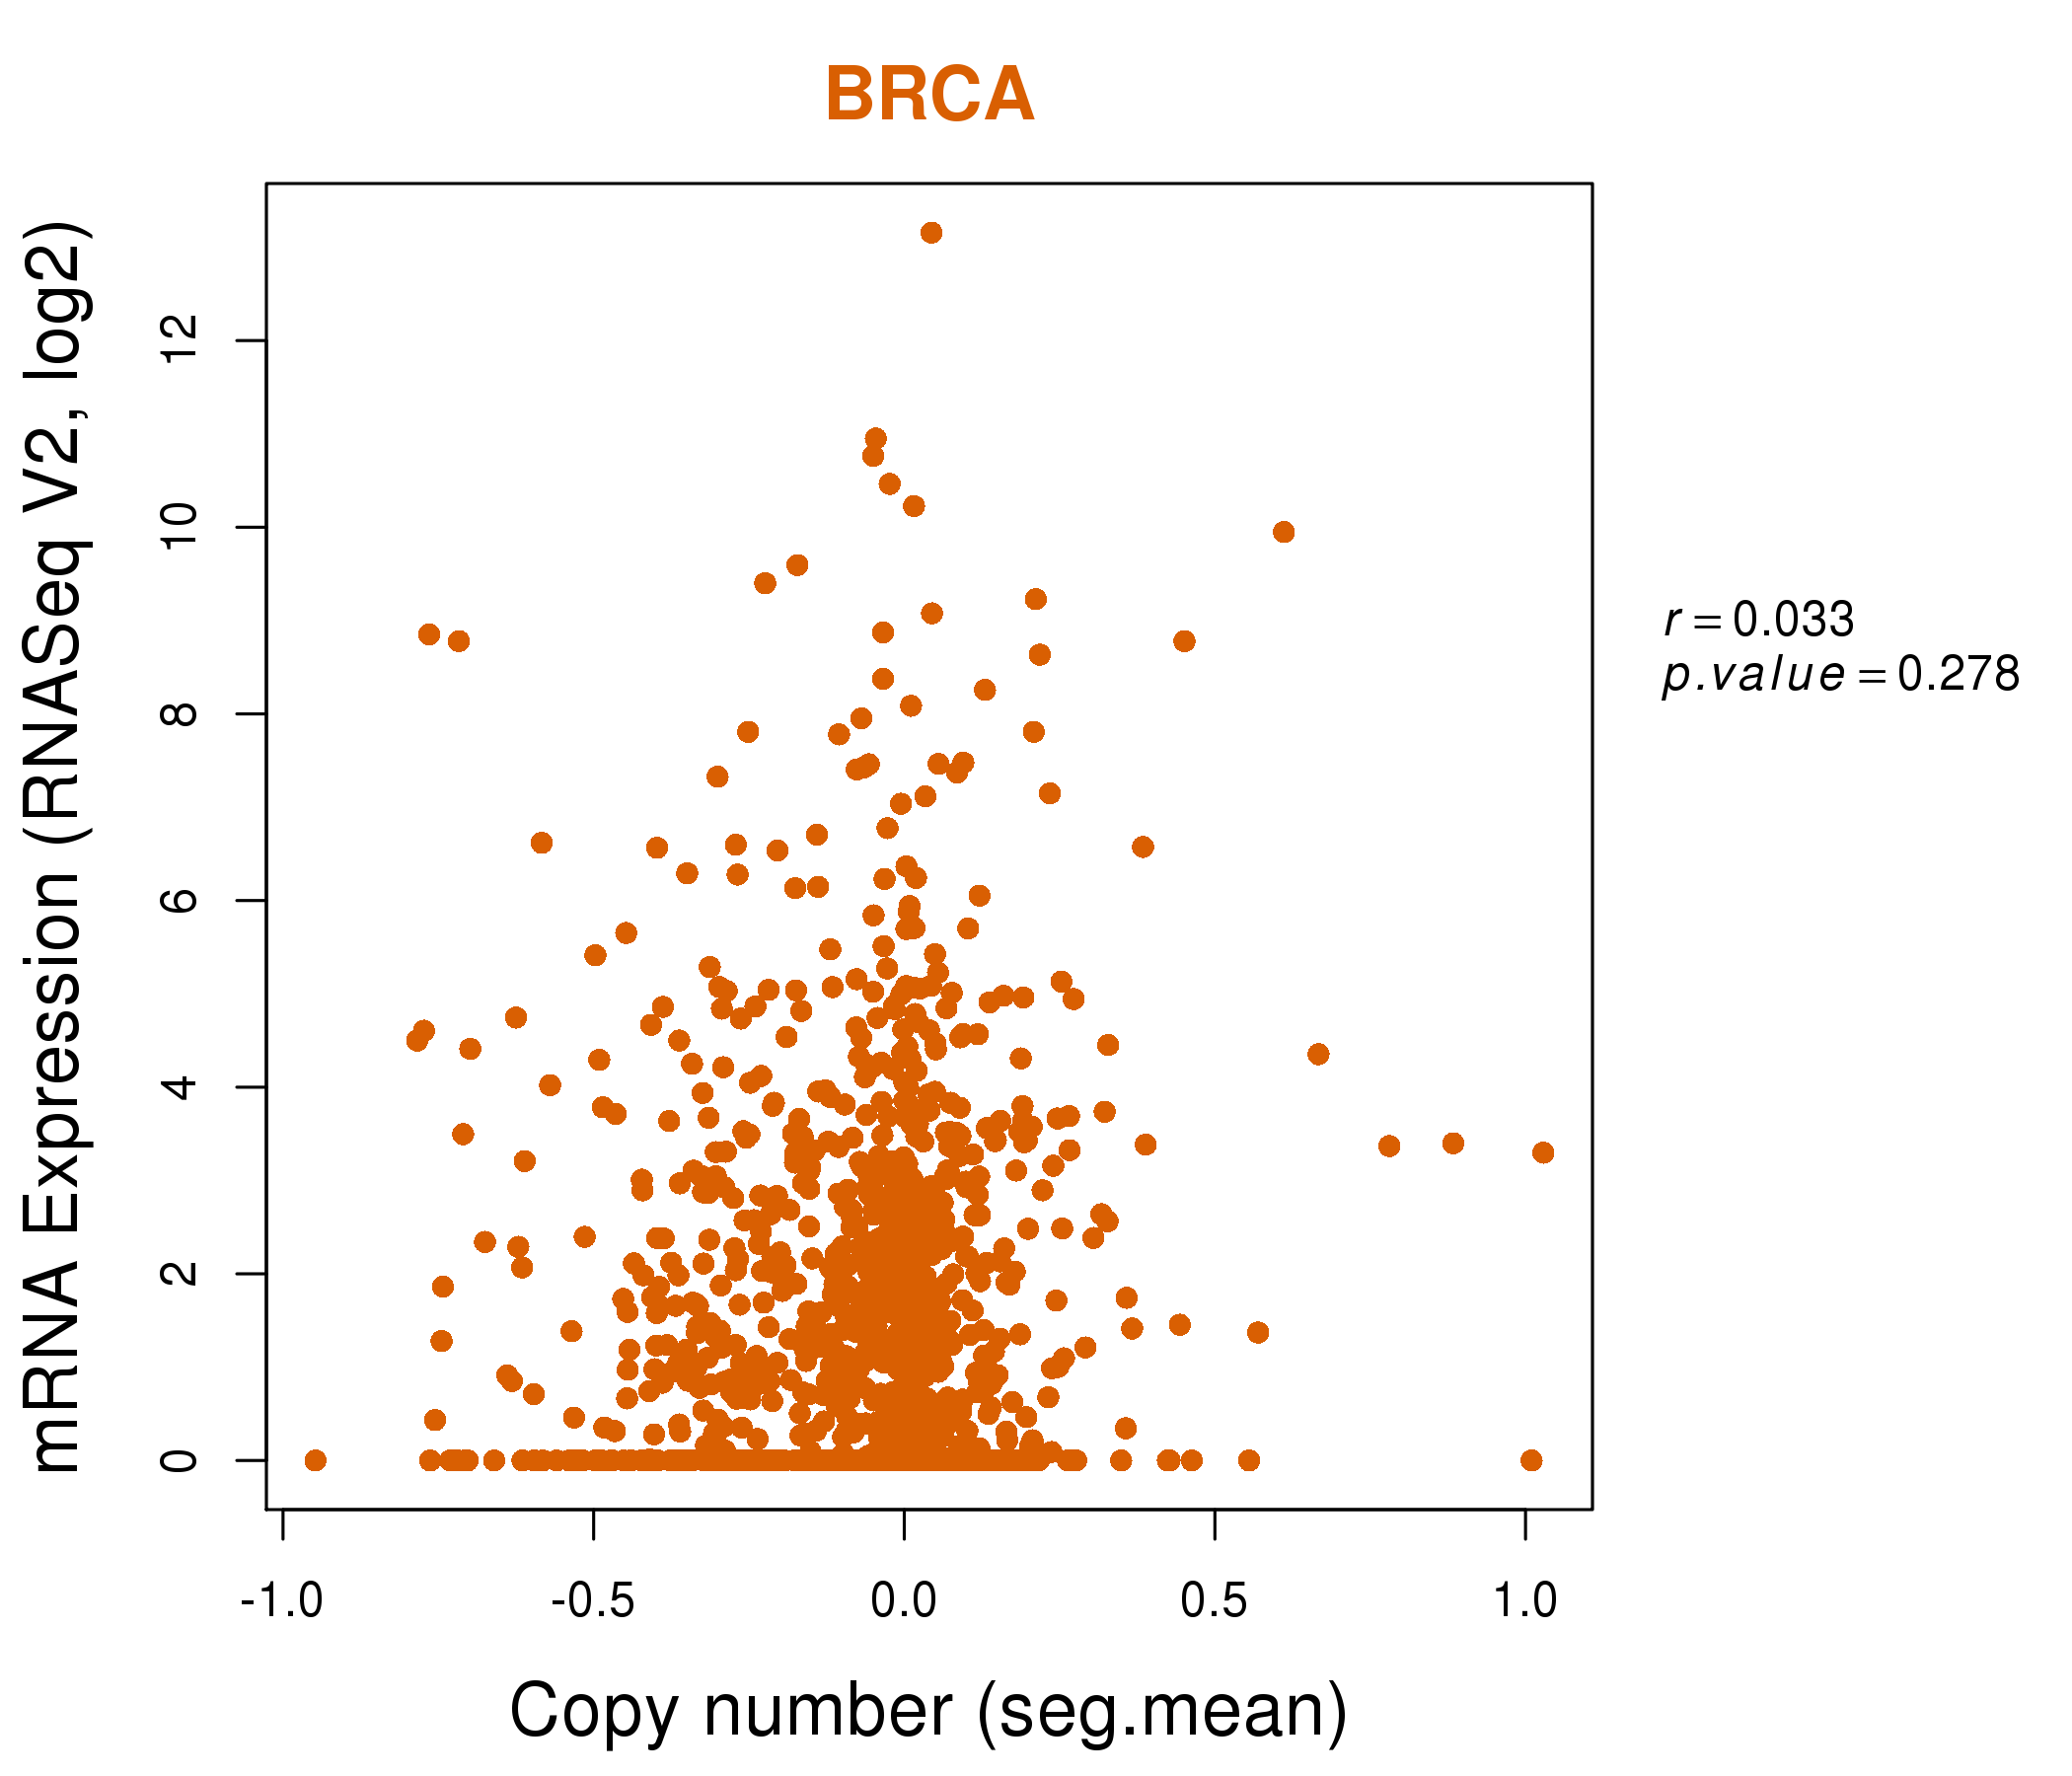
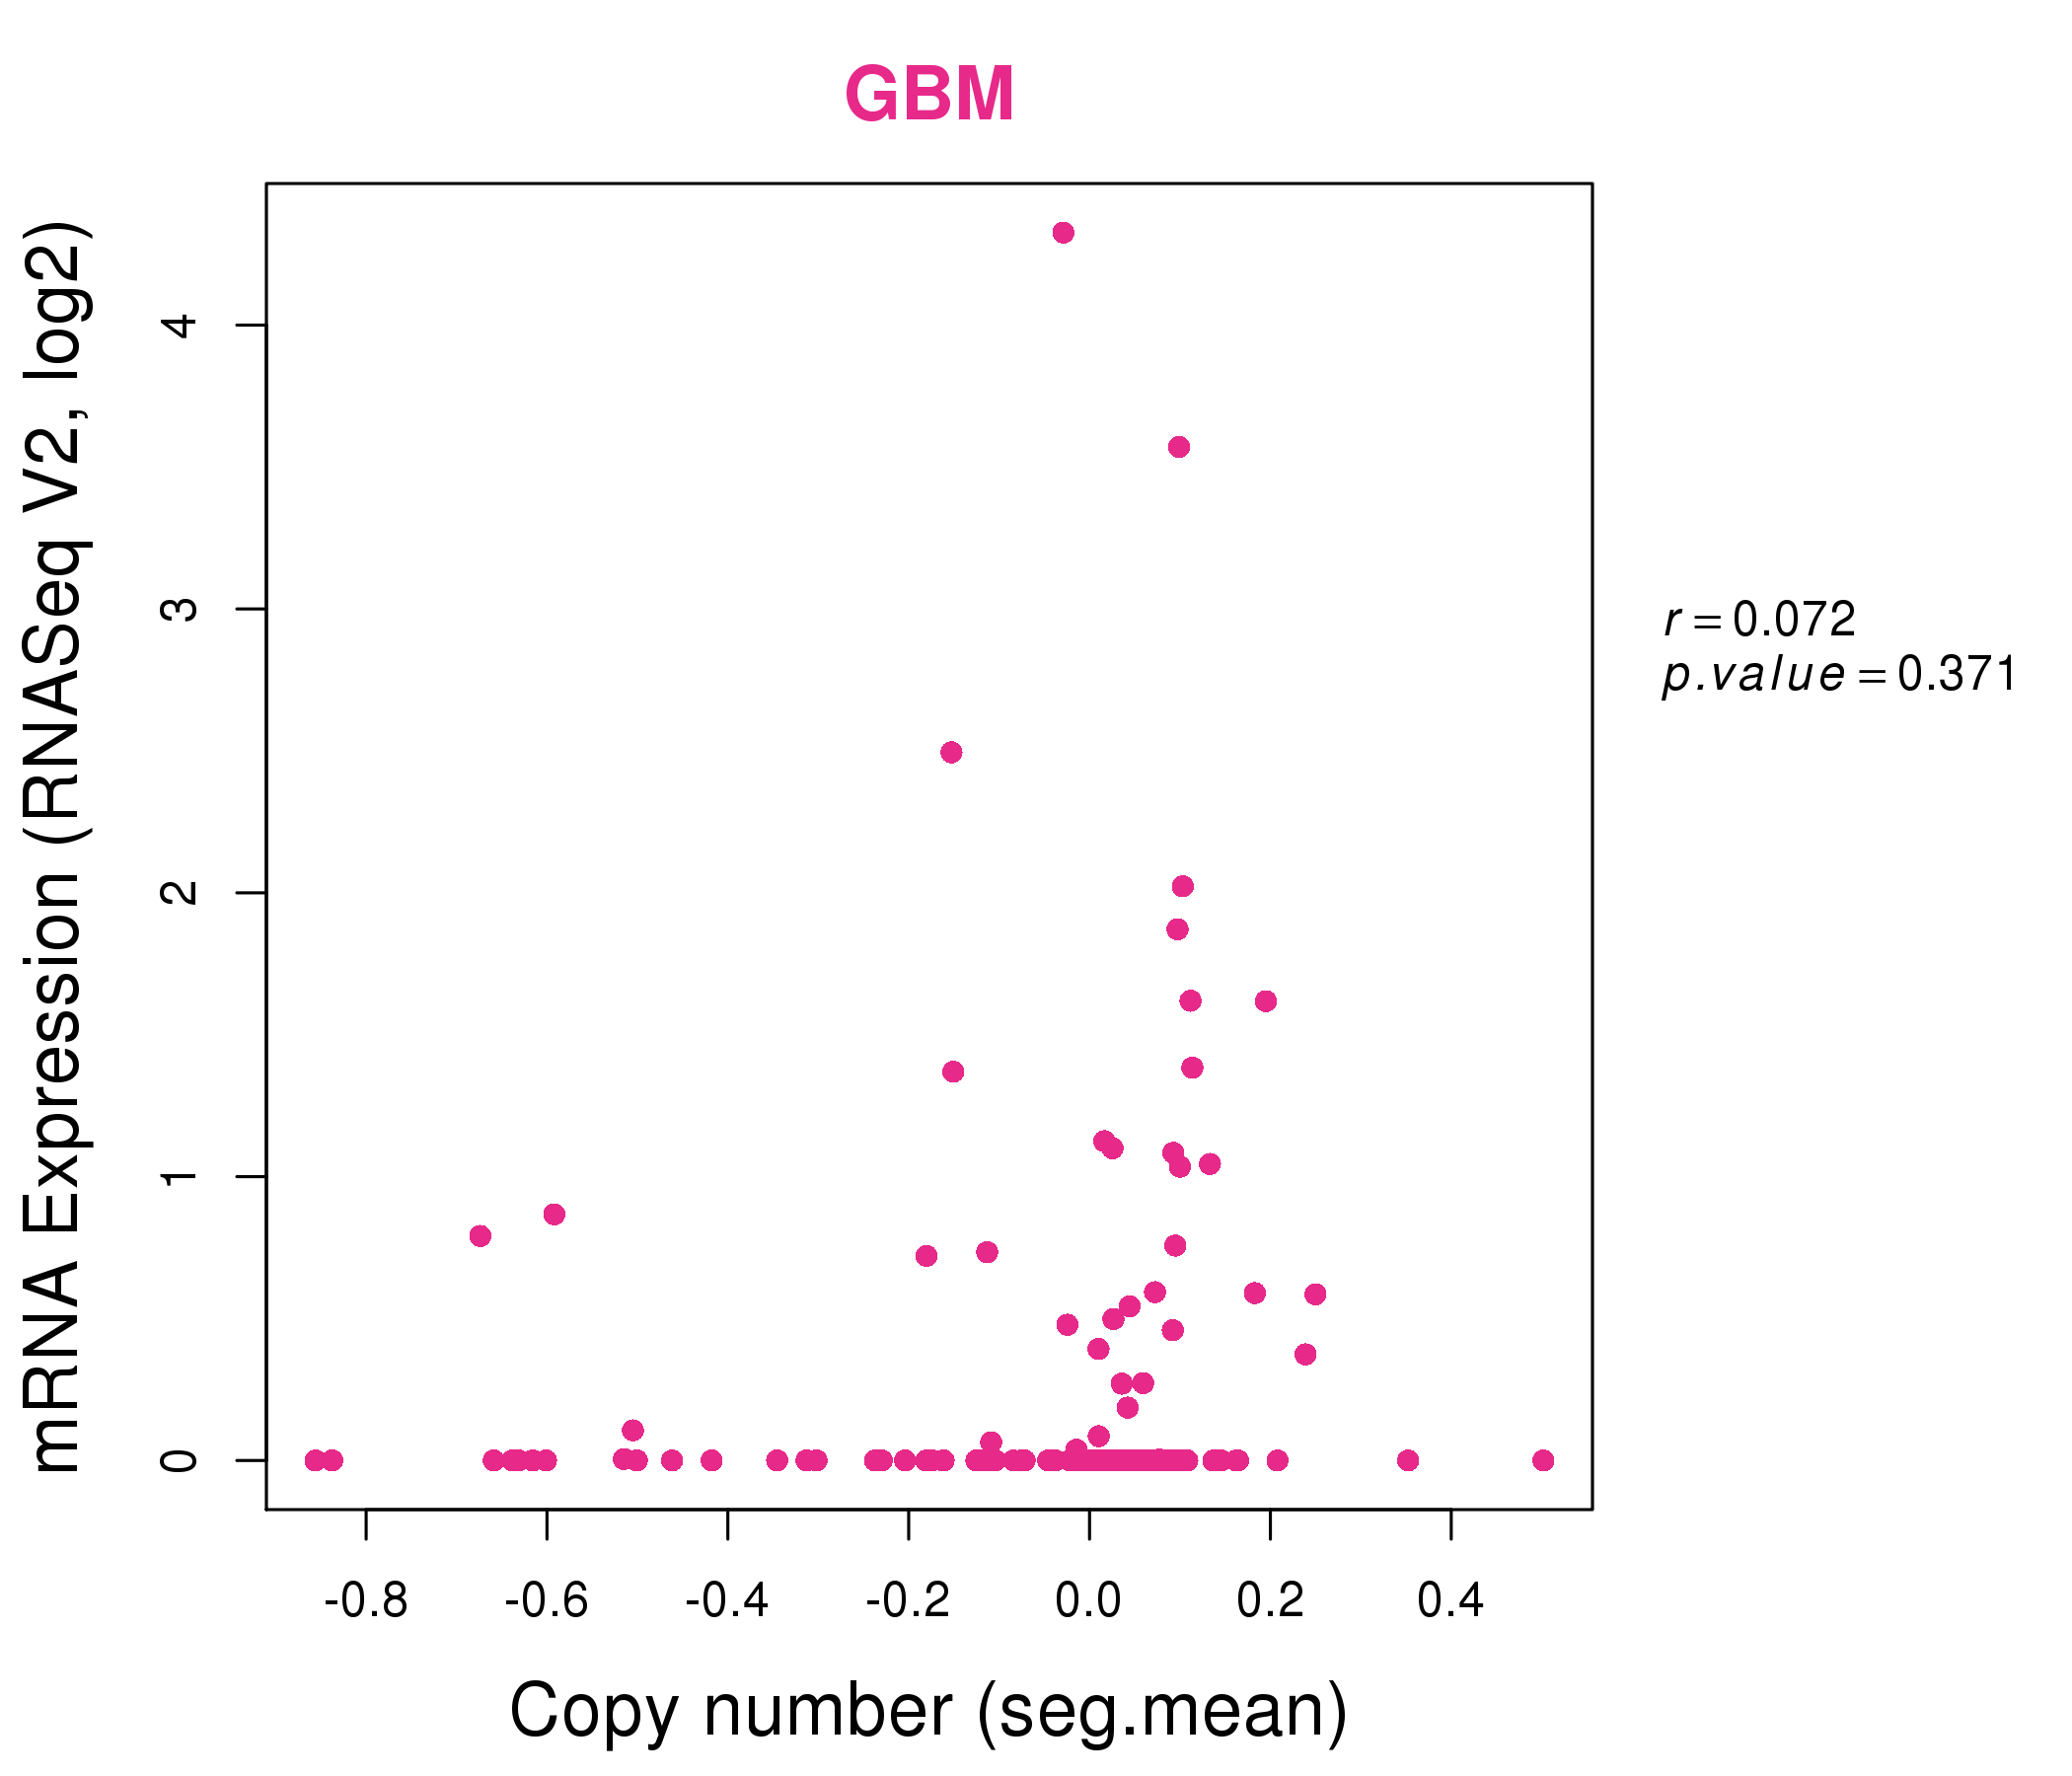
| * This plots show the correlation between CNV and gene expression. |
: Open all plots for all cancer types
 |
|
 |
|
| Top |
| Gene-Gene Network Information |
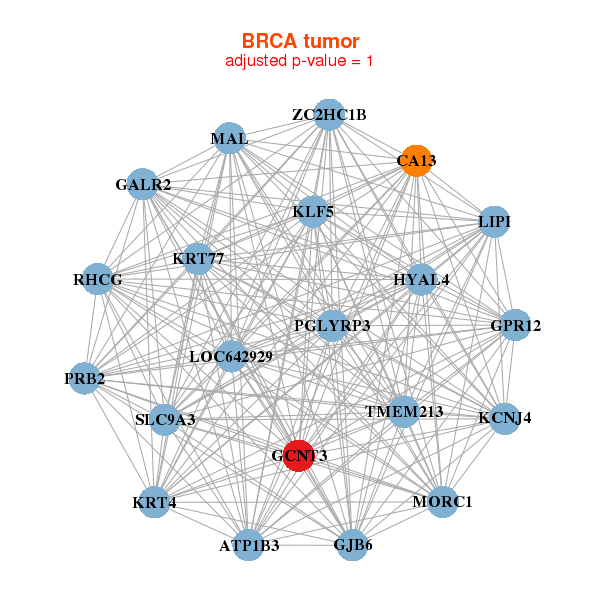
| * Co-Expression network figures were drawn using R package igraph. Only the top 20 genes with the highest correlations were shown. Red circle: input gene, orange circle: cell metabolism gene, sky circle: other gene |
: Open all plots for all cancer types
 |
|
| ATP1B3,ZC2HC1B,CA13,GALR2,GCNT3,GJB6,GPR12, HYAL4,KCNJ4,KLF5,KRT4,KRT77,LIPI,LOC642929, MAL,MORC1,PGLYRP3,PRB2,RHCG,SLC9A3,TMEM213 | ANXA10,APOH,CTSE,GCNT3,GKN2,HKDC1,IGF2BP1, KRTAP13-1,MAGEA4,NAPSA,NKX2-1,PAEP,BPIFA1,PSAPL1, SCGB3A2,SFTA3,SFTPB,SFTPC,SLC26A9,TM4SF5,UGT1A10 |
 |
|
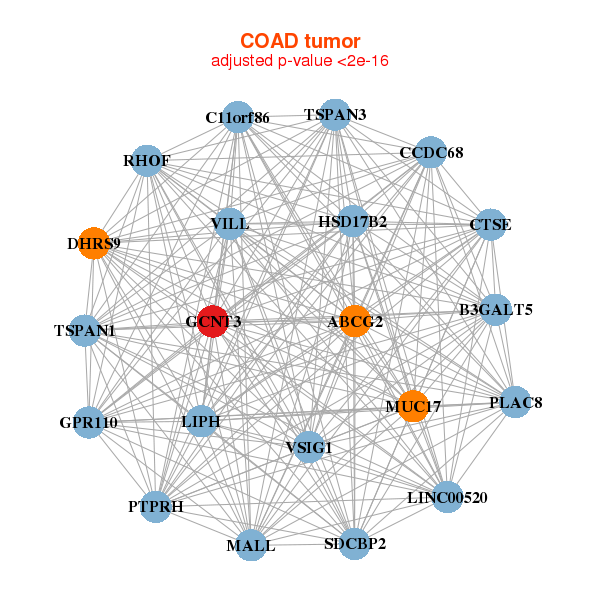
| ABCG2,B3GALT5,C11orf86,LINC00520,CCDC68,CTSE,DHRS9, GCNT3,GPR110,HSD17B2,LIPH,MALL,MUC17,PLAC8, PTPRH,RHOF,SDCBP2,TSPAN1,TSPAN3,VILL,VSIG1 | ABHD3,ATP1B3,C5orf30,CAB39,CCDC68,CEACAM1,CEACAM5, EPS8,ABHD17C,GCNT3,GNA13,MYL12A,PIP4K2C,PIP5K1B, PLAC8,SLC26A3,SPATS2L,STK24,STX3,TSPAN1,UGP2 |
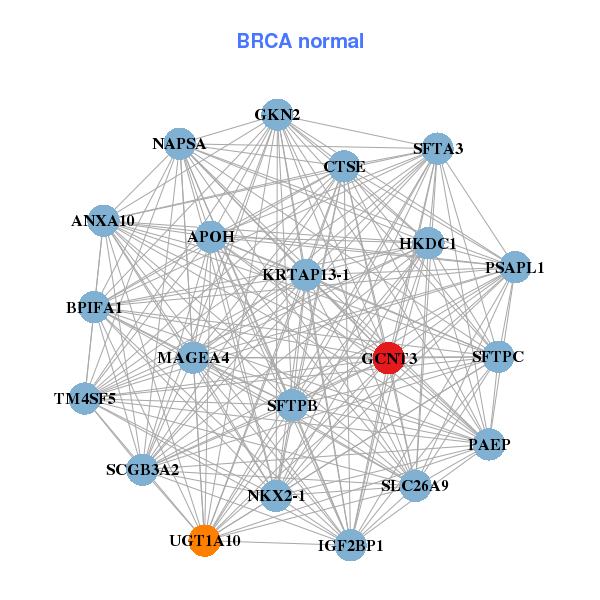
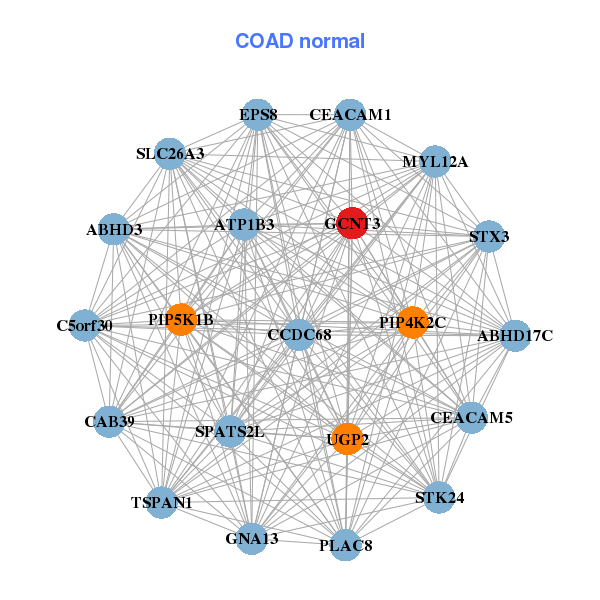
| * Co-Expression network figures were drawn using R package igraph. Only the top 20 genes with the highest correlations were shown. Red circle: input gene, orange circle: cell metabolism gene, sky circle: other gene |
: Open all plots for all cancer types
| Top |
: Open all interacting genes' information including KEGG pathway for all interacting genes from DAVID
| Top |
| Pharmacological Information for GCNT3 |
| There's no related Drug. |
| Top |
| Cross referenced IDs for GCNT3 |
| * We obtained these cross-references from Uniprot database. It covers 150 different DBs, 18 categories. http://www.uniprot.org/help/cross_references_section |
: Open all cross reference information
|
Copyright © 2016-Present - The Univsersity of Texas Health Science Center at Houston @ |