|
||||||||||||||||||||
| |
| Phenotypic Information (metabolism pathway, cancer, disease, phenome) |
| |
| |
| Gene-Gene Network Information: Co-Expression Network, Interacting Genes & KEGG |
| |
|


| Gene Summary for LDHAL6B |
| Top |
| Phenotypic Information for LDHAL6B(metabolism pathway, cancer, disease, phenome) |
| Cancer | CGAP: LDHAL6B |
| Familial Cancer Database: LDHAL6B | |
| * This gene is included in those cancer gene databases. |
|
|
|
|
|
|
| ||||||||||||||
Oncogene 1 | Significant driver gene in | |||||||||||||||||||
| cf) number; DB name 1 Oncogene; http://nar.oxfordjournals.org/content/35/suppl_1/D721.long, 2 Tumor Suppressor gene; https://bioinfo.uth.edu/TSGene/, 3 Cancer Gene Census; http://www.nature.com/nrc/journal/v4/n3/abs/nrc1299.html, 4 CancerGenes; http://nar.oxfordjournals.org/content/35/suppl_1/D721.long, 5 Network of Cancer Gene; http://ncg.kcl.ac.uk/index.php, 1Therapeutic Vulnerabilities in Cancer; http://cbio.mskcc.org/cancergenomics/statius/ |
| KEGG_GLYCOLYSIS_GLUCONEOGENESIS KEGG_CYSTEINE_AND_METHIONINE_METABOLISM KEGG_PYRUVATE_METABOLISM KEGG_PROPANOATE_METABOLISM | |
| Mutations for LDHAL6B |
| * Under tables are showing count per each tissue to give us broad intuition about tissue specific mutation patterns.You can go to the detailed page for each mutation database's web site. |
| There's no structural variation information in COSMIC data for this gene. |
| * From mRNA Sanger sequences, Chitars2.0 arranged chimeric transcripts. This table shows LDHAL6B related fusion information. |
| ID | Head Gene | Tail Gene | Accession | Gene_a | qStart_a | qEnd_a | Chromosome_a | tStart_a | tEnd_a | Gene_a | qStart_a | qEnd_a | Chromosome_a | tStart_a | tEnd_a |
| Top |
| There's no copy number variation information in COSMIC data for this gene. |
| Top |
|
 |
| Top |
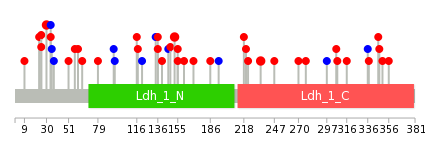
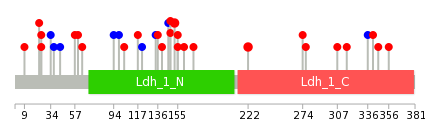
| Stat. for Non-Synonymous SNVs (# total SNVs=25) | (# total SNVs=7) |
 |  |
(# total SNVs=1) | (# total SNVs=0) |
 |
| Top |
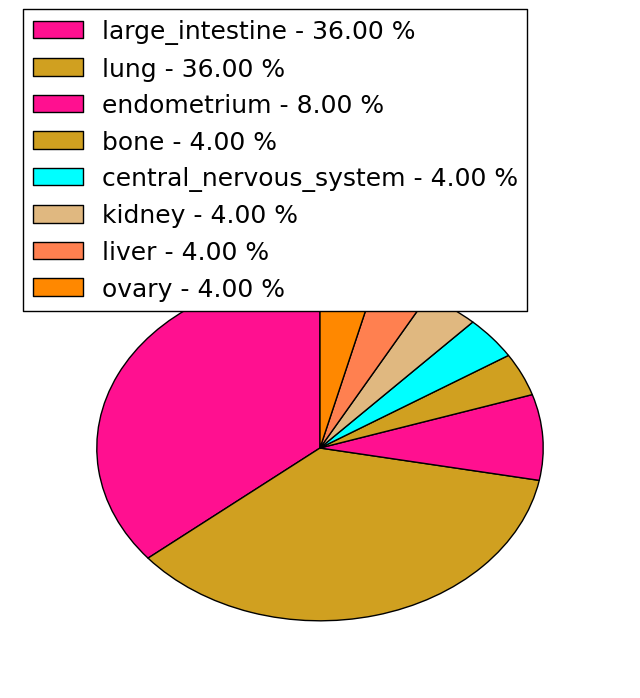
| * When you move the cursor on each content, you can see more deailed mutation information on the Tooltip. Those are primary_site,primary_histology,mutation(aa),pubmedID. |
| GRCh37 position | Mutation(aa) | Unique sampleID count |
| chr15:59499212-59499212 | p.G25R | 2 |
| chr15:59499593-59499593 | p.G152R | 2 |
| chr15:59499840-59499840 | p.C234F | 2 |
| chr15:59499228-59499228 | p.P30L | 2 |
| chr15:59499541-59499541 | p.V134V | 1 |
| chr15:59499695-59499695 | p.S186T | 1 |
| chr15:59500030-59500030 | p.T297T | 1 |
| chr15:59499291-59499291 | p.A51V | 1 |
| chr15:59499545-59499545 | p.A136T | 1 |
| chr15:59499721-59499721 | p.Y194Y | 1 |
| Top |
|
 |
| Point Mutation/ Tissue ID | 1 | 2 | 3 | 4 | 5 | 6 | 7 | 8 | 9 | 10 | 11 | 12 | 13 | 14 | 15 | 16 | 17 | 18 | 19 | 20 |
| # sample | 1 | 7 | 1 | 3 | 4 | 2 | 1 | 7 | 4 | 5 | ||||||||||
| # mutation | 1 | 7 | 1 | 4 | 4 | 2 | 1 | 6 | 5 | 5 | ||||||||||
| nonsynonymous SNV | 1 | 6 | 1 | 4 | 2 | 1 | 1 | 5 | 4 | 2 | ||||||||||
| synonymous SNV | 1 | 2 | 1 | 1 | 1 | 3 |
| cf) Tissue ID; Tissue type (1; BLCA[Bladder Urothelial Carcinoma], 2; BRCA[Breast invasive carcinoma], 3; CESC[Cervical squamous cell carcinoma and endocervical adenocarcinoma], 4; COAD[Colon adenocarcinoma], 5; GBM[Glioblastoma multiforme], 6; Glioma Low Grade, 7; HNSC[Head and Neck squamous cell carcinoma], 8; KICH[Kidney Chromophobe], 9; KIRC[Kidney renal clear cell carcinoma], 10; KIRP[Kidney renal papillary cell carcinoma], 11; LAML[Acute Myeloid Leukemia], 12; LUAD[Lung adenocarcinoma], 13; LUSC[Lung squamous cell carcinoma], 14; OV[Ovarian serous cystadenocarcinoma ], 15; PAAD[Pancreatic adenocarcinoma], 16; PRAD[Prostate adenocarcinoma], 17; SKCM[Skin Cutaneous Melanoma], 18:STAD[Stomach adenocarcinoma], 19:THCA[Thyroid carcinoma], 20:UCEC[Uterine Corpus Endometrial Carcinoma]) |
| Top |
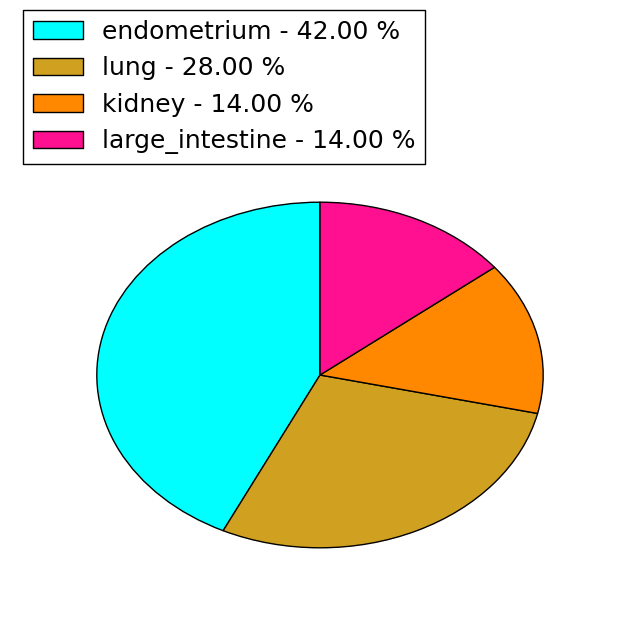
| * We represented just top 10 SNVs. When you move the cursor on each content, you can see more deailed mutation information on the Tooltip. Those are primary_site, primary_histology, mutation(aa), pubmedID. |
| Genomic Position | Mutation(aa) | Unique sampleID count |
| chr15:59499582 | p.R148L | 2 |
| chr15:59499593 | p.G25R | 2 |
| chr15:59499212 | p.G152R | 2 |
| chr15:59499805 | p.L222F | 2 |
| chr15:59500147 | p.L316I | 1 |
| chr15:59499329 | p.G117D | 1 |
| chr15:59500161 | p.V336V | 1 |
| chr15:59499421 | p.T121T | 1 |
| chr15:59499602 | p.P341H | 1 |
| chr15:59500176 | p.V134V | 1 |
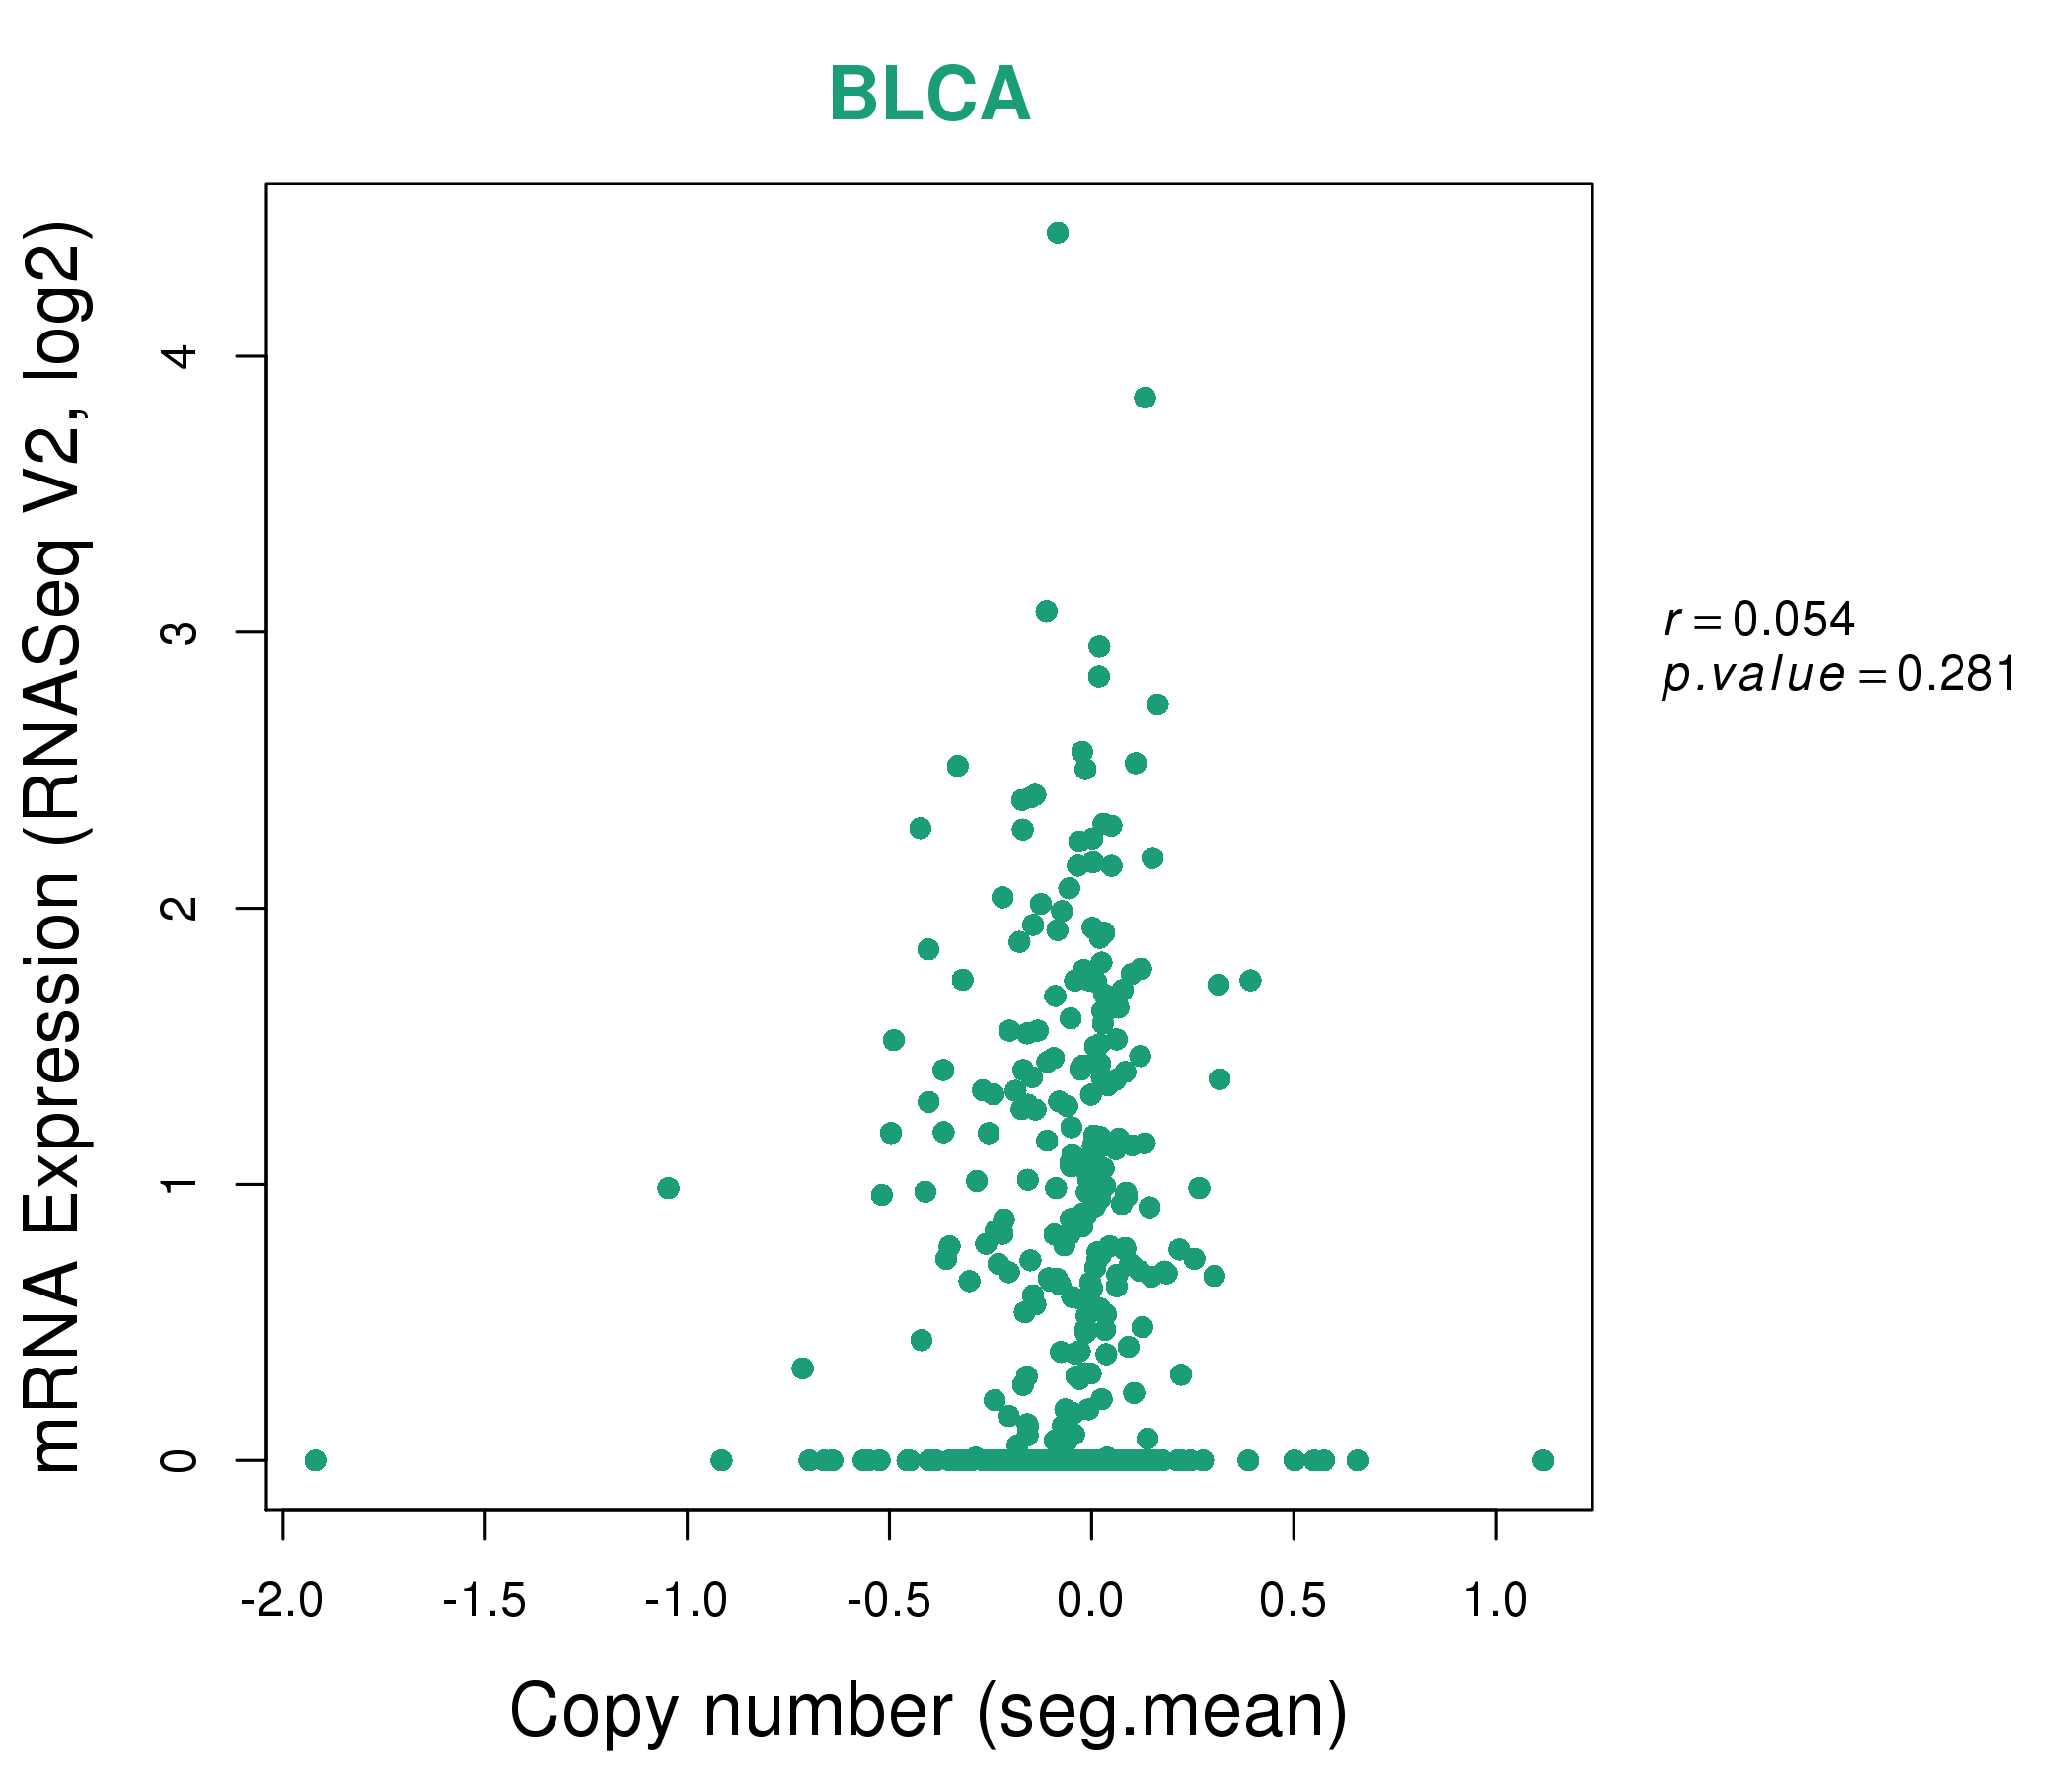
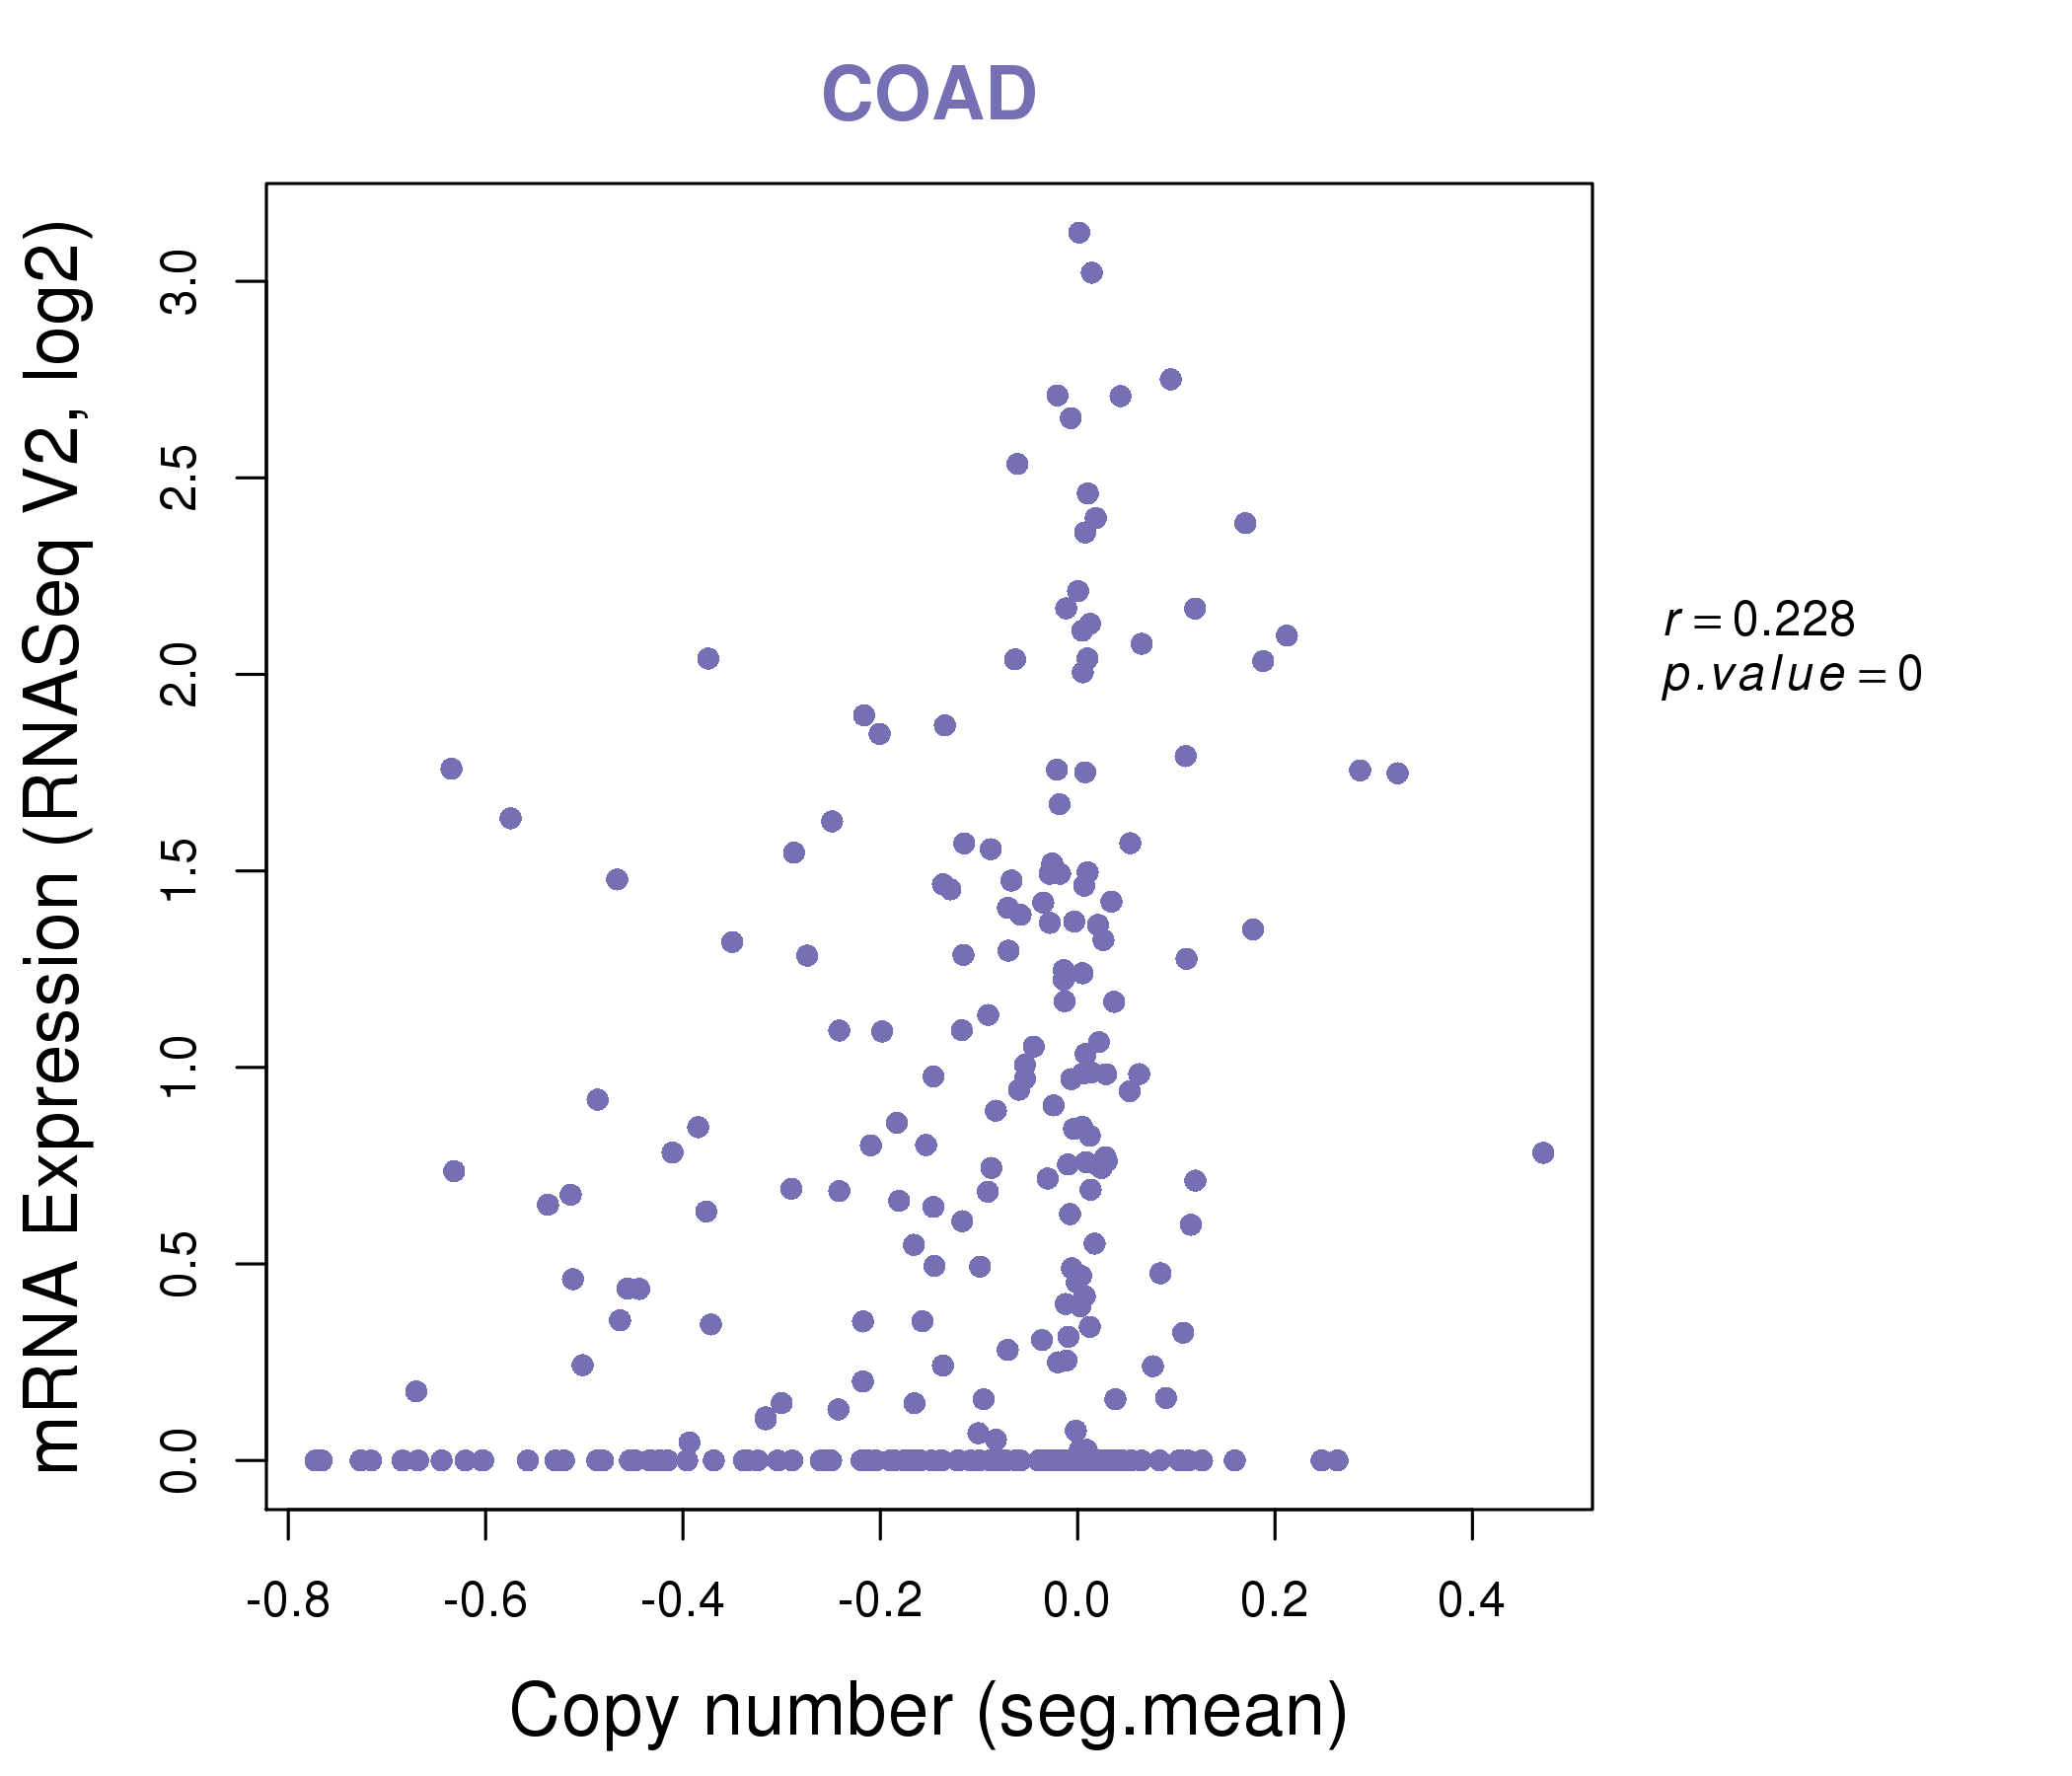
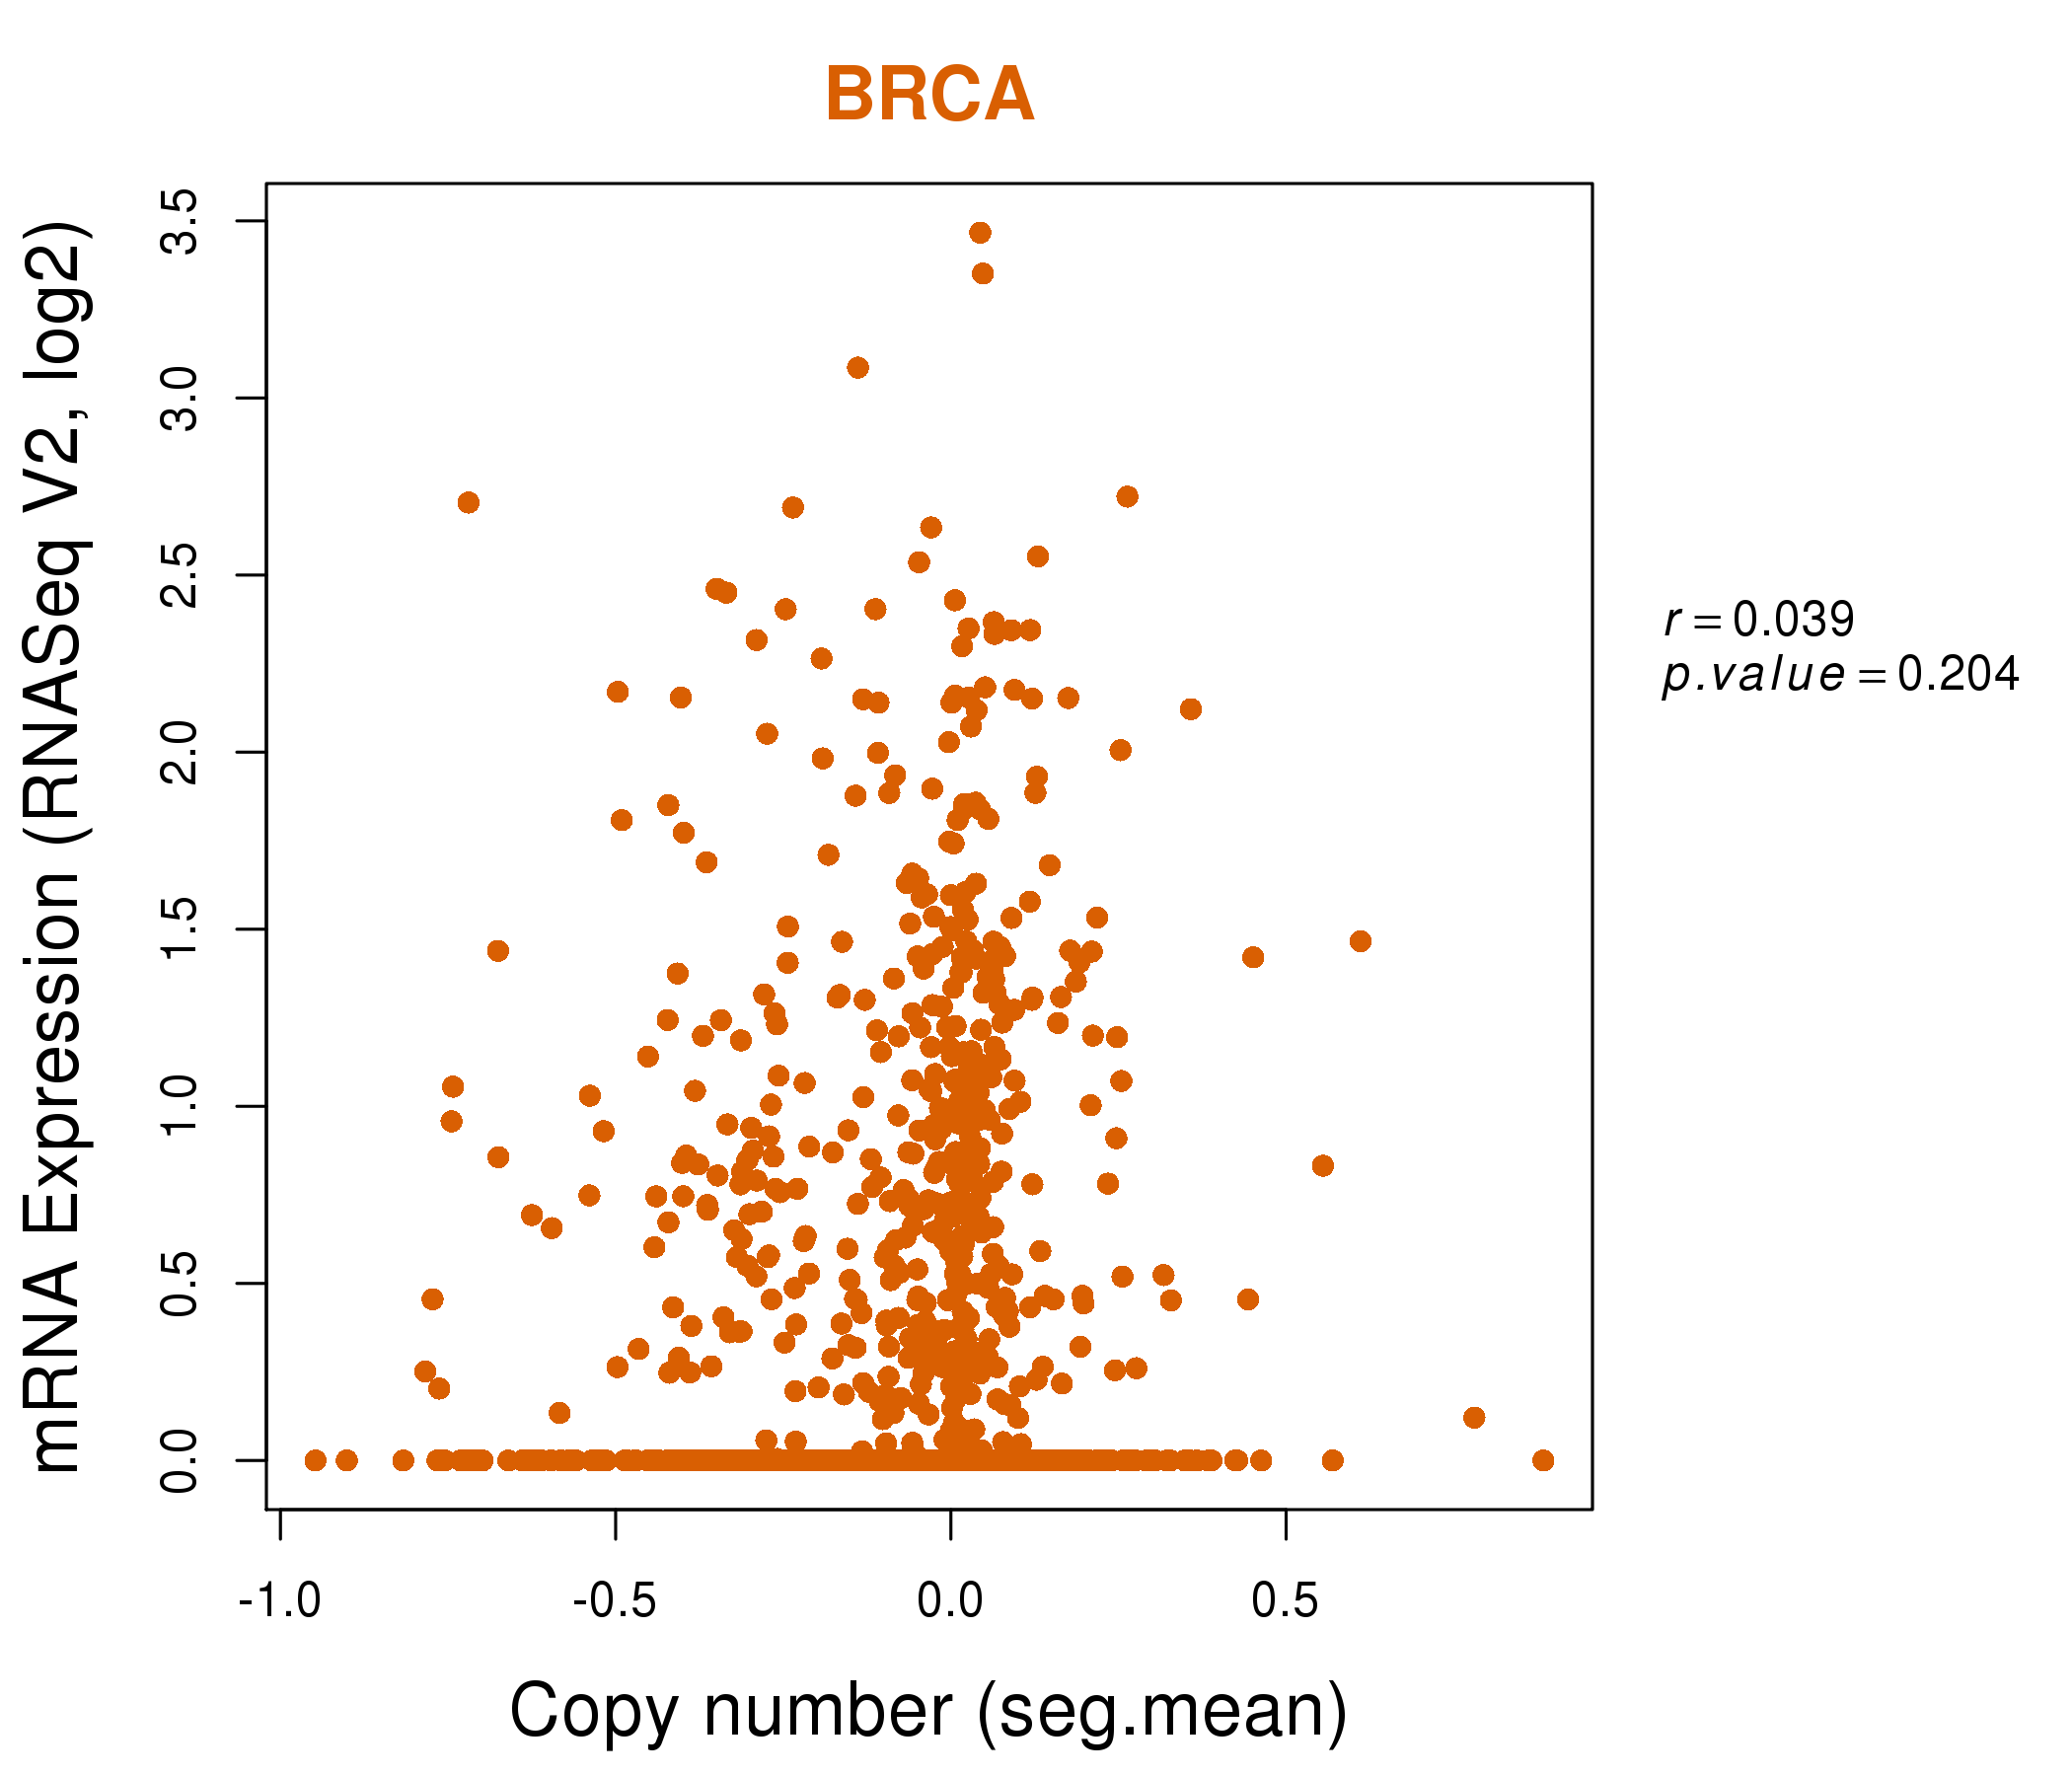
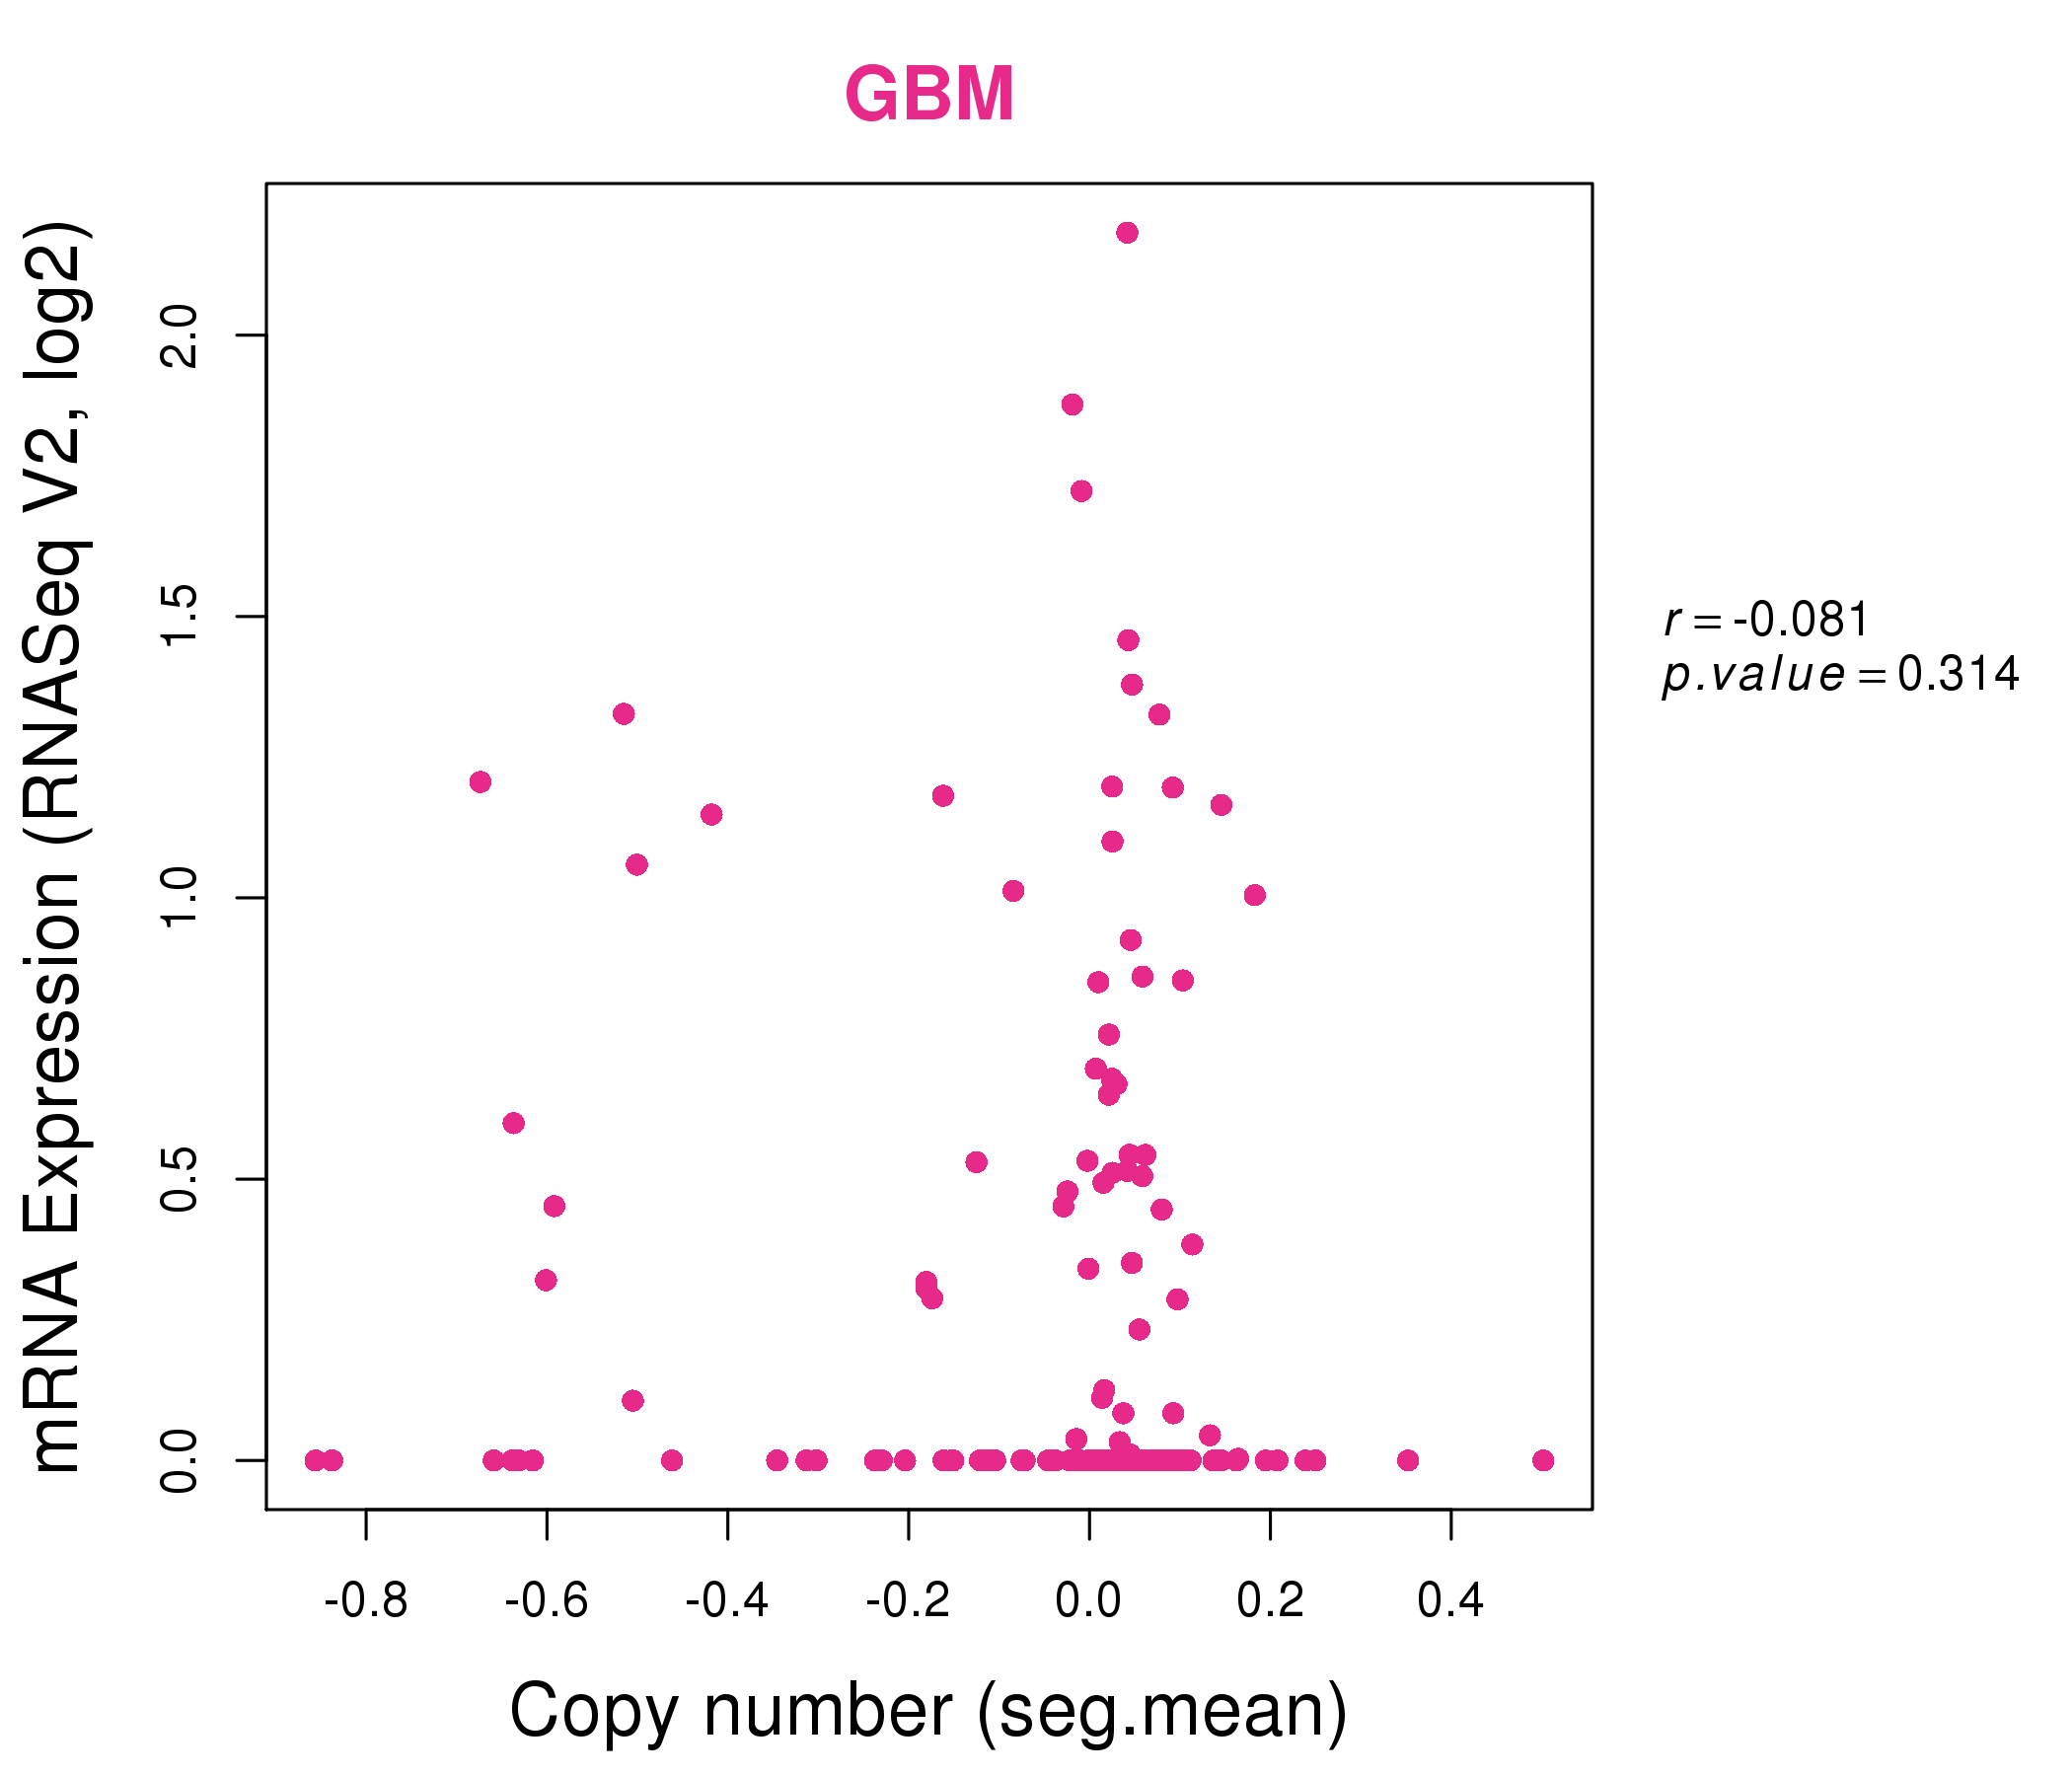
| * Copy number data were extracted from TCGA using R package TCGA-Assembler. The URLs of all public data files on TCGA DCC data server were gathered on Jan-05-2015. Function ProcessCNAData in TCGA-Assembler package was used to obtain gene-level copy number value which is calculated as the average copy number of the genomic region of a gene. |
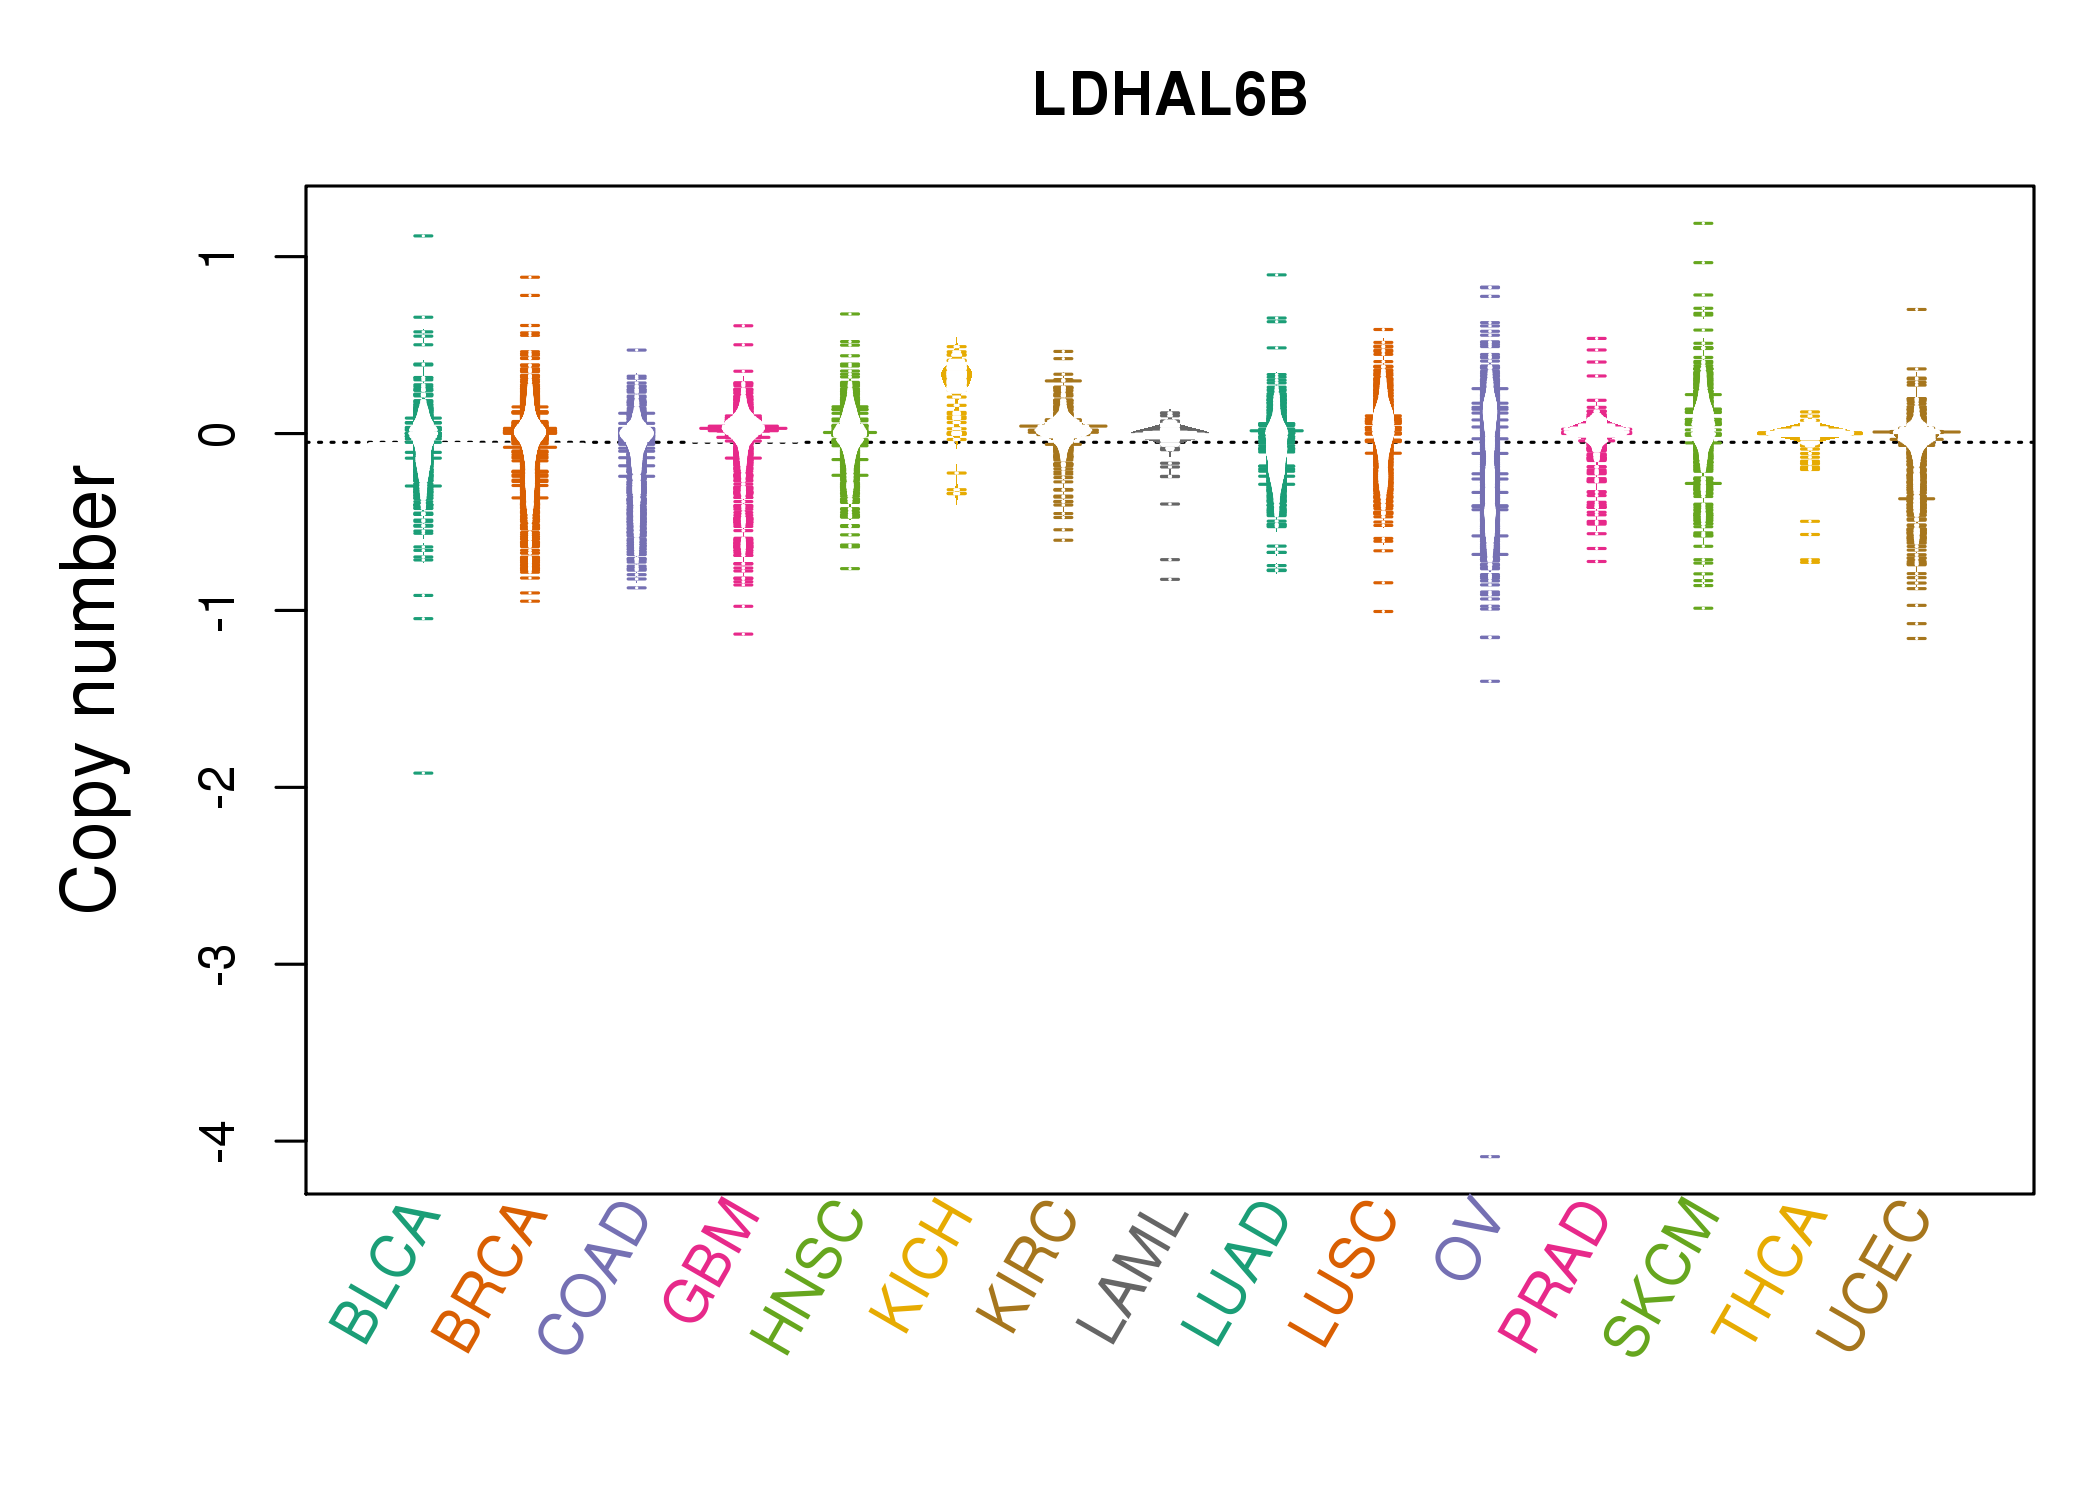 |
| cf) Tissue ID[Tissue type]: BLCA[Bladder Urothelial Carcinoma], BRCA[Breast invasive carcinoma], CESC[Cervical squamous cell carcinoma and endocervical adenocarcinoma], COAD[Colon adenocarcinoma], GBM[Glioblastoma multiforme], Glioma Low Grade, HNSC[Head and Neck squamous cell carcinoma], KICH[Kidney Chromophobe], KIRC[Kidney renal clear cell carcinoma], KIRP[Kidney renal papillary cell carcinoma], LAML[Acute Myeloid Leukemia], LUAD[Lung adenocarcinoma], LUSC[Lung squamous cell carcinoma], OV[Ovarian serous cystadenocarcinoma ], PAAD[Pancreatic adenocarcinoma], PRAD[Prostate adenocarcinoma], SKCM[Skin Cutaneous Melanoma], STAD[Stomach adenocarcinoma], THCA[Thyroid carcinoma], UCEC[Uterine Corpus Endometrial Carcinoma] |
| Top |
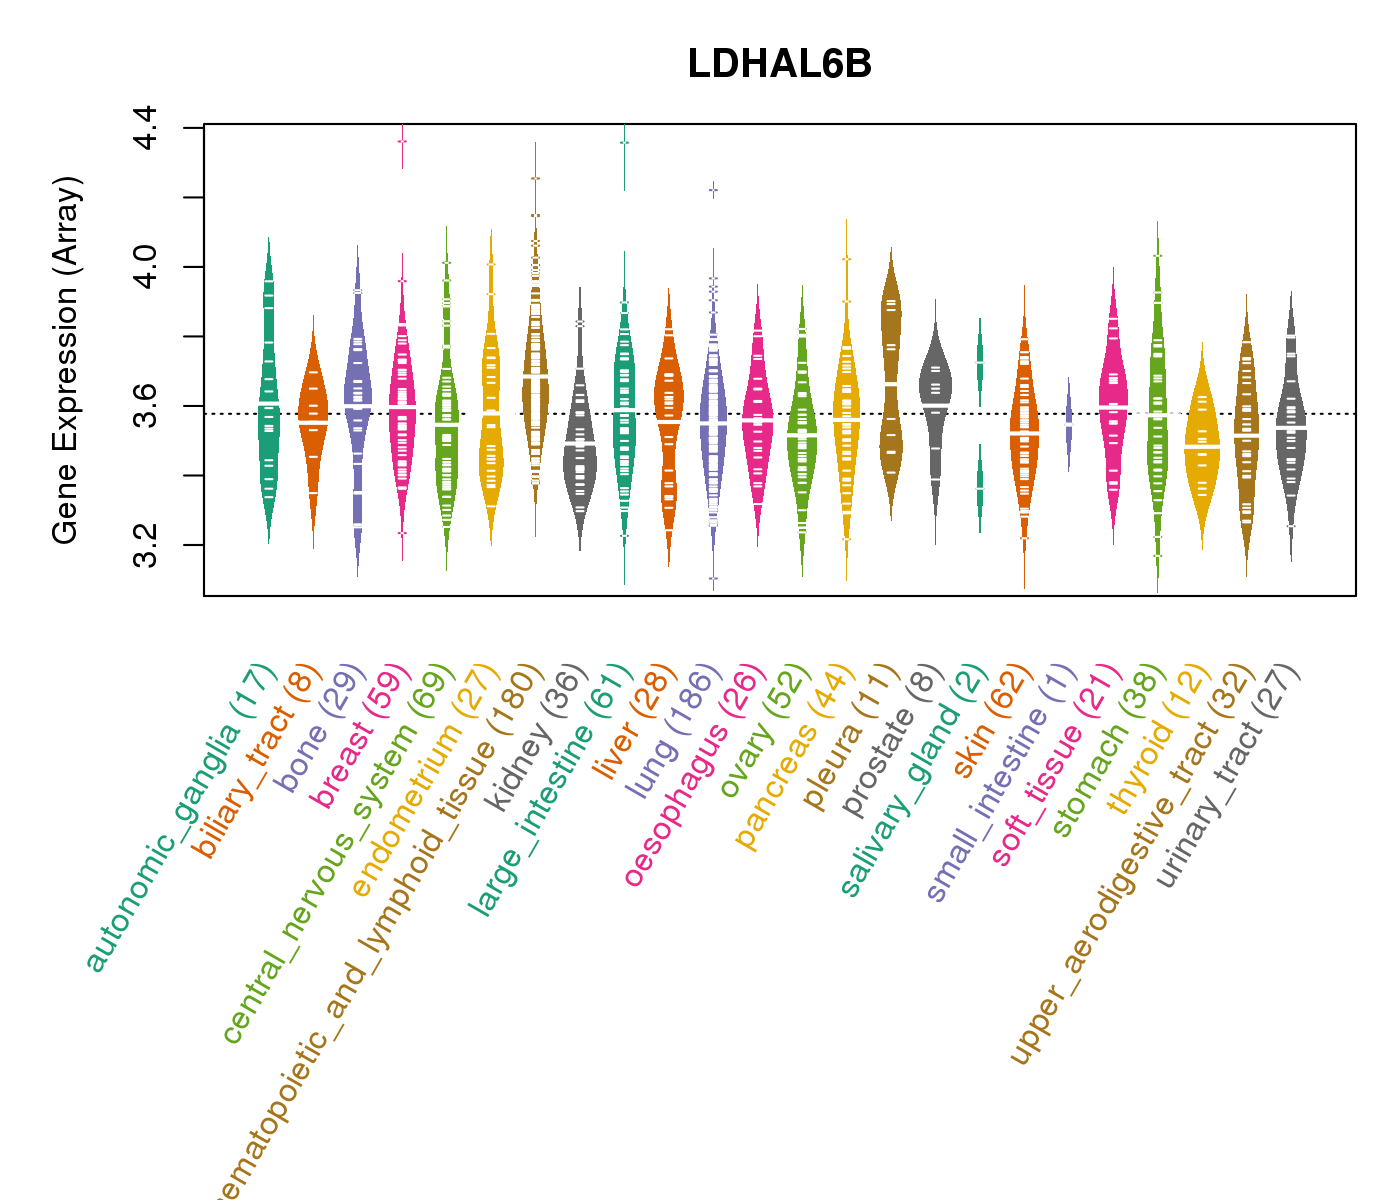
| Gene Expression for LDHAL6B |
| * CCLE gene expression data were extracted from CCLE_Expression_Entrez_2012-10-18.res: Gene-centric RMA-normalized mRNA expression data. |
 |
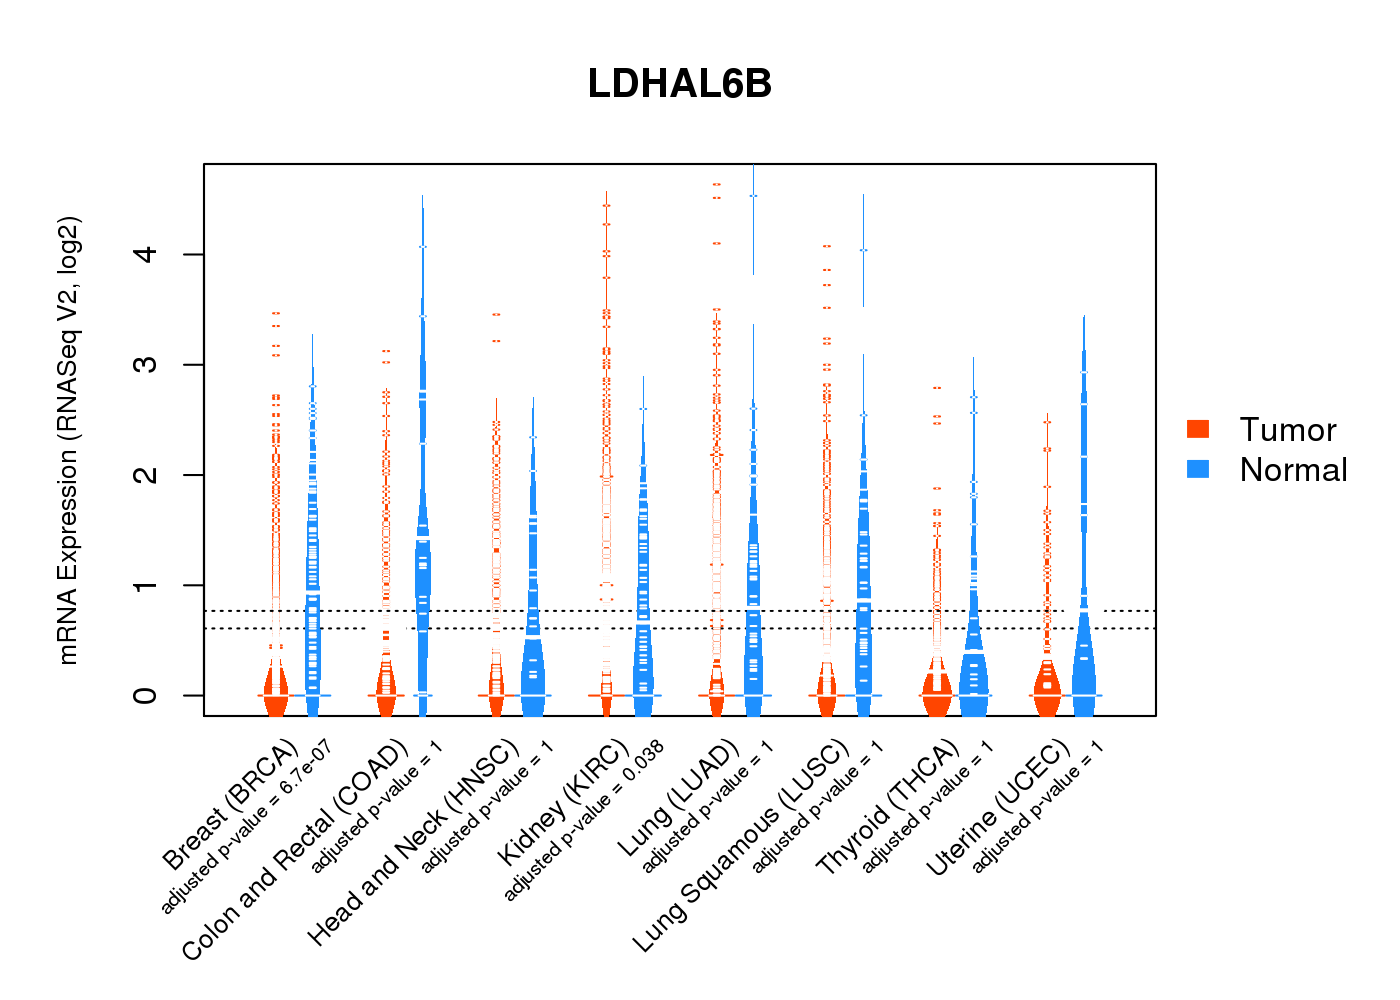
| * Normalized gene expression data of RNASeqV2 was extracted from TCGA using R package TCGA-Assembler. The URLs of all public data files on TCGA DCC data server were gathered at Jan-05-2015. Only eight cancer types have enough normal control samples for differential expression analysis. (t test, adjusted p<0.05 (using Benjamini-Hochberg FDR)) |
 |
| Top |
| * This plots show the correlation between CNV and gene expression. |
: Open all plots for all cancer types
 |
|
 |
|
| Top |
| Gene-Gene Network Information |
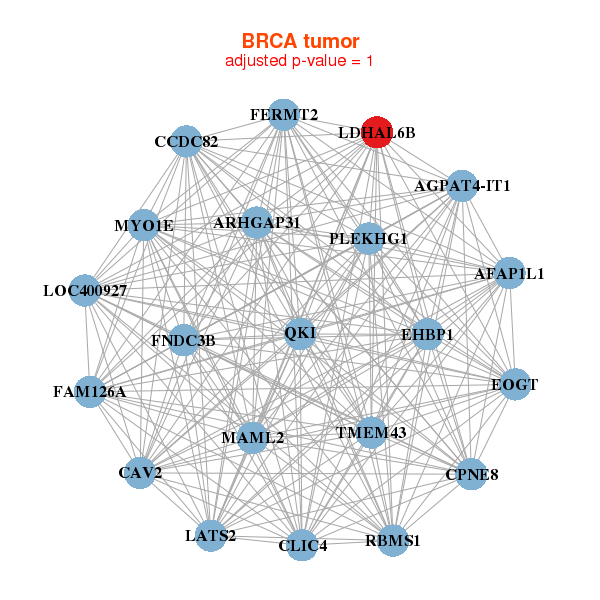
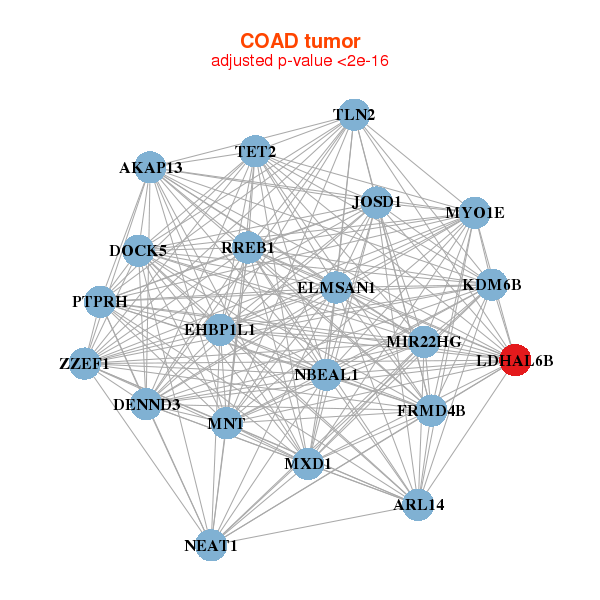
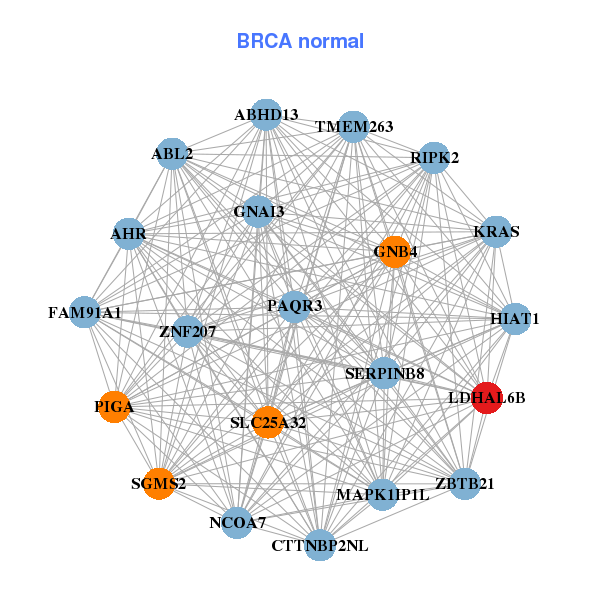
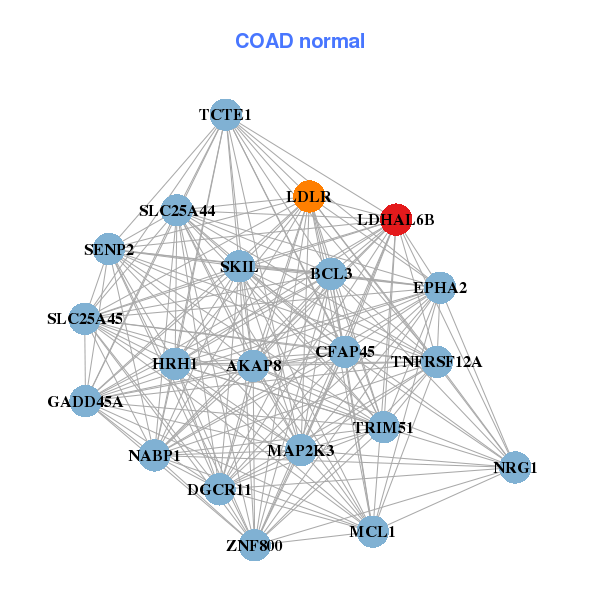
| * Co-Expression network figures were drawn using R package igraph. Only the top 20 genes with the highest correlations were shown. Red circle: input gene, orange circle: cell metabolism gene, sky circle: other gene |
: Open all plots for all cancer types
 |
| ||||
| AFAP1L1,ARHGAP31,EOGT,AGPAT4-IT1,CAV2,CCDC82,CLIC4, CPNE8,EHBP1,FAM126A,FERMT2,FNDC3B,LATS2,LDHAL6B, LOC400927,MAML2,MYO1E,PLEKHG1,QKI,RBMS1,TMEM43 | ABHD13,ABL2,AHR,TMEM263,CTTNBP2NL,FAM91A1,GNAI3, GNB4,HIAT1,KRAS,LDHAL6B,MAPK1IP1L,NCOA7,PAQR3, PIGA,RIPK2,SERPINB8,SGMS2,SLC25A32,ZNF207,ZBTB21 | ||||
 |
| ||||
| AKAP13,ARL14,ELMSAN1,MIR22HG,DENND3,DOCK5,EHBP1L1, FRMD4B,JOSD1,KDM6B,LDHAL6B,MNT,MXD1,MYO1E, NBEAL1,NEAT1,PTPRH,RREB1,TET2,TLN2,ZZEF1 | AKAP8,BCL3,CFAP45,DGCR11,EPHA2,GADD45A,HRH1, LDHAL6B,LDLR,MAP2K3,MCL1,NRG1,NABP1,SENP2, SKIL,SLC25A44,SLC25A45,TRIM51,TCTE1,TNFRSF12A,ZNF800 |
| * Co-Expression network figures were drawn using R package igraph. Only the top 20 genes with the highest correlations were shown. Red circle: input gene, orange circle: cell metabolism gene, sky circle: other gene |
: Open all plots for all cancer types
| Top |
: Open all interacting genes' information including KEGG pathway for all interacting genes from DAVID
| Top |
| Pharmacological Information for LDHAL6B |
| DB Category | DB Name | DB's ID and Url link |
| * Gene Centered Interaction Network. |
 |
| * Drug Centered Interaction Network. |
| DrugBank ID | Target Name | Drug Groups | Generic Name | Drug Centered Network | Drug Structure |
| DB00157 | lactate dehydrogenase A-like 6B | approved; nutraceutical | NADH |  |  |
| Top |
| Cross referenced IDs for LDHAL6B |
| * We obtained these cross-references from Uniprot database. It covers 150 different DBs, 18 categories. http://www.uniprot.org/help/cross_references_section |
: Open all cross reference information
|
Copyright © 2016-Present - The Univsersity of Texas Health Science Center at Houston @ |