|
||||||||||||||||||||
| |
| Phenotypic Information (metabolism pathway, cancer, disease, phenome) |
| |
| |
| Gene-Gene Network Information: Co-Expression Network, Interacting Genes & KEGG |
| |
|


| Gene Summary for G6PC3 |
| Basic gene info. | Gene symbol | G6PC3 |
| Gene name | glucose 6 phosphatase, catalytic, 3 | |
| Synonyms | SCN4|UGRP | |
| Cytomap | UCSC genome browser: 17q21.31 | |
| Genomic location | chr17 :42148097-42153712 | |
| Type of gene | protein-coding | |
| RefGenes | NM_138387.3, NR_028581.1,NR_028582.1, | |
| Ensembl id | ENSG00000141349 | |
| Description | G-6-Pase 3G6Pase 3G6Pase-betaglucose-6-phosphatase 3glucose-6-phosphatase catalytic subunit 3ubiquitous glucose-6-phosphatase catalytic subunit-related proteinubiquitously expressed G6Pase catalytic subunit-related protein | |
| Modification date | 20141207 | |
| dbXrefs | MIM : 611045 | |
| HGNC : HGNC | ||
| Ensembl : ENSG00000141349 | ||
| HPRD : 13556 | ||
| Vega : OTTHUMG00000181805 | ||
| Protein | UniProt: go to UniProt's Cross Reference DB Table | |
| Expression | CleanEX: HS_G6PC3 | |
| BioGPS: 92579 | ||
| Gene Expression Atlas: ENSG00000141349 | ||
| The Human Protein Atlas: ENSG00000141349 | ||
| Pathway | NCI Pathway Interaction Database: G6PC3 | |
| KEGG: G6PC3 | ||
| REACTOME: G6PC3 | ||
| ConsensusPathDB | ||
| Pathway Commons: G6PC3 | ||
| Metabolism | MetaCyc: G6PC3 | |
| HUMANCyc: G6PC3 | ||
| Regulation | Ensembl's Regulation: ENSG00000141349 | |
| miRBase: chr17 :42,148,097-42,153,712 | ||
| TargetScan: NM_138387 | ||
| cisRED: ENSG00000141349 | ||
| Context | iHOP: G6PC3 | |
| cancer metabolism search in PubMed: G6PC3 | ||
| UCL Cancer Institute: G6PC3 | ||
| Assigned class in ccmGDB | C | |
| Top |
| Phenotypic Information for G6PC3(metabolism pathway, cancer, disease, phenome) |
| Cancer | CGAP: G6PC3 |
| Familial Cancer Database: G6PC3 | |
| * This gene is included in those cancer gene databases. |
|
|
|
|
|
|
| ||||||||||||||
Oncogene 1 | Significant driver gene in | |||||||||||||||||||
| cf) number; DB name 1 Oncogene; http://nar.oxfordjournals.org/content/35/suppl_1/D721.long, 2 Tumor Suppressor gene; https://bioinfo.uth.edu/TSGene/, 3 Cancer Gene Census; http://www.nature.com/nrc/journal/v4/n3/abs/nrc1299.html, 4 CancerGenes; http://nar.oxfordjournals.org/content/35/suppl_1/D721.long, 5 Network of Cancer Gene; http://ncg.kcl.ac.uk/index.php, 1Therapeutic Vulnerabilities in Cancer; http://cbio.mskcc.org/cancergenomics/statius/ |
| REACTOME_METABOLISM_OF_CARBOHYDRATES | |
| OMIM | |
| Orphanet | |
| Disease | KEGG Disease: G6PC3 |
| MedGen: G6PC3 (Human Medical Genetics with Condition) | |
| ClinVar: G6PC3 | |
| Phenotype | MGI: G6PC3 (International Mouse Phenotyping Consortium) |
| PhenomicDB: G6PC3 | |
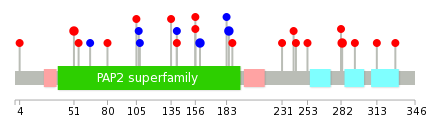
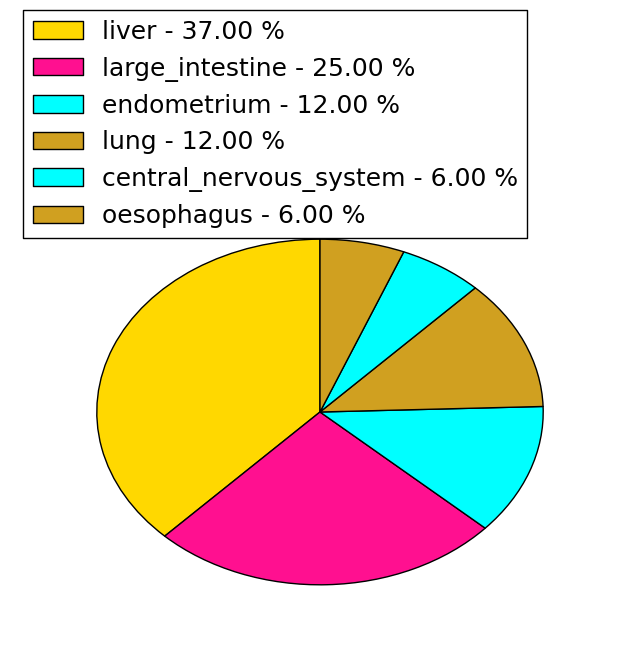
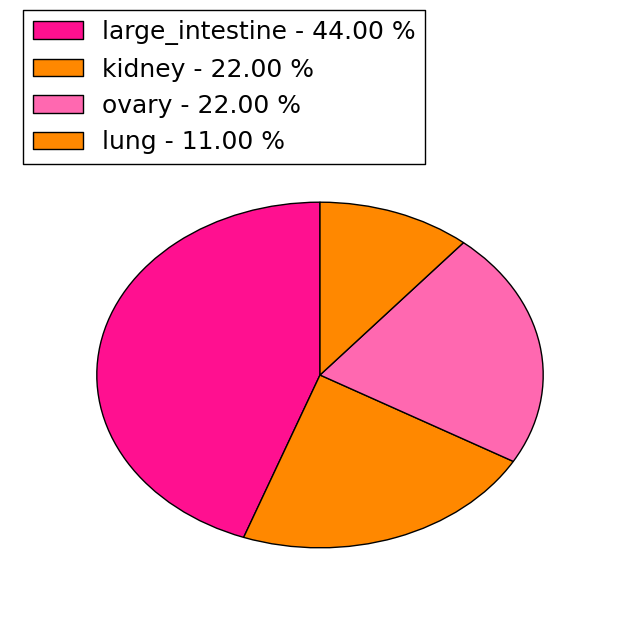
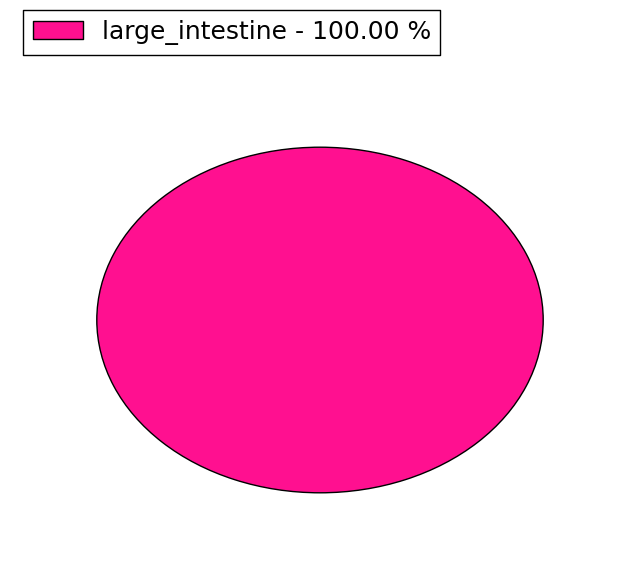
| Mutations for G6PC3 |
| * Under tables are showing count per each tissue to give us broad intuition about tissue specific mutation patterns.You can go to the detailed page for each mutation database's web site. |
| There's no structural variation information in COSMIC data for this gene. |
| * From mRNA Sanger sequences, Chitars2.0 arranged chimeric transcripts. This table shows G6PC3 related fusion information. |
| ID | Head Gene | Tail Gene | Accession | Gene_a | qStart_a | qEnd_a | Chromosome_a | tStart_a | tEnd_a | Gene_a | qStart_a | qEnd_a | Chromosome_a | tStart_a | tEnd_a |
| BP430643 | COTL1 | 4 | 208 | 16 | 84599590 | 84599794 | G6PC3 | 206 | 333 | 17 | 42153420 | 42153547 | |
| Top |
| There's no copy number variation information in COSMIC data for this gene. |
| Top |
|
 |
| Top |
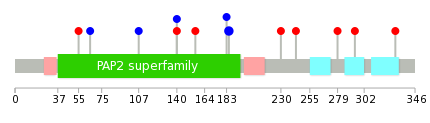
| Stat. for Non-Synonymous SNVs (# total SNVs=16) | (# total SNVs=9) |
 |  |
(# total SNVs=3) | (# total SNVs=0) |
 |
| Top |
| * When you move the cursor on each content, you can see more deailed mutation information on the Tooltip. Those are primary_site,primary_histology,mutation(aa),pubmedID. |
| GRCh37 position | Mutation(aa) | Unique sampleID count |
| chr17:42153276-42153276 | p.P304fs*20 | 2 |
| chr17:42148485-42148485 | p.R51H | 2 |
| chr17:42152400-42152400 | p.S160S | 2 |
| chr17:42153218-42153218 | p.K283R | 2 |
| chr17:42152695-42152695 | p.L185L | 1 |
| chr17:42151630-42151630 | p.G107G | 1 |
| chr17:42152697-42152697 | p.L185L | 1 |
| chr17:42153281-42153281 | p.P304fs*20 | 1 |
| chr17:42151633-42151633 | p.P108P | 1 |
| chr17:42152705-42152705 | p.P188L | 1 |
| Top |
|
 |
| Point Mutation/ Tissue ID | 1 | 2 | 3 | 4 | 5 | 6 | 7 | 8 | 9 | 10 | 11 | 12 | 13 | 14 | 15 | 16 | 17 | 18 | 19 | 20 |
| # sample | 4 | 1 | 2 | 1 | 1 | 2 | 1 | 1 | ||||||||||||
| # mutation | 4 | 1 | 2 | 1 | 1 | 2 | 1 | 1 | ||||||||||||
| nonsynonymous SNV | 1 | 1 | 2 | 1 | 1 | 1 | ||||||||||||||
| synonymous SNV | 3 | 1 | 2 |
| cf) Tissue ID; Tissue type (1; BLCA[Bladder Urothelial Carcinoma], 2; BRCA[Breast invasive carcinoma], 3; CESC[Cervical squamous cell carcinoma and endocervical adenocarcinoma], 4; COAD[Colon adenocarcinoma], 5; GBM[Glioblastoma multiforme], 6; Glioma Low Grade, 7; HNSC[Head and Neck squamous cell carcinoma], 8; KICH[Kidney Chromophobe], 9; KIRC[Kidney renal clear cell carcinoma], 10; KIRP[Kidney renal papillary cell carcinoma], 11; LAML[Acute Myeloid Leukemia], 12; LUAD[Lung adenocarcinoma], 13; LUSC[Lung squamous cell carcinoma], 14; OV[Ovarian serous cystadenocarcinoma ], 15; PAAD[Pancreatic adenocarcinoma], 16; PRAD[Prostate adenocarcinoma], 17; SKCM[Skin Cutaneous Melanoma], 18:STAD[Stomach adenocarcinoma], 19:THCA[Thyroid carcinoma], 20:UCEC[Uterine Corpus Endometrial Carcinoma]) |
| Top |
| * We represented just top 10 SNVs. When you move the cursor on each content, you can see more deailed mutation information on the Tooltip. Those are primary_site, primary_histology, mutation(aa), pubmedID. |
| Genomic Position | Mutation(aa) | Unique sampleID count |
| chr17:42152691 | p.L185L | 1 |
| chr17:42152695 | p.L230P | 1 |
| chr17:42152697 | p.V243M | 1 |
| chr17:42153059 | p.G279E | 1 |
| chr17:42153097 | p.L294M | 1 |
| chr17:42148497 | p.P329S | 1 |
| chr17:42153206 | p.I55T | 1 |
| chr17:42148528 | p.E65E | 1 |
| chr17:42153250 | p.G107G | 1 |
| chr17:42151630 | p.R140S | 1 |
| * Copy number data were extracted from TCGA using R package TCGA-Assembler. The URLs of all public data files on TCGA DCC data server were gathered on Jan-05-2015. Function ProcessCNAData in TCGA-Assembler package was used to obtain gene-level copy number value which is calculated as the average copy number of the genomic region of a gene. |
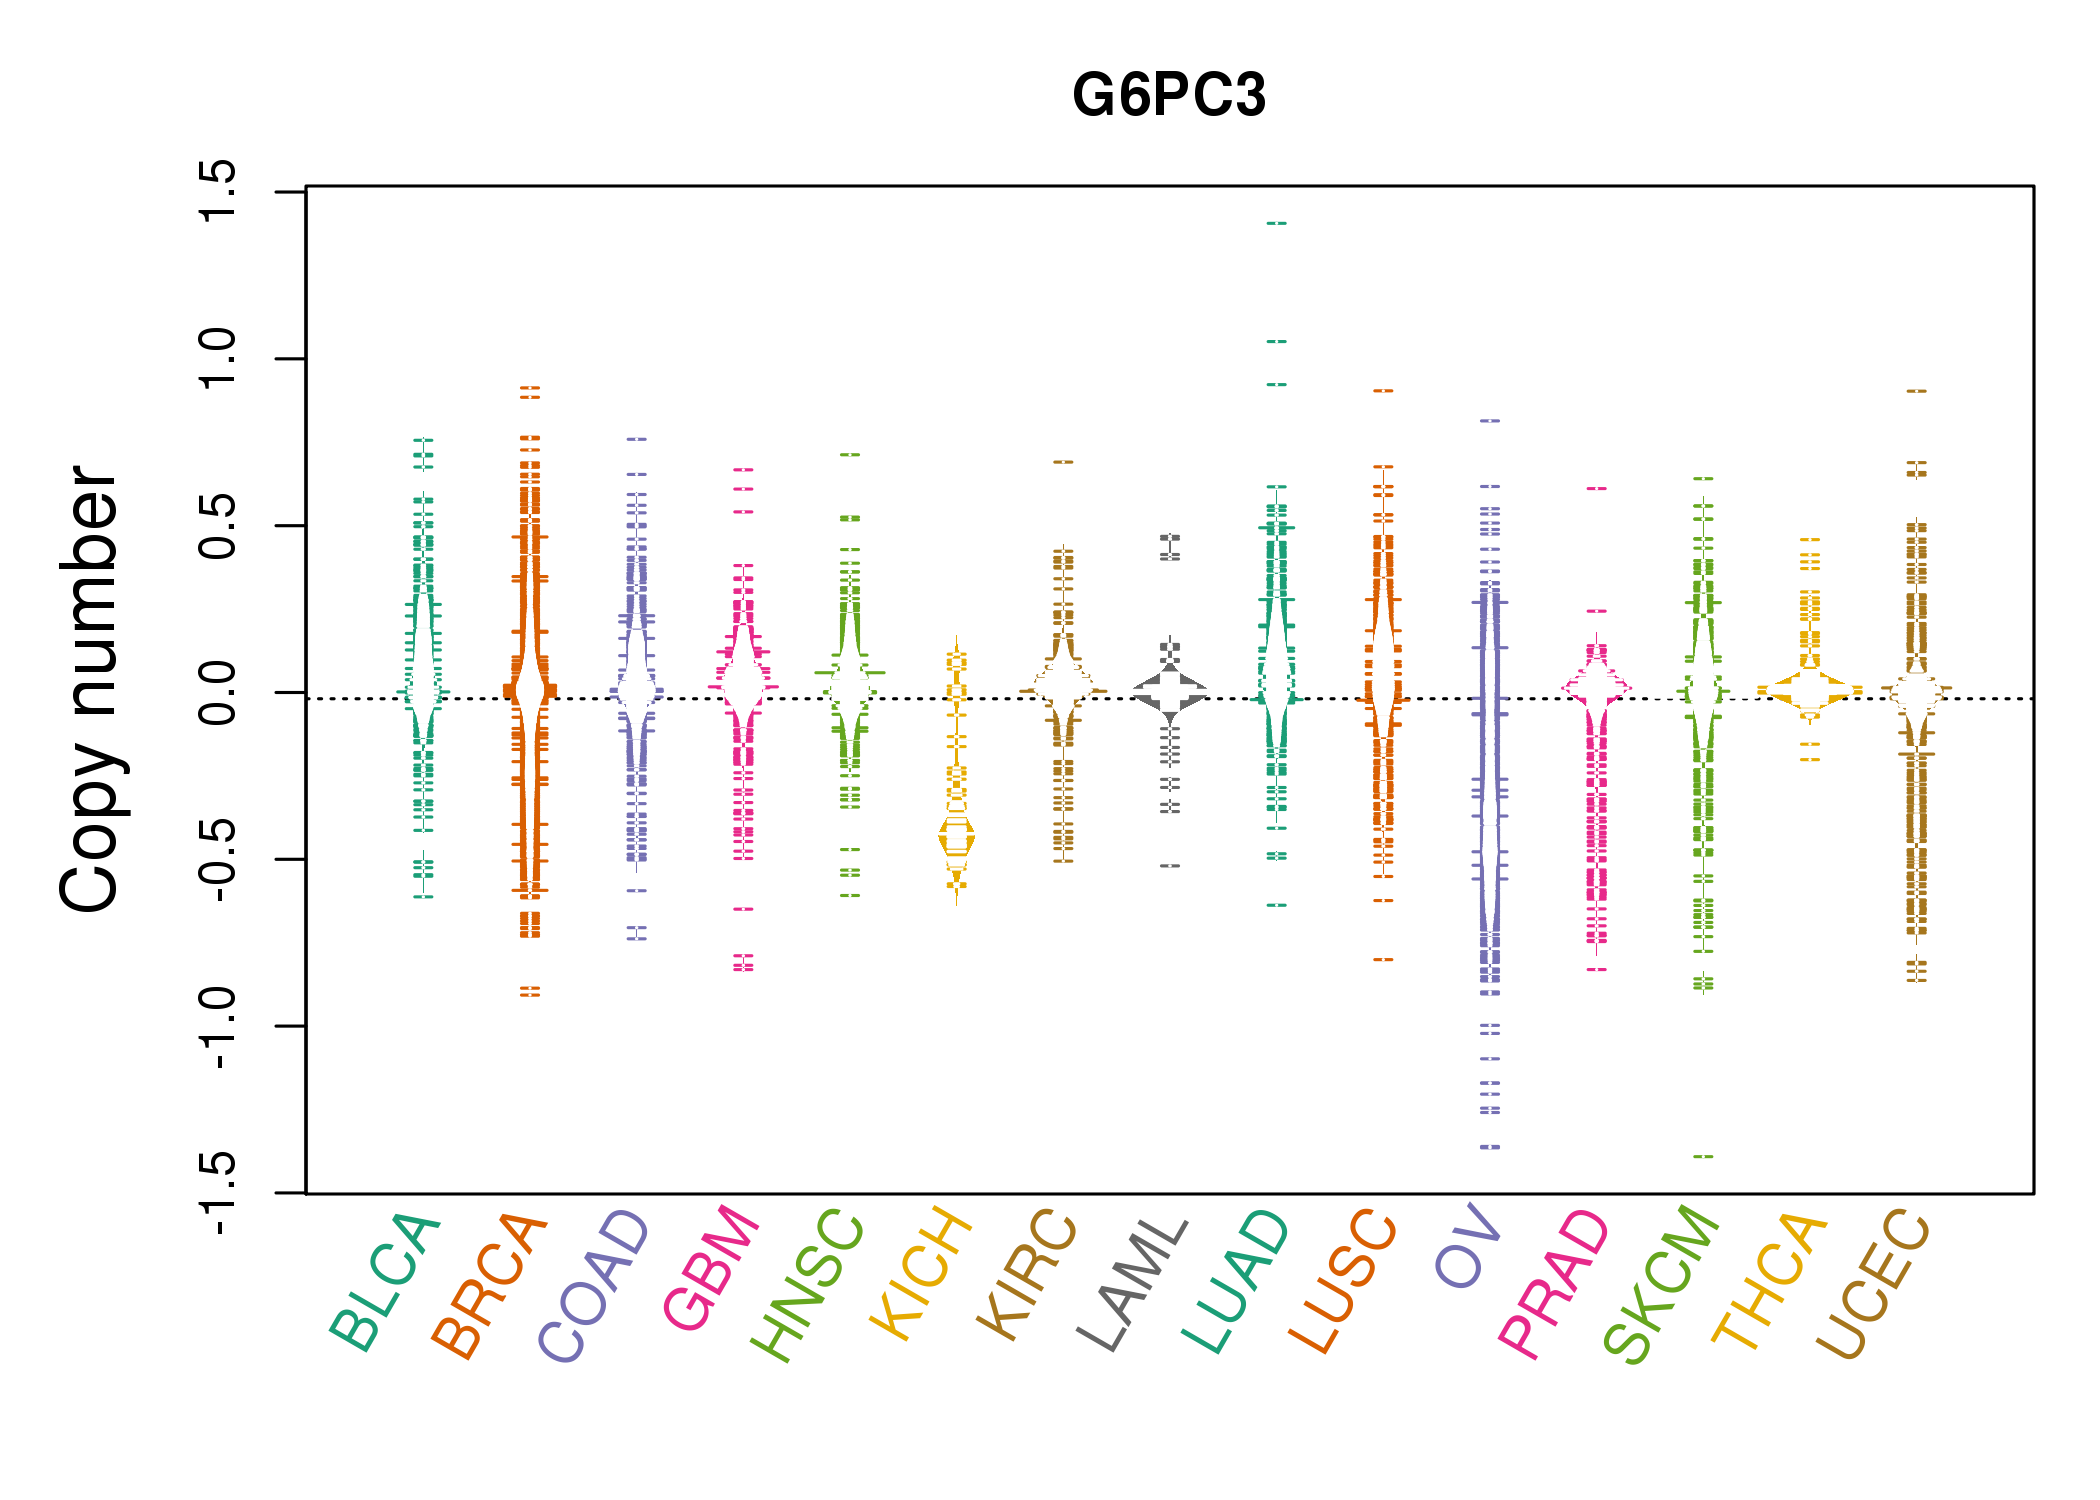 |
| cf) Tissue ID[Tissue type]: BLCA[Bladder Urothelial Carcinoma], BRCA[Breast invasive carcinoma], CESC[Cervical squamous cell carcinoma and endocervical adenocarcinoma], COAD[Colon adenocarcinoma], GBM[Glioblastoma multiforme], Glioma Low Grade, HNSC[Head and Neck squamous cell carcinoma], KICH[Kidney Chromophobe], KIRC[Kidney renal clear cell carcinoma], KIRP[Kidney renal papillary cell carcinoma], LAML[Acute Myeloid Leukemia], LUAD[Lung adenocarcinoma], LUSC[Lung squamous cell carcinoma], OV[Ovarian serous cystadenocarcinoma ], PAAD[Pancreatic adenocarcinoma], PRAD[Prostate adenocarcinoma], SKCM[Skin Cutaneous Melanoma], STAD[Stomach adenocarcinoma], THCA[Thyroid carcinoma], UCEC[Uterine Corpus Endometrial Carcinoma] |
| Top |
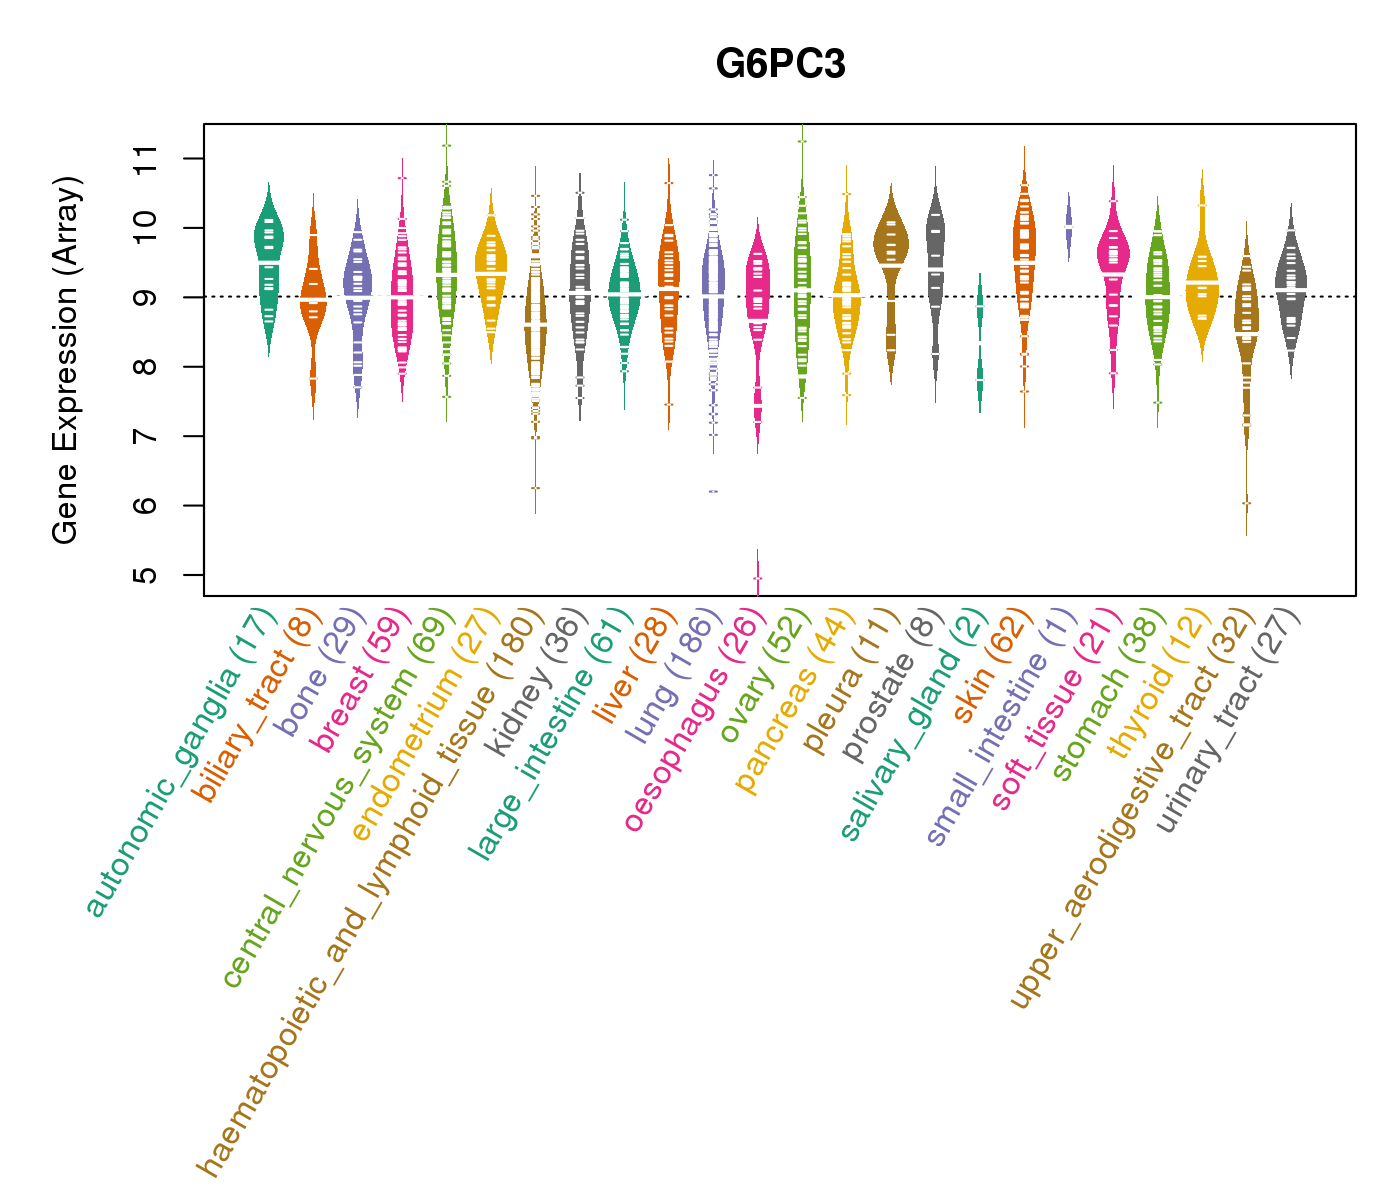
| Gene Expression for G6PC3 |
| * CCLE gene expression data were extracted from CCLE_Expression_Entrez_2012-10-18.res: Gene-centric RMA-normalized mRNA expression data. |
 |
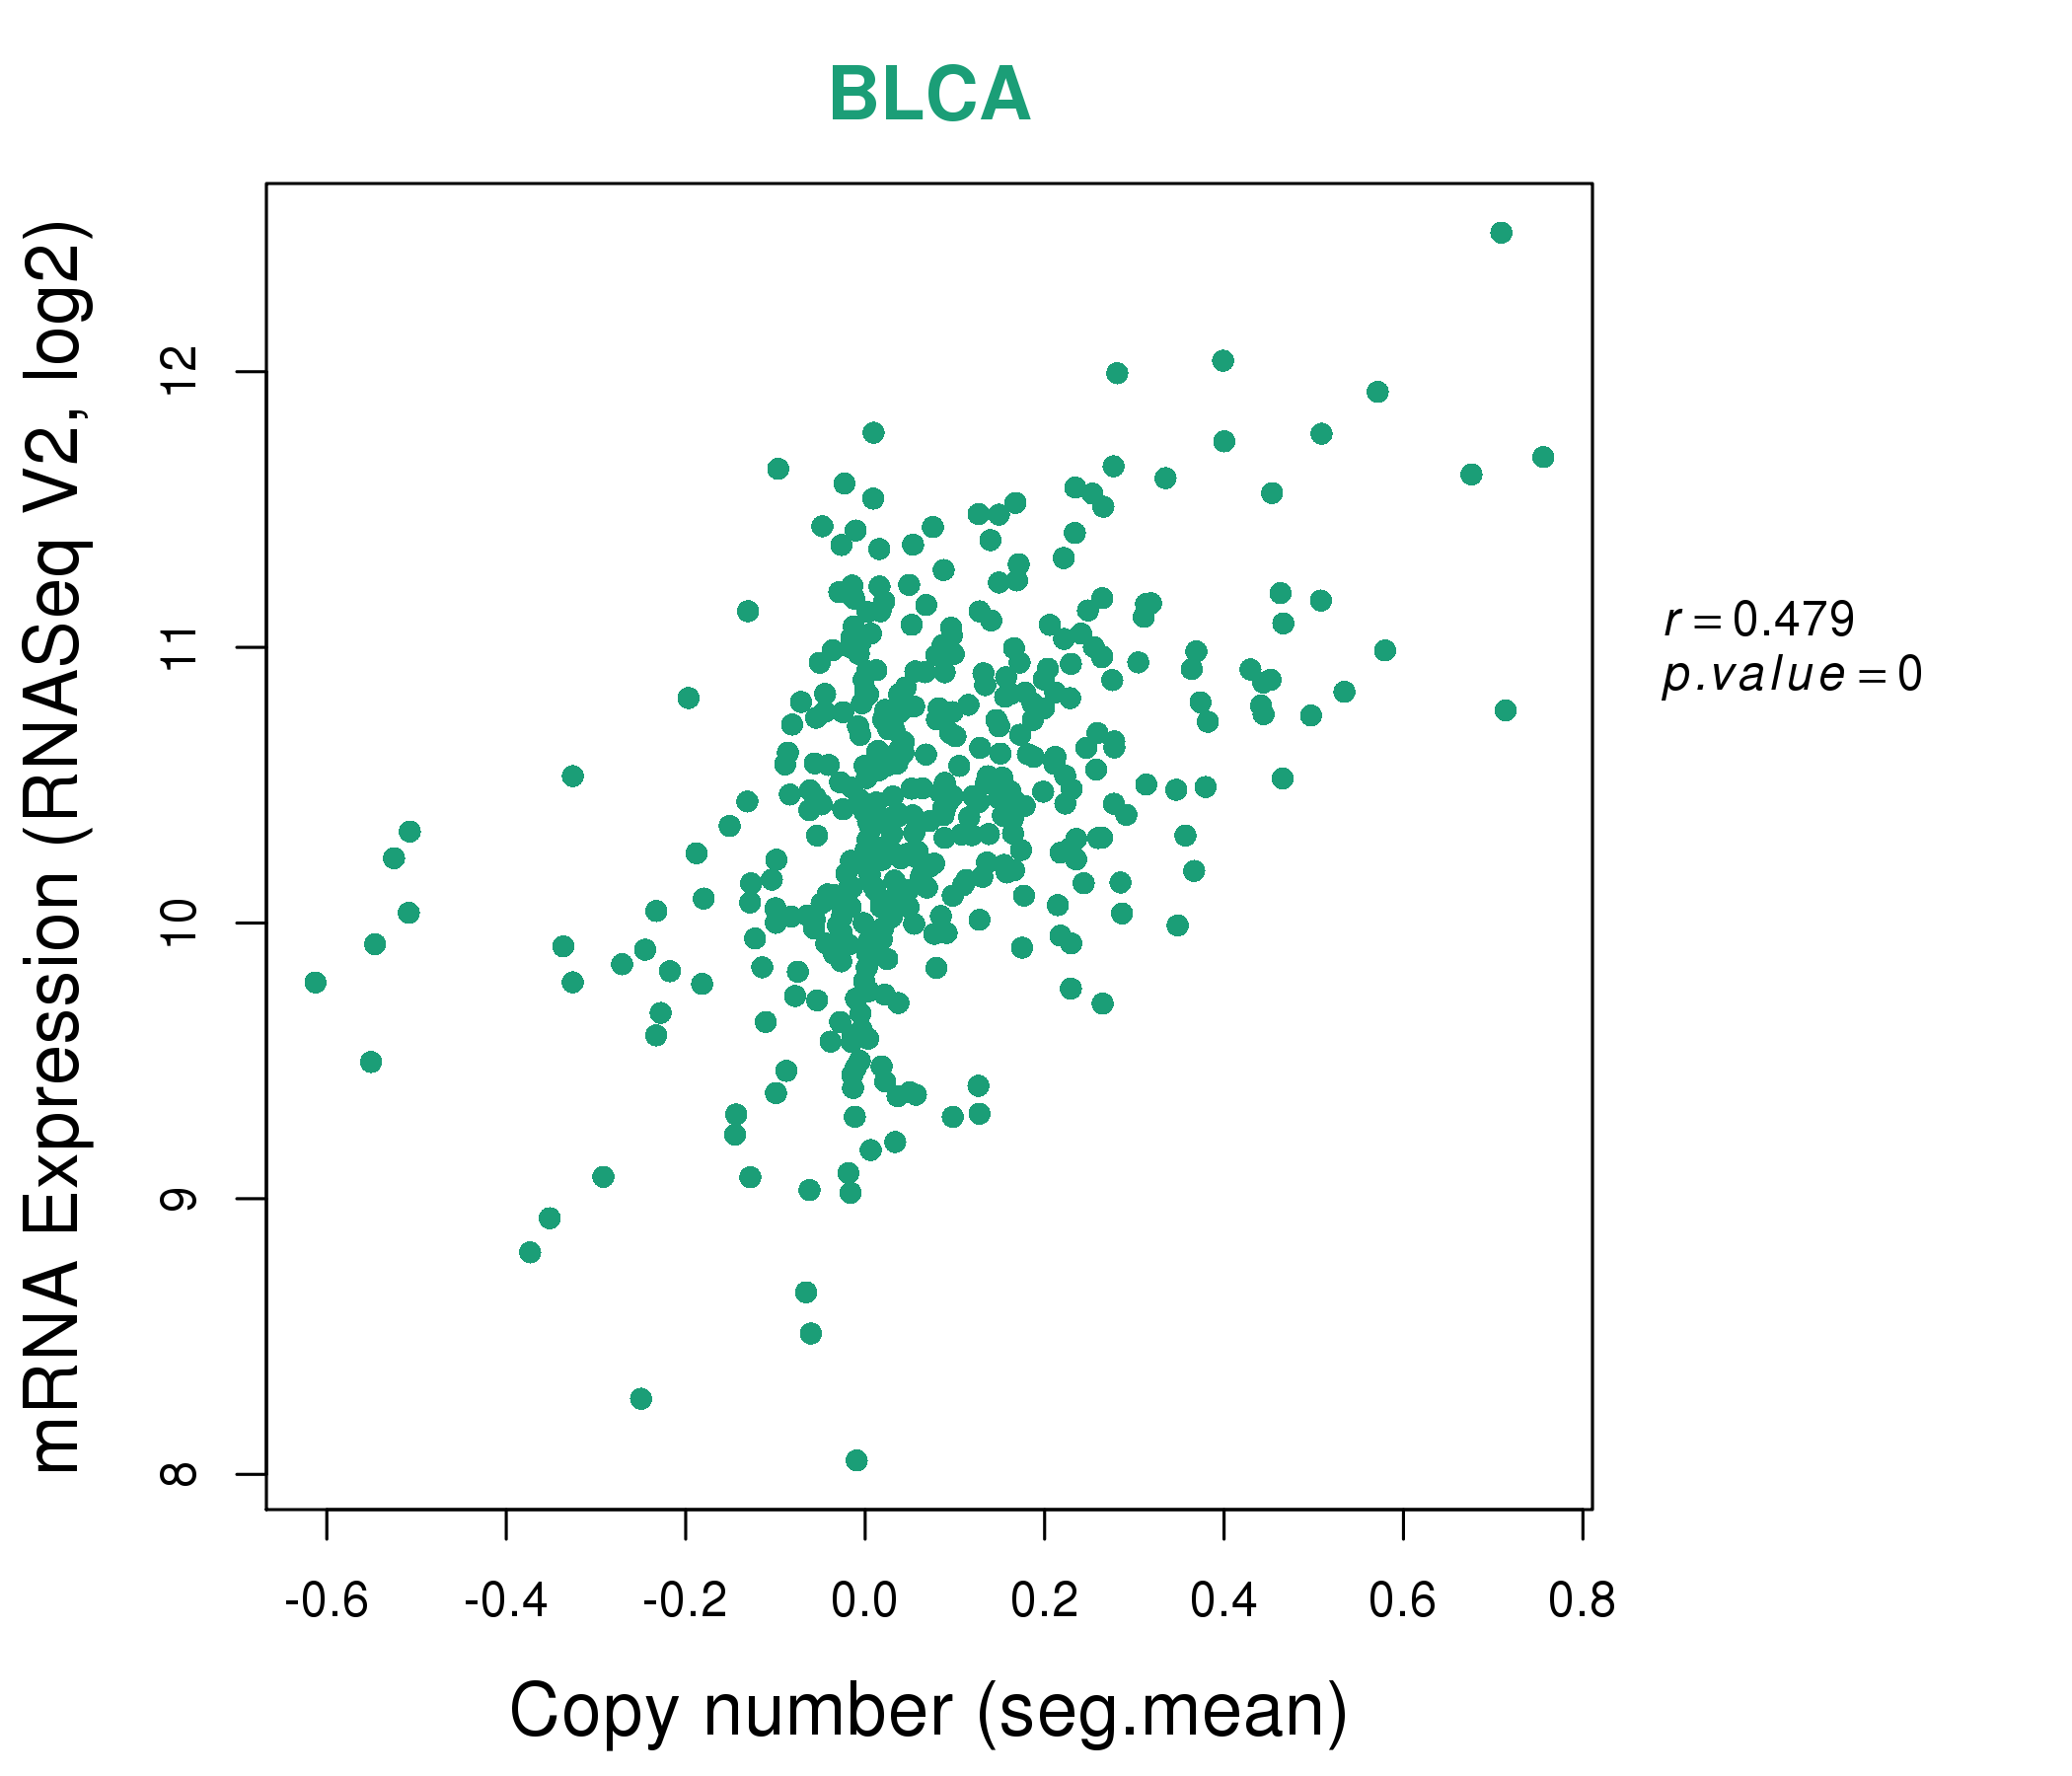
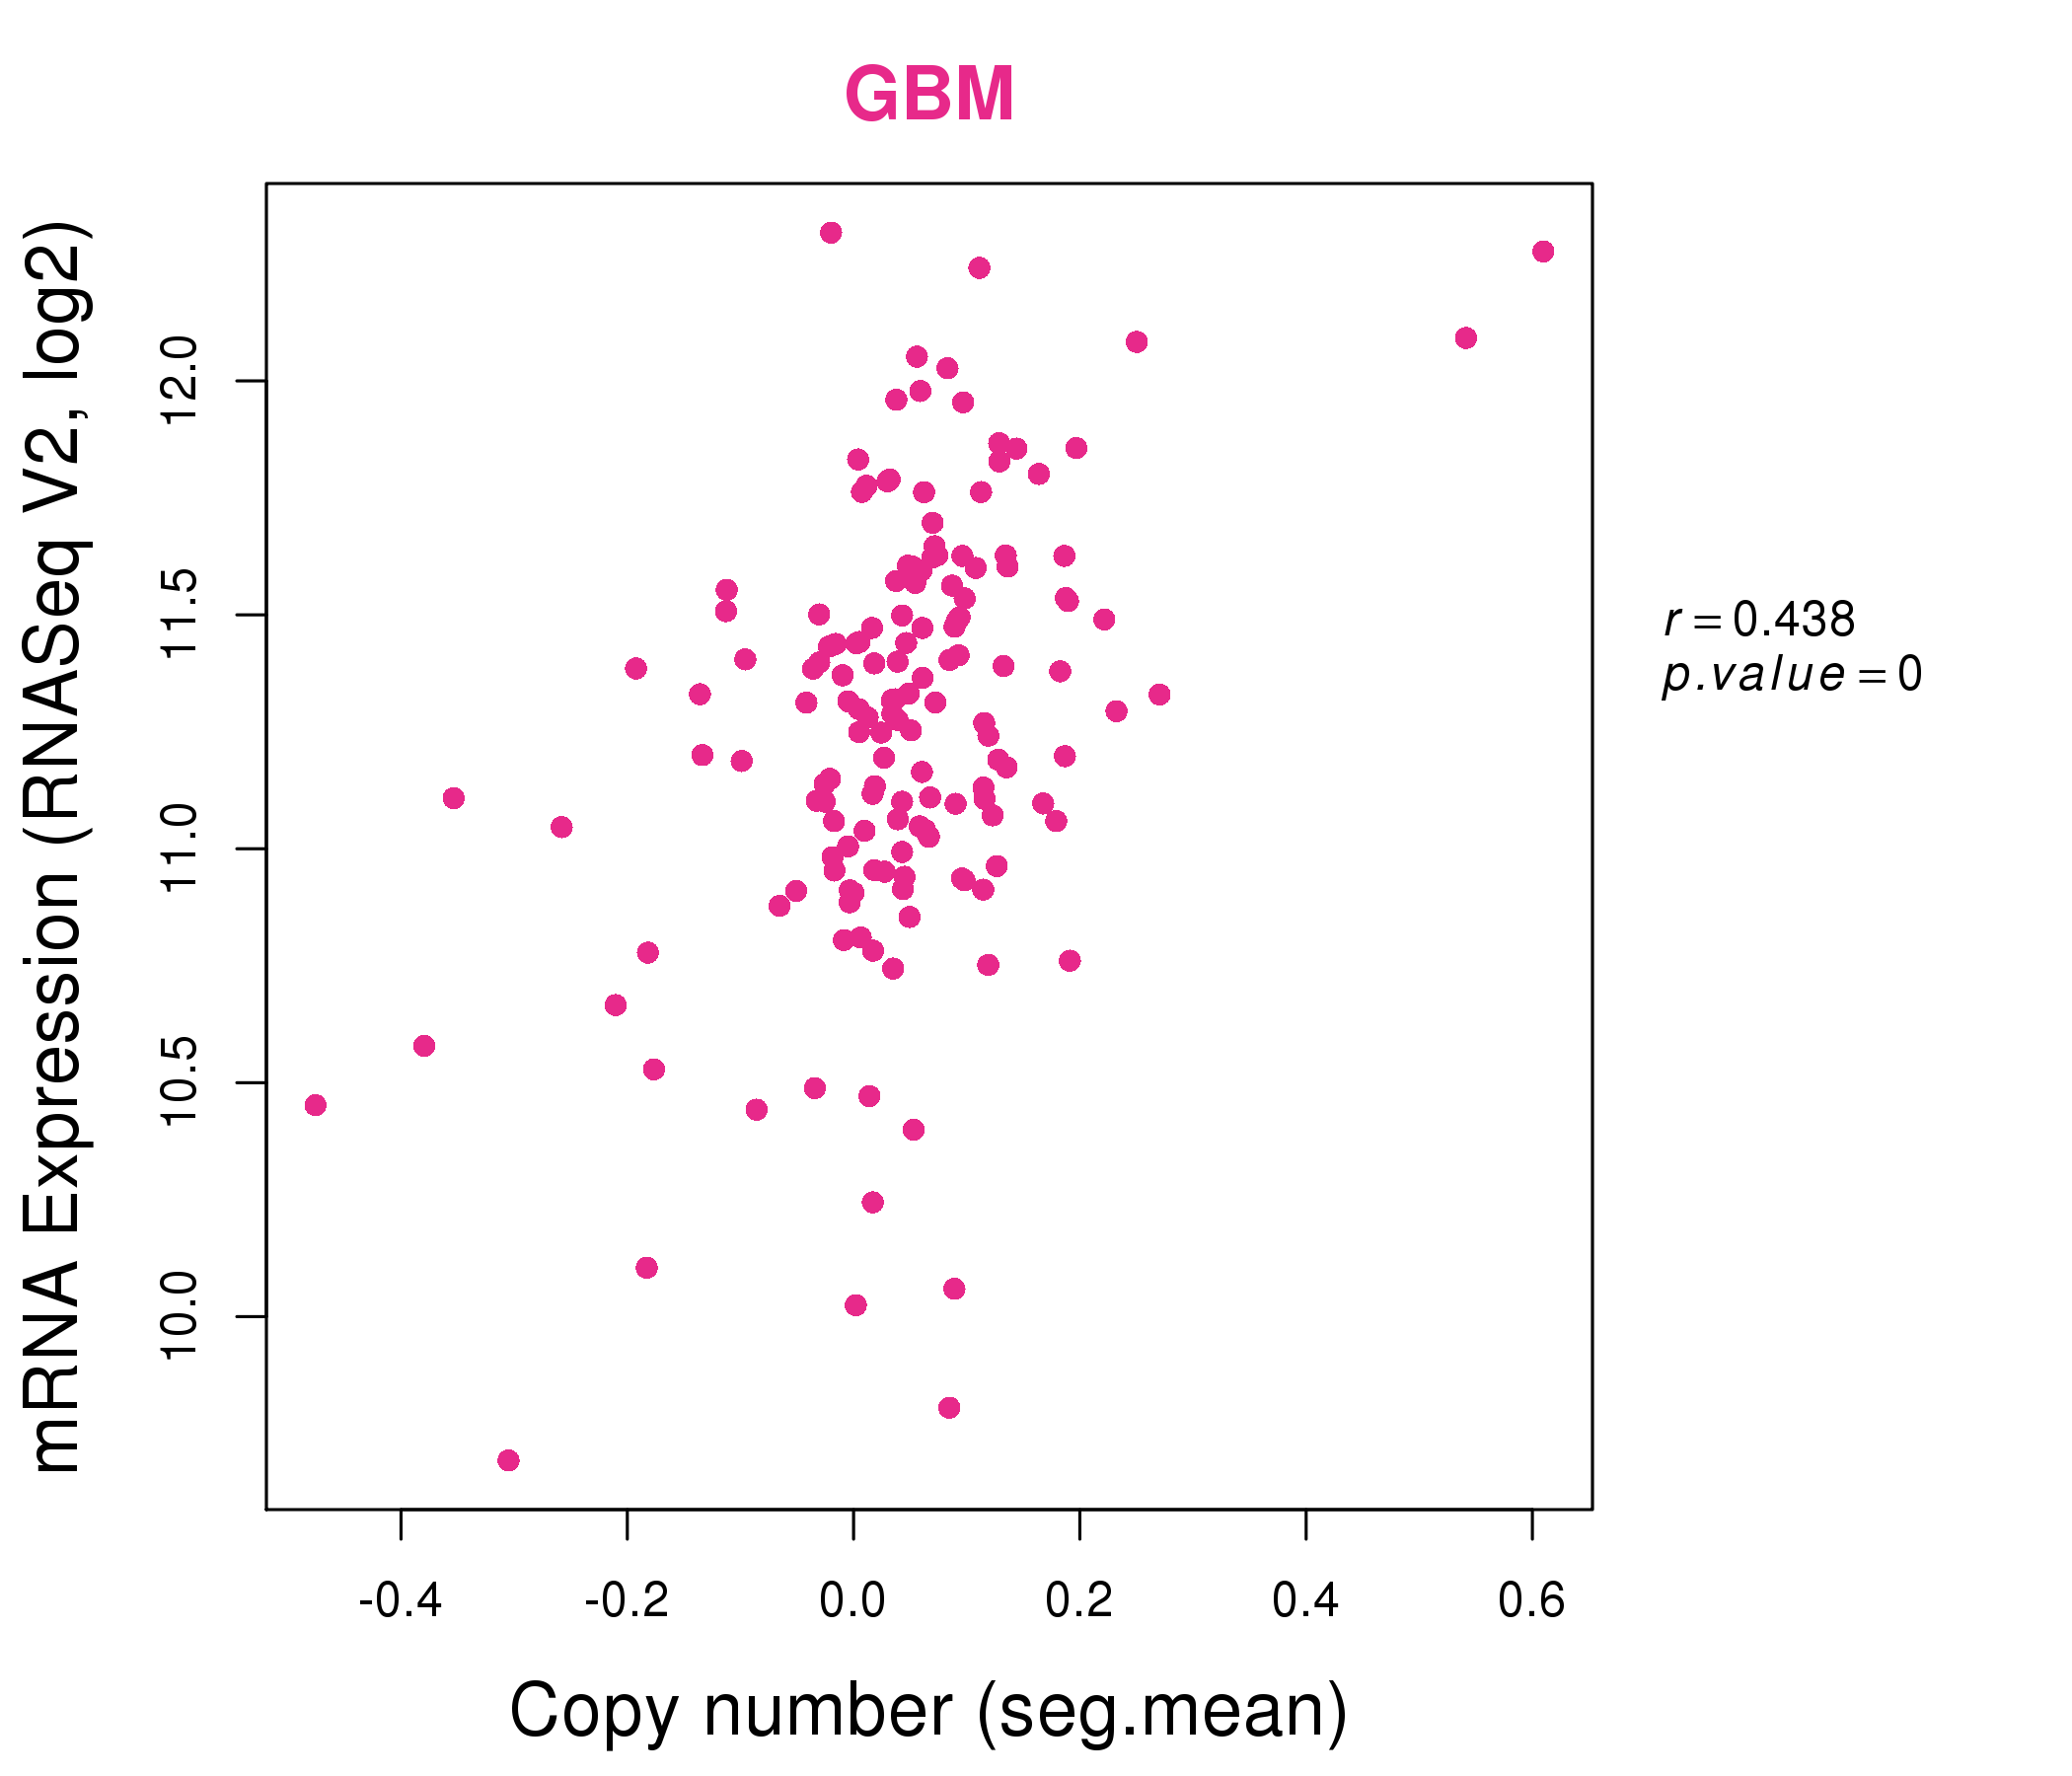
| * Normalized gene expression data of RNASeqV2 was extracted from TCGA using R package TCGA-Assembler. The URLs of all public data files on TCGA DCC data server were gathered at Jan-05-2015. Only eight cancer types have enough normal control samples for differential expression analysis. (t test, adjusted p<0.05 (using Benjamini-Hochberg FDR)) |
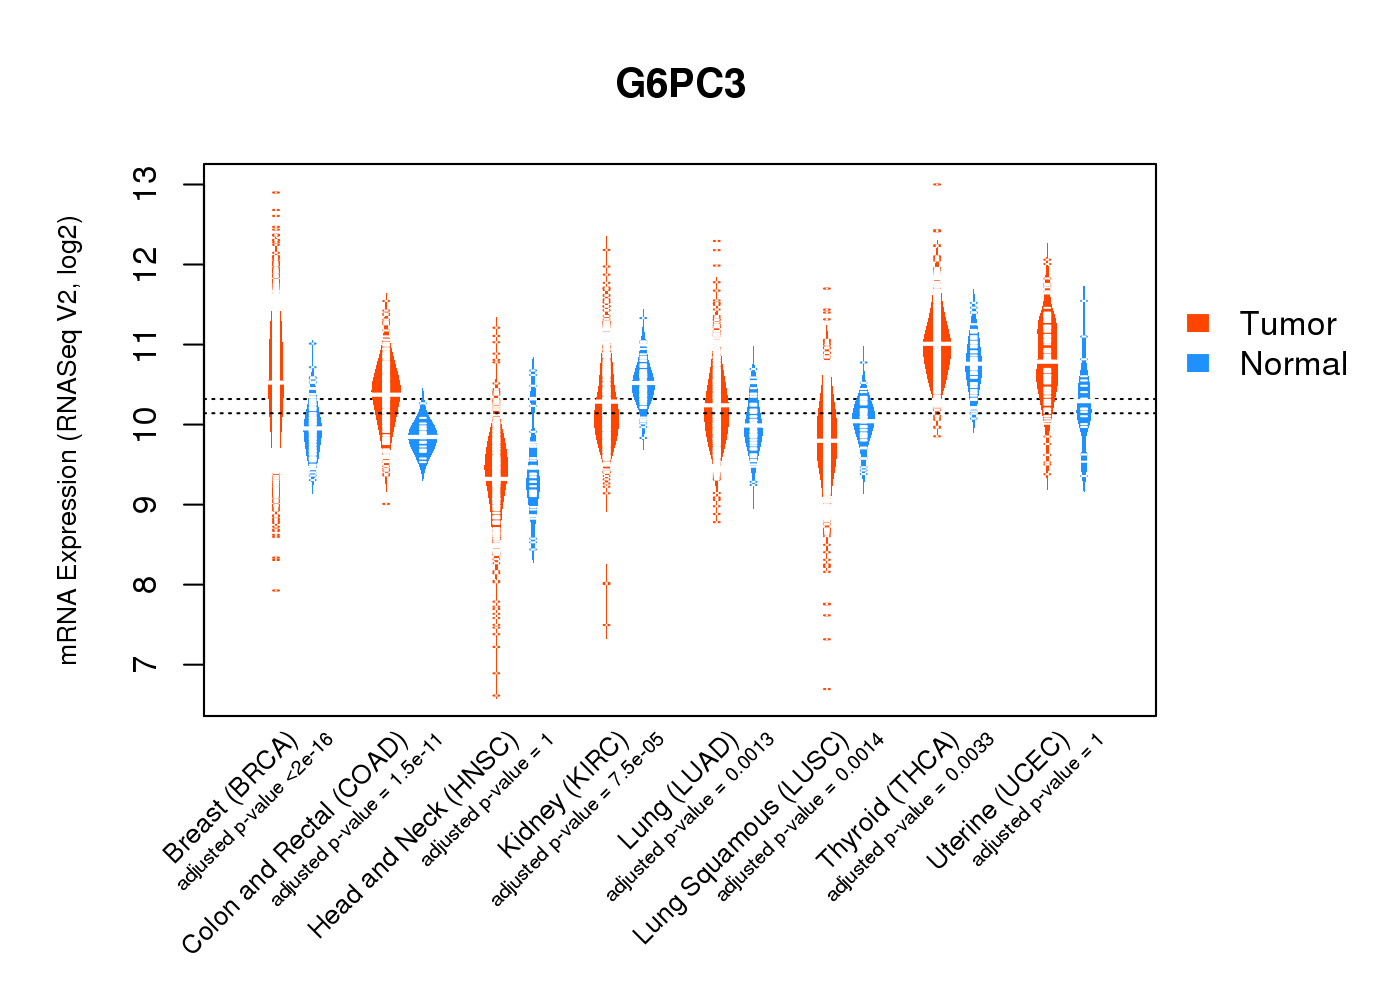 |
| Top |
| * This plots show the correlation between CNV and gene expression. |
: Open all plots for all cancer types
 |
|
 |
|

| Top |
| Gene-Gene Network Information |
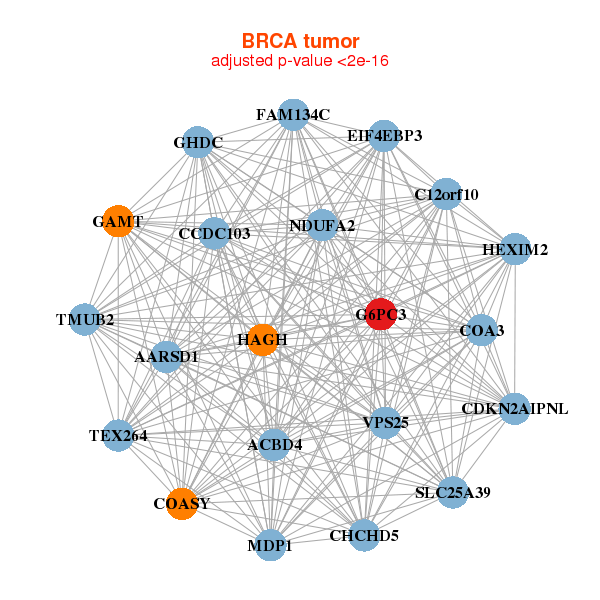
| * Co-Expression network figures were drawn using R package igraph. Only the top 20 genes with the highest correlations were shown. Red circle: input gene, orange circle: cell metabolism gene, sky circle: other gene |
: Open all plots for all cancer types
 |
|
| AARSD1,ACBD4,C12orf10,CCDC103,COA3,CDKN2AIPNL,CHCHD5, COASY,EIF4EBP3,FAM134C,G6PC3,GAMT,GHDC,HAGH, HEXIM2,MDP1,NDUFA2,SLC25A39,TEX264,TMUB2,VPS25 | ALG3,APOA1BP,ARF1,ATOX1,C1orf122,C6orf226,CAPNS1, CFL1,G6PC3,LHPP,MPDU1,ORMDL2,RHBDD2,RHOC, SEC61B,SERF2,SLC39A3,TAF10,TMEM147,YIF1A,ZDHHC24 |
 |
|
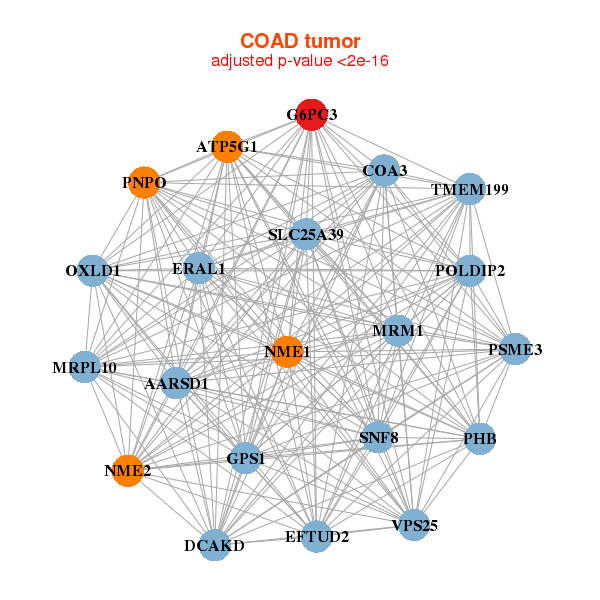
| AARSD1,ATP5G1,OXLD1,COA3,DCAKD,EFTUD2,ERAL1, G6PC3,GPS1,MRM1,MRPL10,NME1,NME2,PHB, PNPO,POLDIP2,PSME3,SLC25A39,SNF8,TMEM199,VPS25 | ALDH1B1,EBNA1BP2,ECE2,EIF3I,ERAL1,EEF2KMT,G6PC3, GADD45GIP1,GCDH,IFRD2,MMAB,MRPL17,MRPL36,NDUFS8, NOP56,PYCRL,RPF2,TIMM44,TIMM50,TMEM147,TSFM |
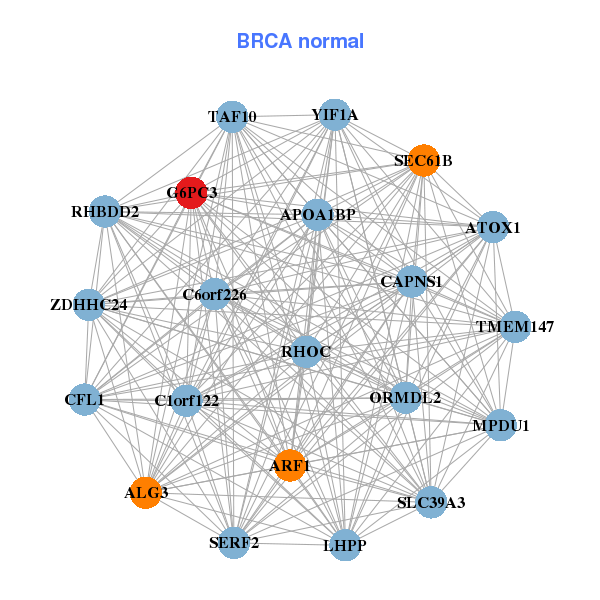
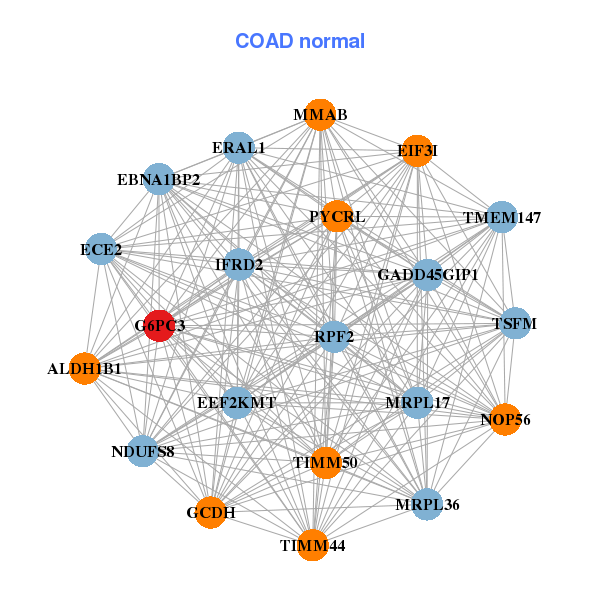
| * Co-Expression network figures were drawn using R package igraph. Only the top 20 genes with the highest correlations were shown. Red circle: input gene, orange circle: cell metabolism gene, sky circle: other gene |
: Open all plots for all cancer types
| Top |
: Open all interacting genes' information including KEGG pathway for all interacting genes from DAVID
| Top |
| Pharmacological Information for G6PC3 |
| There's no related Drug. |
| Top |
| Cross referenced IDs for G6PC3 |
| * We obtained these cross-references from Uniprot database. It covers 150 different DBs, 18 categories. http://www.uniprot.org/help/cross_references_section |
: Open all cross reference information
|
Copyright © 2016-Present - The Univsersity of Texas Health Science Center at Houston @ |