|
||||||||||||||||||||
| |
| Phenotypic Information (metabolism pathway, cancer, disease, phenome) |
| |
| |
| Gene-Gene Network Information: Co-Expression Network, Interacting Genes & KEGG |
| |
|


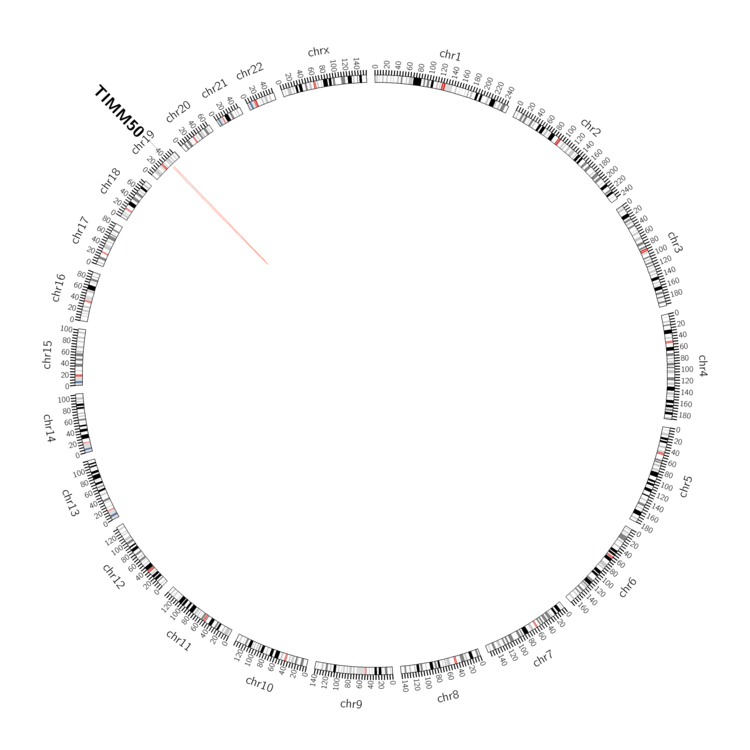
| Gene Summary for TIMM50 |
| Top |
| Phenotypic Information for TIMM50(metabolism pathway, cancer, disease, phenome) |
| Cancer | CGAP: TIMM50 |
| Familial Cancer Database: TIMM50 | |
| * This gene is included in those cancer gene databases. |
|
|
|
|
|
| . | ||||||||||||||
Oncogene 1 | Significant driver gene in | |||||||||||||||||||
| cf) number; DB name 1 Oncogene; http://nar.oxfordjournals.org/content/35/suppl_1/D721.long, 2 Tumor Suppressor gene; https://bioinfo.uth.edu/TSGene/, 3 Cancer Gene Census; http://www.nature.com/nrc/journal/v4/n3/abs/nrc1299.html, 4 CancerGenes; http://nar.oxfordjournals.org/content/35/suppl_1/D721.long, 5 Network of Cancer Gene; http://ncg.kcl.ac.uk/index.php, 1Therapeutic Vulnerabilities in Cancer; http://cbio.mskcc.org/cancergenomics/statius/ |
| REACTOME_METABOLISM_OF_PROTEINS | |
| OMIM | |
| Orphanet | |
| Disease | KEGG Disease: TIMM50 |
| MedGen: TIMM50 (Human Medical Genetics with Condition) | |
| ClinVar: TIMM50 | |
| Phenotype | MGI: TIMM50 (International Mouse Phenotyping Consortium) |
| PhenomicDB: TIMM50 | |
| Mutations for TIMM50 |
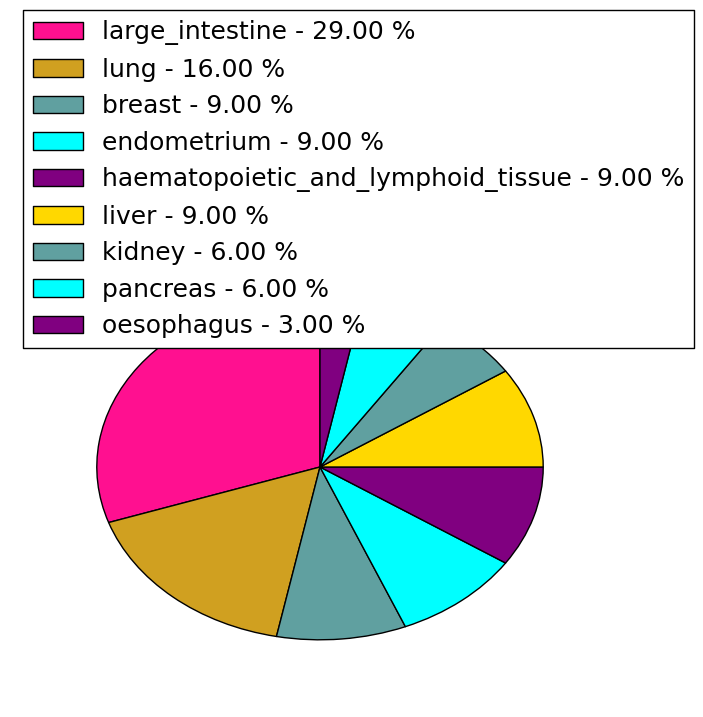
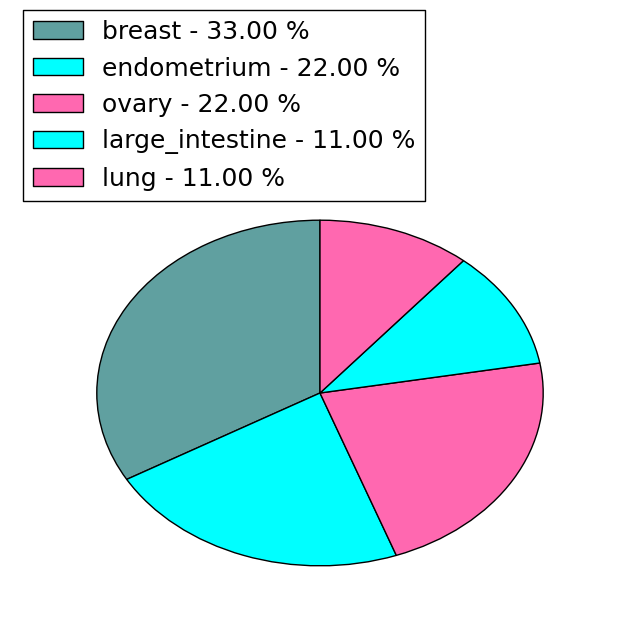
| * Under tables are showing count per each tissue to give us broad intuition about tissue specific mutation patterns.You can go to the detailed page for each mutation database's web site. |
| - Statistics for Tissue and Mutation type | Top |
 |
| - For Inter-chromosomal Variations |
| There's no inter-chromosomal structural variation. |
| - For Intra-chromosomal Variations |
| There's no intra-chromosomal structural variation. |
| Sample | Symbol_a | Chr_a | Start_a | End_a | Symbol_b | Chr_b | Start_b | End_b |
| pancreas | TIMM50 | chr19 | 39975450 | 39975470 | chr19 | 36824376 | 36824396 |
| cf) Tissue number; Tissue name (1;Breast, 2;Central_nervous_system, 3;Haematopoietic_and_lymphoid_tissue, 4;Large_intestine, 5;Liver, 6;Lung, 7;Ovary, 8;Pancreas, 9;Prostate, 10;Skin, 11;Soft_tissue, 12;Upper_aerodigestive_tract) |
| * From mRNA Sanger sequences, Chitars2.0 arranged chimeric transcripts. This table shows TIMM50 related fusion information. |
| ID | Head Gene | Tail Gene | Accession | Gene_a | qStart_a | qEnd_a | Chromosome_a | tStart_a | tEnd_a | Gene_a | qStart_a | qEnd_a | Chromosome_a | tStart_a | tEnd_a |
| BF763267 | AGRN | 75 | 94 | 1 | 978392 | 978411 | TIMM50 | 86 | 297 | 19 | 39978835 | 39980445 | |
| Top |
| There's no copy number variation information in COSMIC data for this gene. |
| Top |
|
 |
| Top |
| Stat. for Non-Synonymous SNVs (# total SNVs=31) | (# total SNVs=9) |
 |  |
(# total SNVs=2) | (# total SNVs=0) |
 |
| Top |
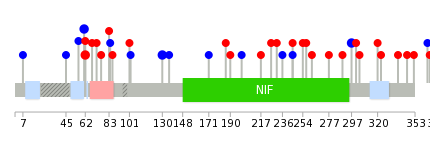
| * When you move the cursor on each content, you can see more deailed mutation information on the Tooltip. Those are primary_site,primary_histology,mutation(aa),pubmedID. |
| GRCh37 position | Mutation(aa) | Unique sampleID count |
| chr19:39971368-39971368 | p.D62H | 3 |
| chr19:39971574-39971574 | p.A130A | 2 |
| chr19:39971367-39971367 | p.P61P | 2 |
| chr19:39978708-39978708 | p.S338L | 2 |
| chr19:39976916-39976916 | p.T297T | 2 |
| chr19:39971352-39971352 | p.A56A | 1 |
| chr19:39977066-39977066 | p.H314fs*21 | 1 |
| chr19:39979213-39979213 | p.T399T | 1 |
| chr19:39980444-39980444 | p.R452H | 1 |
| chr19:39976380-39976380 | p.P245L | 1 |
| Top |
|
 |
| Point Mutation/ Tissue ID | 1 | 2 | 3 | 4 | 5 | 6 | 7 | 8 | 9 | 10 | 11 | 12 | 13 | 14 | 15 | 16 | 17 | 18 | 19 | 20 |
| # sample | 3 | 5 | 3 | 2 | 1 | 2 | 8 | 4 | 5 | |||||||||||
| # mutation | 3 | 6 | 3 | 2 | 1 | 2 | 8 | 4 | 5 | |||||||||||
| nonsynonymous SNV | 2 | 6 | 2 | 2 | 1 | 5 | 3 | 3 | ||||||||||||
| synonymous SNV | 1 | 1 | 2 | 3 | 1 | 2 |
| cf) Tissue ID; Tissue type (1; BLCA[Bladder Urothelial Carcinoma], 2; BRCA[Breast invasive carcinoma], 3; CESC[Cervical squamous cell carcinoma and endocervical adenocarcinoma], 4; COAD[Colon adenocarcinoma], 5; GBM[Glioblastoma multiforme], 6; Glioma Low Grade, 7; HNSC[Head and Neck squamous cell carcinoma], 8; KICH[Kidney Chromophobe], 9; KIRC[Kidney renal clear cell carcinoma], 10; KIRP[Kidney renal papillary cell carcinoma], 11; LAML[Acute Myeloid Leukemia], 12; LUAD[Lung adenocarcinoma], 13; LUSC[Lung squamous cell carcinoma], 14; OV[Ovarian serous cystadenocarcinoma ], 15; PAAD[Pancreatic adenocarcinoma], 16; PRAD[Prostate adenocarcinoma], 17; SKCM[Skin Cutaneous Melanoma], 18:STAD[Stomach adenocarcinoma], 19:THCA[Thyroid carcinoma], 20:UCEC[Uterine Corpus Endometrial Carcinoma]) |
| Top |
| * We represented just top 10 SNVs. When you move the cursor on each content, you can see more deailed mutation information on the Tooltip. Those are primary_site, primary_histology, mutation(aa), pubmedID. |
| Genomic Position | Mutation(aa) | Unique sampleID count |
| chr19:39971368 | p.D62H | 1 |
| chr19:39976354 | p.G301S | 1 |
| chr19:39978791 | p.R68P | 1 |
| chr19:39971387 | p.R320C | 1 |
| chr19:39976380 | p.P76L | 1 |
| chr19:39978811 | p.H333R | 1 |
| chr19:39971411 | p.S84S | 1 |
| chr19:39976406 | p.S338L | 1 |
| chr19:39979194 | p.R102R | 1 |
| chr19:39971436 | p.R346L | 1 |
| * Copy number data were extracted from TCGA using R package TCGA-Assembler. The URLs of all public data files on TCGA DCC data server were gathered on Jan-05-2015. Function ProcessCNAData in TCGA-Assembler package was used to obtain gene-level copy number value which is calculated as the average copy number of the genomic region of a gene. |
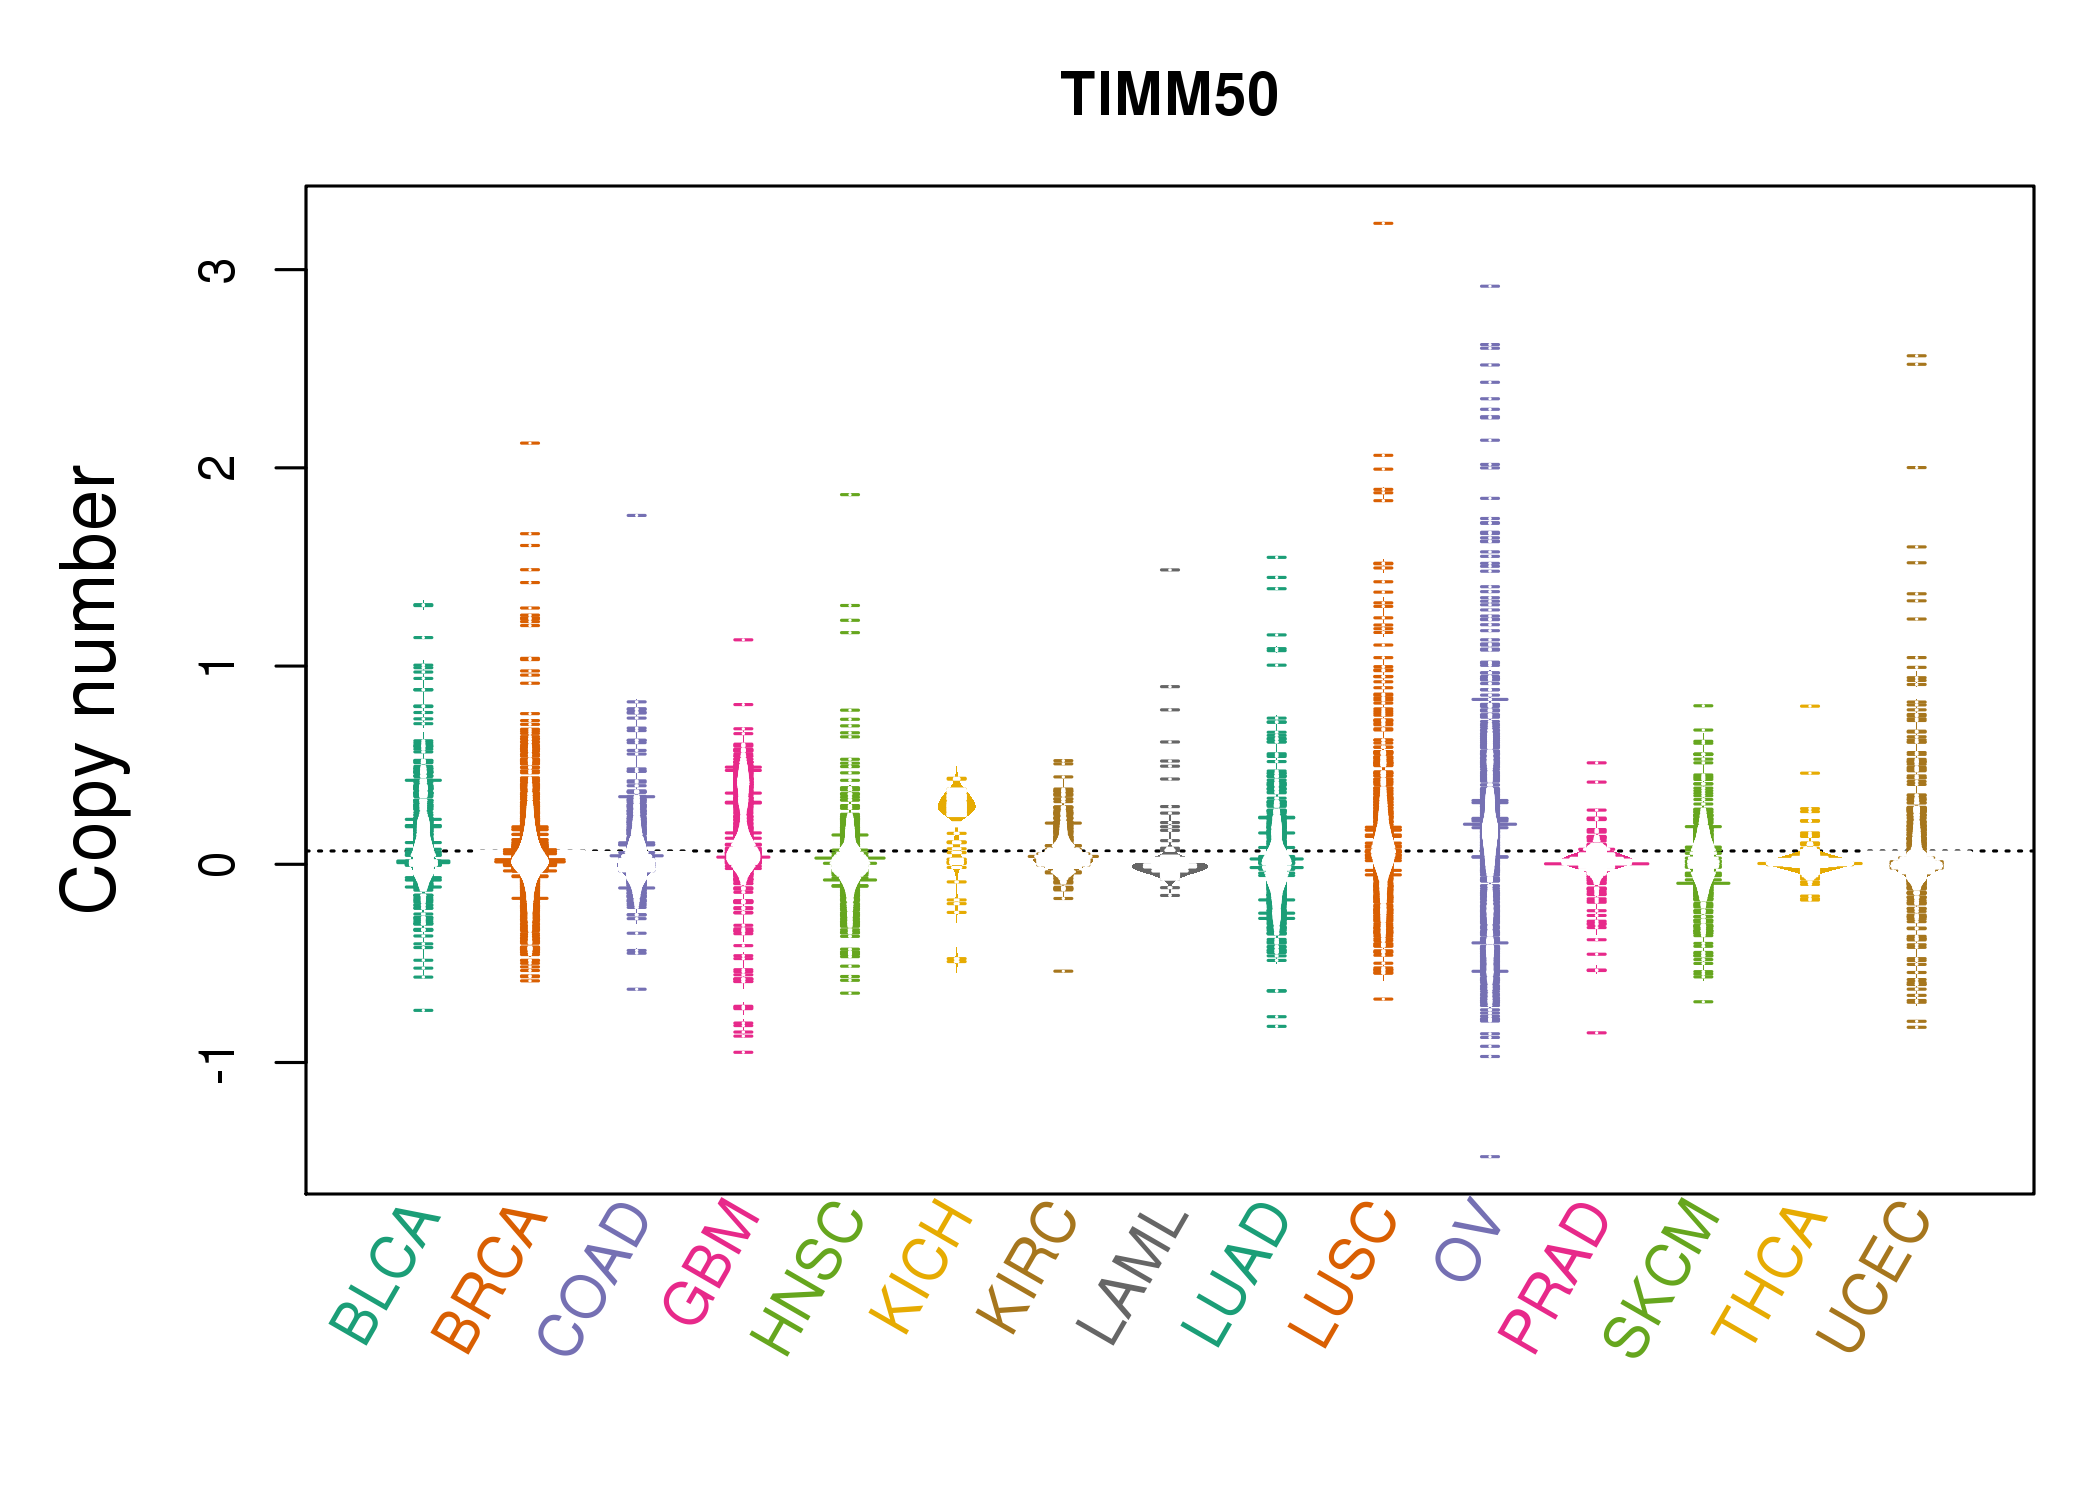 |
| cf) Tissue ID[Tissue type]: BLCA[Bladder Urothelial Carcinoma], BRCA[Breast invasive carcinoma], CESC[Cervical squamous cell carcinoma and endocervical adenocarcinoma], COAD[Colon adenocarcinoma], GBM[Glioblastoma multiforme], Glioma Low Grade, HNSC[Head and Neck squamous cell carcinoma], KICH[Kidney Chromophobe], KIRC[Kidney renal clear cell carcinoma], KIRP[Kidney renal papillary cell carcinoma], LAML[Acute Myeloid Leukemia], LUAD[Lung adenocarcinoma], LUSC[Lung squamous cell carcinoma], OV[Ovarian serous cystadenocarcinoma ], PAAD[Pancreatic adenocarcinoma], PRAD[Prostate adenocarcinoma], SKCM[Skin Cutaneous Melanoma], STAD[Stomach adenocarcinoma], THCA[Thyroid carcinoma], UCEC[Uterine Corpus Endometrial Carcinoma] |
| Top |
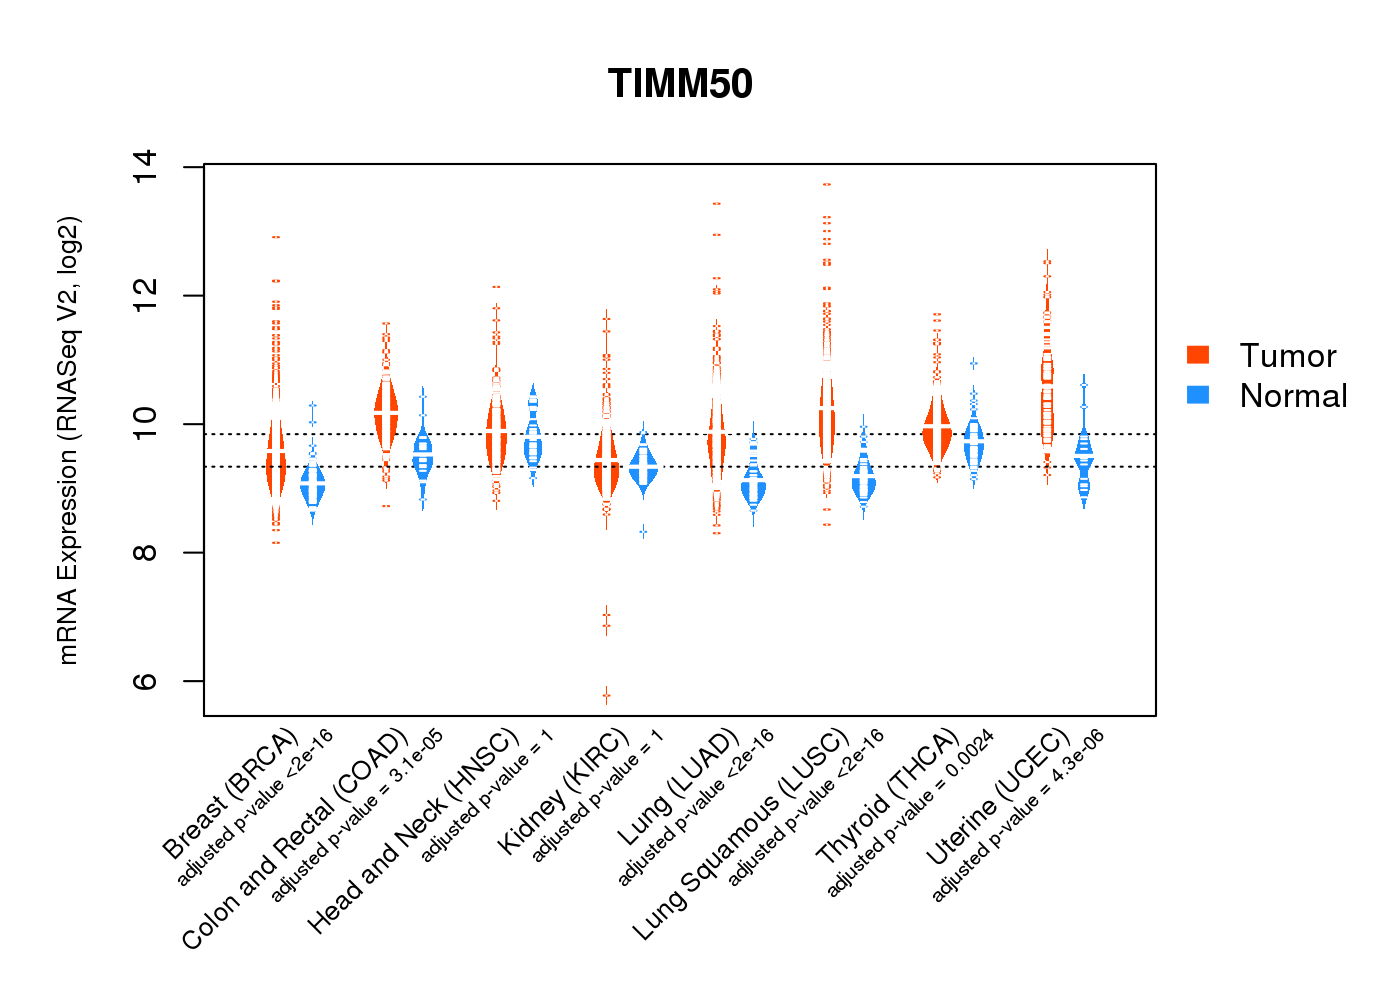
| Gene Expression for TIMM50 |
| * CCLE gene expression data were extracted from CCLE_Expression_Entrez_2012-10-18.res: Gene-centric RMA-normalized mRNA expression data. |
 |
| * Normalized gene expression data of RNASeqV2 was extracted from TCGA using R package TCGA-Assembler. The URLs of all public data files on TCGA DCC data server were gathered at Jan-05-2015. Only eight cancer types have enough normal control samples for differential expression analysis. (t test, adjusted p<0.05 (using Benjamini-Hochberg FDR)) |
 |
| Top |
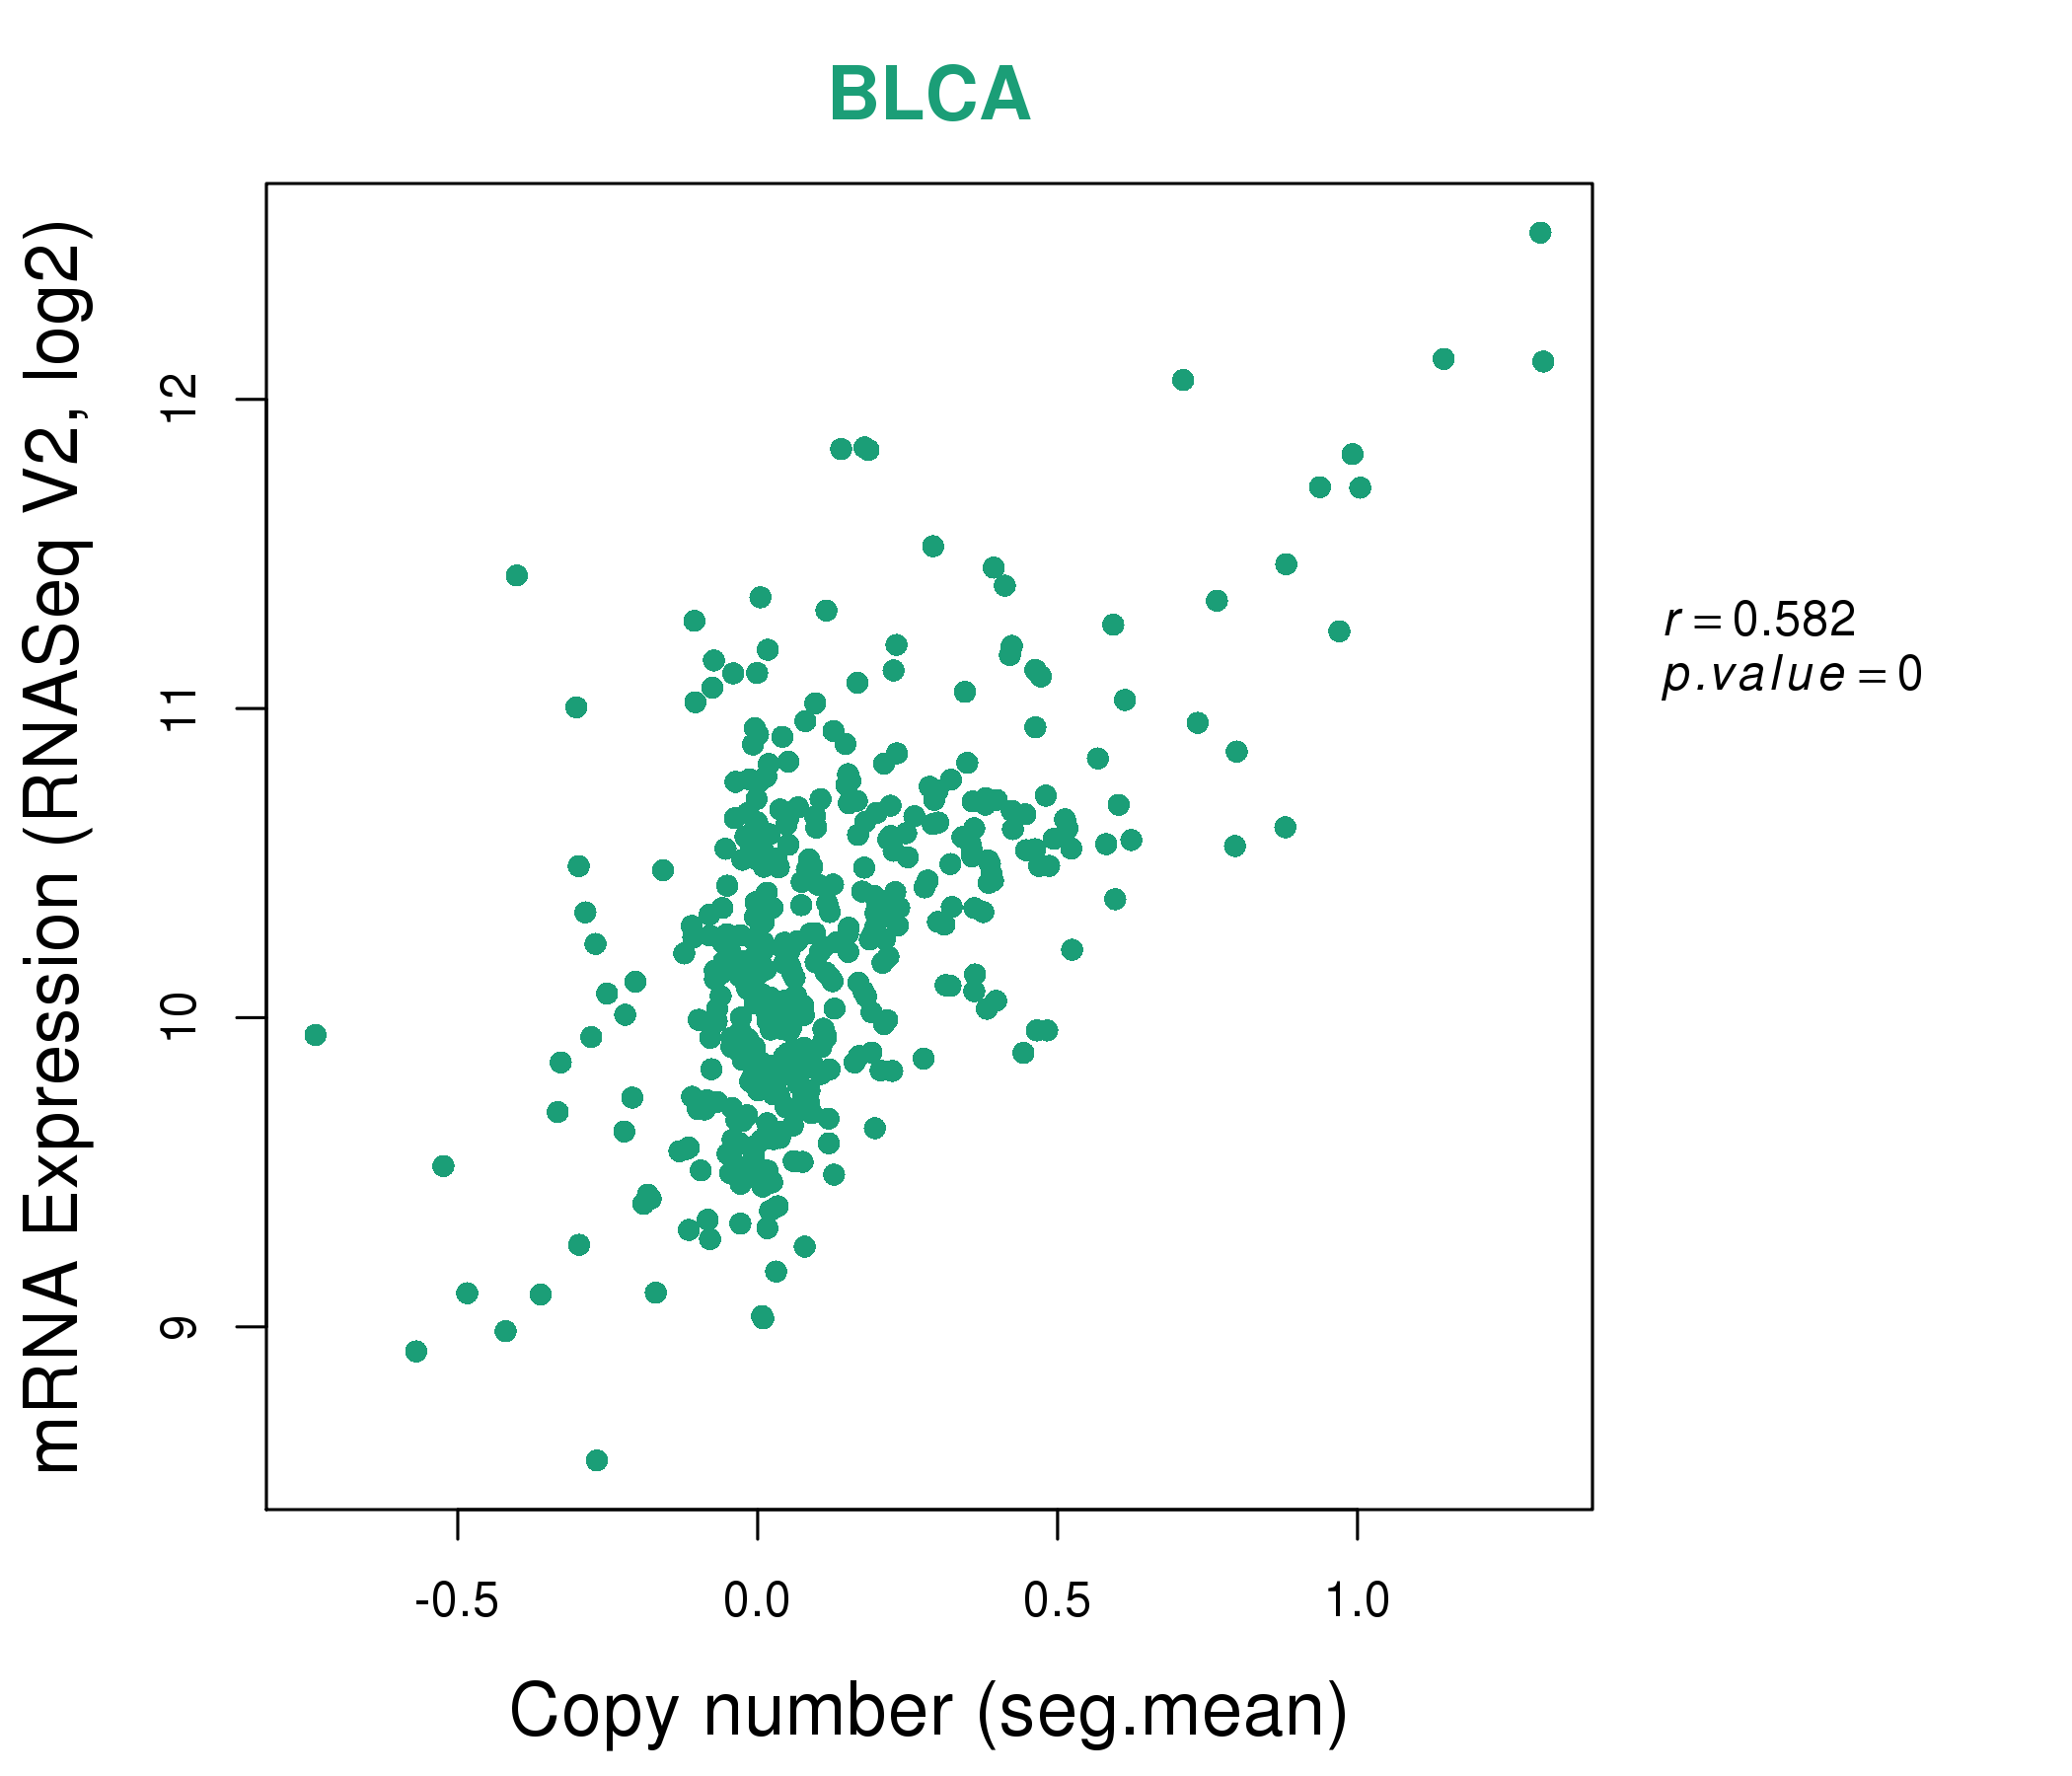
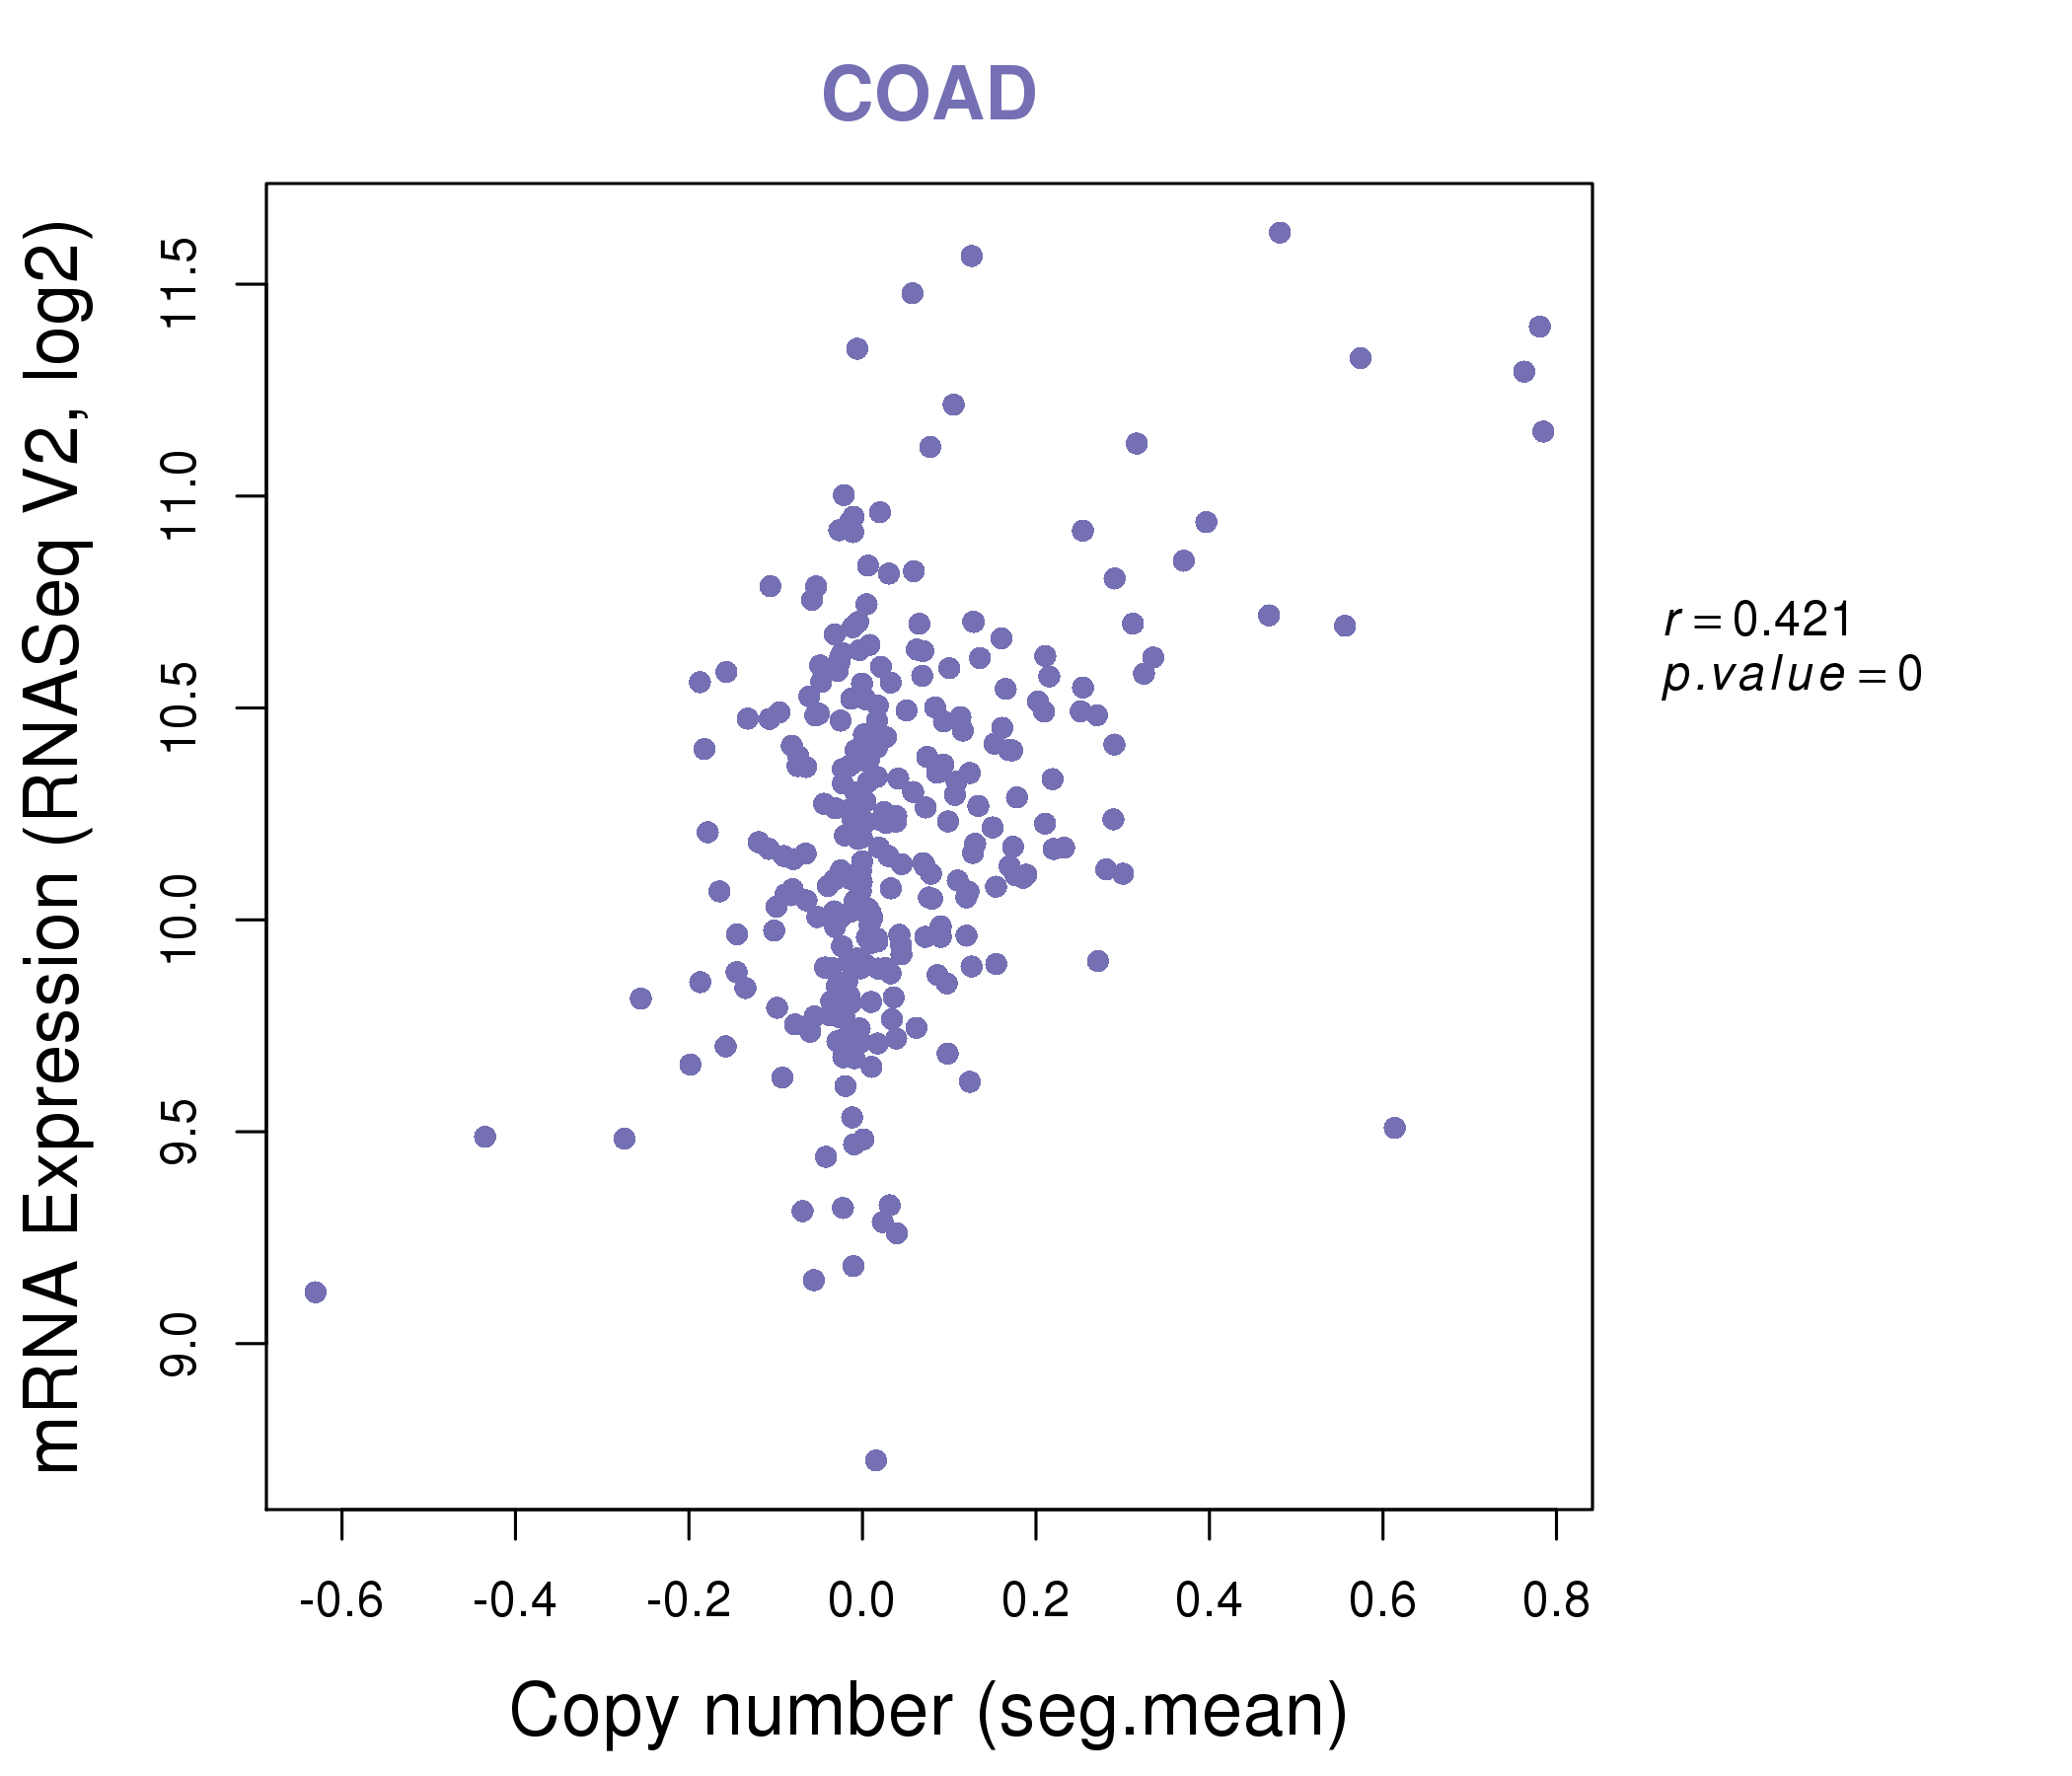
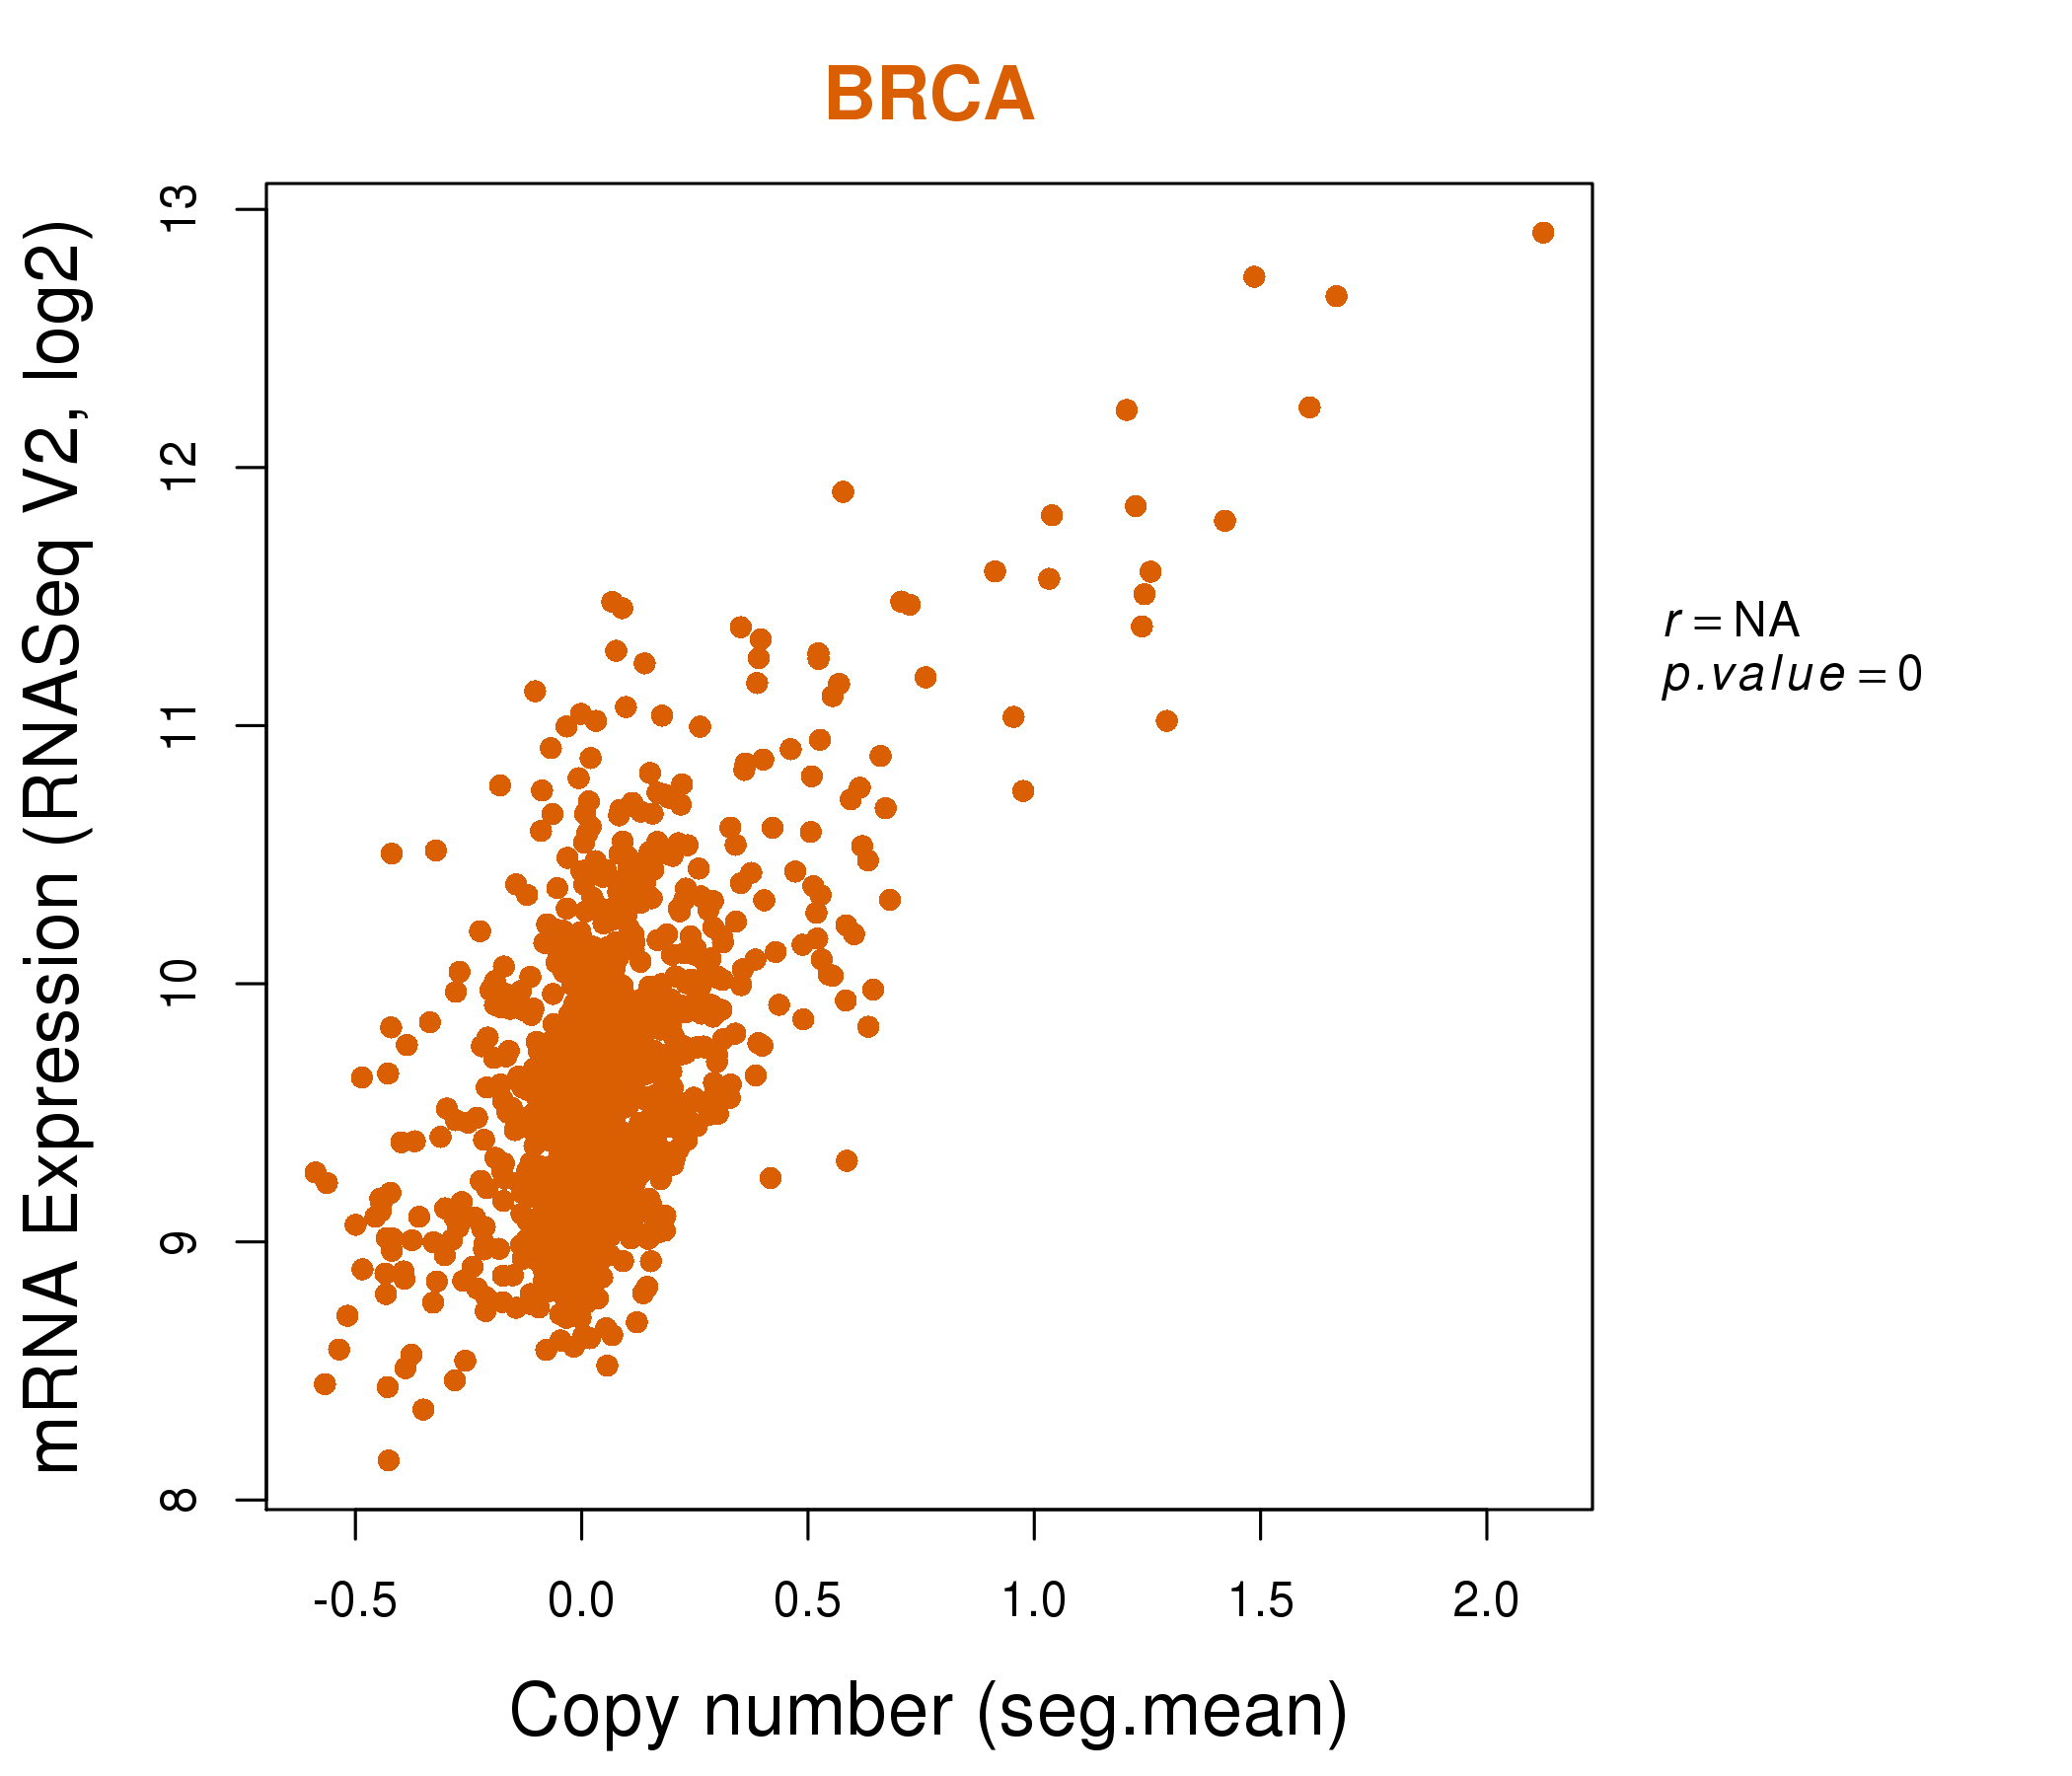
| * This plots show the correlation between CNV and gene expression. |
: Open all plots for all cancer types
 |
|
 |
|

| Top |
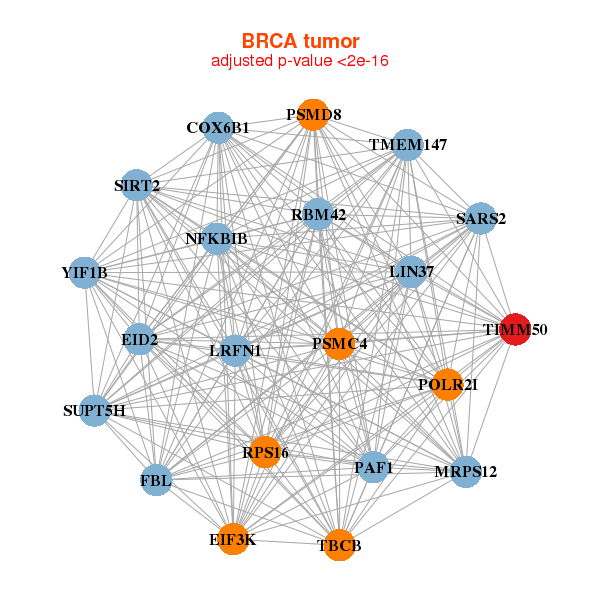
| Gene-Gene Network Information |
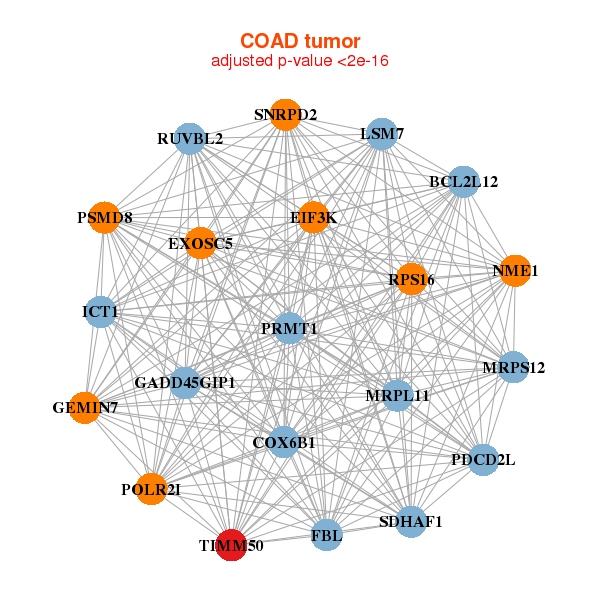
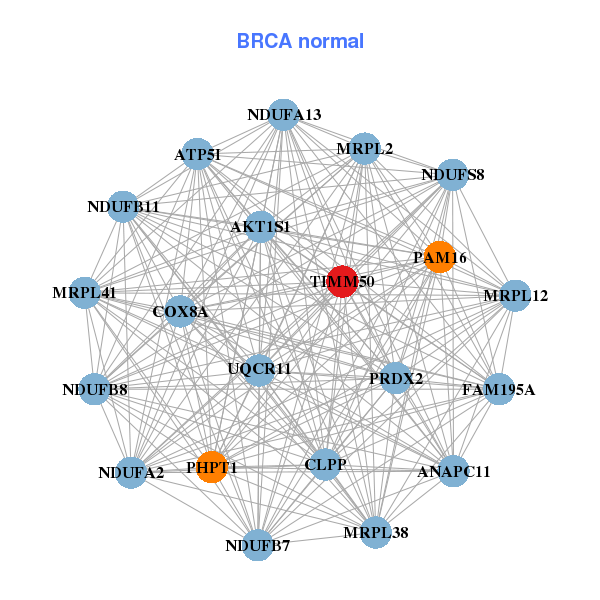
| * Co-Expression network figures were drawn using R package igraph. Only the top 20 genes with the highest correlations were shown. Red circle: input gene, orange circle: cell metabolism gene, sky circle: other gene |
: Open all plots for all cancer types
 |
|
| COX6B1,EID2,EIF3K,FBL,LIN37,LRFN1,MRPS12, NFKBIB,PAF1,POLR2I,PSMC4,PSMD8,RBM42,RPS16, SARS2,SIRT2,SUPT5H,TBCB,TIMM50,TMEM147,YIF1B | AKT1S1,ANAPC11,ATP5I,CLPP,COX8A,FAM195A,MRPL12, MRPL2,MRPL38,MRPL41,NDUFA13,NDUFA2,NDUFB11,NDUFB7, NDUFB8,NDUFS8,PHPT1,PRDX2,PAM16,TIMM50,UQCR11 |
 |
|
| BCL2L12,COX6B1,EIF3K,EXOSC5,FBL,GADD45GIP1,GEMIN7, ICT1,LSM7,MRPL11,MRPS12,NME1,PDCD2L,POLR2I, PRMT1,PSMD8,RPS16,RUVBL2,SDHAF1,SNRPD2,TIMM50 | ADSL,BANF1,BOLA3,EBNA1BP2,GADD45GIP1,MRPL11,MRPL36, MRPS15,MRTO4,NAA10,NHP2,NUTF2,NXT1,POLE3, PPIL1,PRMT1,RABEPK,SNRPB,STOML2,TIMM44,TIMM50 |
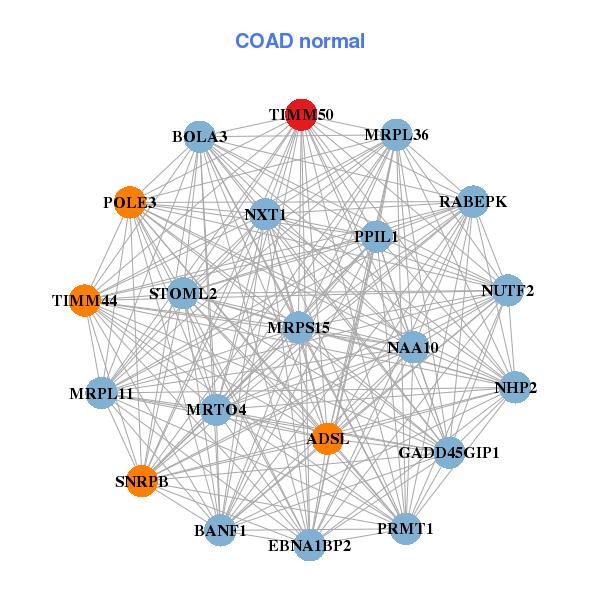
| * Co-Expression network figures were drawn using R package igraph. Only the top 20 genes with the highest correlations were shown. Red circle: input gene, orange circle: cell metabolism gene, sky circle: other gene |
: Open all plots for all cancer types
| Top |
: Open all interacting genes' information including KEGG pathway for all interacting genes from DAVID
| Top |
| Pharmacological Information for TIMM50 |
| There's no related Drug. |
| Top |
| Cross referenced IDs for TIMM50 |
| * We obtained these cross-references from Uniprot database. It covers 150 different DBs, 18 categories. http://www.uniprot.org/help/cross_references_section |
: Open all cross reference information
|
Copyright © 2016-Present - The Univsersity of Texas Health Science Center at Houston @ |