|
||||||||||||||||||||
| |
| Phenotypic Information (metabolism pathway, cancer, disease, phenome) |
| |
| |
| Gene-Gene Network Information: Co-Expression Network, Interacting Genes & KEGG |
| |
|


| Gene Summary for B3GNT7 |
| Top |
| Phenotypic Information for B3GNT7(metabolism pathway, cancer, disease, phenome) |
| Cancer | CGAP: B3GNT7 |
| Familial Cancer Database: B3GNT7 | |
| * This gene is included in those cancer gene databases. |
|
|
|
|
|
|
| ||||||||||||||
Oncogene 1 | Significant driver gene in | |||||||||||||||||||
| cf) number; DB name 1 Oncogene; http://nar.oxfordjournals.org/content/35/suppl_1/D721.long, 2 Tumor Suppressor gene; https://bioinfo.uth.edu/TSGene/, 3 Cancer Gene Census; http://www.nature.com/nrc/journal/v4/n3/abs/nrc1299.html, 4 CancerGenes; http://nar.oxfordjournals.org/content/35/suppl_1/D721.long, 5 Network of Cancer Gene; http://ncg.kcl.ac.uk/index.php, 1Therapeutic Vulnerabilities in Cancer; http://cbio.mskcc.org/cancergenomics/statius/ |
| REACTOME_METABOLISM_OF_PROTEINS REACTOME_METABOLISM_OF_CARBOHYDRATES | |
| OMIM | |
| Orphanet | |
| Disease | KEGG Disease: B3GNT7 |
| MedGen: B3GNT7 (Human Medical Genetics with Condition) | |
| ClinVar: B3GNT7 | |
| Phenotype | MGI: B3GNT7 (International Mouse Phenotyping Consortium) |
| PhenomicDB: B3GNT7 | |
| Mutations for B3GNT7 |
| * Under tables are showing count per each tissue to give us broad intuition about tissue specific mutation patterns.You can go to the detailed page for each mutation database's web site. |
| There's no structural variation information in COSMIC data for this gene. |
| * From mRNA Sanger sequences, Chitars2.0 arranged chimeric transcripts. This table shows B3GNT7 related fusion information. |
| ID | Head Gene | Tail Gene | Accession | Gene_a | qStart_a | qEnd_a | Chromosome_a | tStart_a | tEnd_a | Gene_a | qStart_a | qEnd_a | Chromosome_a | tStart_a | tEnd_a |
| Top |
| There's no copy number variation information in COSMIC data for this gene. |
| Top |
|
 |
| Top |
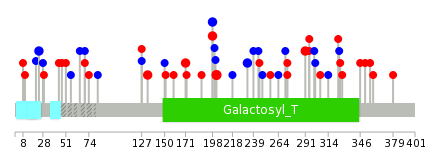
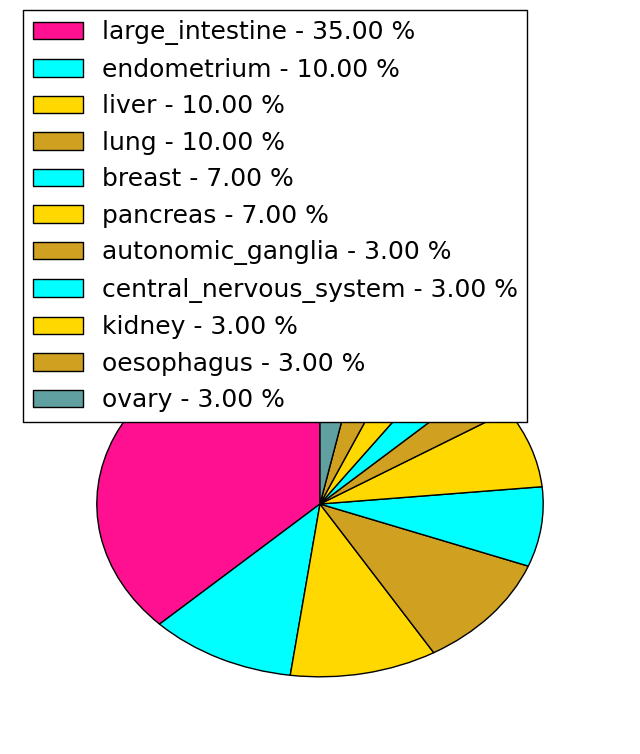
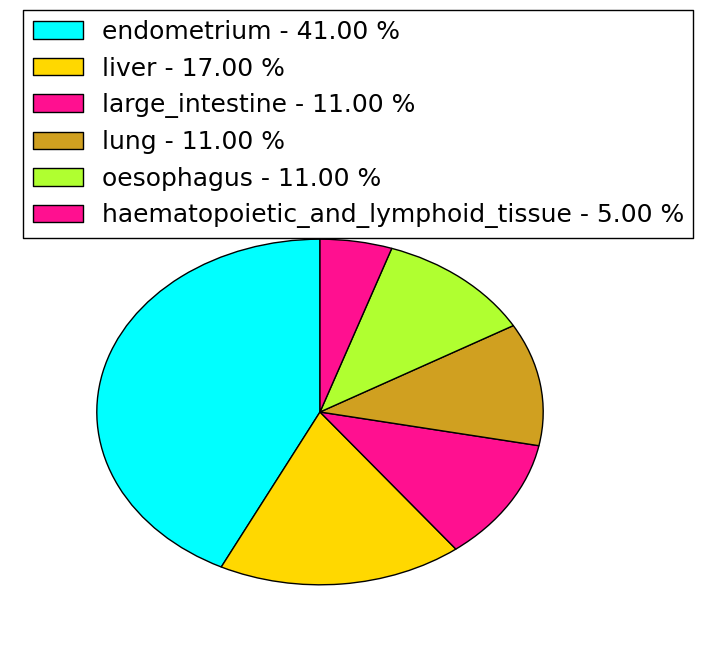
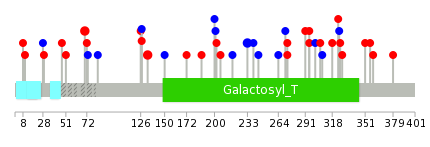
| Stat. for Non-Synonymous SNVs (# total SNVs=28) | (# total SNVs=17) |
 |  |
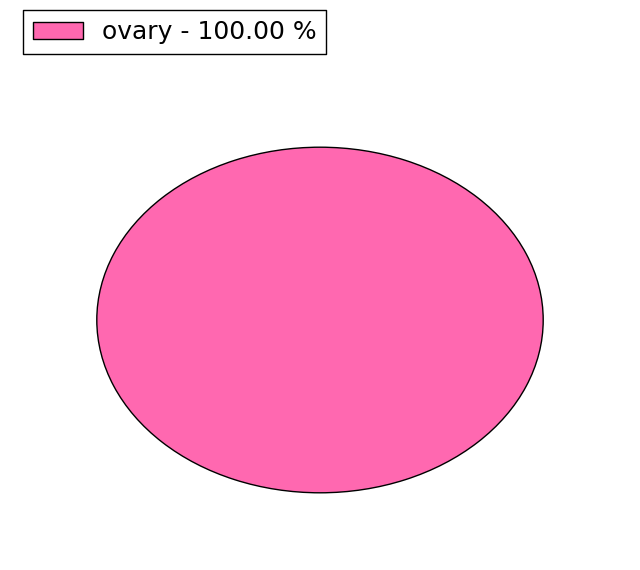
(# total SNVs=0) | (# total SNVs=1) |
 |
| Top |
| * When you move the cursor on each content, you can see more deailed mutation information on the Tooltip. Those are primary_site,primary_histology,mutation(aa),pubmedID. |
| GRCh37 position | Mutation(aa) | Unique sampleID count |
| chr2:232263034-232263034 | p.D202N | 3 |
| chr2:232263022-232263022 | p.R198C | 2 |
| chr2:232263024-232263024 | p.R198R | 2 |
| chr2:232263248-232263248 | p.R273L | 2 |
| chr2:232262827-232262827 | p.D133N | 2 |
| chr2:232263303-232263303 | p.K291N | 2 |
| chr2:232263129-232263129 | p.V233V | 2 |
| chr2:232262941-232262941 | p.V171M | 2 |
| chr2:232262502-232262502 | p.V24V | 2 |
| chr2:232262679-232262679 | p.D83D | 1 |
| Top |
|
 |
| Point Mutation/ Tissue ID | 1 | 2 | 3 | 4 | 5 | 6 | 7 | 8 | 9 | 10 | 11 | 12 | 13 | 14 | 15 | 16 | 17 | 18 | 19 | 20 |
| # sample | 1 | 1 | 9 | 1 | 3 | 1 | 2 | 2 | 7 | 8 | 8 | |||||||||
| # mutation | 1 | 1 | 10 | 1 | 3 | 1 | 2 | 2 | 6 | 8 | 10 | |||||||||
| nonsynonymous SNV | 1 | 1 | 9 | 1 | 1 | 1 | 1 | 2 | 4 | 5 | 3 | |||||||||
| synonymous SNV | 1 | 2 | 1 | 2 | 3 | 7 |
| cf) Tissue ID; Tissue type (1; BLCA[Bladder Urothelial Carcinoma], 2; BRCA[Breast invasive carcinoma], 3; CESC[Cervical squamous cell carcinoma and endocervical adenocarcinoma], 4; COAD[Colon adenocarcinoma], 5; GBM[Glioblastoma multiforme], 6; Glioma Low Grade, 7; HNSC[Head and Neck squamous cell carcinoma], 8; KICH[Kidney Chromophobe], 9; KIRC[Kidney renal clear cell carcinoma], 10; KIRP[Kidney renal papillary cell carcinoma], 11; LAML[Acute Myeloid Leukemia], 12; LUAD[Lung adenocarcinoma], 13; LUSC[Lung squamous cell carcinoma], 14; OV[Ovarian serous cystadenocarcinoma ], 15; PAAD[Pancreatic adenocarcinoma], 16; PRAD[Prostate adenocarcinoma], 17; SKCM[Skin Cutaneous Melanoma], 18:STAD[Stomach adenocarcinoma], 19:THCA[Thyroid carcinoma], 20:UCEC[Uterine Corpus Endometrial Carcinoma]) |
| Top |
| * We represented just top 10 SNVs. When you move the cursor on each content, you can see more deailed mutation information on the Tooltip. Those are primary_site, primary_histology, mutation(aa), pubmedID. |
| Genomic Position | Mutation(aa) | Unique sampleID count |
| chr2:232263248 | p.A70S | 2 |
| chr2:232262638 | p.V233V | 2 |
| chr2:232263129 | p.R273L | 2 |
| chr2:232262827 | p.D133N | 2 |
| chr2:232262880 | p.V328I | 1 |
| chr2:232263222 | p.T72M | 1 |
| chr2:232262571 | p.G239G | 1 |
| chr2:232263405 | p.G351D | 1 |
| chr2:232262945 | p.P73P | 1 |
| chr2:232263243 | p.F244F | 1 |
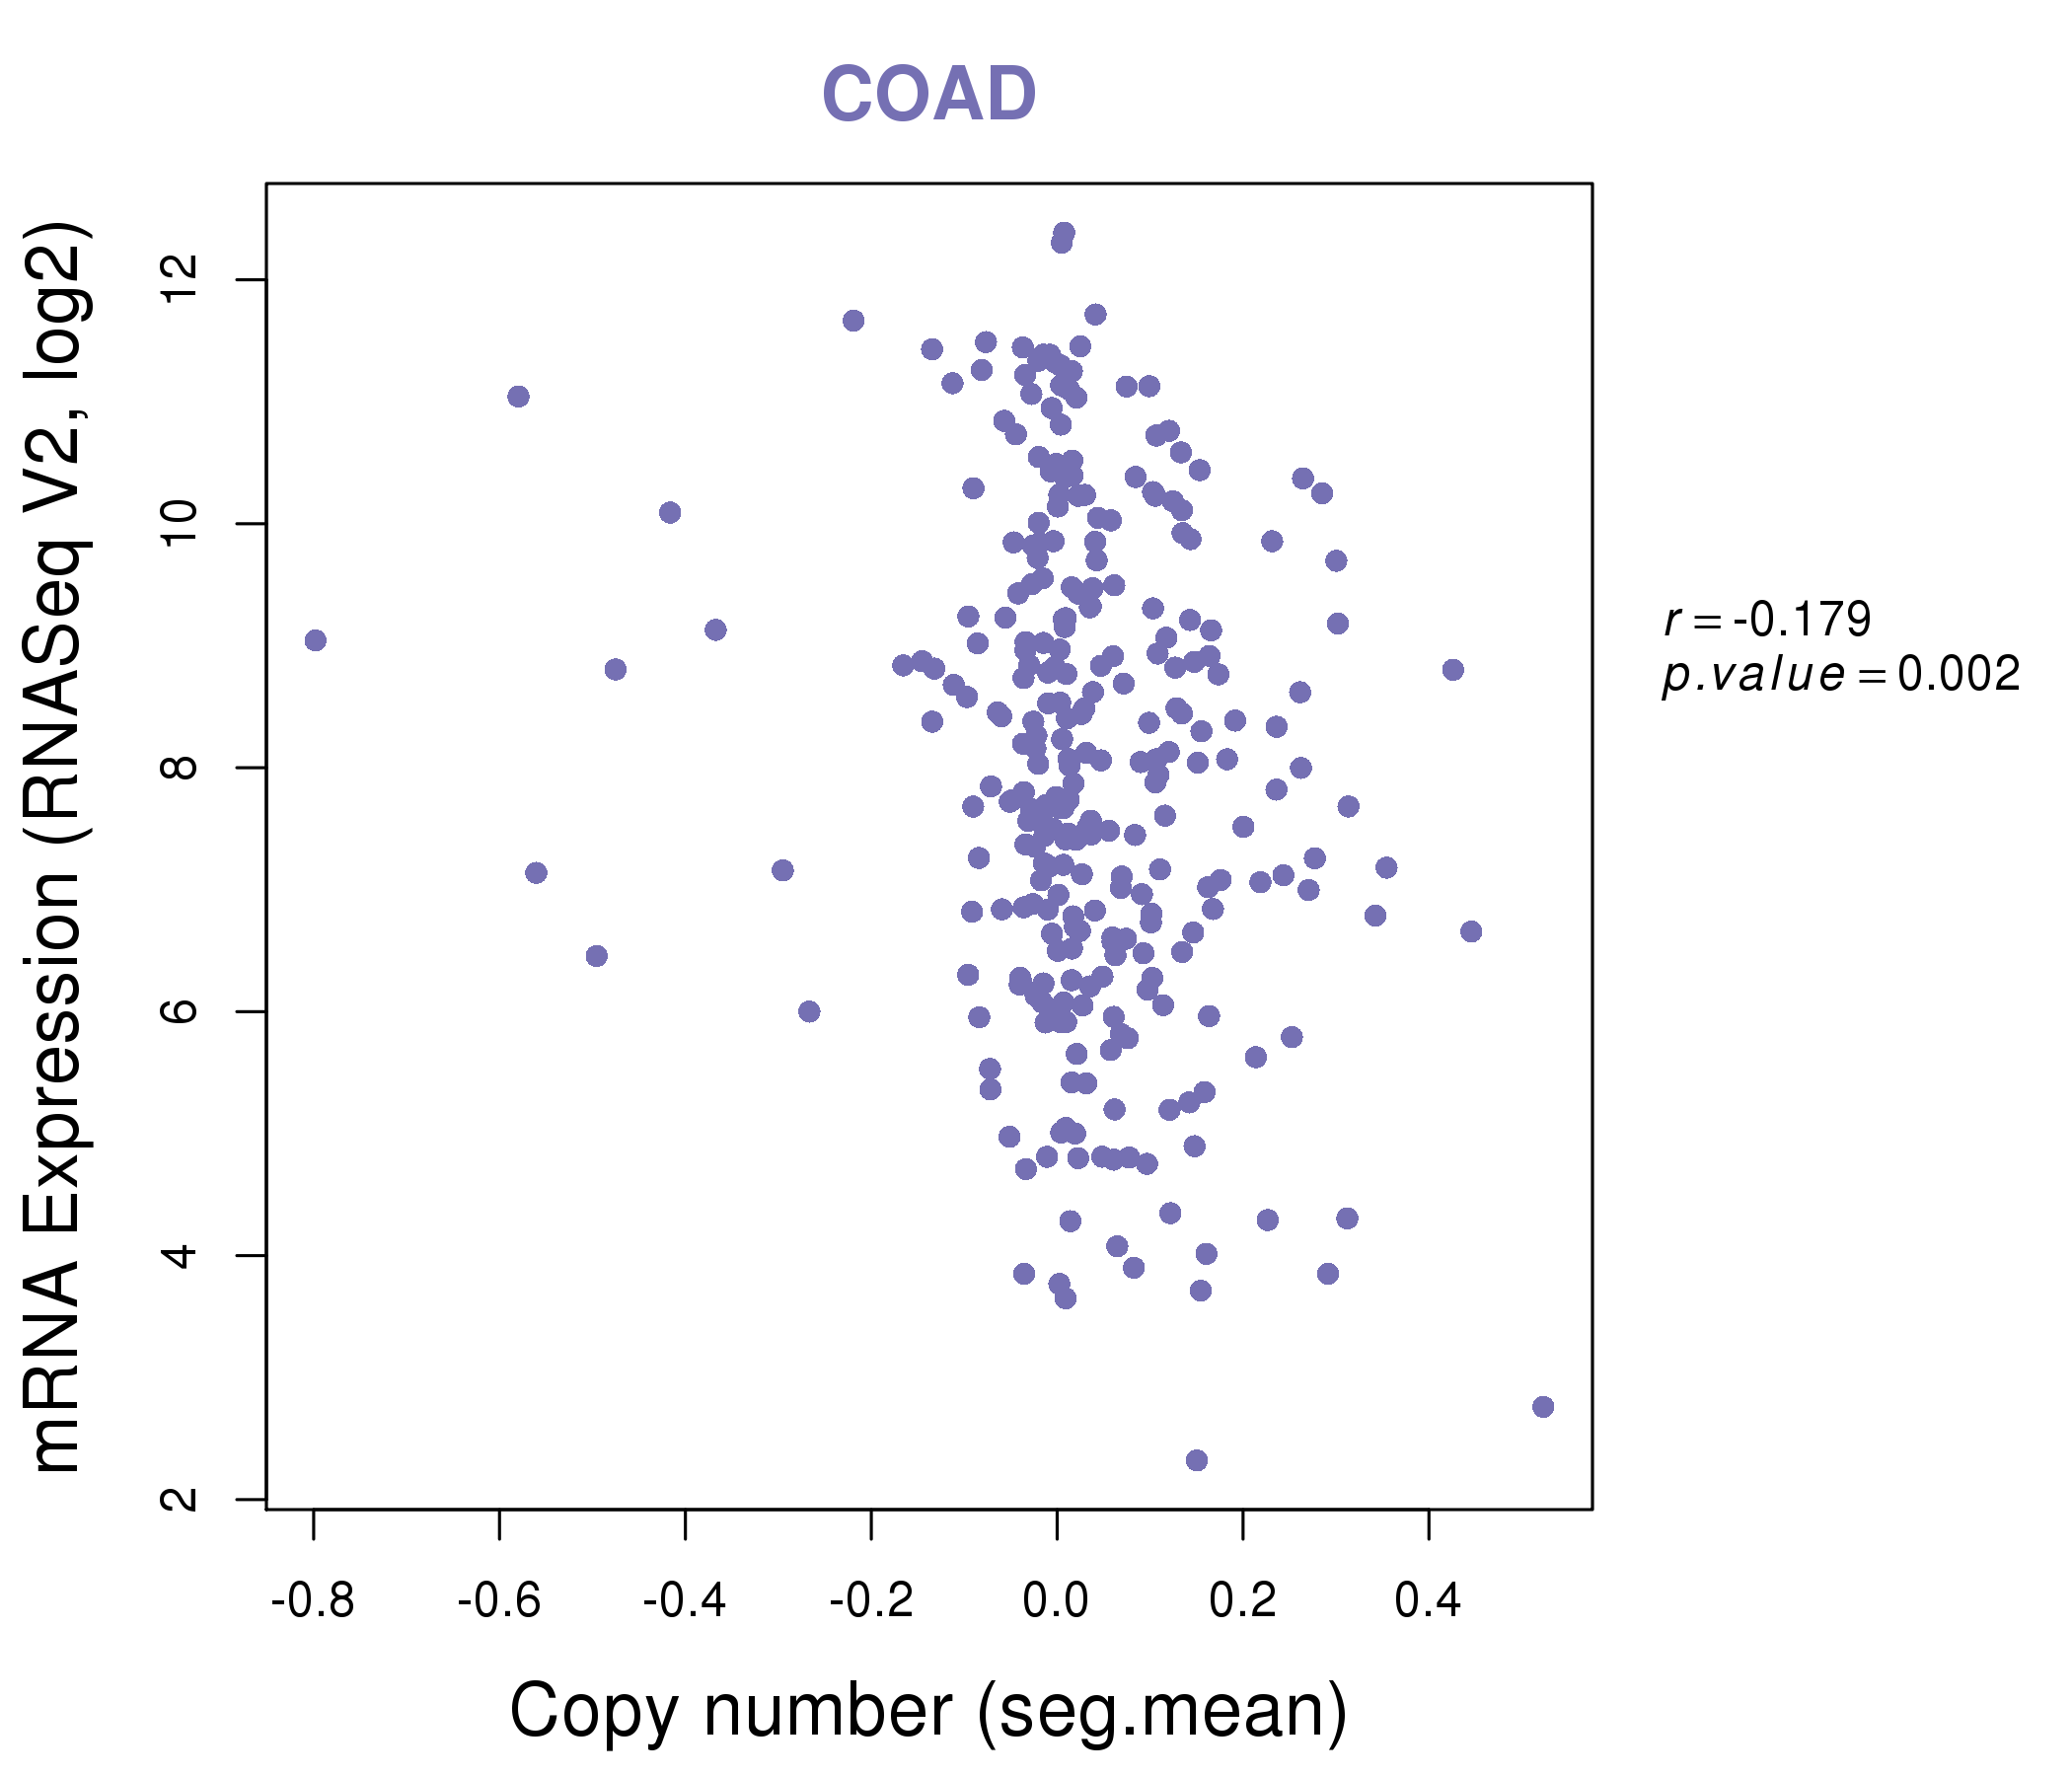
| * Copy number data were extracted from TCGA using R package TCGA-Assembler. The URLs of all public data files on TCGA DCC data server were gathered on Jan-05-2015. Function ProcessCNAData in TCGA-Assembler package was used to obtain gene-level copy number value which is calculated as the average copy number of the genomic region of a gene. |
 |
| cf) Tissue ID[Tissue type]: BLCA[Bladder Urothelial Carcinoma], BRCA[Breast invasive carcinoma], CESC[Cervical squamous cell carcinoma and endocervical adenocarcinoma], COAD[Colon adenocarcinoma], GBM[Glioblastoma multiforme], Glioma Low Grade, HNSC[Head and Neck squamous cell carcinoma], KICH[Kidney Chromophobe], KIRC[Kidney renal clear cell carcinoma], KIRP[Kidney renal papillary cell carcinoma], LAML[Acute Myeloid Leukemia], LUAD[Lung adenocarcinoma], LUSC[Lung squamous cell carcinoma], OV[Ovarian serous cystadenocarcinoma ], PAAD[Pancreatic adenocarcinoma], PRAD[Prostate adenocarcinoma], SKCM[Skin Cutaneous Melanoma], STAD[Stomach adenocarcinoma], THCA[Thyroid carcinoma], UCEC[Uterine Corpus Endometrial Carcinoma] |
| Top |
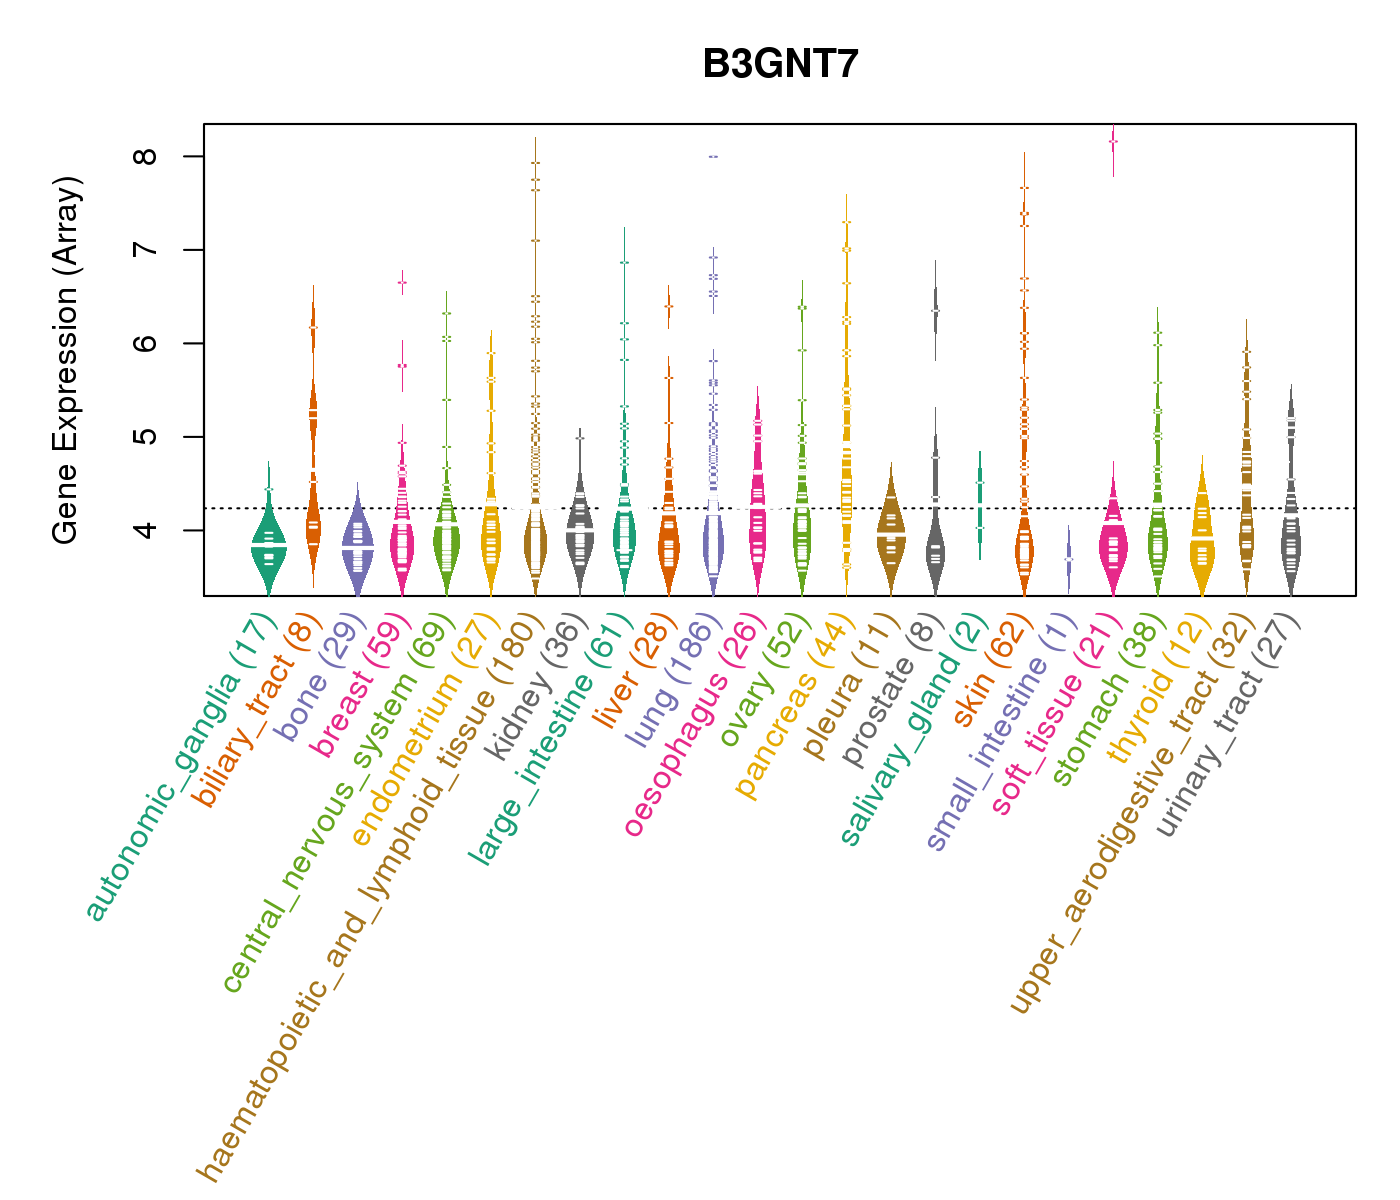
| Gene Expression for B3GNT7 |
| * CCLE gene expression data were extracted from CCLE_Expression_Entrez_2012-10-18.res: Gene-centric RMA-normalized mRNA expression data. |
 |
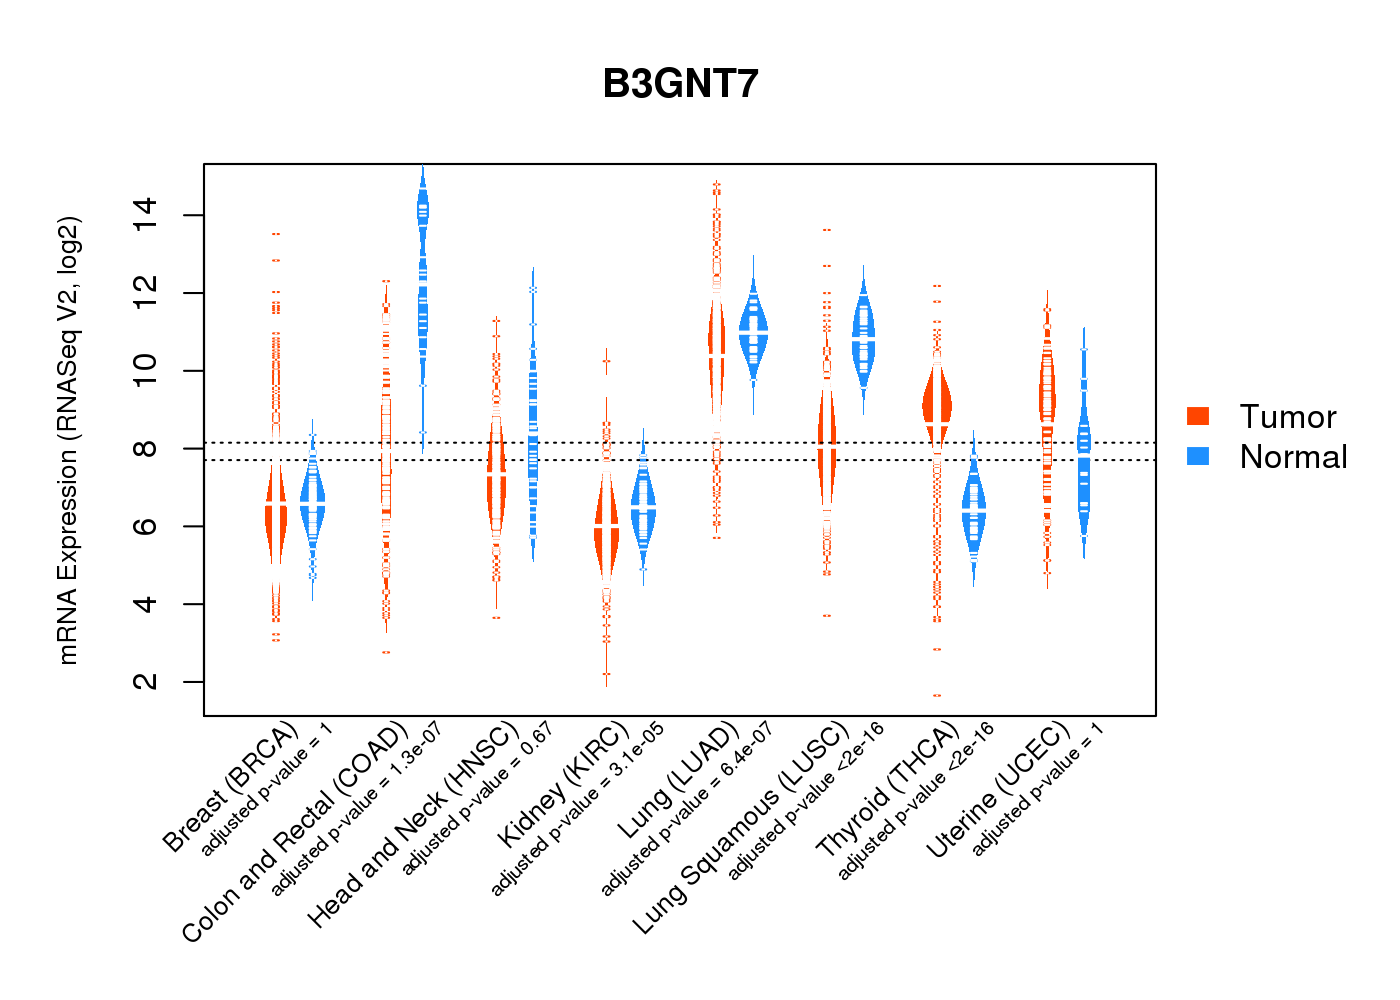
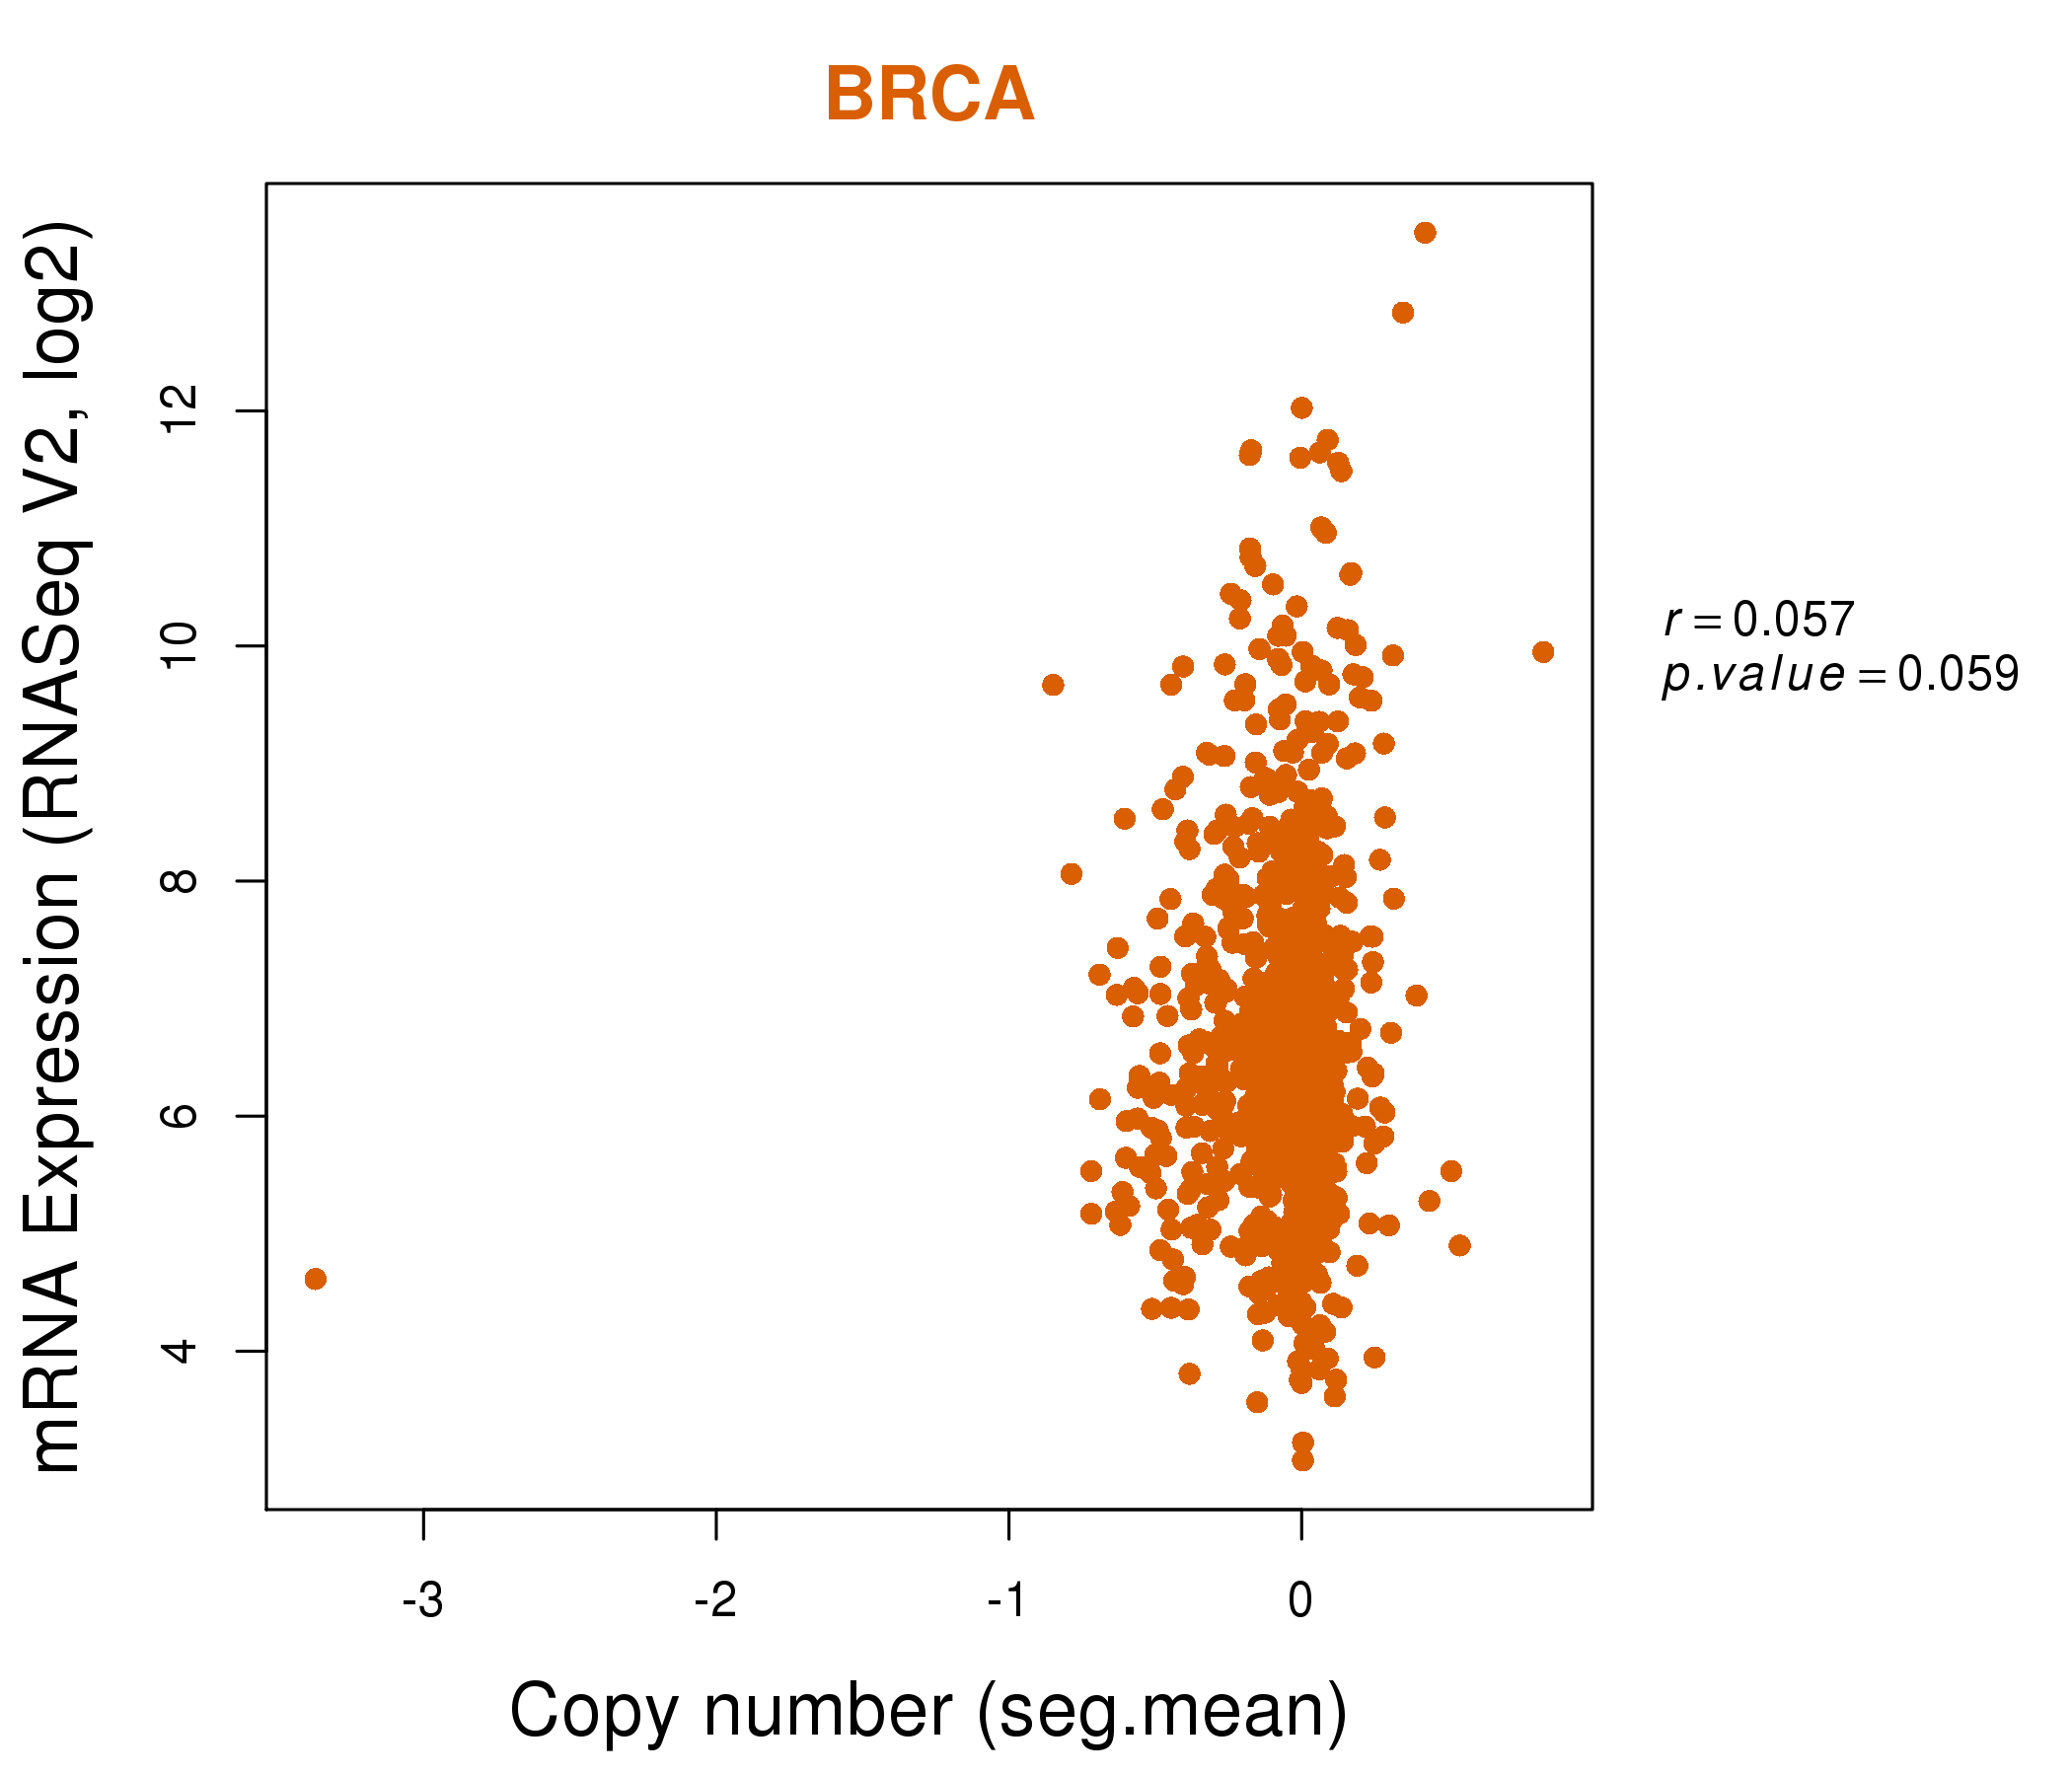
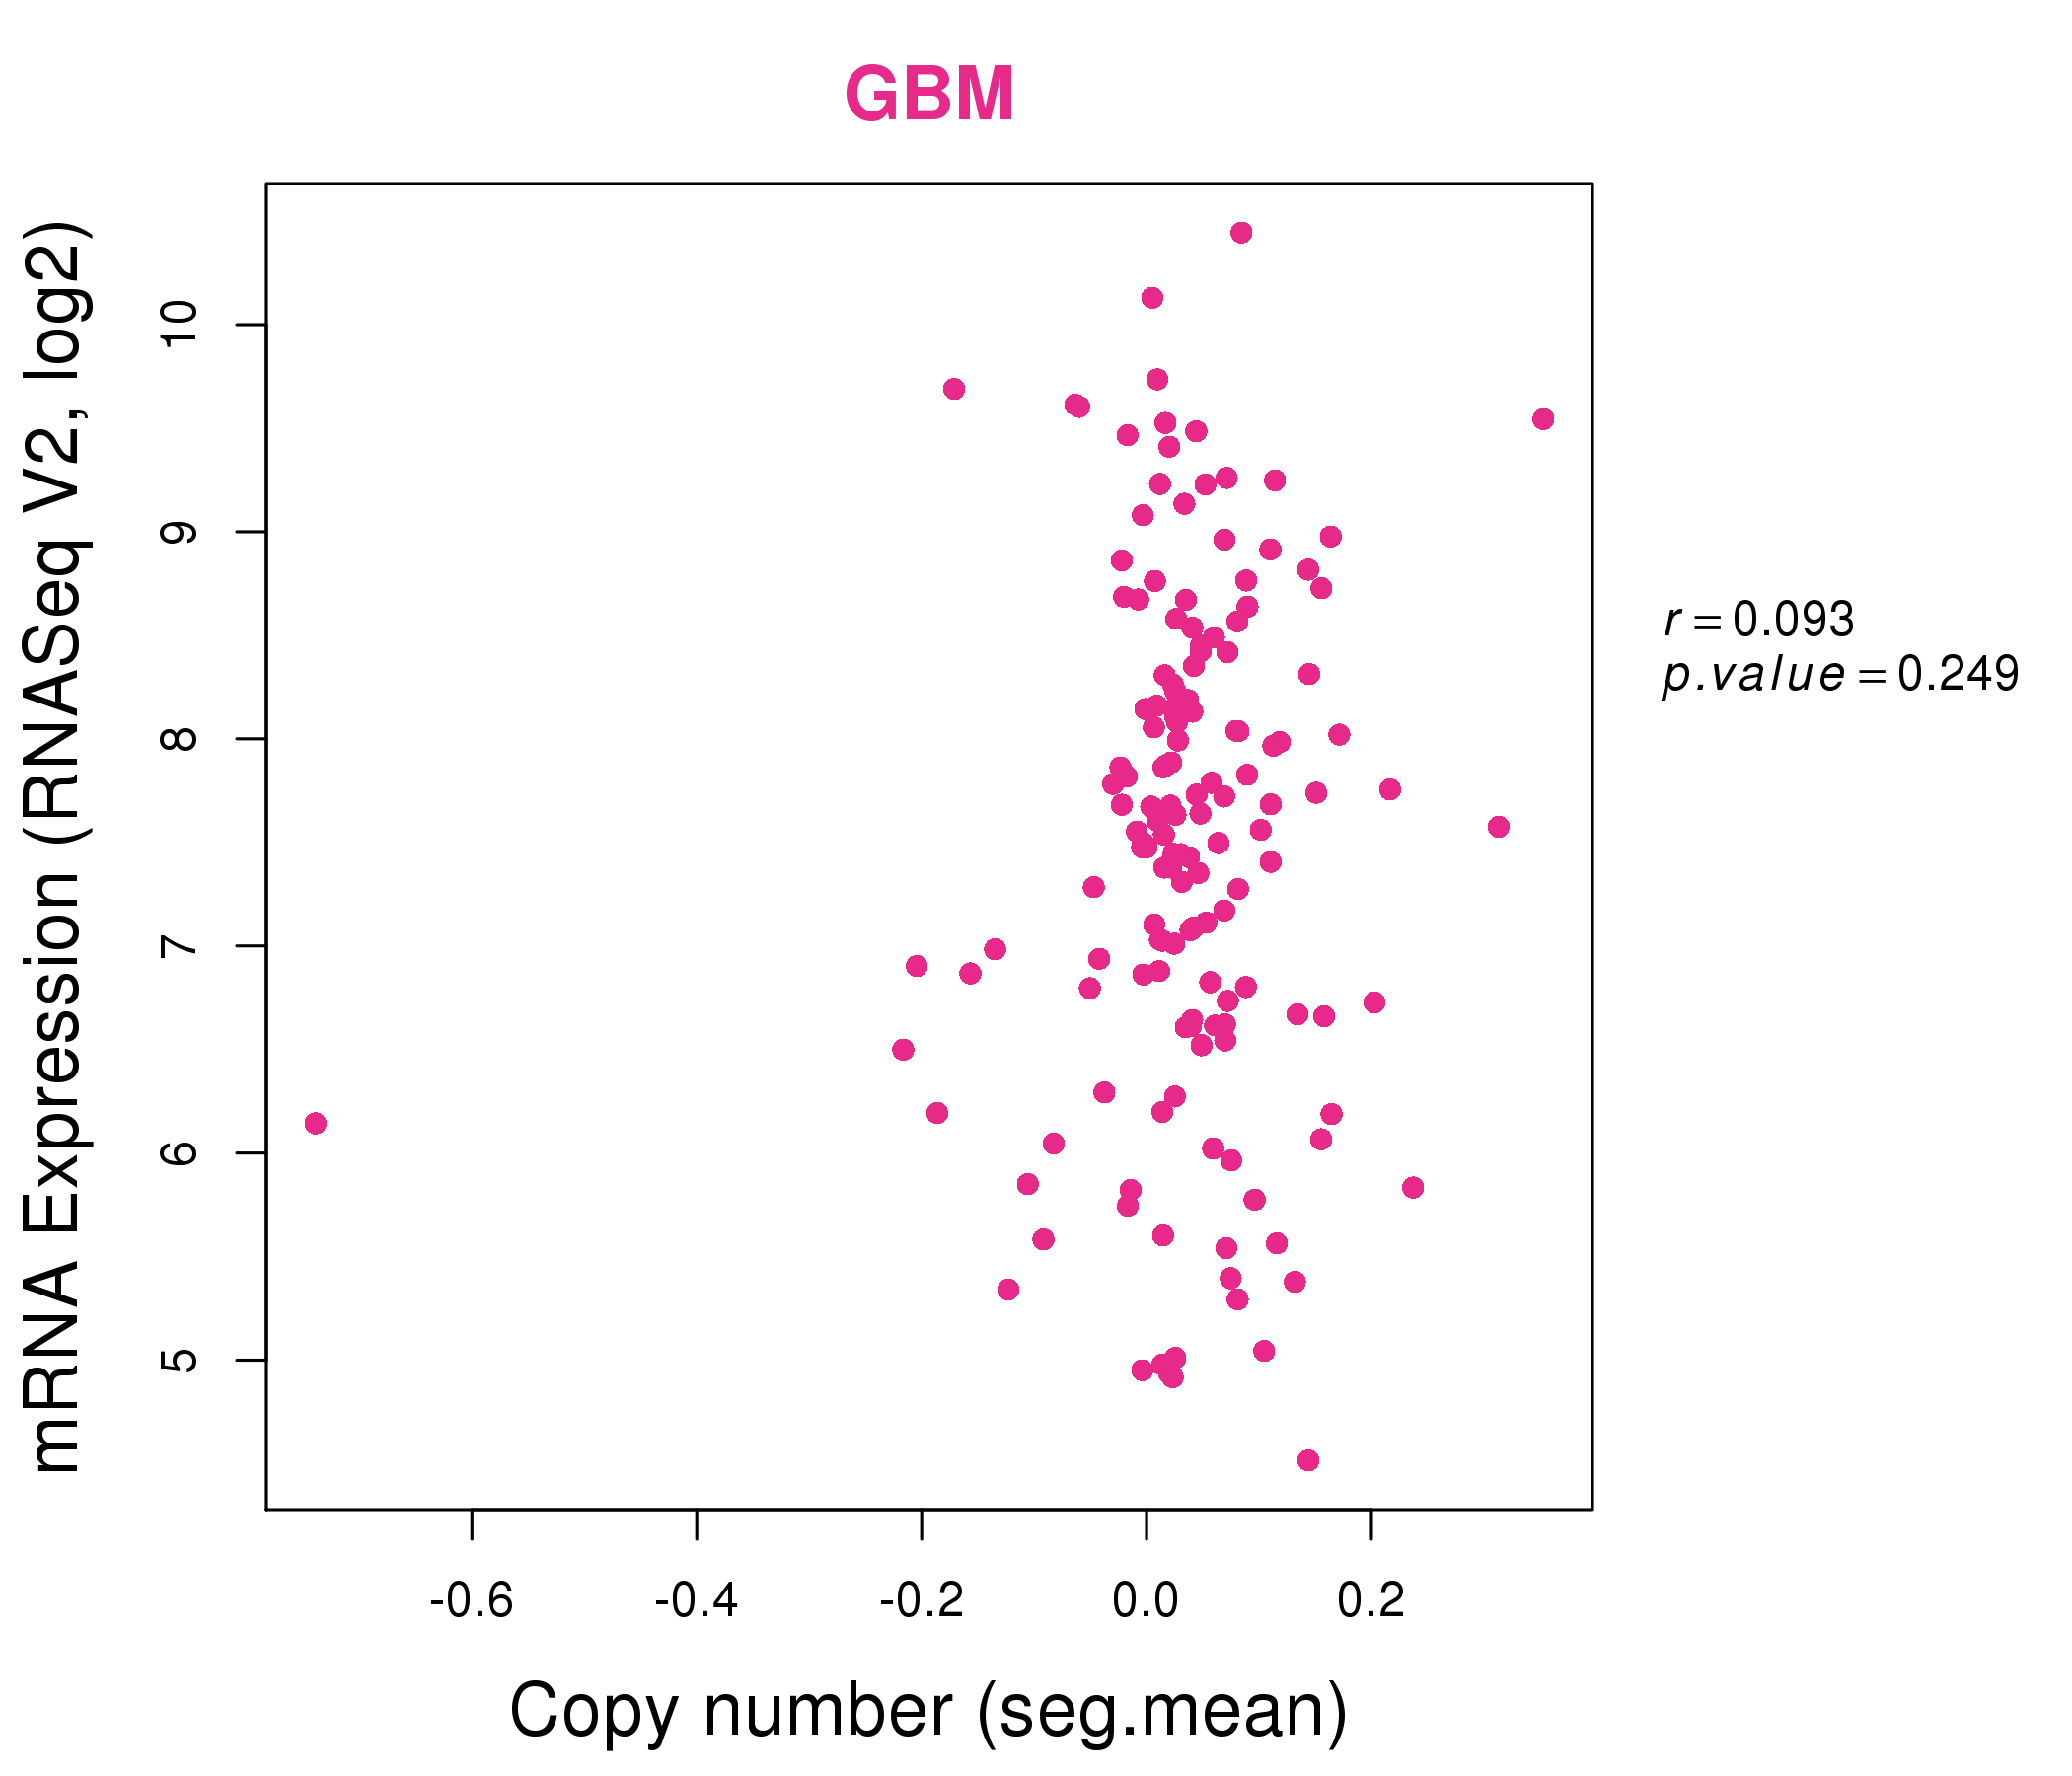
| * Normalized gene expression data of RNASeqV2 was extracted from TCGA using R package TCGA-Assembler. The URLs of all public data files on TCGA DCC data server were gathered at Jan-05-2015. Only eight cancer types have enough normal control samples for differential expression analysis. (t test, adjusted p<0.05 (using Benjamini-Hochberg FDR)) |
 |
| Top |
| * This plots show the correlation between CNV and gene expression. |
: Open all plots for all cancer types
 |
|
 |
|
| Top |
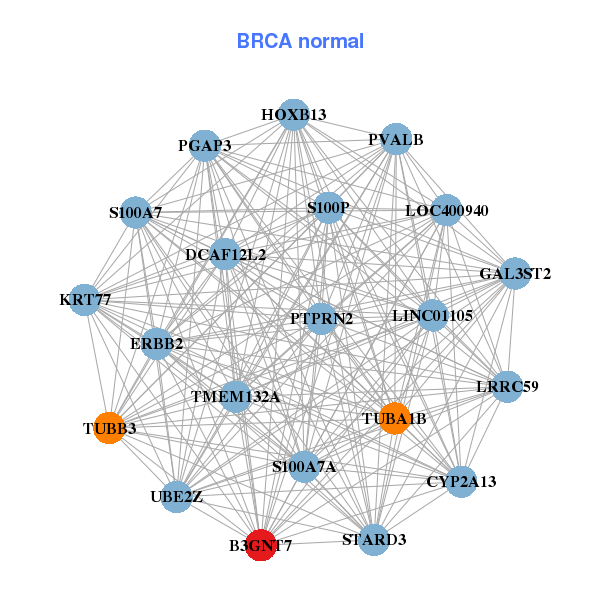
| Gene-Gene Network Information |
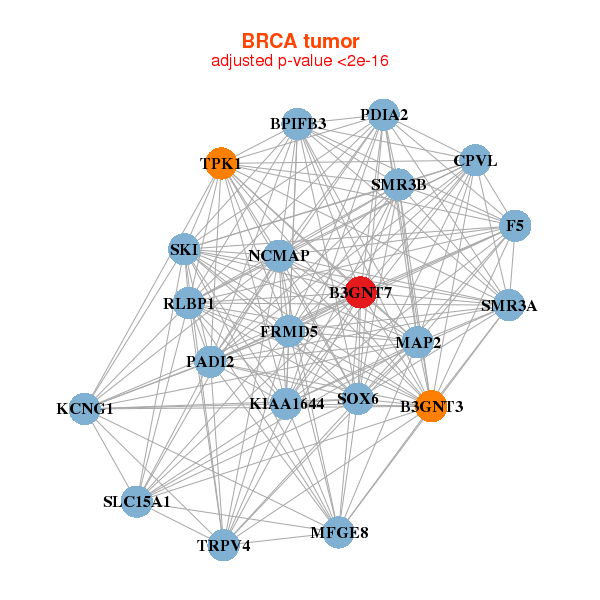
| * Co-Expression network figures were drawn using R package igraph. Only the top 20 genes with the highest correlations were shown. Red circle: input gene, orange circle: cell metabolism gene, sky circle: other gene |
: Open all plots for all cancer types
 |
|
| B3GNT3,B3GNT7,NCMAP,BPIFB3,CPVL,F5,FRMD5, KCNG1,KIAA1644,MAP2,MFGE8,PADI2,PDIA2,RLBP1, SKI,SLC15A1,SMR3A,SMR3B,SOX6,TPK1,TRPV4 | B3GNT7,CYP2A13,DCAF12L2,ERBB2,GAL3ST2,HOXB13,KRT77, LINC01105,LOC400940,LRRC59,PGAP3,PTPRN2,PVALB,S100A7, S100A7A,S100P,STARD3,TMEM132A,TUBA1B,TUBB3,UBE2Z |
 |
|
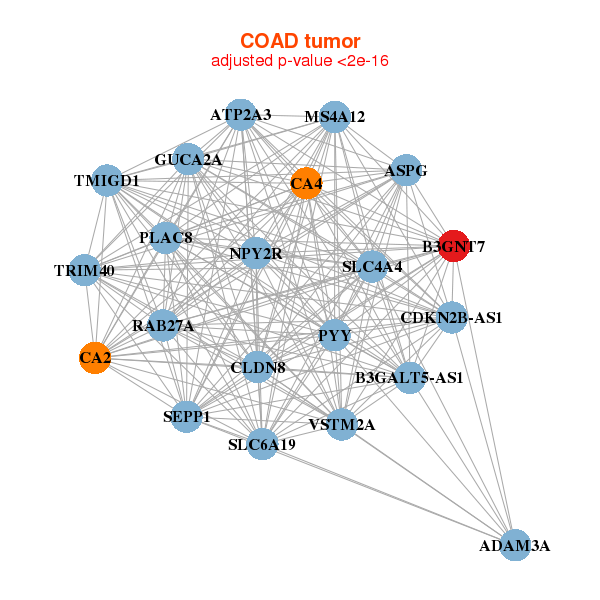
| ADAM3A,ASPG,ATP2A3,B3GNT7,B3GALT5-AS1,CA2,CA4, CDKN2B-AS1,CLDN8,GUCA2A,MS4A12,NPY2R,PLAC8,PYY, RAB27A,SEPP1,SLC4A4,SLC6A19,TMIGD1,TRIM40,VSTM2A | B3GNT7,PRAC2,B3GALT5-AS1,CLDN8,CPA6,CRYBA2,CT62, FBXO25,FOXA2,HOXB13,IGSF5,KLRG2,LOC284578,MFSD4, NEBL,NRAP,SLC2A10,SPON1,ST6GALNAC6,TGM3,WFDC2 |

| * Co-Expression network figures were drawn using R package igraph. Only the top 20 genes with the highest correlations were shown. Red circle: input gene, orange circle: cell metabolism gene, sky circle: other gene |
: Open all plots for all cancer types
| Top |
: Open all interacting genes' information including KEGG pathway for all interacting genes from DAVID
| Top |
| Pharmacological Information for B3GNT7 |
| There's no related Drug. |
| Top |
| Cross referenced IDs for B3GNT7 |
| * We obtained these cross-references from Uniprot database. It covers 150 different DBs, 18 categories. http://www.uniprot.org/help/cross_references_section |
: Open all cross reference information
|
Copyright © 2016-Present - The Univsersity of Texas Health Science Center at Houston @ |