|
||||||||||||||||||||||||||||||||||||||||||||||||||||||||||||||||||||||||||||||||||||||||||||||||||||||||||||||||||||||||||||||||||||||||||||||||||||||||||||||||||||||||||||||||||||||||||||||||||||||||||||||||||||||||||||||||||||||||||||||||||||||||||||||||||||||||||||||||||||||||||||||||||||||||||||||||||||||||||
| |
| Phenotypic Information (metabolism pathway, cancer, disease, phenome) |
| |
| |
| Gene-Gene Network Information: Co-Expression Network, Interacting Genes & KEGG |
| |
|


| Gene Summary for B4GALT5 |
| Basic gene info. | Gene symbol | B4GALT5 |
| Gene name | UDP-Gal:betaGlcNAc beta 1,4- galactosyltransferase, polypeptide 5 | |
| Synonyms | B4Gal-T5|BETA4-GALT-IV|beta4Gal-T5|beta4GalT-V|gt-V | |
| Cytomap | UCSC genome browser: 20q13.1-q13.2 | |
| Genomic location | chr20 :48249482-48330421 | |
| Type of gene | protein-coding | |
| RefGenes | NM_004776.3, | |
| Ensembl id | ENSG00000158470 | |
| Description | UDP-Gal:beta-GlcNAc beta-1,4-galactosyltransferase 5UDP-Gal:betaGlcNAc beta 1,4-galactosyltransferase, polypeptide 5UDP-galactose:beta-N-acetylglucosamine beta-1,4-galactosyltransferase 5beta-1,4-GalT IIbeta-1,4-GalT IVbeta-1,4-GalTase 5beta-1,4-gal | |
| Modification date | 20141207 | |
| dbXrefs | MIM : 604016 | |
| HGNC : HGNC | ||
| Ensembl : ENSG00000158470 | ||
| HPRD : 06807 | ||
| Vega : OTTHUMG00000033086 | ||
| Protein | UniProt: go to UniProt's Cross Reference DB Table | |
| Expression | CleanEX: HS_B4GALT5 | |
| BioGPS: 9334 | ||
| Gene Expression Atlas: ENSG00000158470 | ||
| The Human Protein Atlas: ENSG00000158470 | ||
| Pathway | NCI Pathway Interaction Database: B4GALT5 | |
| KEGG: B4GALT5 | ||
| REACTOME: B4GALT5 | ||
| ConsensusPathDB | ||
| Pathway Commons: B4GALT5 | ||
| Metabolism | MetaCyc: B4GALT5 | |
| HUMANCyc: B4GALT5 | ||
| Regulation | Ensembl's Regulation: ENSG00000158470 | |
| miRBase: chr20 :48,249,482-48,330,421 | ||
| TargetScan: NM_004776 | ||
| cisRED: ENSG00000158470 | ||
| Context | iHOP: B4GALT5 | |
| cancer metabolism search in PubMed: B4GALT5 | ||
| UCL Cancer Institute: B4GALT5 | ||
| Assigned class in ccmGDB | C | |
| Top |
| Phenotypic Information for B4GALT5(metabolism pathway, cancer, disease, phenome) |
| Cancer | CGAP: B4GALT5 |
| Familial Cancer Database: B4GALT5 | |
| * This gene is included in those cancer gene databases. |
|
|
|
|
|
| . | ||||||||||||||||||||||||||||||||||||||||||||||||||||||||||||||||||||||||||||||||||||||||||||||||||||||||||||||||||||||||||||||||||||||||||||||||||||||||||||||||||||||||||||||||||||||||||||||||||||||||||||||||||||||||||||||||||||||||||||||||||||||||||||||||||||||||||||||||||||||||||||||||||||||||||||||||||||
Oncogene 1 | Significant driver gene in | |||||||||||||||||||||||||||||||||||||||||||||||||||||||||||||||||||||||||||||||||||||||||||||||||||||||||||||||||||||||||||||||||||||||||||||||||||||||||||||||||||||||||||||||||||||||||||||||||||||||||||||||||||||||||||||||||||||||||||||||||||||||||||||||||||||||||||||||||||||||||||||||||||||||||||||||||||||||||
| cf) number; DB name 1 Oncogene; http://nar.oxfordjournals.org/content/35/suppl_1/D721.long, 2 Tumor Suppressor gene; https://bioinfo.uth.edu/TSGene/, 3 Cancer Gene Census; http://www.nature.com/nrc/journal/v4/n3/abs/nrc1299.html, 4 CancerGenes; http://nar.oxfordjournals.org/content/35/suppl_1/D721.long, 5 Network of Cancer Gene; http://ncg.kcl.ac.uk/index.php, 1Therapeutic Vulnerabilities in Cancer; http://cbio.mskcc.org/cancergenomics/statius/ |
| REACTOME_METABOLISM_OF_PROTEINS REACTOME_METABOLISM_OF_CARBOHYDRATES | |
| Mutations for B4GALT5 |
| * Under tables are showing count per each tissue to give us broad intuition about tissue specific mutation patterns.You can go to the detailed page for each mutation database's web site. |
| There's no structural variation information in COSMIC data for this gene. |
| * From mRNA Sanger sequences, Chitars2.0 arranged chimeric transcripts. This table shows B4GALT5 related fusion information. |
| ID | Head Gene | Tail Gene | Accession | Gene_a | qStart_a | qEnd_a | Chromosome_a | tStart_a | tEnd_a | Gene_a | qStart_a | qEnd_a | Chromosome_a | tStart_a | tEnd_a |
| BG766572 | NIPAL3 | 1 | 371 | 1 | 24797418 | 24797788 | B4GALT5 | 366 | 822 | 20 | 48250693 | 48251153 | |
| DB237731 | SLC12A6 | 1 | 227 | 15 | 34610762 | 34610988 | B4GALT5 | 225 | 565 | 20 | 48260099 | 48273242 | |
| BF812681 | B4GALT5 | 8 | 207 | 20 | 48252621 | 48252821 | PTK7 | 199 | 303 | 6 | 43113045 | 43113150 | |
| BU955750 | B4GALT5 | 3 | 387 | 20 | 48252534 | 48252918 | HSP90AA1 | 382 | 666 | 14 | 102549382 | 102549908 | |
| CN280929 | SNX2 | 1 | 207 | 5 | 122110818 | 122131078 | B4GALT5 | 204 | 468 | 20 | 48249492 | 48249756 | |
| CX164716 | B4GALT5 | 1 | 177 | 20 | 48250835 | 48251011 | CKB | 178 | 574 | 14 | 103987747 | 103988721 | |
| AW376281 | B4GALT5 | 6 | 390 | 20 | 48252553 | 48252939 | HNRNPA1 | 382 | 619 | 12 | 54676361 | 54676937 | |
| AA902204 | TAF5L | 1 | 328 | 1 | 229728915 | 229729242 | B4GALT5 | 326 | 584 | 20 | 48252844 | 48253983 | |
| AI207637 | DHCR24 | 1 | 533 | 1 | 55316503 | 55317035 | B4GALT5 | 518 | 631 | 20 | 48252183 | 48252296 | |
| BF851864 | B4GALT5 | 2 | 219 | 20 | 48276918 | 48277135 | FBXW4 | 212 | 373 | 10 | 103432775 | 103433376 | |
| Top |
| Mutation type/ Tissue ID | brca | cns | cerv | endome | haematopo | kidn | Lintest | liver | lung | ns | ovary | pancre | prost | skin | stoma | thyro | urina | |||
| Total # sample | 6 | 1 | 1 | 1 | 1 | |||||||||||||||
| GAIN (# sample) | 6 | 1 | 1 | 1 | 1 | |||||||||||||||
| LOSS (# sample) |
| cf) Tissue ID; Tissue type (1; Breast, 2; Central_nervous_system, 3; Cervix, 4; Endometrium, 5; Haematopoietic_and_lymphoid_tissue, 6; Kidney, 7; Large_intestine, 8; Liver, 9; Lung, 10; NS, 11; Ovary, 12; Pancreas, 13; Prostate, 14; Skin, 15; Stomach, 16; Thyroid, 17; Urinary_tract) |
| Top |
|
 |
| Top |
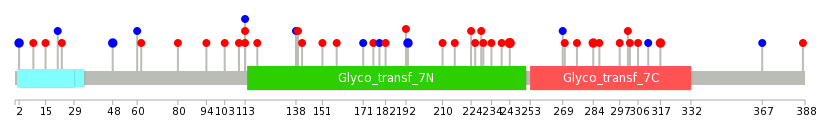
| Stat. for Non-Synonymous SNVs (# total SNVs=32) | (# total SNVs=11) |
 |  |
(# total SNVs=1) | (# total SNVs=0) |
 |
| Top |
| * When you move the cursor on each content, you can see more deailed mutation information on the Tooltip. Those are primary_site,primary_histology,mutation(aa),pubmedID. |
| GRCh37 position | Mutation(aa) | Unique sampleID count |
| chr20:48257081-48257081 | p.R243H | 3 |
| chr20:48330222-48330222 | p.R2R | 2 |
| chr20:48256282-48256282 | p.R284W | 2 |
| chr20:48259034-48259034 | p.L193L | 2 |
| chr20:48253947-48253947 | p.P317L | 2 |
| chr20:48273211-48273211 | p.A48A | 2 |
| chr20:48259098-48259098 | p.R171R | 1 |
| chr20:48256231-48256231 | p.D301H | 1 |
| chr20:48263558-48263558 | p.P103L | 1 |
| chr20:48257123-48257123 | p.C229Y | 1 |
| Top |
|
 |
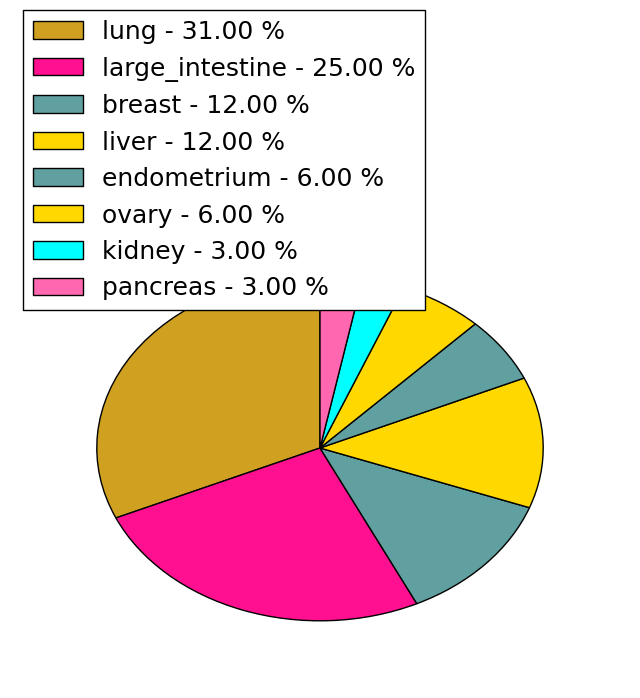
| Point Mutation/ Tissue ID | 1 | 2 | 3 | 4 | 5 | 6 | 7 | 8 | 9 | 10 | 11 | 12 | 13 | 14 | 15 | 16 | 17 | 18 | 19 | 20 |
| # sample | 2 | 6 | 2 | 2 | 4 | 3 | 2 | 3 | 5 | 3 | ||||||||||
| # mutation | 2 | 7 | 2 | 2 | 4 | 3 | 2 | 3 | 5 | 3 | ||||||||||
| nonsynonymous SNV | 2 | 5 | 2 | 1 | 3 | 2 | 2 | 2 | 5 | 2 | ||||||||||
| synonymous SNV | 2 | 1 | 1 | 1 | 1 | 1 |
| cf) Tissue ID; Tissue type (1; BLCA[Bladder Urothelial Carcinoma], 2; BRCA[Breast invasive carcinoma], 3; CESC[Cervical squamous cell carcinoma and endocervical adenocarcinoma], 4; COAD[Colon adenocarcinoma], 5; GBM[Glioblastoma multiforme], 6; Glioma Low Grade, 7; HNSC[Head and Neck squamous cell carcinoma], 8; KICH[Kidney Chromophobe], 9; KIRC[Kidney renal clear cell carcinoma], 10; KIRP[Kidney renal papillary cell carcinoma], 11; LAML[Acute Myeloid Leukemia], 12; LUAD[Lung adenocarcinoma], 13; LUSC[Lung squamous cell carcinoma], 14; OV[Ovarian serous cystadenocarcinoma ], 15; PAAD[Pancreatic adenocarcinoma], 16; PRAD[Prostate adenocarcinoma], 17; SKCM[Skin Cutaneous Melanoma], 18:STAD[Stomach adenocarcinoma], 19:THCA[Thyroid carcinoma], 20:UCEC[Uterine Corpus Endometrial Carcinoma]) |
| Top |
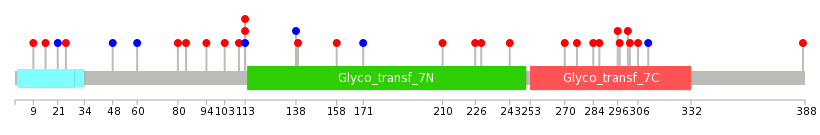
| * We represented just top 10 SNVs. When you move the cursor on each content, you can see more deailed mutation information on the Tooltip. Those are primary_site, primary_histology, mutation(aa), pubmedID. |
| Genomic Position | Mutation(aa) | Unique sampleID count |
| chr20:48330165 | p.D226Y | 1 |
| chr20:48256306 | p.S25L | 1 |
| chr20:48263528 | p.R210Q | 1 |
| chr20:48330184 | p.F21F | 1 |
| chr20:48256324 | p.R171R | 1 |
| chr20:48263529 | p.L15Q | 1 |
| chr20:48252856 | p.E387V | 1 |
| chr20:48330202 | p.C158R | 1 |
| chr20:48257081 | p.R9L | 1 |
| chr20:48263537 | p.G311G | 1 |
| * Copy number data were extracted from TCGA using R package TCGA-Assembler. The URLs of all public data files on TCGA DCC data server were gathered on Jan-05-2015. Function ProcessCNAData in TCGA-Assembler package was used to obtain gene-level copy number value which is calculated as the average copy number of the genomic region of a gene. |
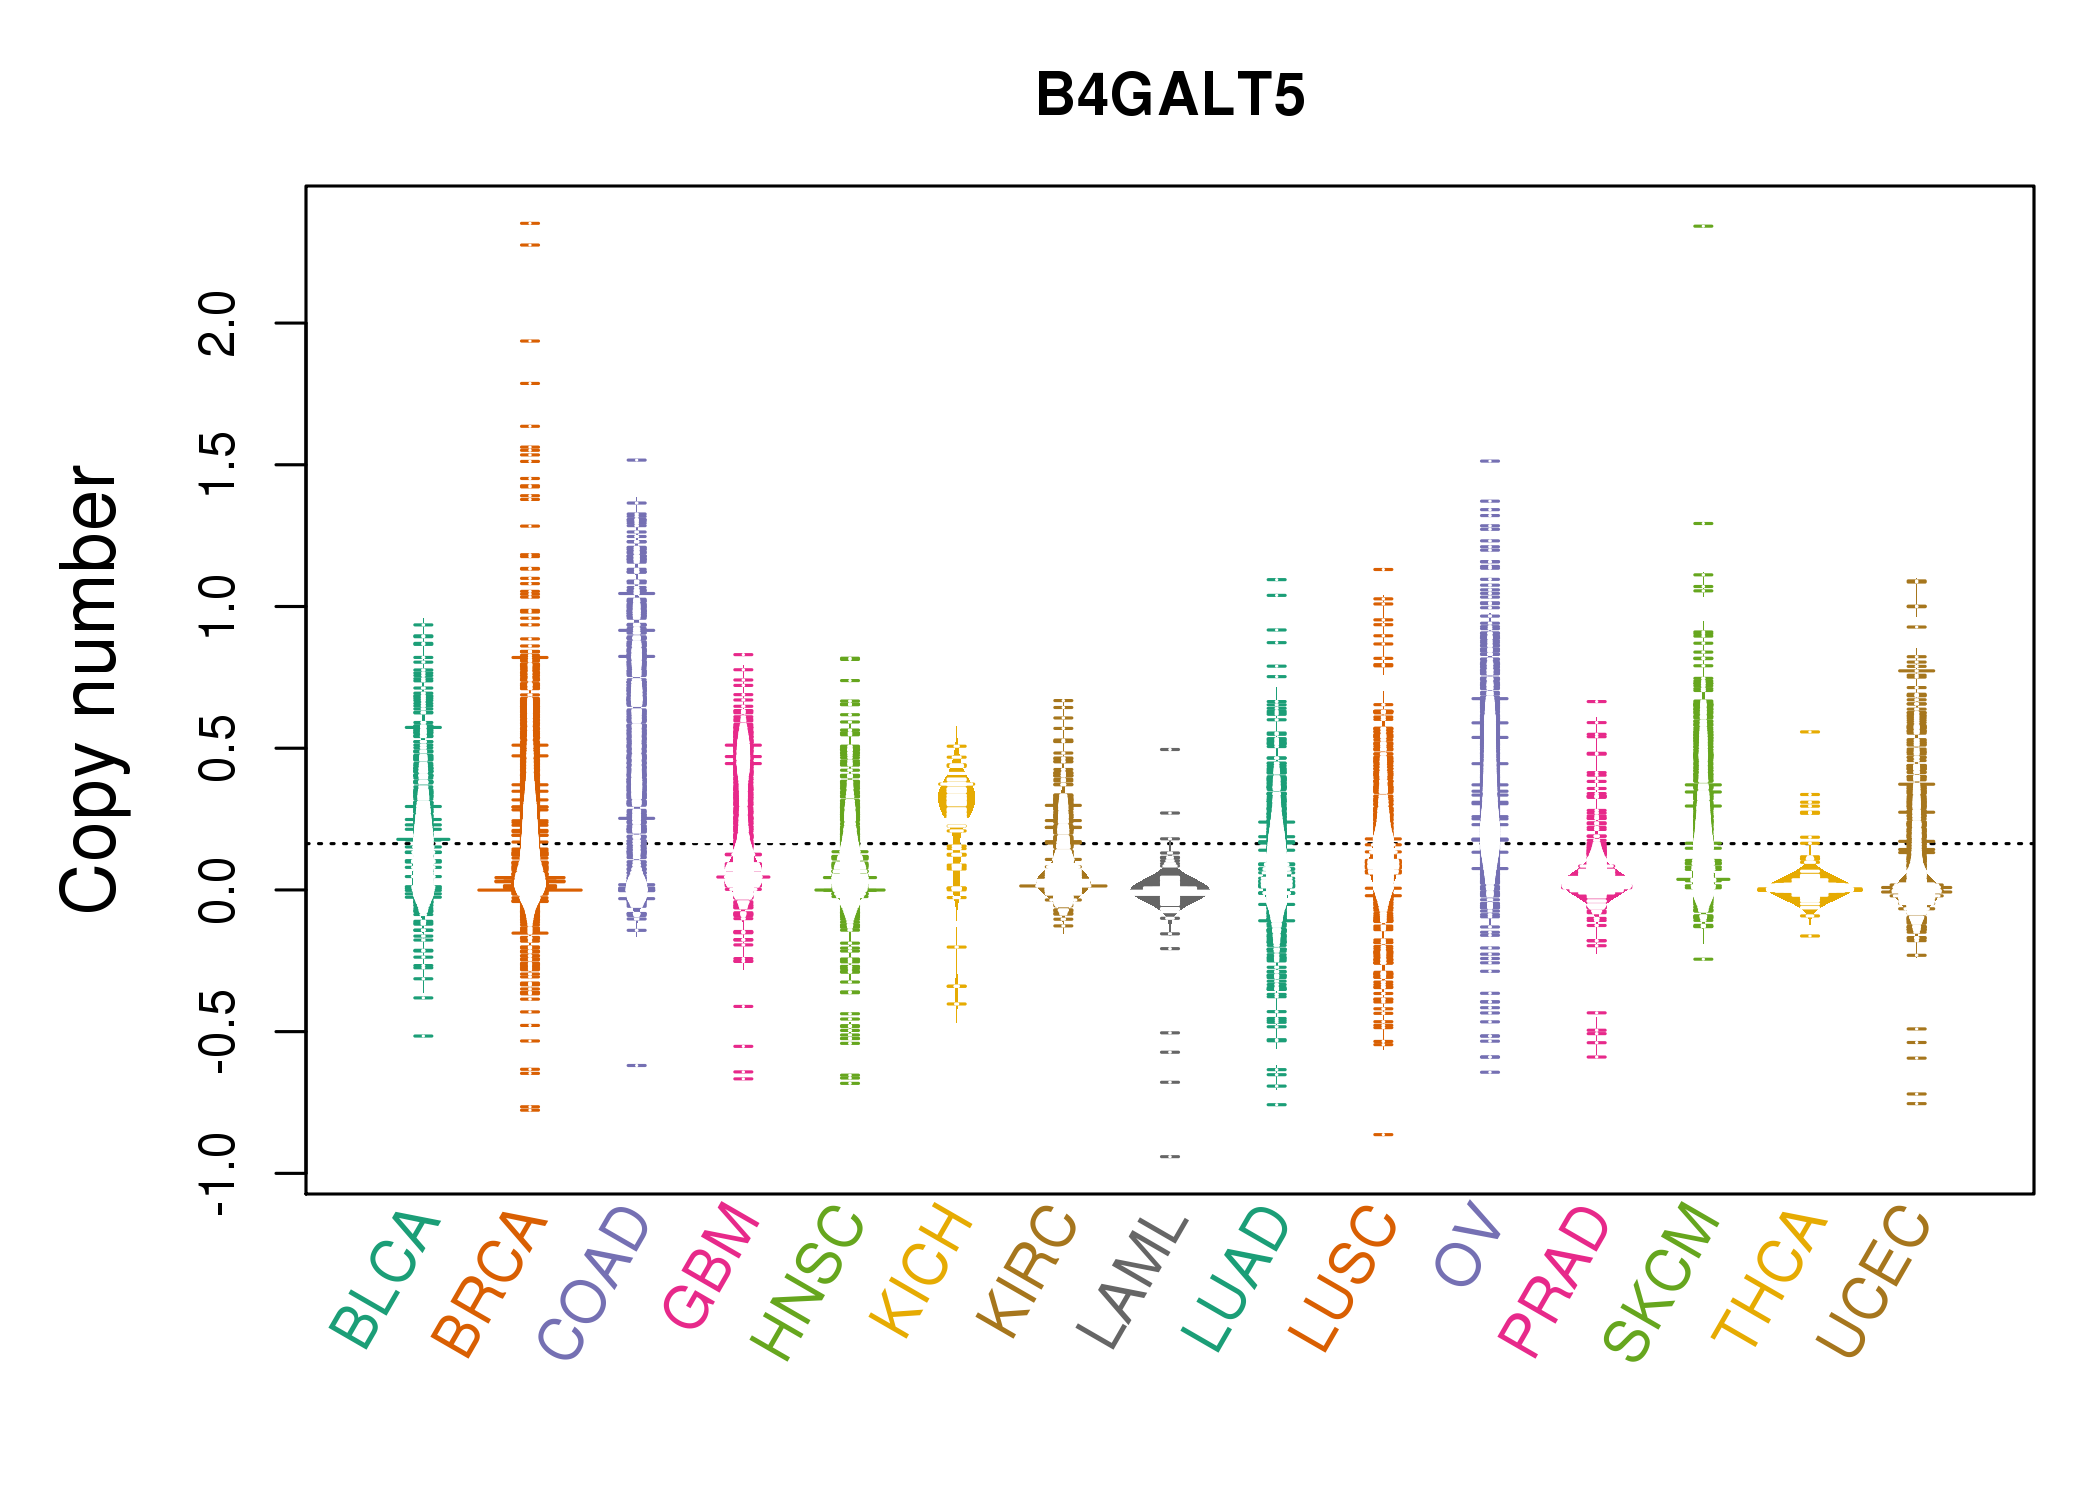 |
| cf) Tissue ID[Tissue type]: BLCA[Bladder Urothelial Carcinoma], BRCA[Breast invasive carcinoma], CESC[Cervical squamous cell carcinoma and endocervical adenocarcinoma], COAD[Colon adenocarcinoma], GBM[Glioblastoma multiforme], Glioma Low Grade, HNSC[Head and Neck squamous cell carcinoma], KICH[Kidney Chromophobe], KIRC[Kidney renal clear cell carcinoma], KIRP[Kidney renal papillary cell carcinoma], LAML[Acute Myeloid Leukemia], LUAD[Lung adenocarcinoma], LUSC[Lung squamous cell carcinoma], OV[Ovarian serous cystadenocarcinoma ], PAAD[Pancreatic adenocarcinoma], PRAD[Prostate adenocarcinoma], SKCM[Skin Cutaneous Melanoma], STAD[Stomach adenocarcinoma], THCA[Thyroid carcinoma], UCEC[Uterine Corpus Endometrial Carcinoma] |
| Top |
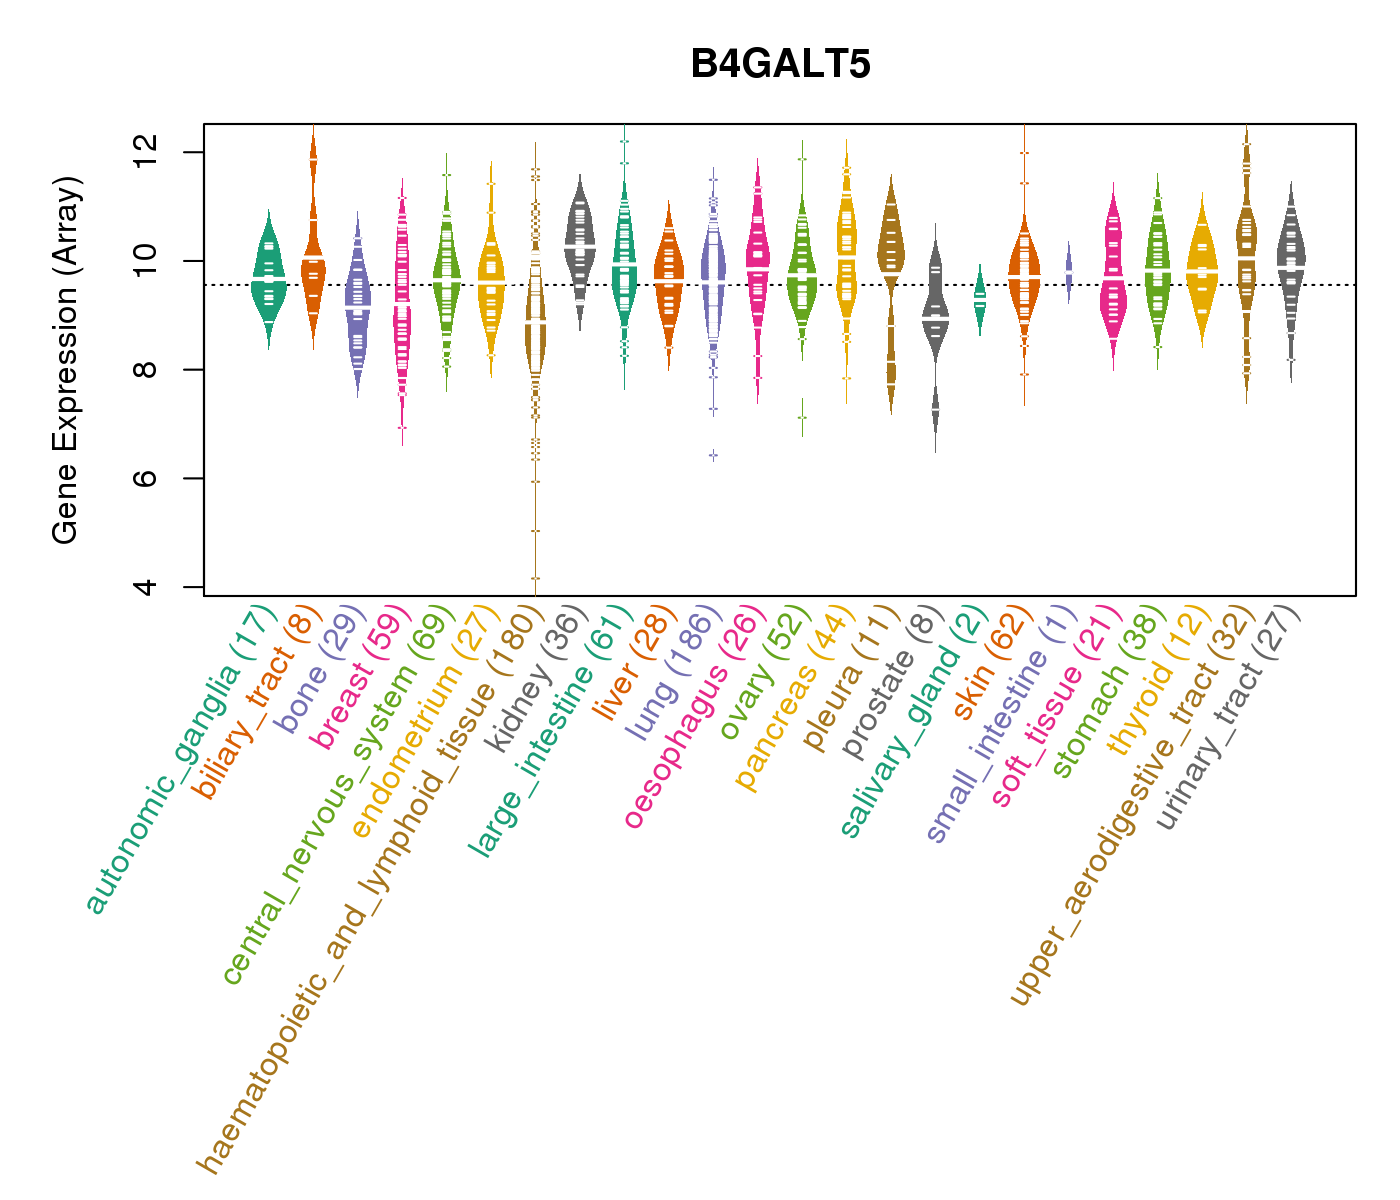
| Gene Expression for B4GALT5 |
| * CCLE gene expression data were extracted from CCLE_Expression_Entrez_2012-10-18.res: Gene-centric RMA-normalized mRNA expression data. |
 |
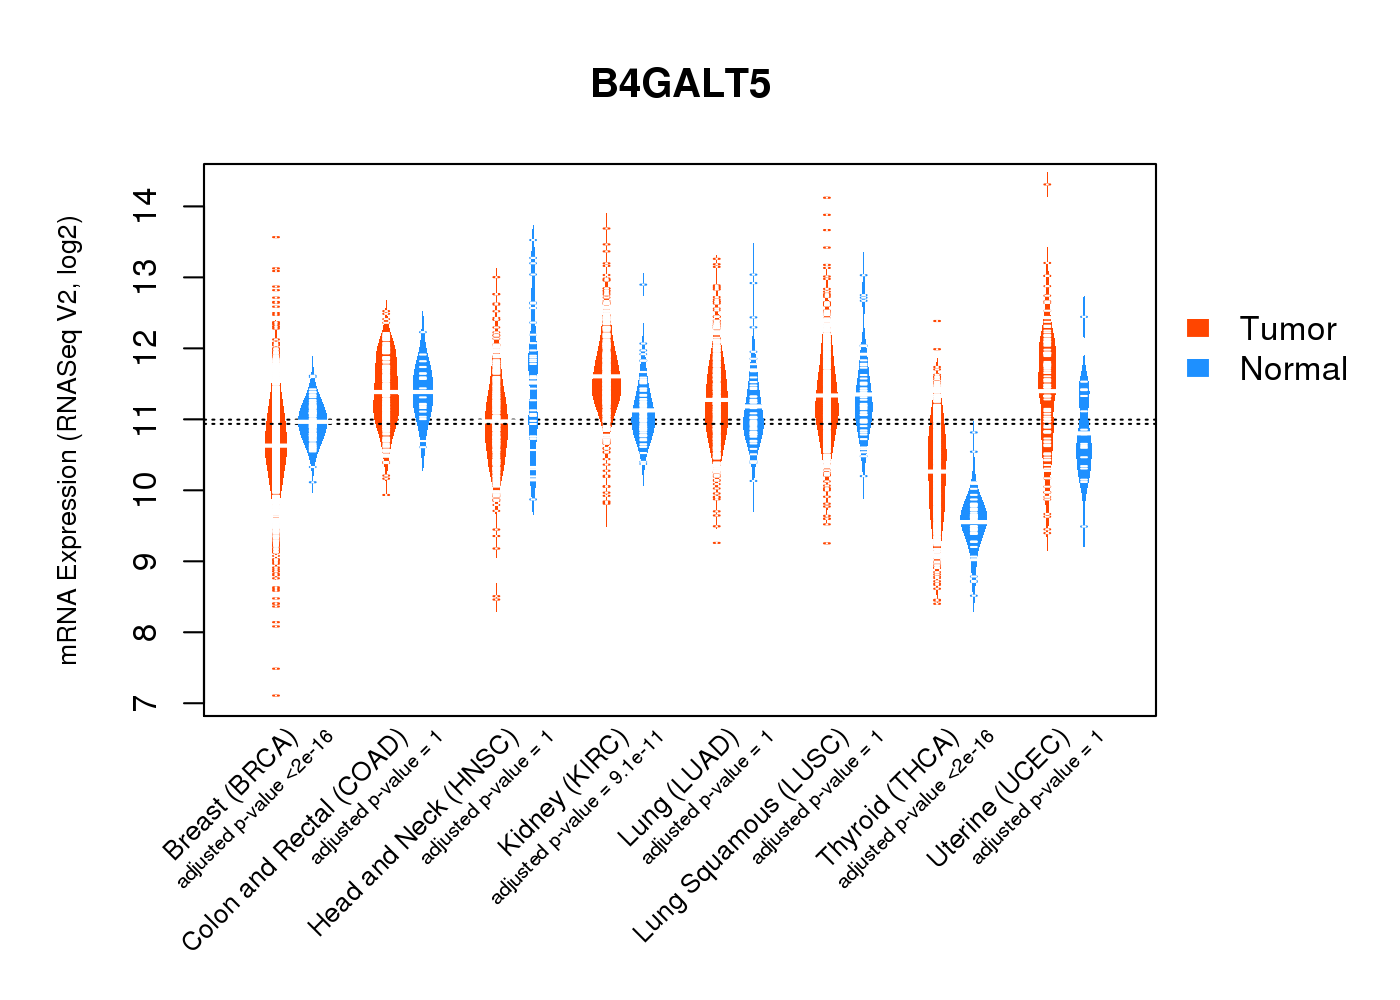
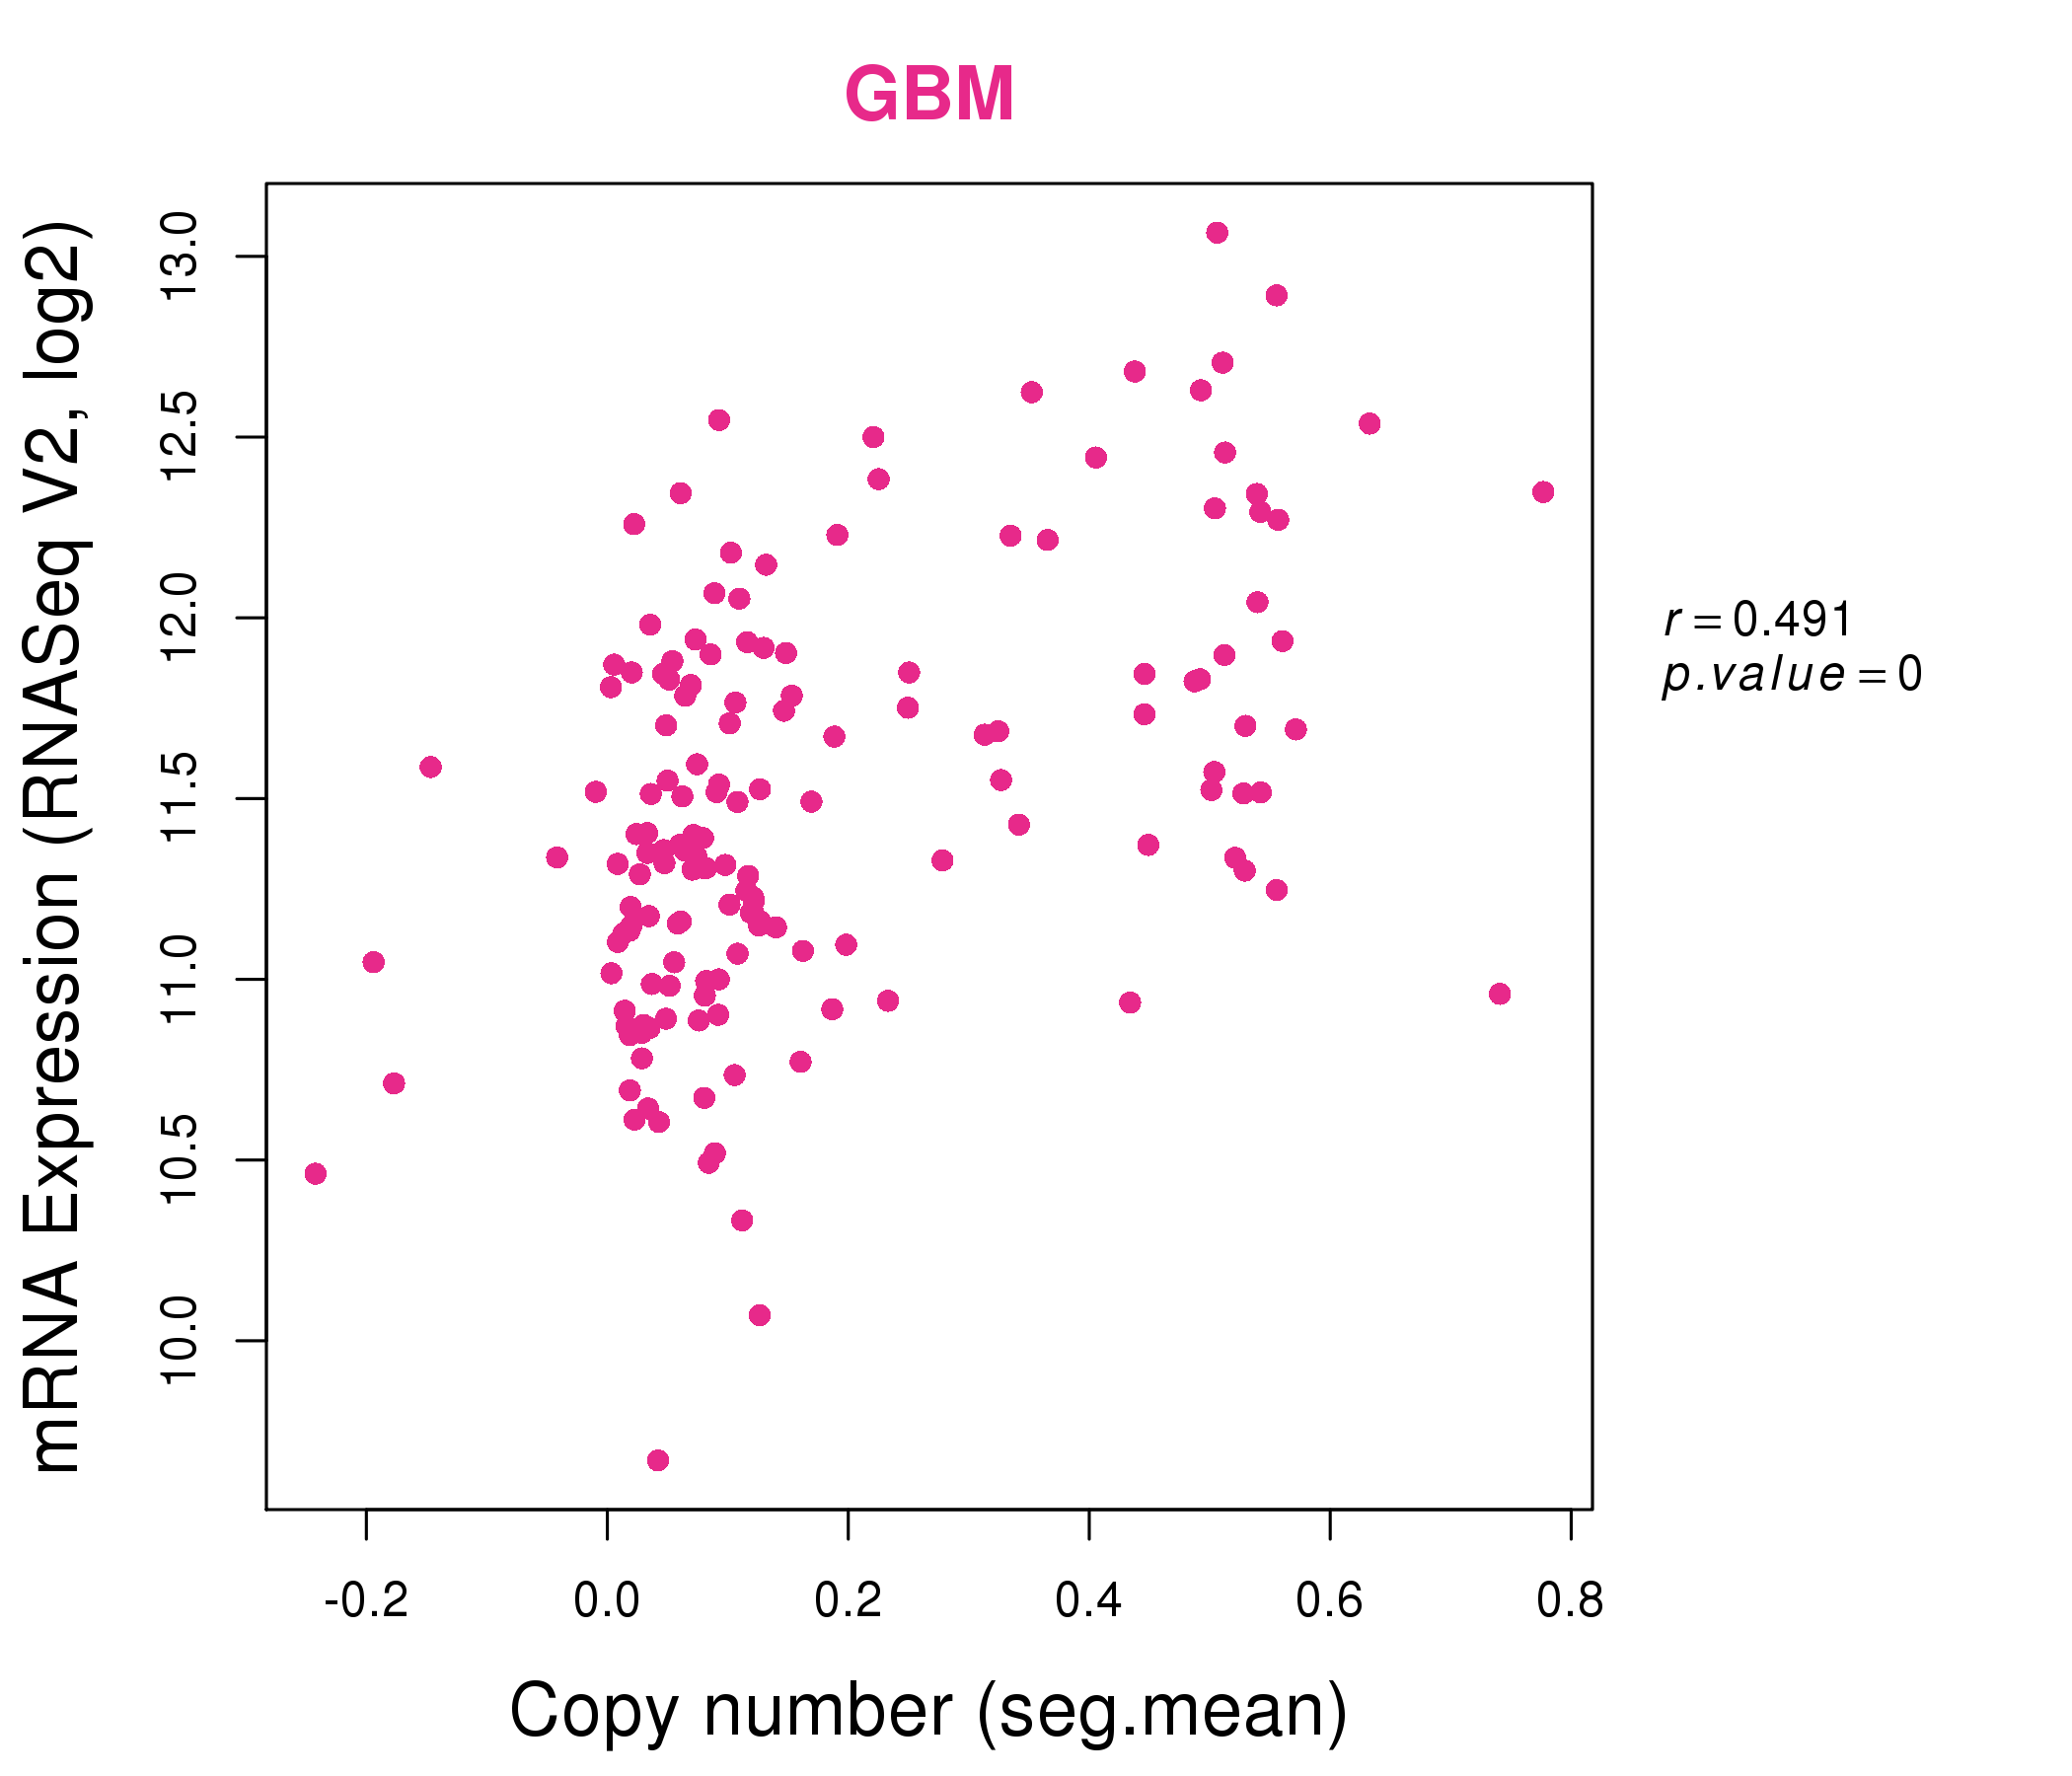
| * Normalized gene expression data of RNASeqV2 was extracted from TCGA using R package TCGA-Assembler. The URLs of all public data files on TCGA DCC data server were gathered at Jan-05-2015. Only eight cancer types have enough normal control samples for differential expression analysis. (t test, adjusted p<0.05 (using Benjamini-Hochberg FDR)) |
 |
| Top |
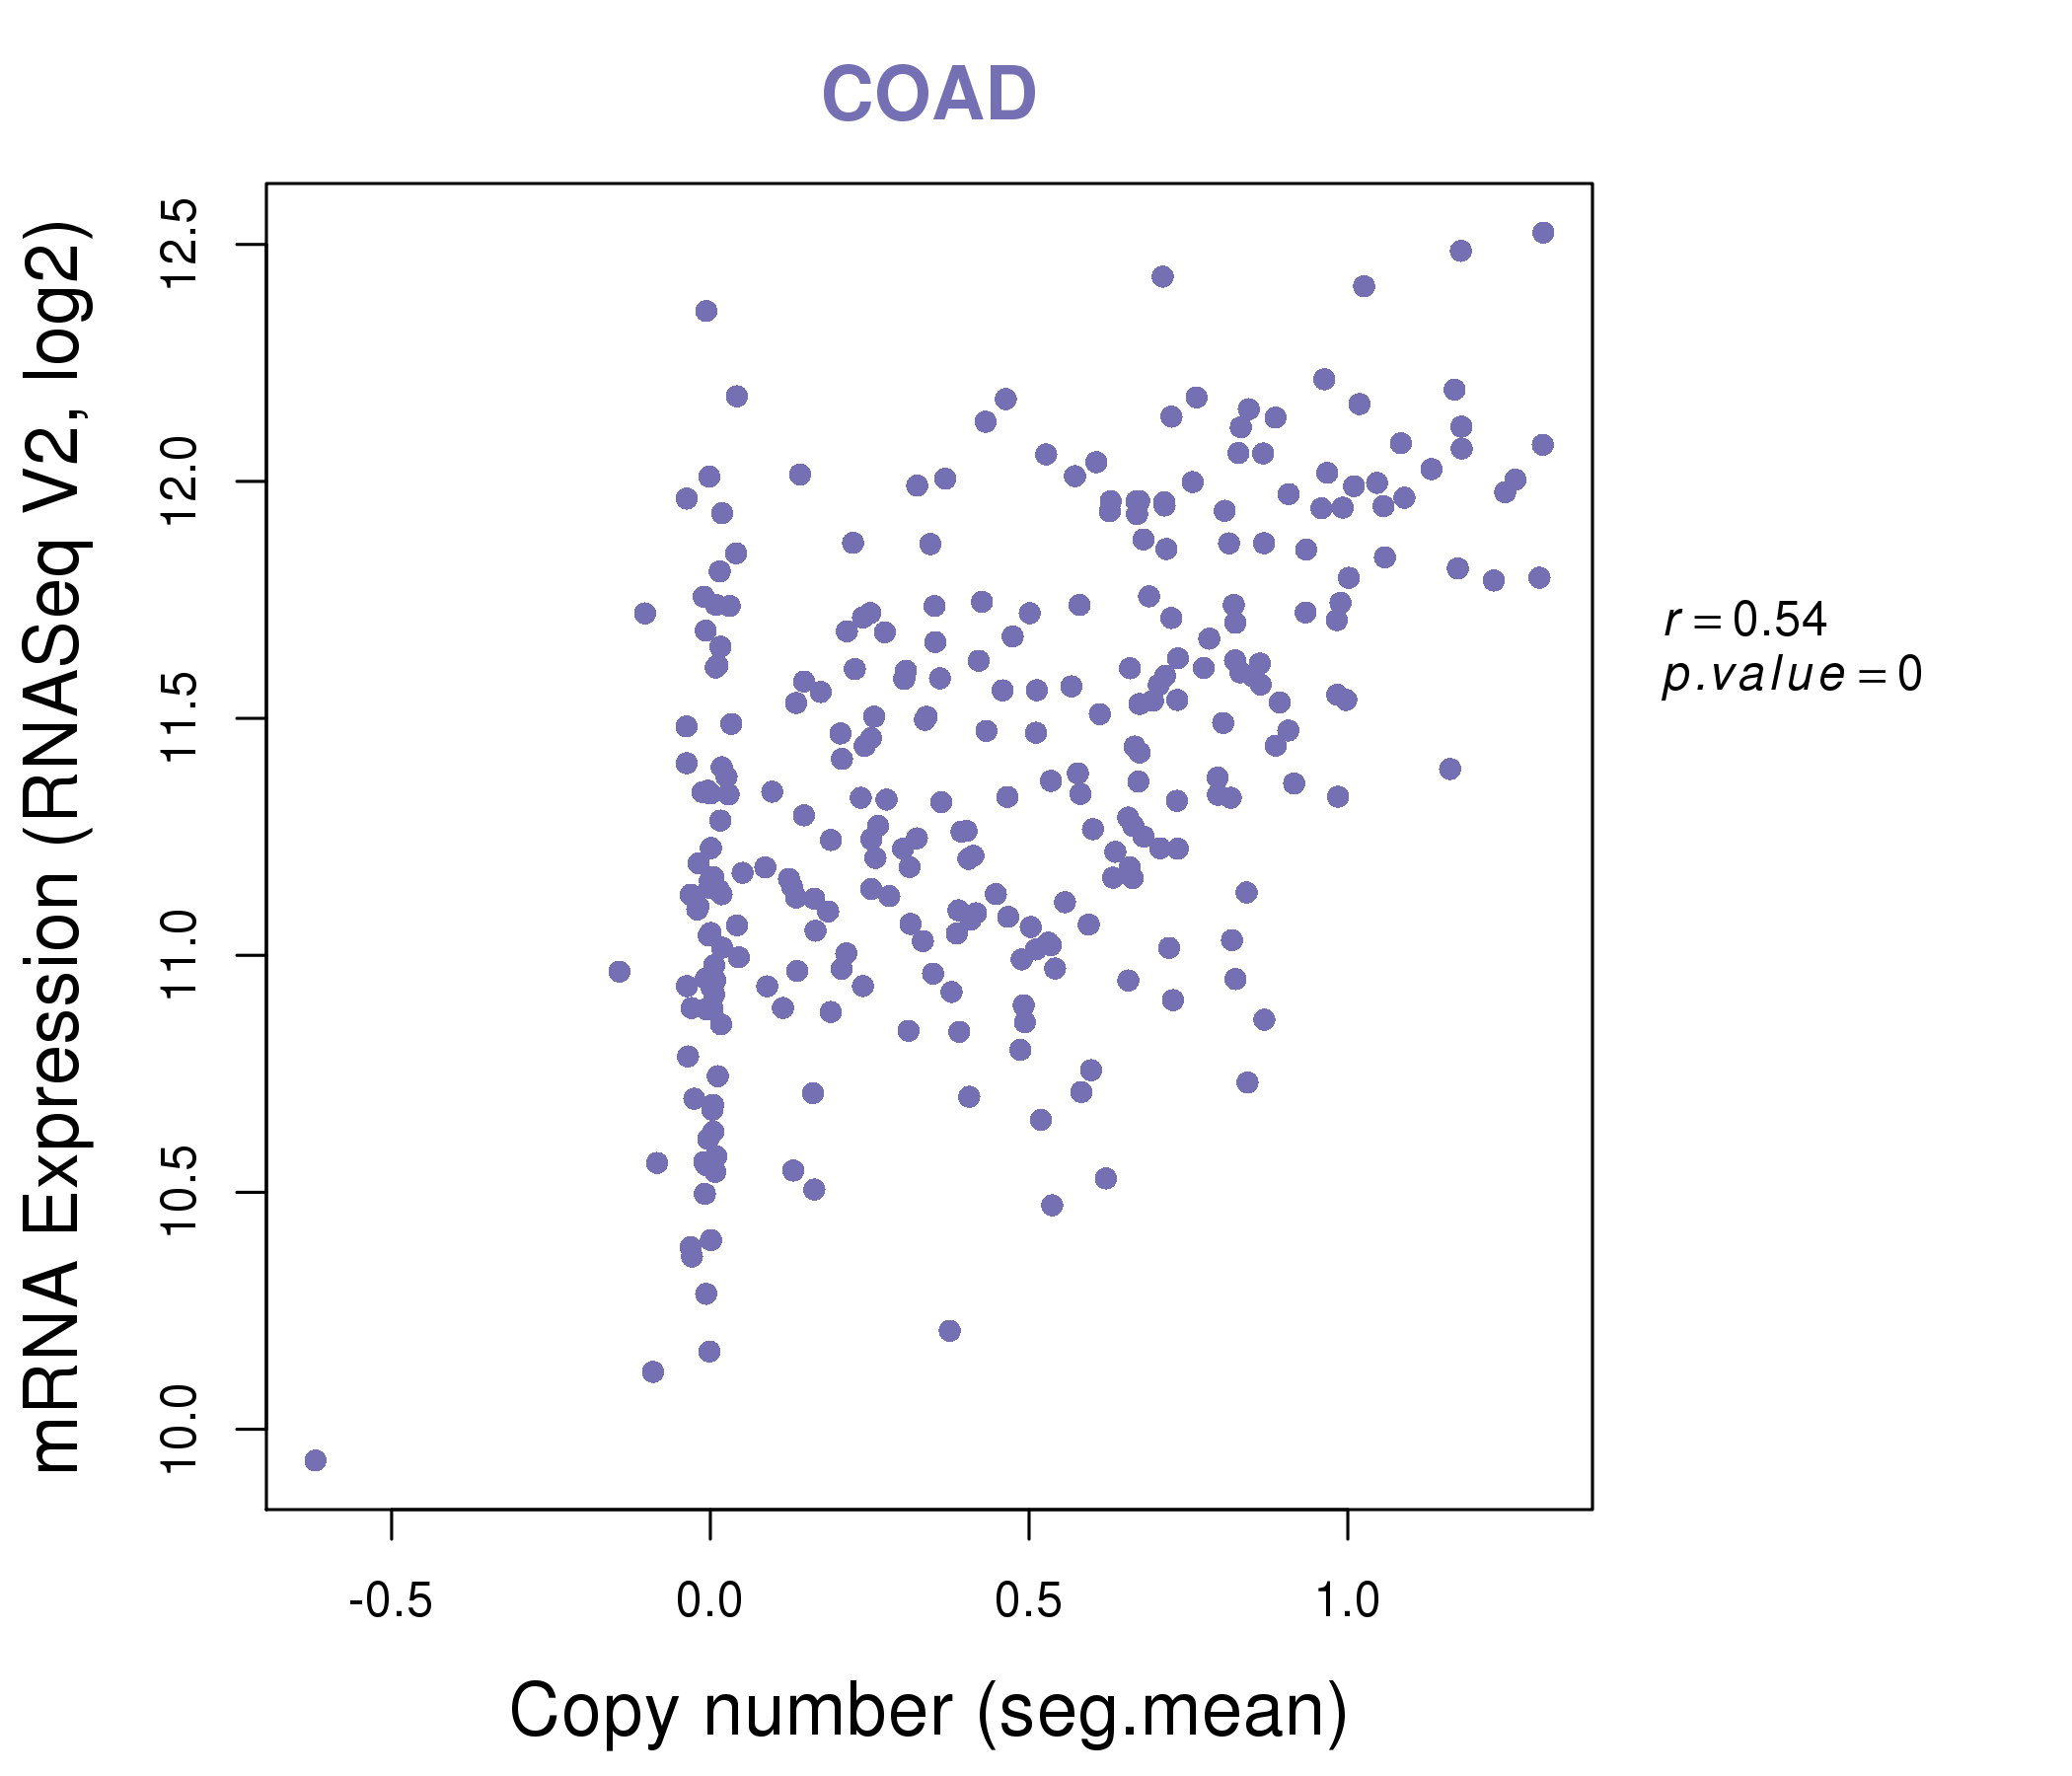
| * This plots show the correlation between CNV and gene expression. |
: Open all plots for all cancer types
 |
|
 |
|

| Top |
| Gene-Gene Network Information |
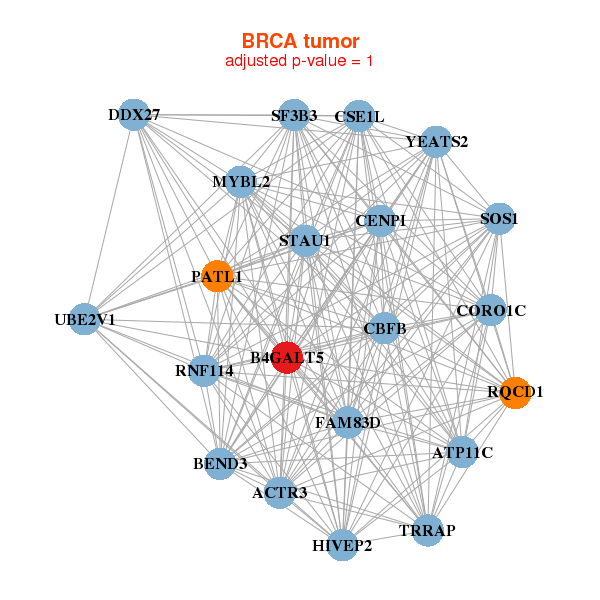
| * Co-Expression network figures were drawn using R package igraph. Only the top 20 genes with the highest correlations were shown. Red circle: input gene, orange circle: cell metabolism gene, sky circle: other gene |
: Open all plots for all cancer types
 |
|
| ACTR3,ATP11C,B4GALT5,BEND3,CBFB,CENPI,CORO1C, CSE1L,DDX27,FAM83D,HIVEP2,MYBL2,PATL1,RNF114, RQCD1,SF3B3,SOS1,STAU1,TRRAP,UBE2V1,YEATS2 | AP4E1,ATP11A,B4GALT5,BICC1,CCND2,CHSY3,CPSF2, EIF4G2,CCSER2,HIVEP2,KBTBD2,LRP12,MFAP3,PANX1, PRRG1,RPS6KA3,SSH1,TAF13,TFDP1,TSHZ3,ZNF385D |
 |
|
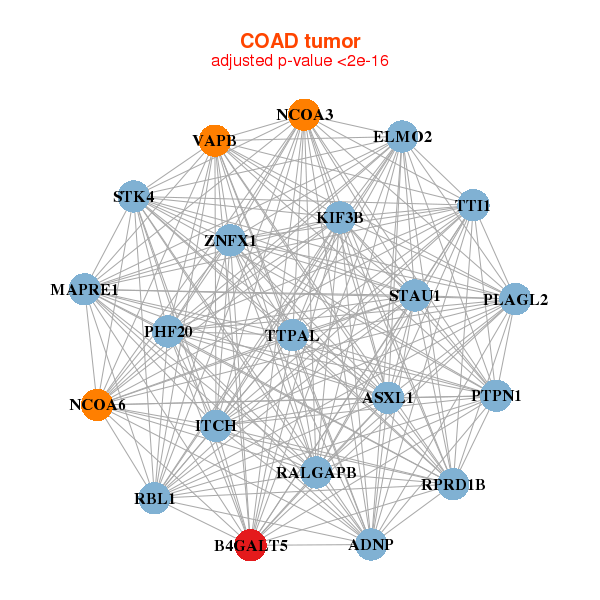
| ADNP,ASXL1,B4GALT5,ELMO2,ITCH,TTI1,KIF3B, MAPRE1,NCOA3,NCOA6,PHF20,PLAGL2,PTPN1,RALGAPB, RBL1,RPRD1B,STAU1,STK4,TTPAL,VAPB,ZNFX1 | AAK1,SOWAHC,B4GALT1,B4GALT5,CEACAM5,CTNNA1,DSC2, FLNB,GNA13,GNAQ,GPD2,GTPBP1,KIF16B,MICAL2, OSBPL11,OXSR1,PDLIM5,RAPGEF2,SMCHD1,TCF7L2,TMEM65 |
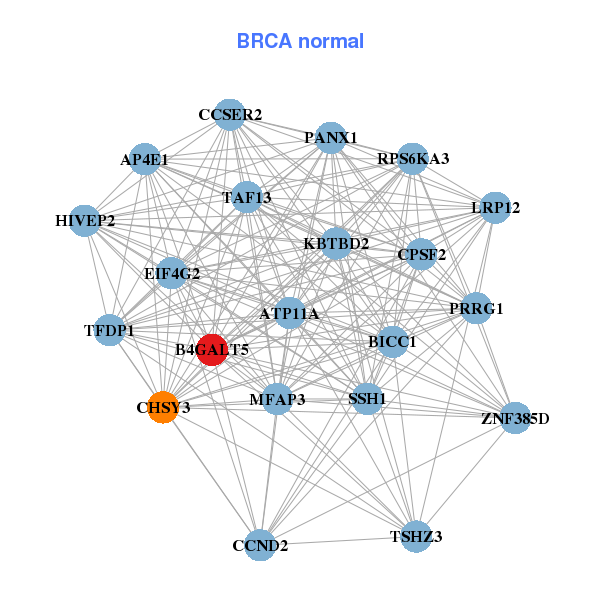
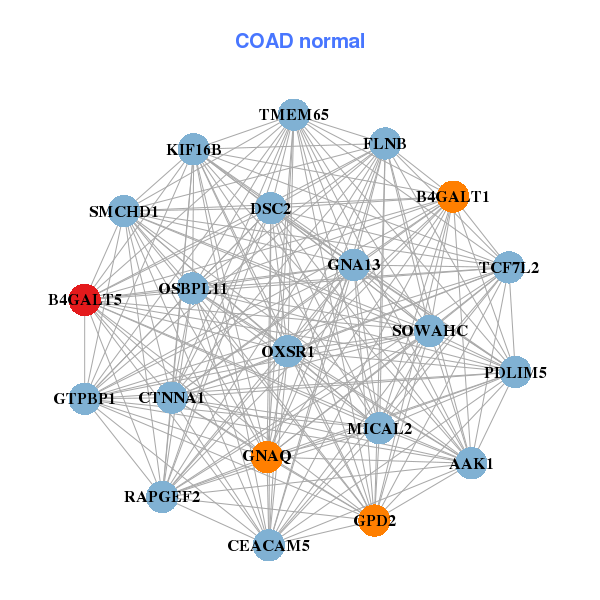
| * Co-Expression network figures were drawn using R package igraph. Only the top 20 genes with the highest correlations were shown. Red circle: input gene, orange circle: cell metabolism gene, sky circle: other gene |
: Open all plots for all cancer types
| Top |
: Open all interacting genes' information including KEGG pathway for all interacting genes from DAVID
| Top |
| Pharmacological Information for B4GALT5 |
| There's no related Drug. |
| Top |
| Cross referenced IDs for B4GALT5 |
| * We obtained these cross-references from Uniprot database. It covers 150 different DBs, 18 categories. http://www.uniprot.org/help/cross_references_section |
: Open all cross reference information
|
Copyright © 2016-Present - The Univsersity of Texas Health Science Center at Houston @ |