|
||||||||||||||||||||||||||||||||||||||||||||||||||||||||||||||||||||||||||||||||||||||||||||||||||||||||||||||||||||||||||||||||||||||||||||||||||||||||||||||||||||||||||||||||||||||||||||||||||||||||||||||||||||||||||||||||||||||||||||||||||||||||||||||||||||||||||||||||||||||||||||||||||||||||||||||||||||||||||
| |
| Phenotypic Information (metabolism pathway, cancer, disease, phenome) |
| |
| |
| Gene-Gene Network Information: Co-Expression Network, Interacting Genes & KEGG |
| |
|


| Gene Summary for NDST3 |
| Basic gene info. | Gene symbol | NDST3 |
| Gene name | N-deacetylase/N-sulfotransferase (heparan glucosaminyl) 3 | |
| Synonyms | HSST3 | |
| Cytomap | UCSC genome browser: 4q26 | |
| Genomic location | chr4 :118955499-119179789 | |
| Type of gene | protein-coding | |
| RefGenes | NM_004784.2, | |
| Ensembl id | ENSG00000164100 | |
| Description | GlcNAc N-deacetylase/ N-sulfotransferase 3N-HSST 3N-heparan sulfate sulfotransferase 3NDST-3bifunctional heparan sulfate N-deacetylase/N-sulfotransferase 3glucosaminyl N-deacetylase/N-sulfotransferase 3hNDST-3 | |
| Modification date | 20141207 | |
| dbXrefs | MIM : 603950 | |
| HGNC : HGNC | ||
| Ensembl : ENSG00000164100 | ||
| Vega : OTTHUMG00000132959 | ||
| Protein | UniProt: go to UniProt's Cross Reference DB Table | |
| Expression | CleanEX: HS_NDST3 | |
| BioGPS: 9348 | ||
| Gene Expression Atlas: ENSG00000164100 | ||
| The Human Protein Atlas: ENSG00000164100 | ||
| Pathway | NCI Pathway Interaction Database: NDST3 | |
| KEGG: NDST3 | ||
| REACTOME: NDST3 | ||
| ConsensusPathDB | ||
| Pathway Commons: NDST3 | ||
| Metabolism | MetaCyc: NDST3 | |
| HUMANCyc: NDST3 | ||
| Regulation | Ensembl's Regulation: ENSG00000164100 | |
| miRBase: chr4 :118,955,499-119,179,789 | ||
| TargetScan: NM_004784 | ||
| cisRED: ENSG00000164100 | ||
| Context | iHOP: NDST3 | |
| cancer metabolism search in PubMed: NDST3 | ||
| UCL Cancer Institute: NDST3 | ||
| Assigned class in ccmGDB | C | |
| Top |
| Phenotypic Information for NDST3(metabolism pathway, cancer, disease, phenome) |
| Cancer | CGAP: NDST3 |
| Familial Cancer Database: NDST3 | |
| * This gene is included in those cancer gene databases. |
|
|
|
|
|
|
| ||||||||||||||||||||||||||||||||||||||||||||||||||||||||||||||||||||||||||||||||||||||||||||||||||||||||||||||||||||||||||||||||||||||||||||||||||||||||||||||||||||||||||||||||||||||||||||||||||||||||||||||||||||||||||||||||||||||||||||||||||||||||||||||||||||||||||||||||||||||||||||||||||||||||||||||||||||
Oncogene 1 | Significant driver gene in | |||||||||||||||||||||||||||||||||||||||||||||||||||||||||||||||||||||||||||||||||||||||||||||||||||||||||||||||||||||||||||||||||||||||||||||||||||||||||||||||||||||||||||||||||||||||||||||||||||||||||||||||||||||||||||||||||||||||||||||||||||||||||||||||||||||||||||||||||||||||||||||||||||||||||||||||||||||||||
| cf) number; DB name 1 Oncogene; http://nar.oxfordjournals.org/content/35/suppl_1/D721.long, 2 Tumor Suppressor gene; https://bioinfo.uth.edu/TSGene/, 3 Cancer Gene Census; http://www.nature.com/nrc/journal/v4/n3/abs/nrc1299.html, 4 CancerGenes; http://nar.oxfordjournals.org/content/35/suppl_1/D721.long, 5 Network of Cancer Gene; http://ncg.kcl.ac.uk/index.php, 1Therapeutic Vulnerabilities in Cancer; http://cbio.mskcc.org/cancergenomics/statius/ |
| REACTOME_METABOLISM_OF_CARBOHYDRATES | |
| OMIM | |
| Orphanet | |
| Disease | KEGG Disease: NDST3 |
| MedGen: NDST3 (Human Medical Genetics with Condition) | |
| ClinVar: NDST3 | |
| Phenotype | MGI: NDST3 (International Mouse Phenotyping Consortium) |
| PhenomicDB: NDST3 | |
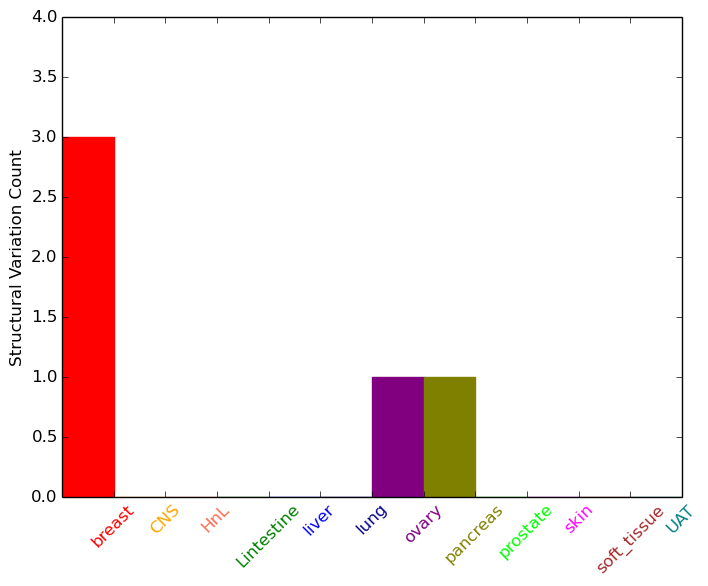
| Mutations for NDST3 |
| * Under tables are showing count per each tissue to give us broad intuition about tissue specific mutation patterns.You can go to the detailed page for each mutation database's web site. |
| - Statistics for Tissue and Mutation type | Top |
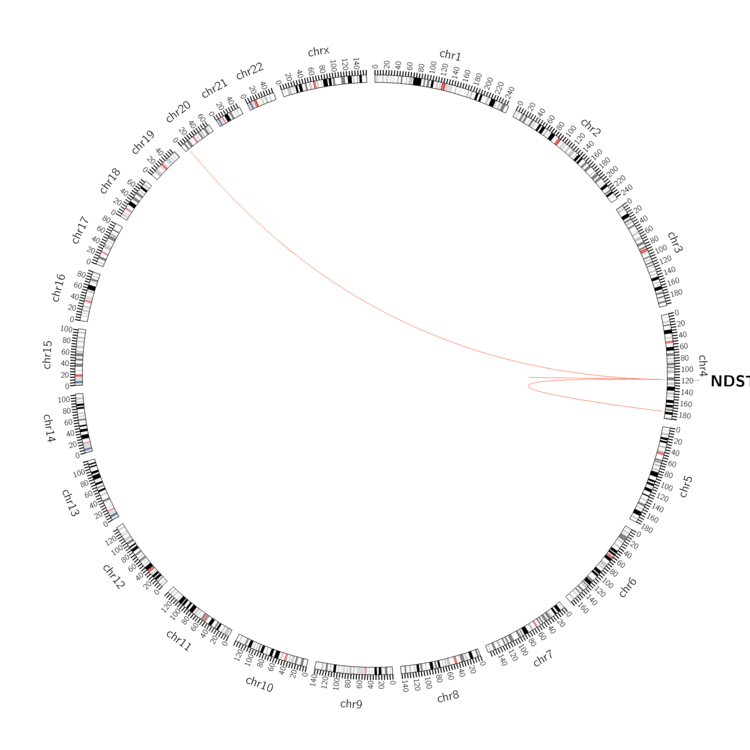 |
| - For Inter-chromosomal Variations |
| There's no inter-chromosomal structural variation. |
| - For Intra-chromosomal Variations |
| * Intra-chromosomal variantions includes 'intrachromosomal amplicon to amplicon', 'intrachromosomal amplicon to non-amplified dna', 'intrachromosomal deletion', 'intrachromosomal fold-back inversion', 'intrachromosomal inversion', 'intrachromosomal tandem duplication', 'Intrachromosomal unknown type', 'intrachromosomal with inverted orientation', 'intrachromosomal with non-inverted orientation'. |
 |
| Sample | Symbol_a | Chr_a | Start_a | End_a | Symbol_b | Chr_b | Start_b | End_b |
| breast | NDST3 | chr4 | 119006912 | 119006912 | chr20 | 7323362 | 7323362 | |
| breast | NDST3 | chr4 | 119006912 | 119006912 | NDST3 | chr4 | 119012493 | 119012493 |
| ovary | NDST3 | chr4 | 119055224 | 119055244 | NDST3 | chr4 | 119051288 | 119051308 |
| pancreas | NDST3 | chr4 | 119147667 | 119147687 | chr4 | 178214553 | 178214573 |
| cf) Tissue number; Tissue name (1;Breast, 2;Central_nervous_system, 3;Haematopoietic_and_lymphoid_tissue, 4;Large_intestine, 5;Liver, 6;Lung, 7;Ovary, 8;Pancreas, 9;Prostate, 10;Skin, 11;Soft_tissue, 12;Upper_aerodigestive_tract) |
| * From mRNA Sanger sequences, Chitars2.0 arranged chimeric transcripts. This table shows NDST3 related fusion information. |
| ID | Head Gene | Tail Gene | Accession | Gene_a | qStart_a | qEnd_a | Chromosome_a | tStart_a | tEnd_a | Gene_a | qStart_a | qEnd_a | Chromosome_a | tStart_a | tEnd_a |
| AV697913 | RPS6 | 151 | 296 | 9 | 19376253 | 19376507 | NDST3 | 287 | 310 | 4 | 118999891 | 118999914 | |
| Top |
| Mutation type/ Tissue ID | brca | cns | cerv | endome | haematopo | kidn | Lintest | liver | lung | ns | ovary | pancre | prost | skin | stoma | thyro | urina | |||
| Total # sample | 1 | 1 | 1 | |||||||||||||||||
| GAIN (# sample) | 1 | 1 | ||||||||||||||||||
| LOSS (# sample) | 1 |
| cf) Tissue ID; Tissue type (1; Breast, 2; Central_nervous_system, 3; Cervix, 4; Endometrium, 5; Haematopoietic_and_lymphoid_tissue, 6; Kidney, 7; Large_intestine, 8; Liver, 9; Lung, 10; NS, 11; Ovary, 12; Pancreas, 13; Prostate, 14; Skin, 15; Stomach, 16; Thyroid, 17; Urinary_tract) |
| Top |
|
 |
| Top |
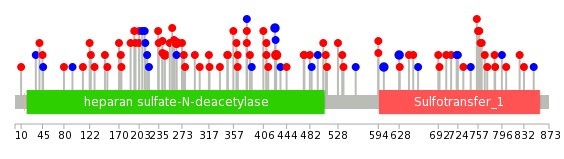
| Stat. for Non-Synonymous SNVs (# total SNVs=87) | (# total SNVs=24) |
 | 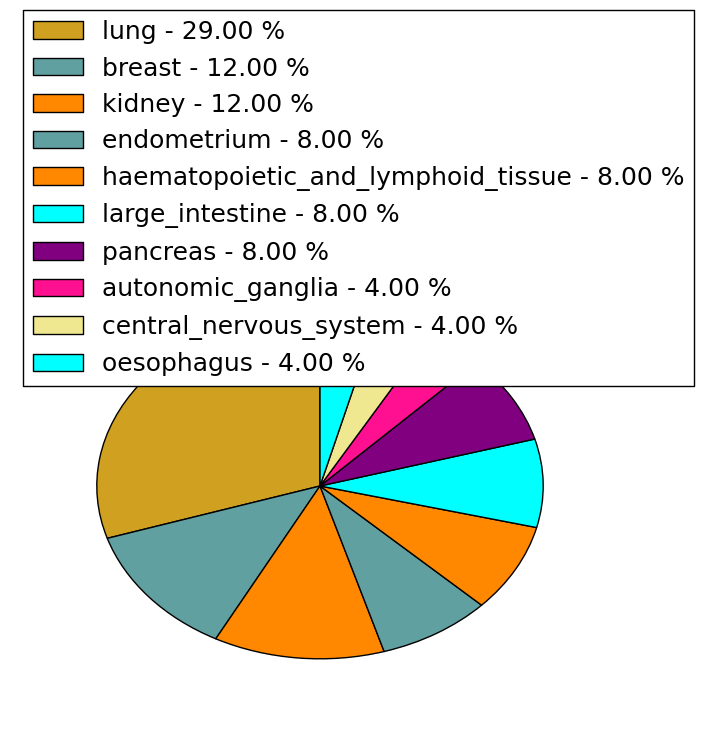 |
(# total SNVs=2) | (# total SNVs=0) |
 |
| Top |
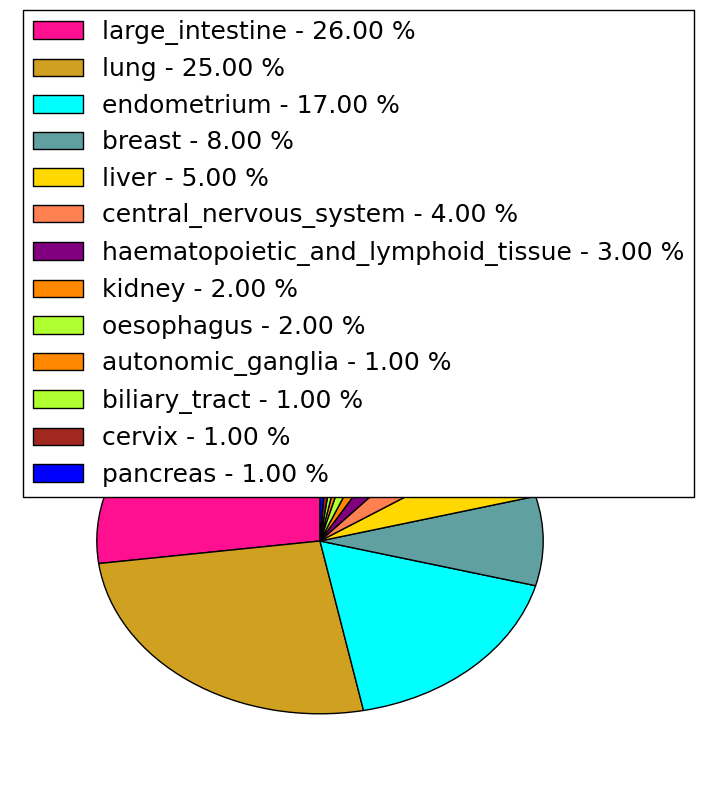
| * When you move the cursor on each content, you can see more deailed mutation information on the Tooltip. Those are primary_site,primary_histology,mutation(aa),pubmedID. |
| GRCh37 position | Mutation(aa) | Unique sampleID count |
| chr4:118975673-118975673 | p.R203H | 3 |
| chr4:119059310-119059310 | p.W442C | 3 |
| chr4:118976014-118976014 | p.E317K | 3 |
| chr4:118975397-118975397 | p.A111V | 3 |
| chr4:118975856-118975856 | p.H264R | 3 |
| chr4:119161842-119161842 | p.P761L | 3 |
| chr4:119064735-119064735 | p.L479F | 2 |
| chr4:119059263-119059263 | p.V427I | 2 |
| chr4:118975799-118975799 | p.S245Y | 2 |
| chr4:119148120-119148120 | p.I601T | 2 |
| Top |
|
 |
| Point Mutation/ Tissue ID | 1 | 2 | 3 | 4 | 5 | 6 | 7 | 8 | 9 | 10 | 11 | 12 | 13 | 14 | 15 | 16 | 17 | 18 | 19 | 20 |
| # sample | 2 | 3 | 1 | 18 | 2 | 5 | 4 | 12 | 5 | 1 | 1 | 23 | 14 | 1 | 10 | |||||
| # mutation | 2 | 3 | 1 | 16 | 2 | 6 | 4 | 12 | 5 | 1 | 1 | 25 | 15 | 1 | 15 | |||||
| nonsynonymous SNV | 2 | 1 | 1 | 14 | 1 | 3 | 1 | 8 | 4 | 1 | 20 | 10 | 1 | 14 | ||||||
| synonymous SNV | 2 | 2 | 1 | 3 | 3 | 4 | 1 | 1 | 5 | 5 | 1 |
| cf) Tissue ID; Tissue type (1; BLCA[Bladder Urothelial Carcinoma], 2; BRCA[Breast invasive carcinoma], 3; CESC[Cervical squamous cell carcinoma and endocervical adenocarcinoma], 4; COAD[Colon adenocarcinoma], 5; GBM[Glioblastoma multiforme], 6; Glioma Low Grade, 7; HNSC[Head and Neck squamous cell carcinoma], 8; KICH[Kidney Chromophobe], 9; KIRC[Kidney renal clear cell carcinoma], 10; KIRP[Kidney renal papillary cell carcinoma], 11; LAML[Acute Myeloid Leukemia], 12; LUAD[Lung adenocarcinoma], 13; LUSC[Lung squamous cell carcinoma], 14; OV[Ovarian serous cystadenocarcinoma ], 15; PAAD[Pancreatic adenocarcinoma], 16; PRAD[Prostate adenocarcinoma], 17; SKCM[Skin Cutaneous Melanoma], 18:STAD[Stomach adenocarcinoma], 19:THCA[Thyroid carcinoma], 20:UCEC[Uterine Corpus Endometrial Carcinoma]) |
| Top |
| * We represented just top 10 SNVs. When you move the cursor on each content, you can see more deailed mutation information on the Tooltip. Those are primary_site, primary_histology, mutation(aa), pubmedID. |
| Genomic Position | Mutation(aa) | Unique sampleID count |
| chr4:118975856 | p.V427I | 3 |
| chr4:119059263 | p.H264R | 3 |
| chr4:119148127 | p.R203H | 2 |
| chr4:119154231 | p.S425S | 2 |
| chr4:119059259 | p.P241T | 2 |
| chr4:118975786 | p.P603P | 2 |
| chr4:118975799 | p.S245Y | 2 |
| chr4:118975673 | p.P628P | 2 |
| chr4:119163220 | p.F485F | 1 |
| chr4:118975094 | p.V659V | 1 |
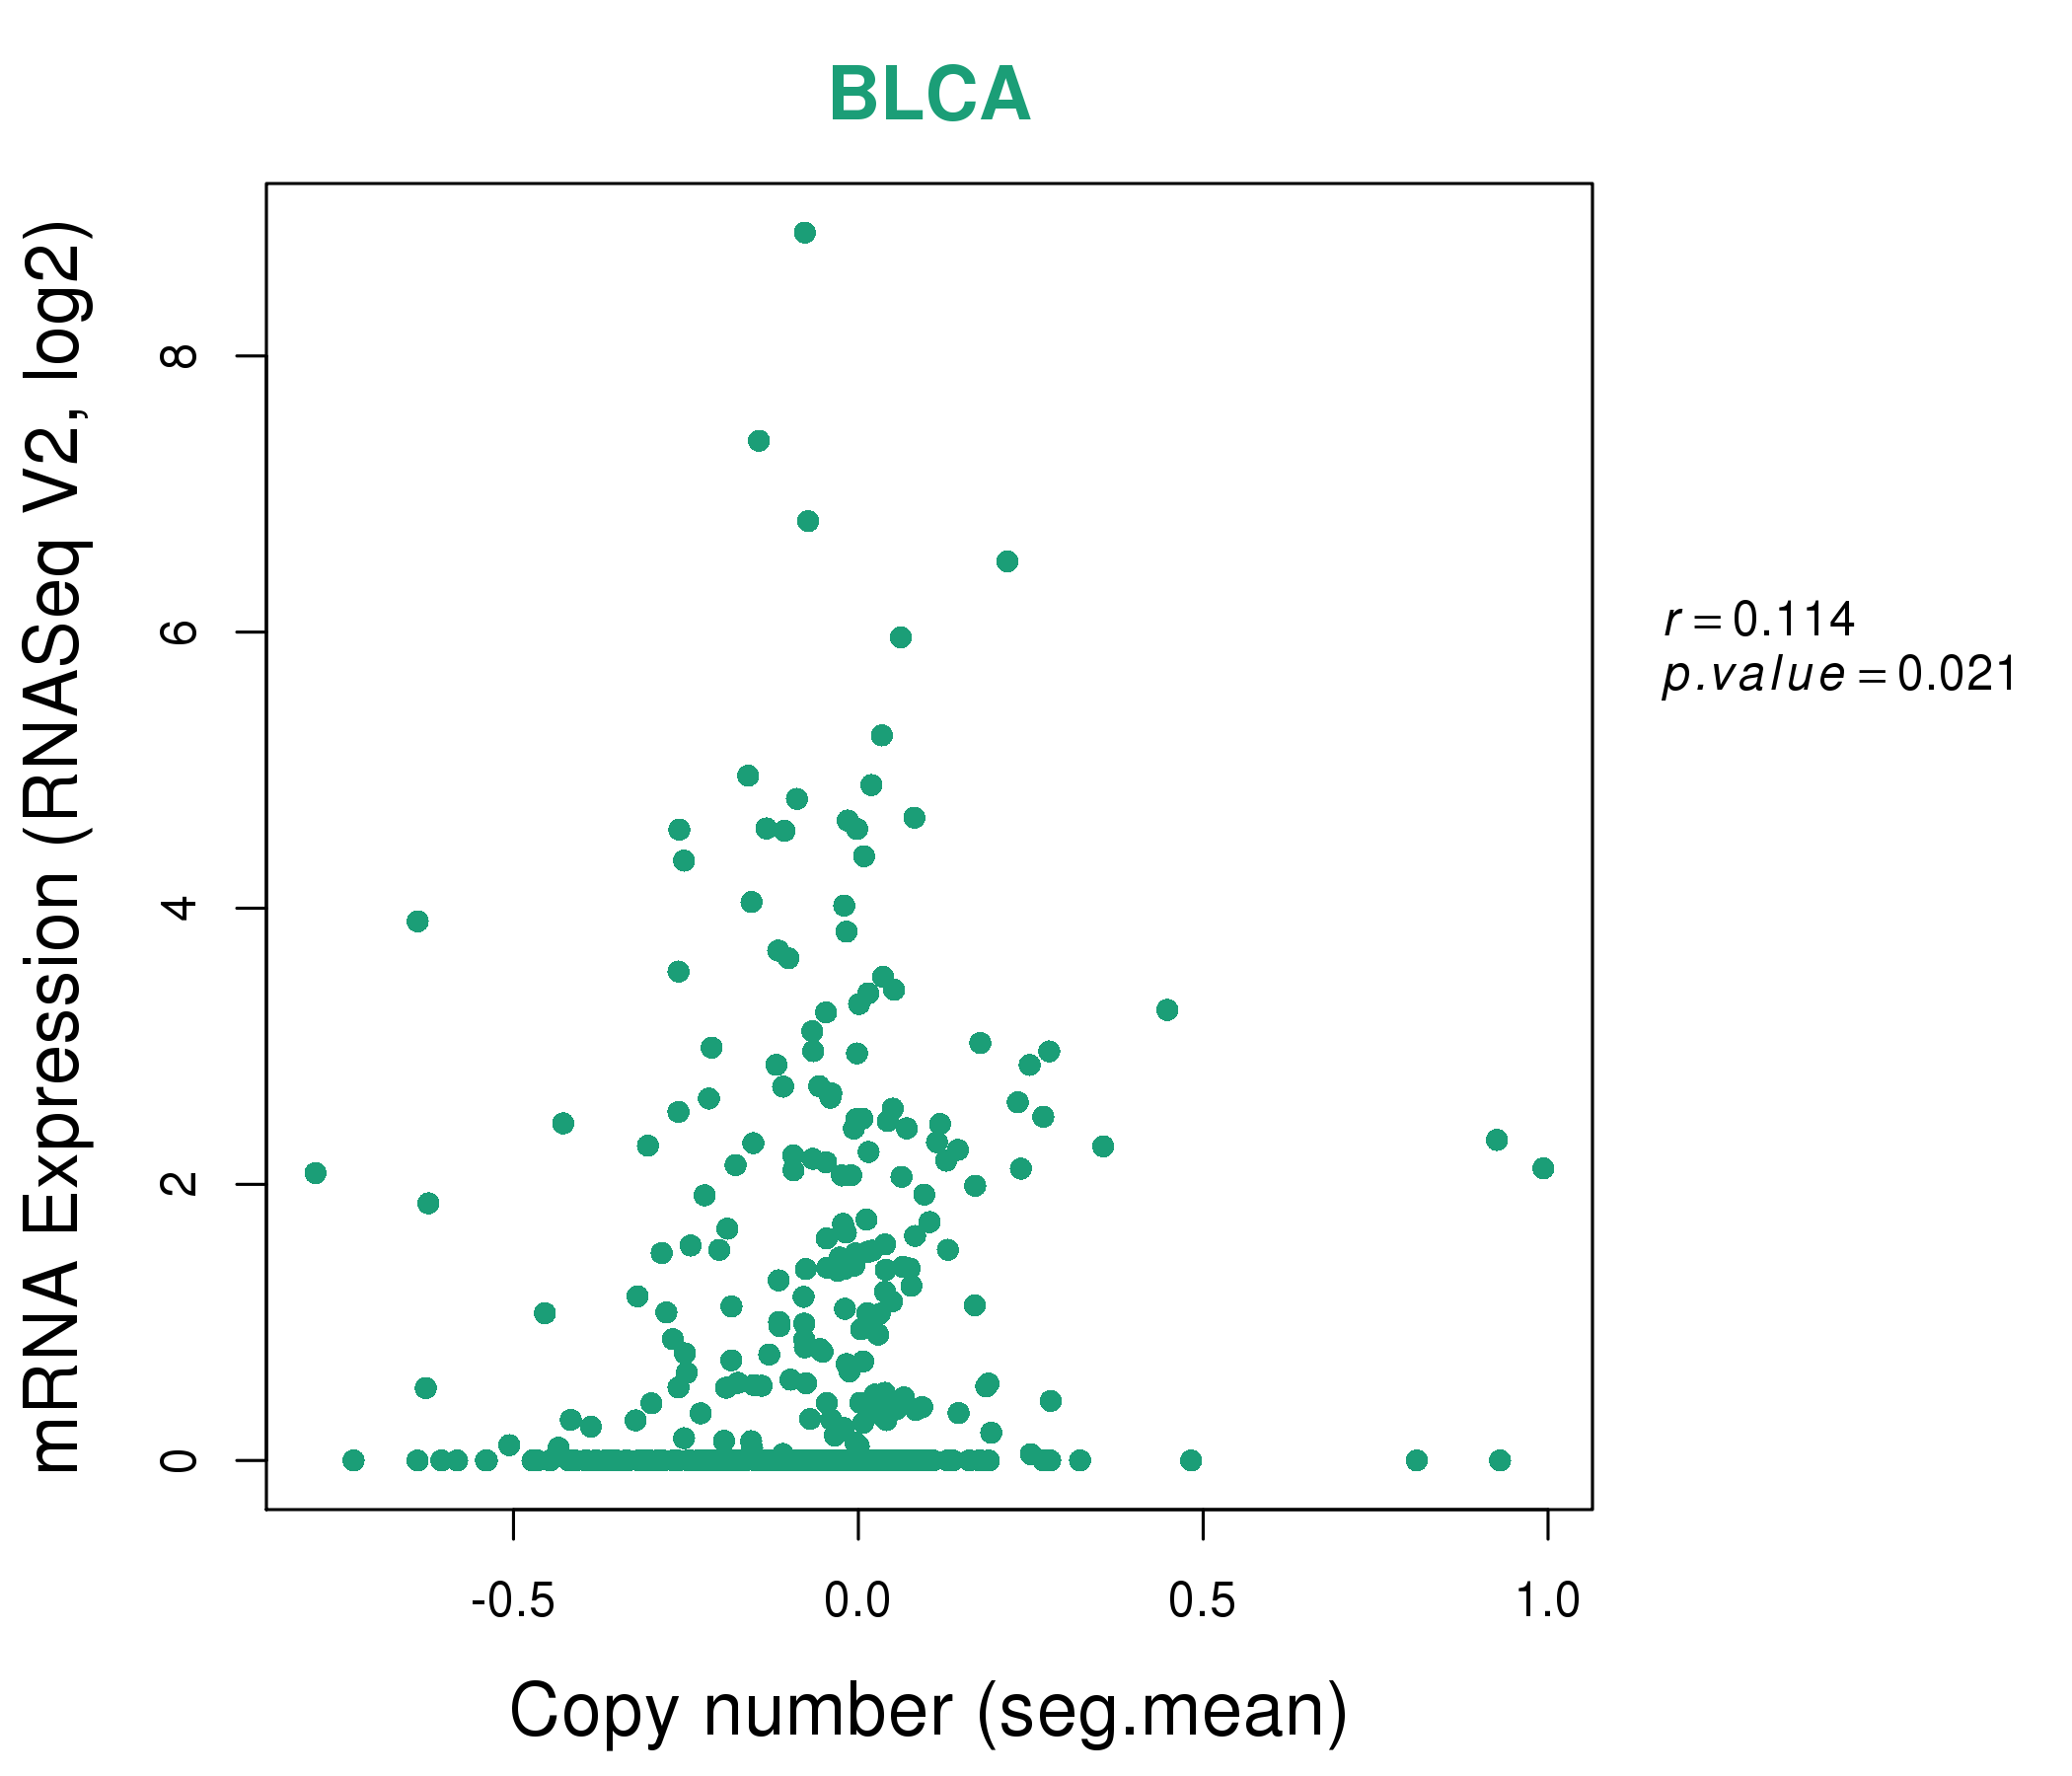
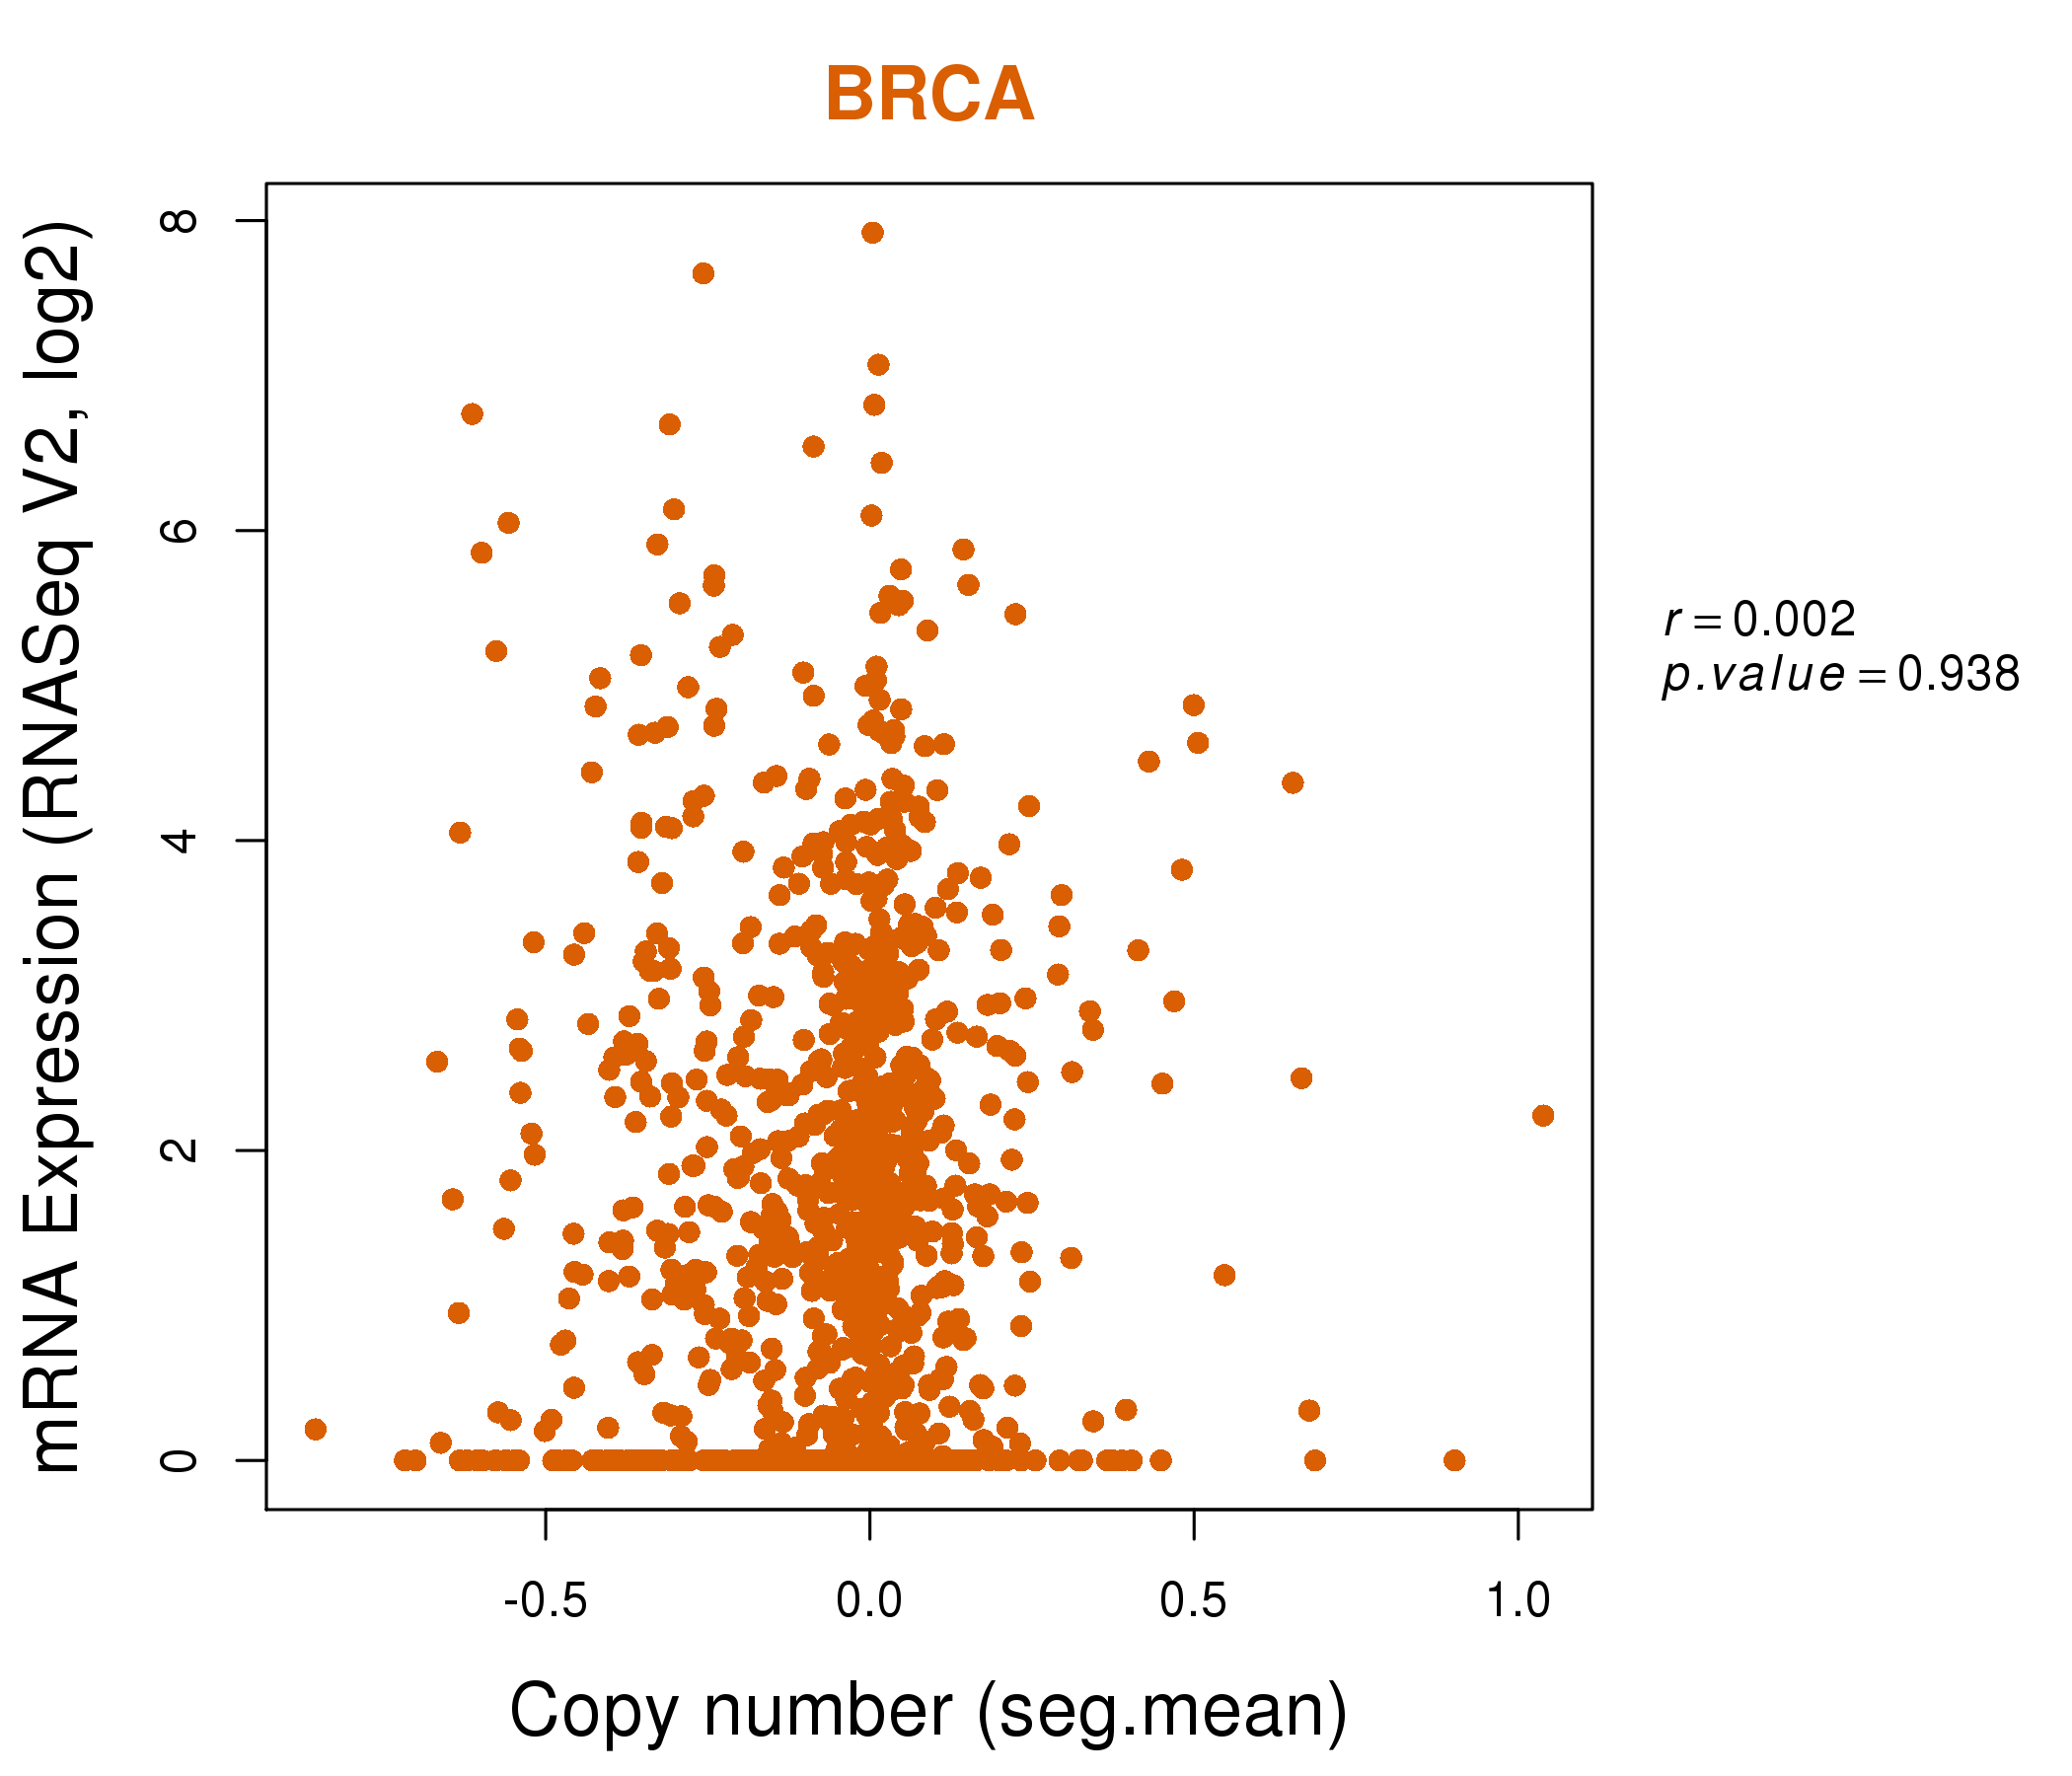
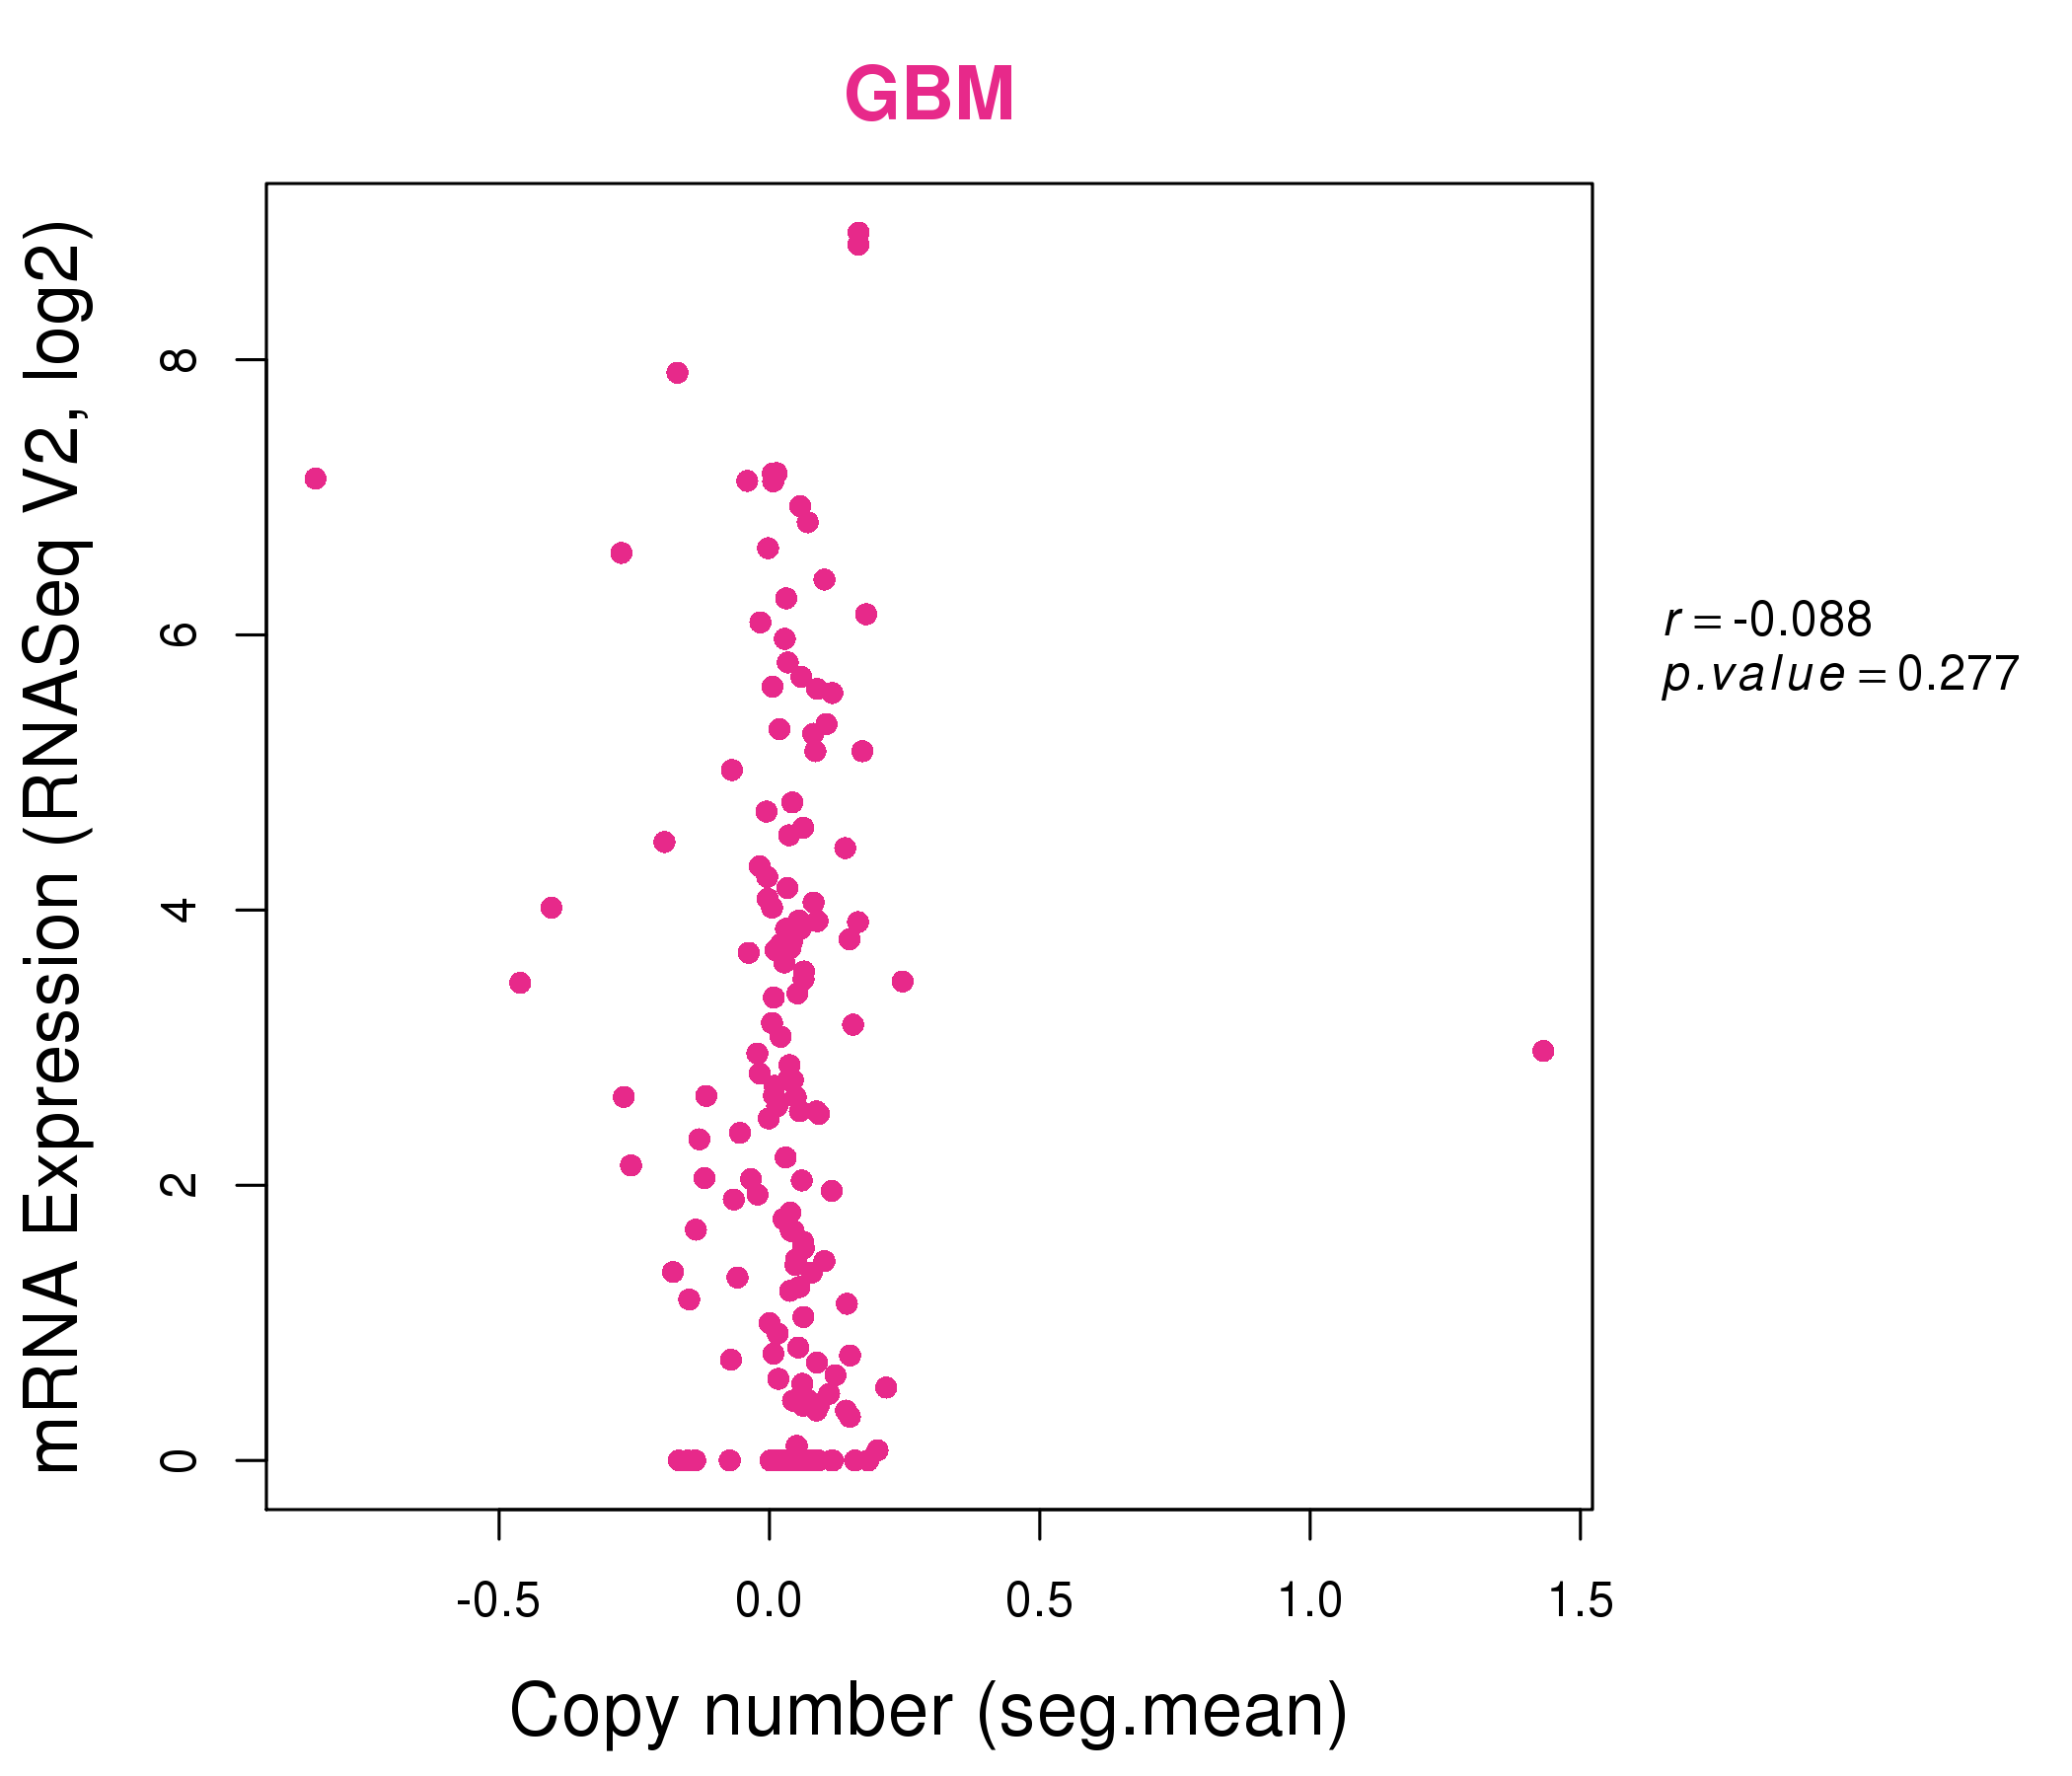
| * Copy number data were extracted from TCGA using R package TCGA-Assembler. The URLs of all public data files on TCGA DCC data server were gathered on Jan-05-2015. Function ProcessCNAData in TCGA-Assembler package was used to obtain gene-level copy number value which is calculated as the average copy number of the genomic region of a gene. |
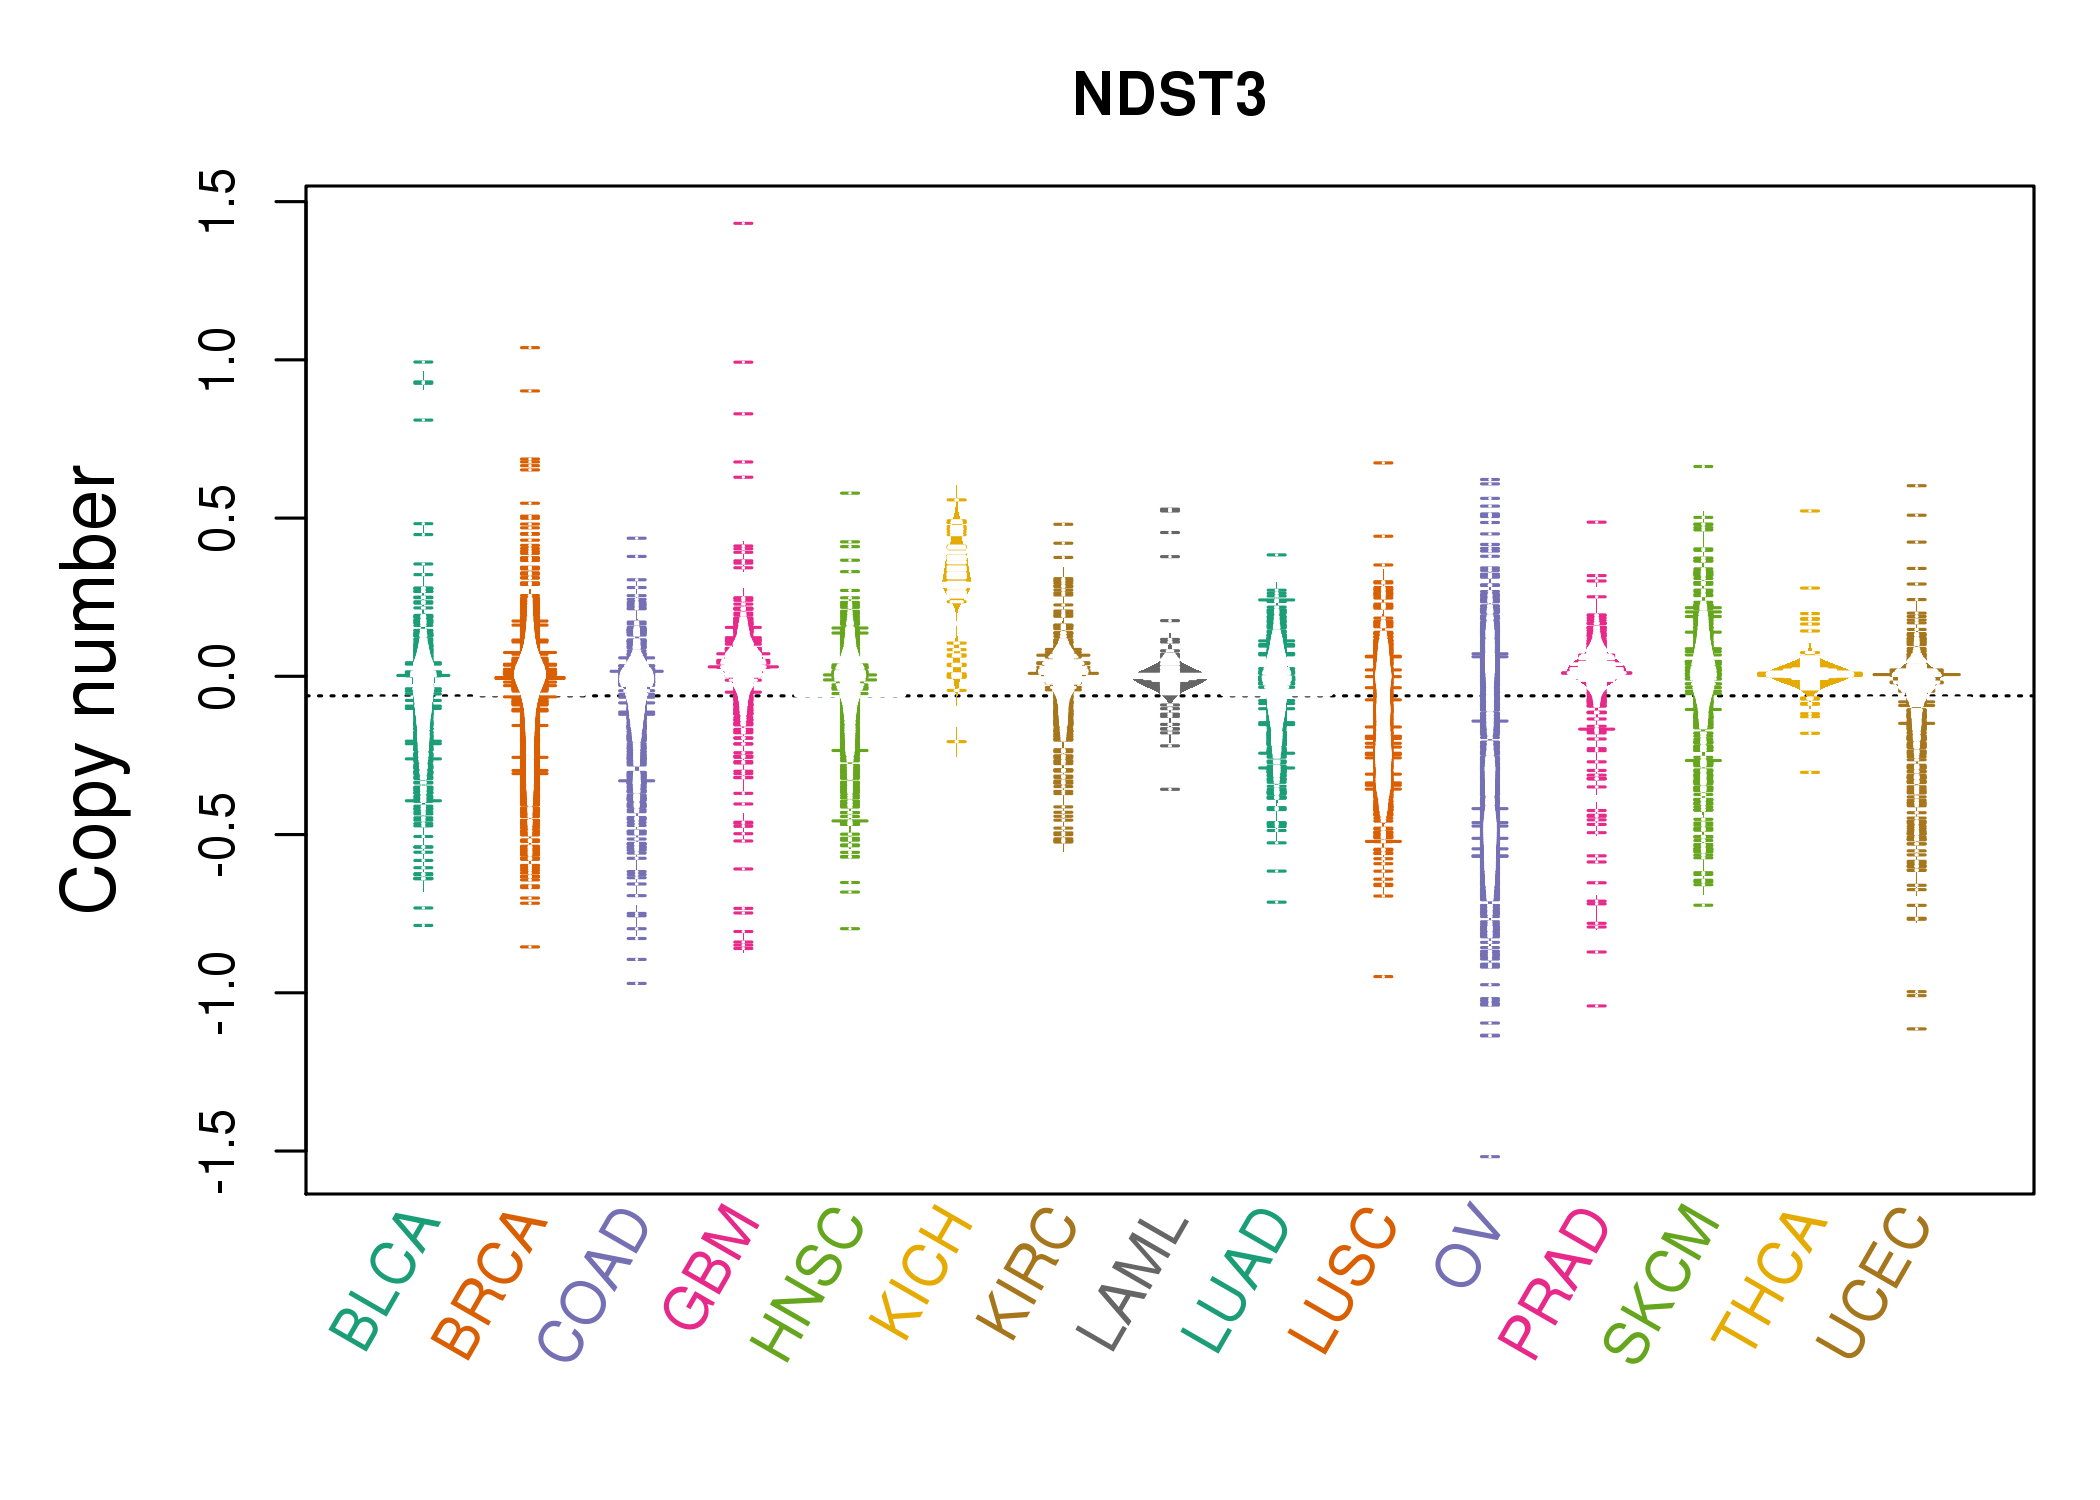 |
| cf) Tissue ID[Tissue type]: BLCA[Bladder Urothelial Carcinoma], BRCA[Breast invasive carcinoma], CESC[Cervical squamous cell carcinoma and endocervical adenocarcinoma], COAD[Colon adenocarcinoma], GBM[Glioblastoma multiforme], Glioma Low Grade, HNSC[Head and Neck squamous cell carcinoma], KICH[Kidney Chromophobe], KIRC[Kidney renal clear cell carcinoma], KIRP[Kidney renal papillary cell carcinoma], LAML[Acute Myeloid Leukemia], LUAD[Lung adenocarcinoma], LUSC[Lung squamous cell carcinoma], OV[Ovarian serous cystadenocarcinoma ], PAAD[Pancreatic adenocarcinoma], PRAD[Prostate adenocarcinoma], SKCM[Skin Cutaneous Melanoma], STAD[Stomach adenocarcinoma], THCA[Thyroid carcinoma], UCEC[Uterine Corpus Endometrial Carcinoma] |
| Top |
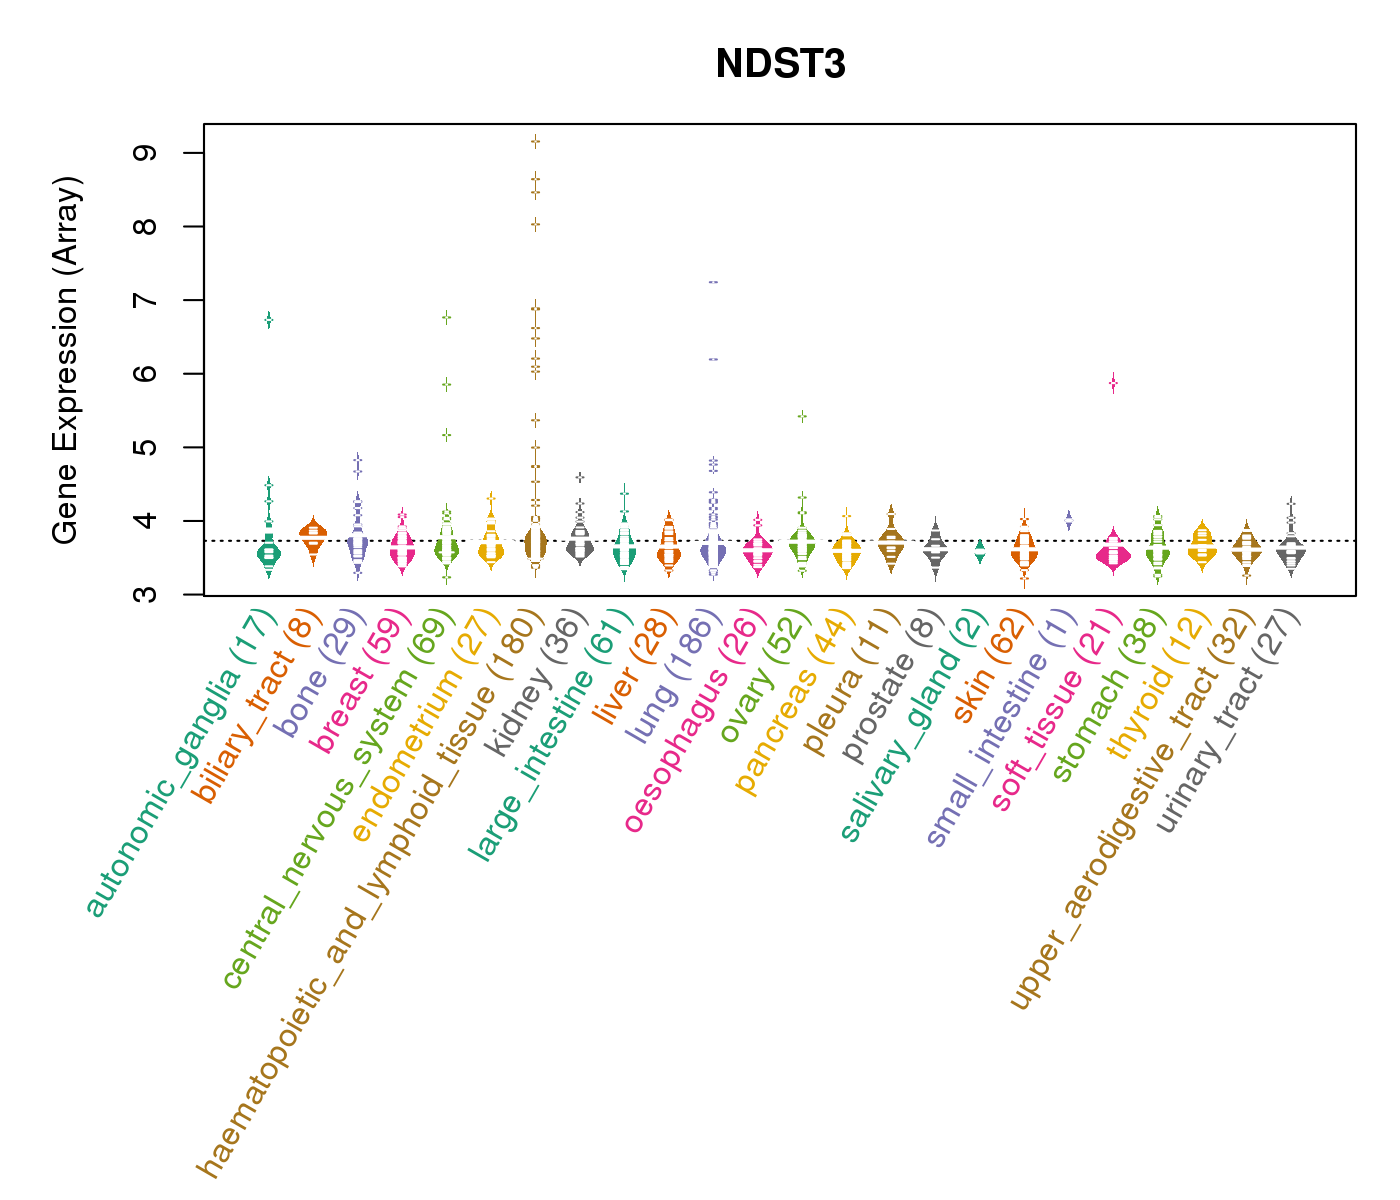
| Gene Expression for NDST3 |
| * CCLE gene expression data were extracted from CCLE_Expression_Entrez_2012-10-18.res: Gene-centric RMA-normalized mRNA expression data. |
 |
| * Normalized gene expression data of RNASeqV2 was extracted from TCGA using R package TCGA-Assembler. The URLs of all public data files on TCGA DCC data server were gathered at Jan-05-2015. Only eight cancer types have enough normal control samples for differential expression analysis. (t test, adjusted p<0.05 (using Benjamini-Hochberg FDR)) |
 |
| Top |
| * This plots show the correlation between CNV and gene expression. |
: Open all plots for all cancer types
 |
|
 |
|
| Top |
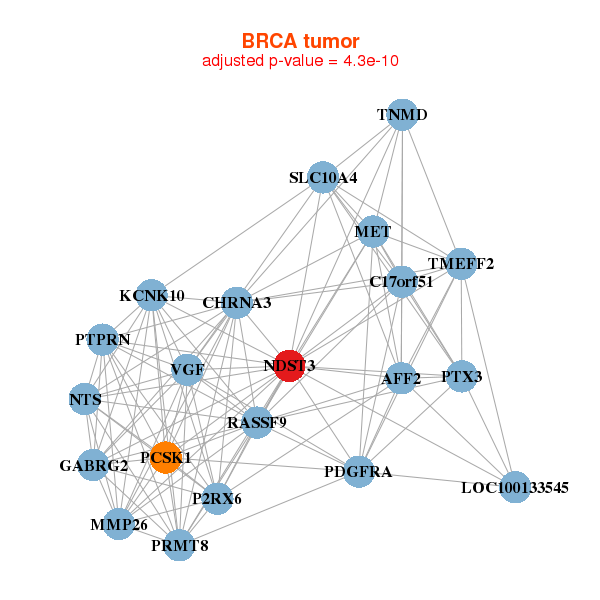
| Gene-Gene Network Information |
| * Co-Expression network figures were drawn using R package igraph. Only the top 20 genes with the highest correlations were shown. Red circle: input gene, orange circle: cell metabolism gene, sky circle: other gene |
: Open all plots for all cancer types
 |
|
| AFF2,C17orf51,CHRNA3,GABRG2,KCNK10,LOC100133545,MET, MMP26,NDST3,NTS,P2RX6,PCSK1,PDGFRA,PRMT8, PTPRN,PTX3,RASSF9,SLC10A4,TMEFF2,TNMD,VGF | ACTBL2,CA13,CBLN4,CHN1,CLDN1,DEFB131,FAM133A, FAM3C,KCNK2,LXN,MAPK1IP1L,NDST3,NDST4,NUS1, OR6Y1,RGS2,SLC26A2,SOCS5,STXBP3,TBK1,UBLCP1 |
 |
|
| CH25H,COL9A1,CORIN,DKK3,F2R,F2RL2,FAT4, FIBIN,FOXF1,GLI1,GPR1,IP6K3,ITGA11,KLHL13, NDST3,PCDH18,PDGFC,PDZD2,SDC2,TNFSF11,WNT2 | ADORA2B,ALDH3A1,ARL15,CNTN4,EFNB2,EPB41L5,BRINP2, HAS3,LANCL3,LOC723809,MIER3,NDST3,NFE2L2,NPHS2, NRG1,RPL10L,SLC20A1,UGDH,UGT1A10,UGT1A8,ZNF800 |
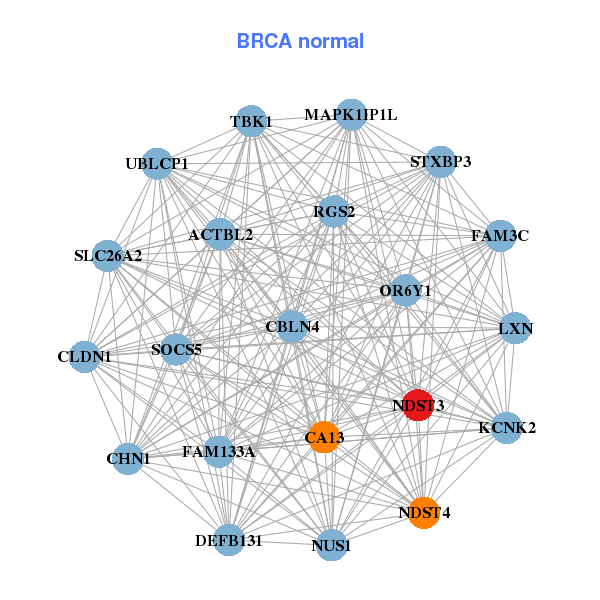

| * Co-Expression network figures were drawn using R package igraph. Only the top 20 genes with the highest correlations were shown. Red circle: input gene, orange circle: cell metabolism gene, sky circle: other gene |
: Open all plots for all cancer types
| Top |
: Open all interacting genes' information including KEGG pathway for all interacting genes from DAVID
| Top |
| Pharmacological Information for NDST3 |
| There's no related Drug. |
| Top |
| Cross referenced IDs for NDST3 |
| * We obtained these cross-references from Uniprot database. It covers 150 different DBs, 18 categories. http://www.uniprot.org/help/cross_references_section |
: Open all cross reference information
|
Copyright © 2016-Present - The Univsersity of Texas Health Science Center at Houston @ |