|
||||||||||||||||||||||||||||||||||||||||||||||||||||||||||||||||||||||||||||||||||||||||||||||||||||||||||||||||||||||||||||||||||||||||||||||||||||||||||||||||||||||||||||||||||||||||||||||||||||||||||||||||||||||||||||||||||||||||||||||||||||||||||||||||||||||||||||||||||||||||||||||||||||||||||||||||||||||||||
| |
| Phenotypic Information (metabolism pathway, cancer, disease, phenome) |
| |
| |
| Gene-Gene Network Information: Co-Expression Network, Interacting Genes & KEGG |
| |
|


| Gene Summary for TPTE2 |
| Basic gene info. | Gene symbol | TPTE2 |
| Gene name | transmembrane phosphoinositide 3-phosphatase and tensin homolog 2 | |
| Synonyms | TPIP | |
| Cytomap | UCSC genome browser: 13q12.11 | |
| Genomic location | chr13 :19997018-20110903 | |
| Type of gene | protein-coding | |
| RefGenes | NM_199255.1, NM_001141968.1,NM_001271850.1,NM_130785.3,NM_199254.2, NR_073485.1,NR_073486.1,NR_073487.1, | |
| Ensembl id | ENSG00000132958 | |
| Description | PTEN-like inositol lipid phosphataseTPIP lipid phosphataseTPTE and PTEN homologous inositol lipid phosphataselipid phosphatase TPIPphosphatidylinositol 3,4,5-trisphosphate 3-phosphatase TPTE2phosphatidylinositol-3,4,5-trisphosphate 3-phosphatase TPTE | |
| Modification date | 20141207 | |
| dbXrefs | MIM : 606791 | |
| HGNC : HGNC | ||
| Ensembl : ENSG00000132958 | ||
| HPRD : 06003 | ||
| Vega : OTTHUMG00000016493 | ||
| Protein | UniProt: Q6XPS3 go to UniProt's Cross Reference DB Table | |
| Expression | CleanEX: HS_TPTE2 | |
| BioGPS: 93492 | ||
| Gene Expression Atlas: ENSG00000132958 | ||
| The Human Protein Atlas: ENSG00000132958 | ||
| Pathway | NCI Pathway Interaction Database: TPTE2 | |
| KEGG: TPTE2 | ||
| REACTOME: TPTE2 | ||
| ConsensusPathDB | ||
| Pathway Commons: TPTE2 | ||
| Metabolism | MetaCyc: TPTE2 | |
| HUMANCyc: TPTE2 | ||
| Regulation | Ensembl's Regulation: ENSG00000132958 | |
| miRBase: chr13 :19,997,018-20,110,903 | ||
| TargetScan: NM_199255 | ||
| cisRED: ENSG00000132958 | ||
| Context | iHOP: TPTE2 | |
| cancer metabolism search in PubMed: TPTE2 | ||
| UCL Cancer Institute: TPTE2 | ||
| Assigned class in ccmGDB | B - This gene belongs to cancer gene. | |
| Top |
| Phenotypic Information for TPTE2(metabolism pathway, cancer, disease, phenome) |
| Cancer | CGAP: TPTE2 |
| Familial Cancer Database: TPTE2 | |
| * This gene is included in those cancer gene databases. |
|
|
|
|
|
| . | ||||||||||||||||||||||||||||||||||||||||||||||||||||||||||||||||||||||||||||||||||||||||||||||||||||||||||||||||||||||||||||||||||||||||||||||||||||||||||||||||||||||||||||||||||||||||||||||||||||||||||||||||||||||||||||||||||||||||||||||||||||||||||||||||||||||||||||||||||||||||||||||||||||||||||||||||||||
Oncogene 1 | Significant driver gene in GBM 6, | |||||||||||||||||||||||||||||||||||||||||||||||||||||||||||||||||||||||||||||||||||||||||||||||||||||||||||||||||||||||||||||||||||||||||||||||||||||||||||||||||||||||||||||||||||||||||||||||||||||||||||||||||||||||||||||||||||||||||||||||||||||||||||||||||||||||||||||||||||||||||||||||||||||||||||||||||||||||||
| cf) number; DB name 1 Oncogene; http://nar.oxfordjournals.org/content/35/suppl_1/D721.long, 2 Tumor Suppressor gene; https://bioinfo.uth.edu/TSGene/, 3 Cancer Gene Census; http://www.nature.com/nrc/journal/v4/n3/abs/nrc1299.html, 4 CancerGenes; http://nar.oxfordjournals.org/content/35/suppl_1/D721.long, 5 Network of Cancer Gene; http://ncg.kcl.ac.uk/index.php, 6 http://www.sciencedirect.com/science/article/pii/S0092867413012087, 7Therapeutic Vulnerabilities in Cancer; http://cbio.mskcc.org/cancergenomics/statius/ |
| REACTOME_PHOSPHOLIPID_METABOLISM REACTOME_PI_METABOLISM REACTOME_METABOLISM_OF_LIPIDS_AND_LIPOPROTEINS | |
| OMIM | 606791; gene. 606791; gene. |
| Orphanet | |
| Disease | KEGG Disease: TPTE2 |
| MedGen: TPTE2 (Human Medical Genetics with Condition) | |
| ClinVar: TPTE2 | |
| Phenotype | MGI: TPTE2 (International Mouse Phenotyping Consortium) |
| PhenomicDB: TPTE2 | |
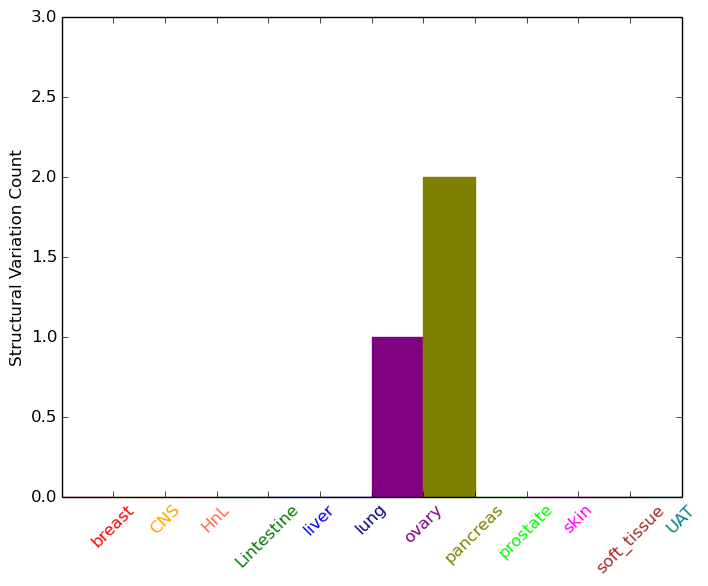
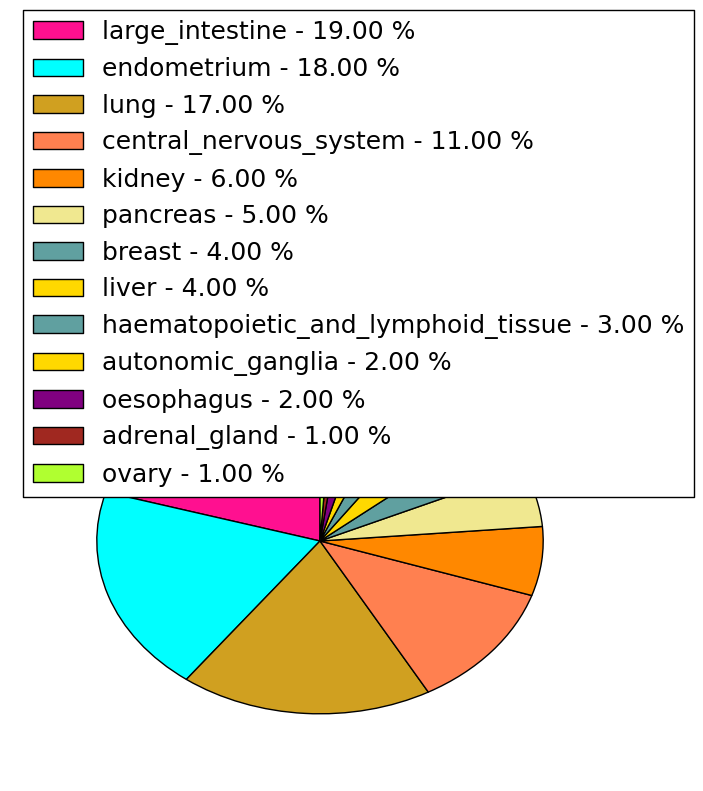
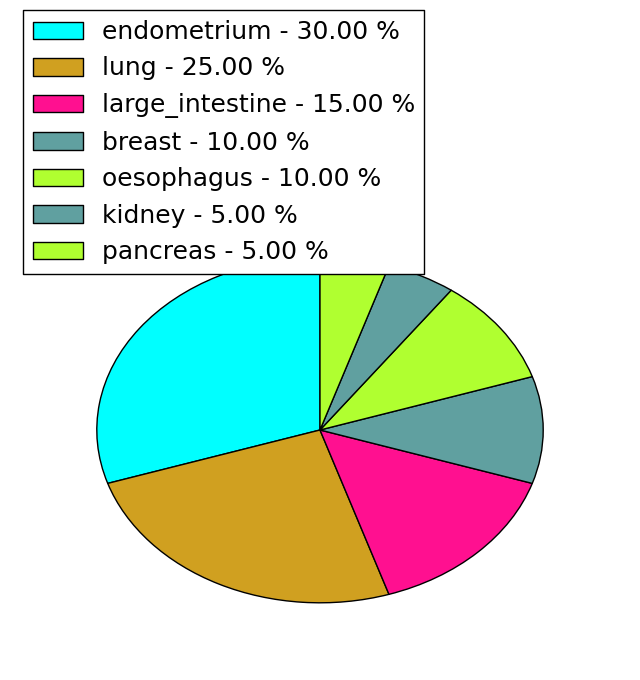
| Mutations for TPTE2 |
| * Under tables are showing count per each tissue to give us broad intuition about tissue specific mutation patterns.You can go to the detailed page for each mutation database's web site. |
| - Statistics for Tissue and Mutation type | Top |
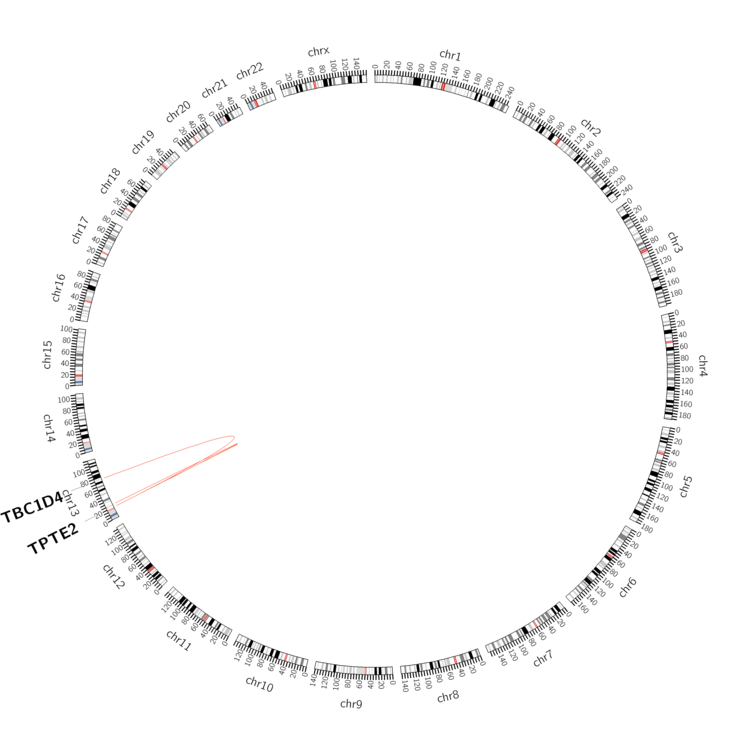 |
| - For Inter-chromosomal Variations |
| There's no inter-chromosomal structural variation. |
| - For Intra-chromosomal Variations |
| * Intra-chromosomal variantions includes 'intrachromosomal amplicon to amplicon', 'intrachromosomal amplicon to non-amplified dna', 'intrachromosomal deletion', 'intrachromosomal fold-back inversion', 'intrachromosomal inversion', 'intrachromosomal tandem duplication', 'Intrachromosomal unknown type', 'intrachromosomal with inverted orientation', 'intrachromosomal with non-inverted orientation'. |
 |
| Sample | Symbol_a | Chr_a | Start_a | End_a | Symbol_b | Chr_b | Start_b | End_b |
| ovary | TPTE2 | chr13 | 20028740 | 20028760 | TBC1D4 | chr13 | 75865951 | 75865971 |
| pancreas | TPTE2 | chr13 | 20098197 | 20098217 | chr13 | 20113025 | 20113045 | |
| pancreas | TPTE2 | chr13 | 20100870 | 20100890 | chr13 | 25151377 | 25151397 |
| cf) Tissue number; Tissue name (1;Breast, 2;Central_nervous_system, 3;Haematopoietic_and_lymphoid_tissue, 4;Large_intestine, 5;Liver, 6;Lung, 7;Ovary, 8;Pancreas, 9;Prostate, 10;Skin, 11;Soft_tissue, 12;Upper_aerodigestive_tract) |
| * From mRNA Sanger sequences, Chitars2.0 arranged chimeric transcripts. This table shows TPTE2 related fusion information. |
| ID | Head Gene | Tail Gene | Accession | Gene_a | qStart_a | qEnd_a | Chromosome_a | tStart_a | tEnd_a | Gene_a | qStart_a | qEnd_a | Chromosome_a | tStart_a | tEnd_a |
| Top |
| Mutation type/ Tissue ID | brca | cns | cerv | endome | haematopo | kidn | Lintest | liver | lung | ns | ovary | pancre | prost | skin | stoma | thyro | urina | |||
| Total # sample | 1 | 2 | 1 | 1 | ||||||||||||||||
| GAIN (# sample) | 1 | 2 | ||||||||||||||||||
| LOSS (# sample) | 1 | 1 |
| cf) Tissue ID; Tissue type (1; Breast, 2; Central_nervous_system, 3; Cervix, 4; Endometrium, 5; Haematopoietic_and_lymphoid_tissue, 6; Kidney, 7; Large_intestine, 8; Liver, 9; Lung, 10; NS, 11; Ovary, 12; Pancreas, 13; Prostate, 14; Skin, 15; Stomach, 16; Thyroid, 17; Urinary_tract) |
| Top |
|
 |
| Top |
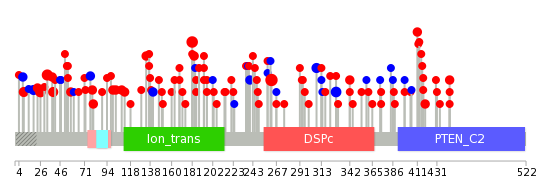
| Stat. for Non-Synonymous SNVs (# total SNVs=86) | (# total SNVs=20) |
 |  |
(# total SNVs=1) | (# total SNVs=0) |
 |
| Top |
| * When you move the cursor on each content, you can see more deailed mutation information on the Tooltip. Those are primary_site,primary_histology,mutation(aa),pubmedID. |
| GRCh37 position | Mutation(aa) | Unique sampleID count |
| chr13:20012252-20012252 | p.E262K | 9 |
| chr13:20025334-20025334 | p.R181Q | 7 |
| chr13:20067011-20067011 | p.L33R | 5 |
| chr13:20039688-20039688 | p.R100* | 5 |
| chr13:20067033-20067033 | p.S26G | 4 |
| chr13:20048070-20048070 | p.R89* | 4 |
| chr13:20006719-20006719 | p.? | 4 |
| chr13:20006620-20006620 | p.S328S | 4 |
| chr13:19997210-19997210 | p.E444K | 3 |
| chr13:20006680-20006680 | p.L308L | 3 |
| Top |
|
 |
| Point Mutation/ Tissue ID | 1 | 2 | 3 | 4 | 5 | 6 | 7 | 8 | 9 | 10 | 11 | 12 | 13 | 14 | 15 | 16 | 17 | 18 | 19 | 20 |
| # sample | 3 | 2 | 14 | 5 | 6 | 6 | 1 | 10 | 10 | 3 | 3 | 32 | 14 | 2 | 14 | |||||
| # mutation | 3 | 2 | 12 | 5 | 6 | 7 | 1 | 10 | 10 | 3 | 3 | 35 | 13 | 1 | 19 | |||||
| nonsynonymous SNV | 2 | 2 | 11 | 5 | 3 | 6 | 1 | 8 | 8 | 2 | 3 | 28 | 11 | 1 | 15 | |||||
| synonymous SNV | 1 | 1 | 3 | 1 | 2 | 2 | 1 | 7 | 2 | 4 |
| cf) Tissue ID; Tissue type (1; BLCA[Bladder Urothelial Carcinoma], 2; BRCA[Breast invasive carcinoma], 3; CESC[Cervical squamous cell carcinoma and endocervical adenocarcinoma], 4; COAD[Colon adenocarcinoma], 5; GBM[Glioblastoma multiforme], 6; Glioma Low Grade, 7; HNSC[Head and Neck squamous cell carcinoma], 8; KICH[Kidney Chromophobe], 9; KIRC[Kidney renal clear cell carcinoma], 10; KIRP[Kidney renal papillary cell carcinoma], 11; LAML[Acute Myeloid Leukemia], 12; LUAD[Lung adenocarcinoma], 13; LUSC[Lung squamous cell carcinoma], 14; OV[Ovarian serous cystadenocarcinoma ], 15; PAAD[Pancreatic adenocarcinoma], 16; PRAD[Prostate adenocarcinoma], 17; SKCM[Skin Cutaneous Melanoma], 18:STAD[Stomach adenocarcinoma], 19:THCA[Thyroid carcinoma], 20:UCEC[Uterine Corpus Endometrial Carcinoma]) |
| Top |
| * We represented just top 10 SNVs. When you move the cursor on each content, you can see more deailed mutation information on the Tooltip. Those are primary_site, primary_histology, mutation(aa), pubmedID. |
| Genomic Position | Mutation(aa) | Unique sampleID count |
| chr13:20025334 | p.E10K,TPTE2 | 5 |
| chr13:20012252 | p.R181Q,TPTE2 | 5 |
| chr13:20056687 | p.S40R,TPTE2 | 4 |
| chr13:20067596 | p.G79A,TPTE2 | 3 |
| chr13:20067628 | p.M41V,TPTE2 | 3 |
| chr13:20048099 | p.A19A,TPTE2 | 3 |
| chr13:20056686 | p.E9K,TPTE2 | 3 |
| chr13:19997208 | p.E192D,TPTE2 | 2 |
| chr13:20025355 | p.G122R,TPTE2 | 2 |
| chr13:20039417 | p.R193I,TPTE2 | 2 |
| * Copy number data were extracted from TCGA using R package TCGA-Assembler. The URLs of all public data files on TCGA DCC data server were gathered on Jan-05-2015. Function ProcessCNAData in TCGA-Assembler package was used to obtain gene-level copy number value which is calculated as the average copy number of the genomic region of a gene. |
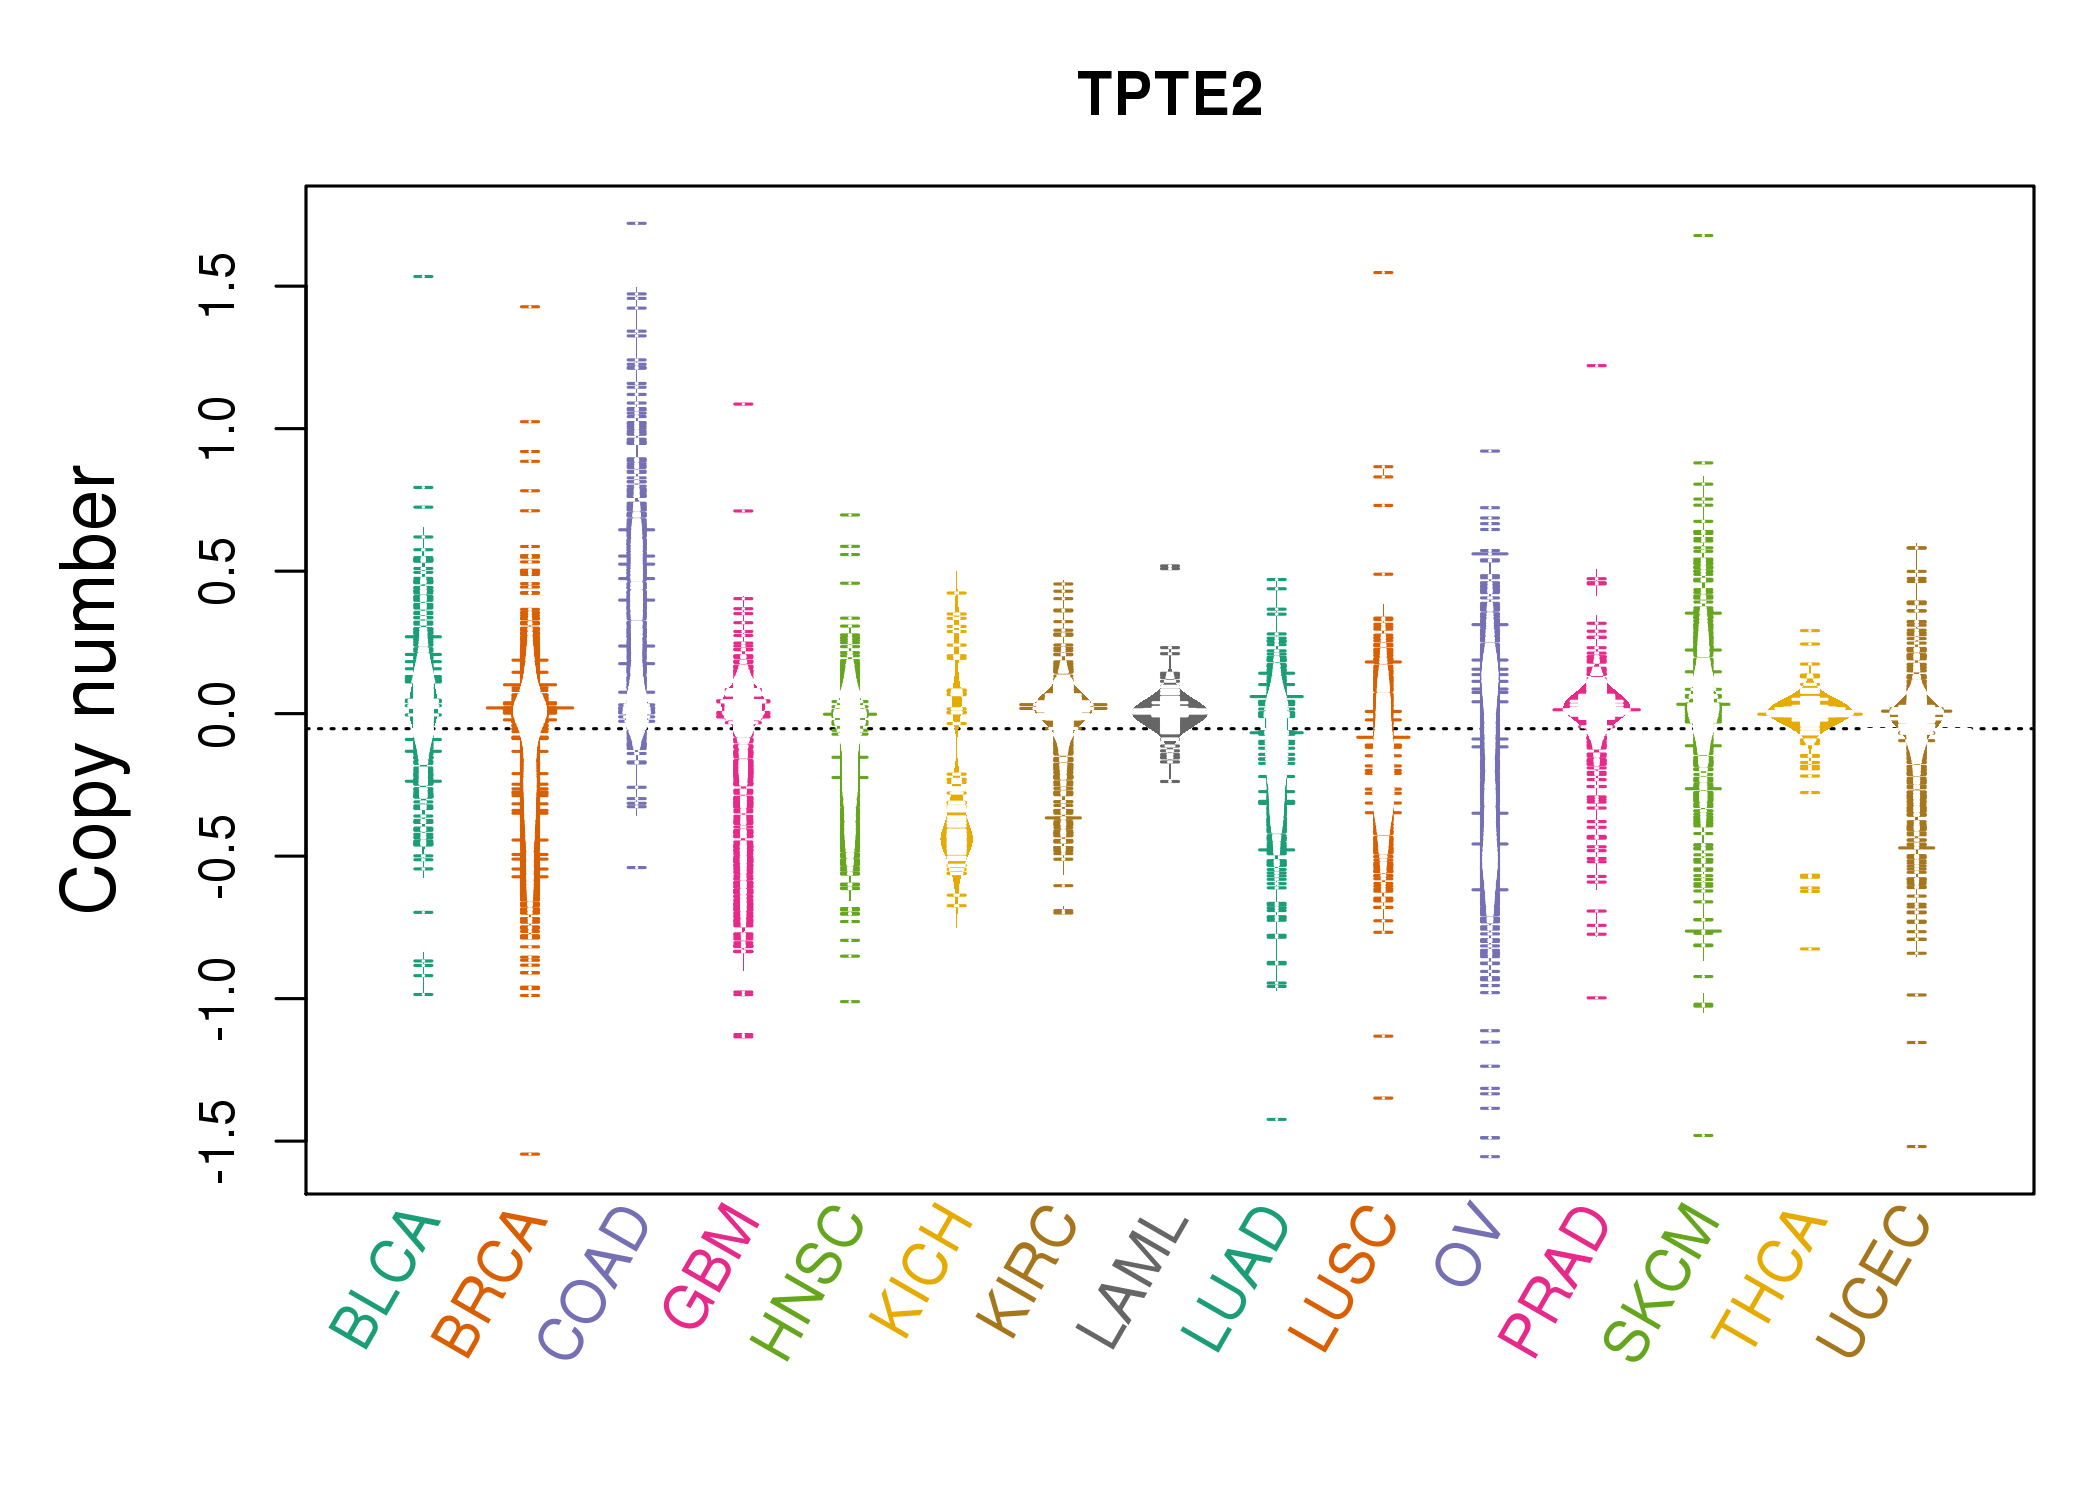 |
| cf) Tissue ID[Tissue type]: BLCA[Bladder Urothelial Carcinoma], BRCA[Breast invasive carcinoma], CESC[Cervical squamous cell carcinoma and endocervical adenocarcinoma], COAD[Colon adenocarcinoma], GBM[Glioblastoma multiforme], Glioma Low Grade, HNSC[Head and Neck squamous cell carcinoma], KICH[Kidney Chromophobe], KIRC[Kidney renal clear cell carcinoma], KIRP[Kidney renal papillary cell carcinoma], LAML[Acute Myeloid Leukemia], LUAD[Lung adenocarcinoma], LUSC[Lung squamous cell carcinoma], OV[Ovarian serous cystadenocarcinoma ], PAAD[Pancreatic adenocarcinoma], PRAD[Prostate adenocarcinoma], SKCM[Skin Cutaneous Melanoma], STAD[Stomach adenocarcinoma], THCA[Thyroid carcinoma], UCEC[Uterine Corpus Endometrial Carcinoma] |
| Top |
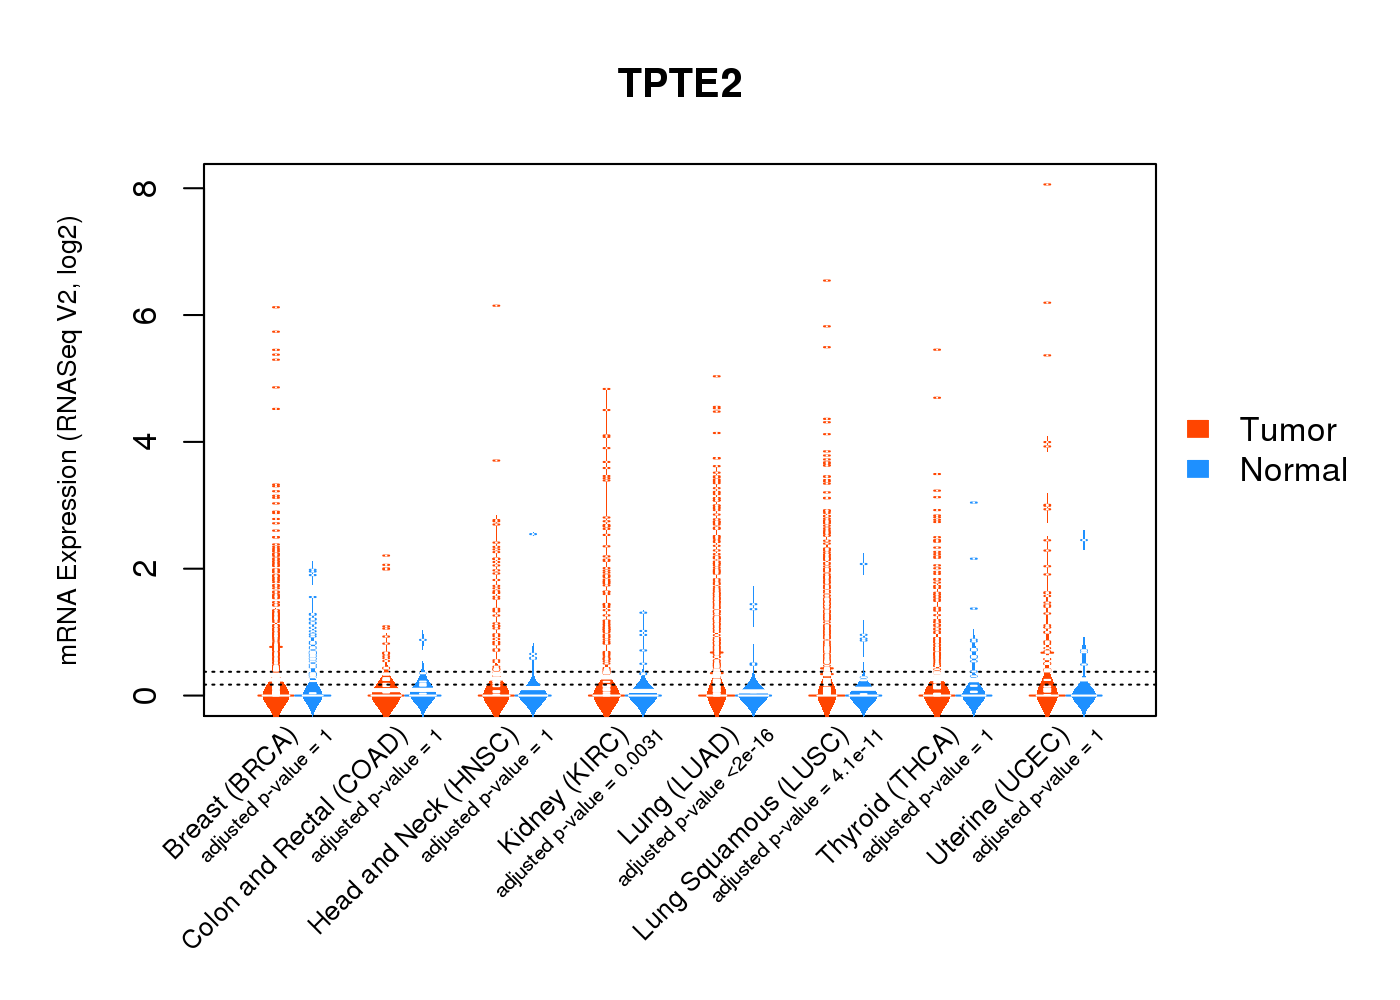
| Gene Expression for TPTE2 |
| * CCLE gene expression data were extracted from CCLE_Expression_Entrez_2012-10-18.res: Gene-centric RMA-normalized mRNA expression data. |
 |
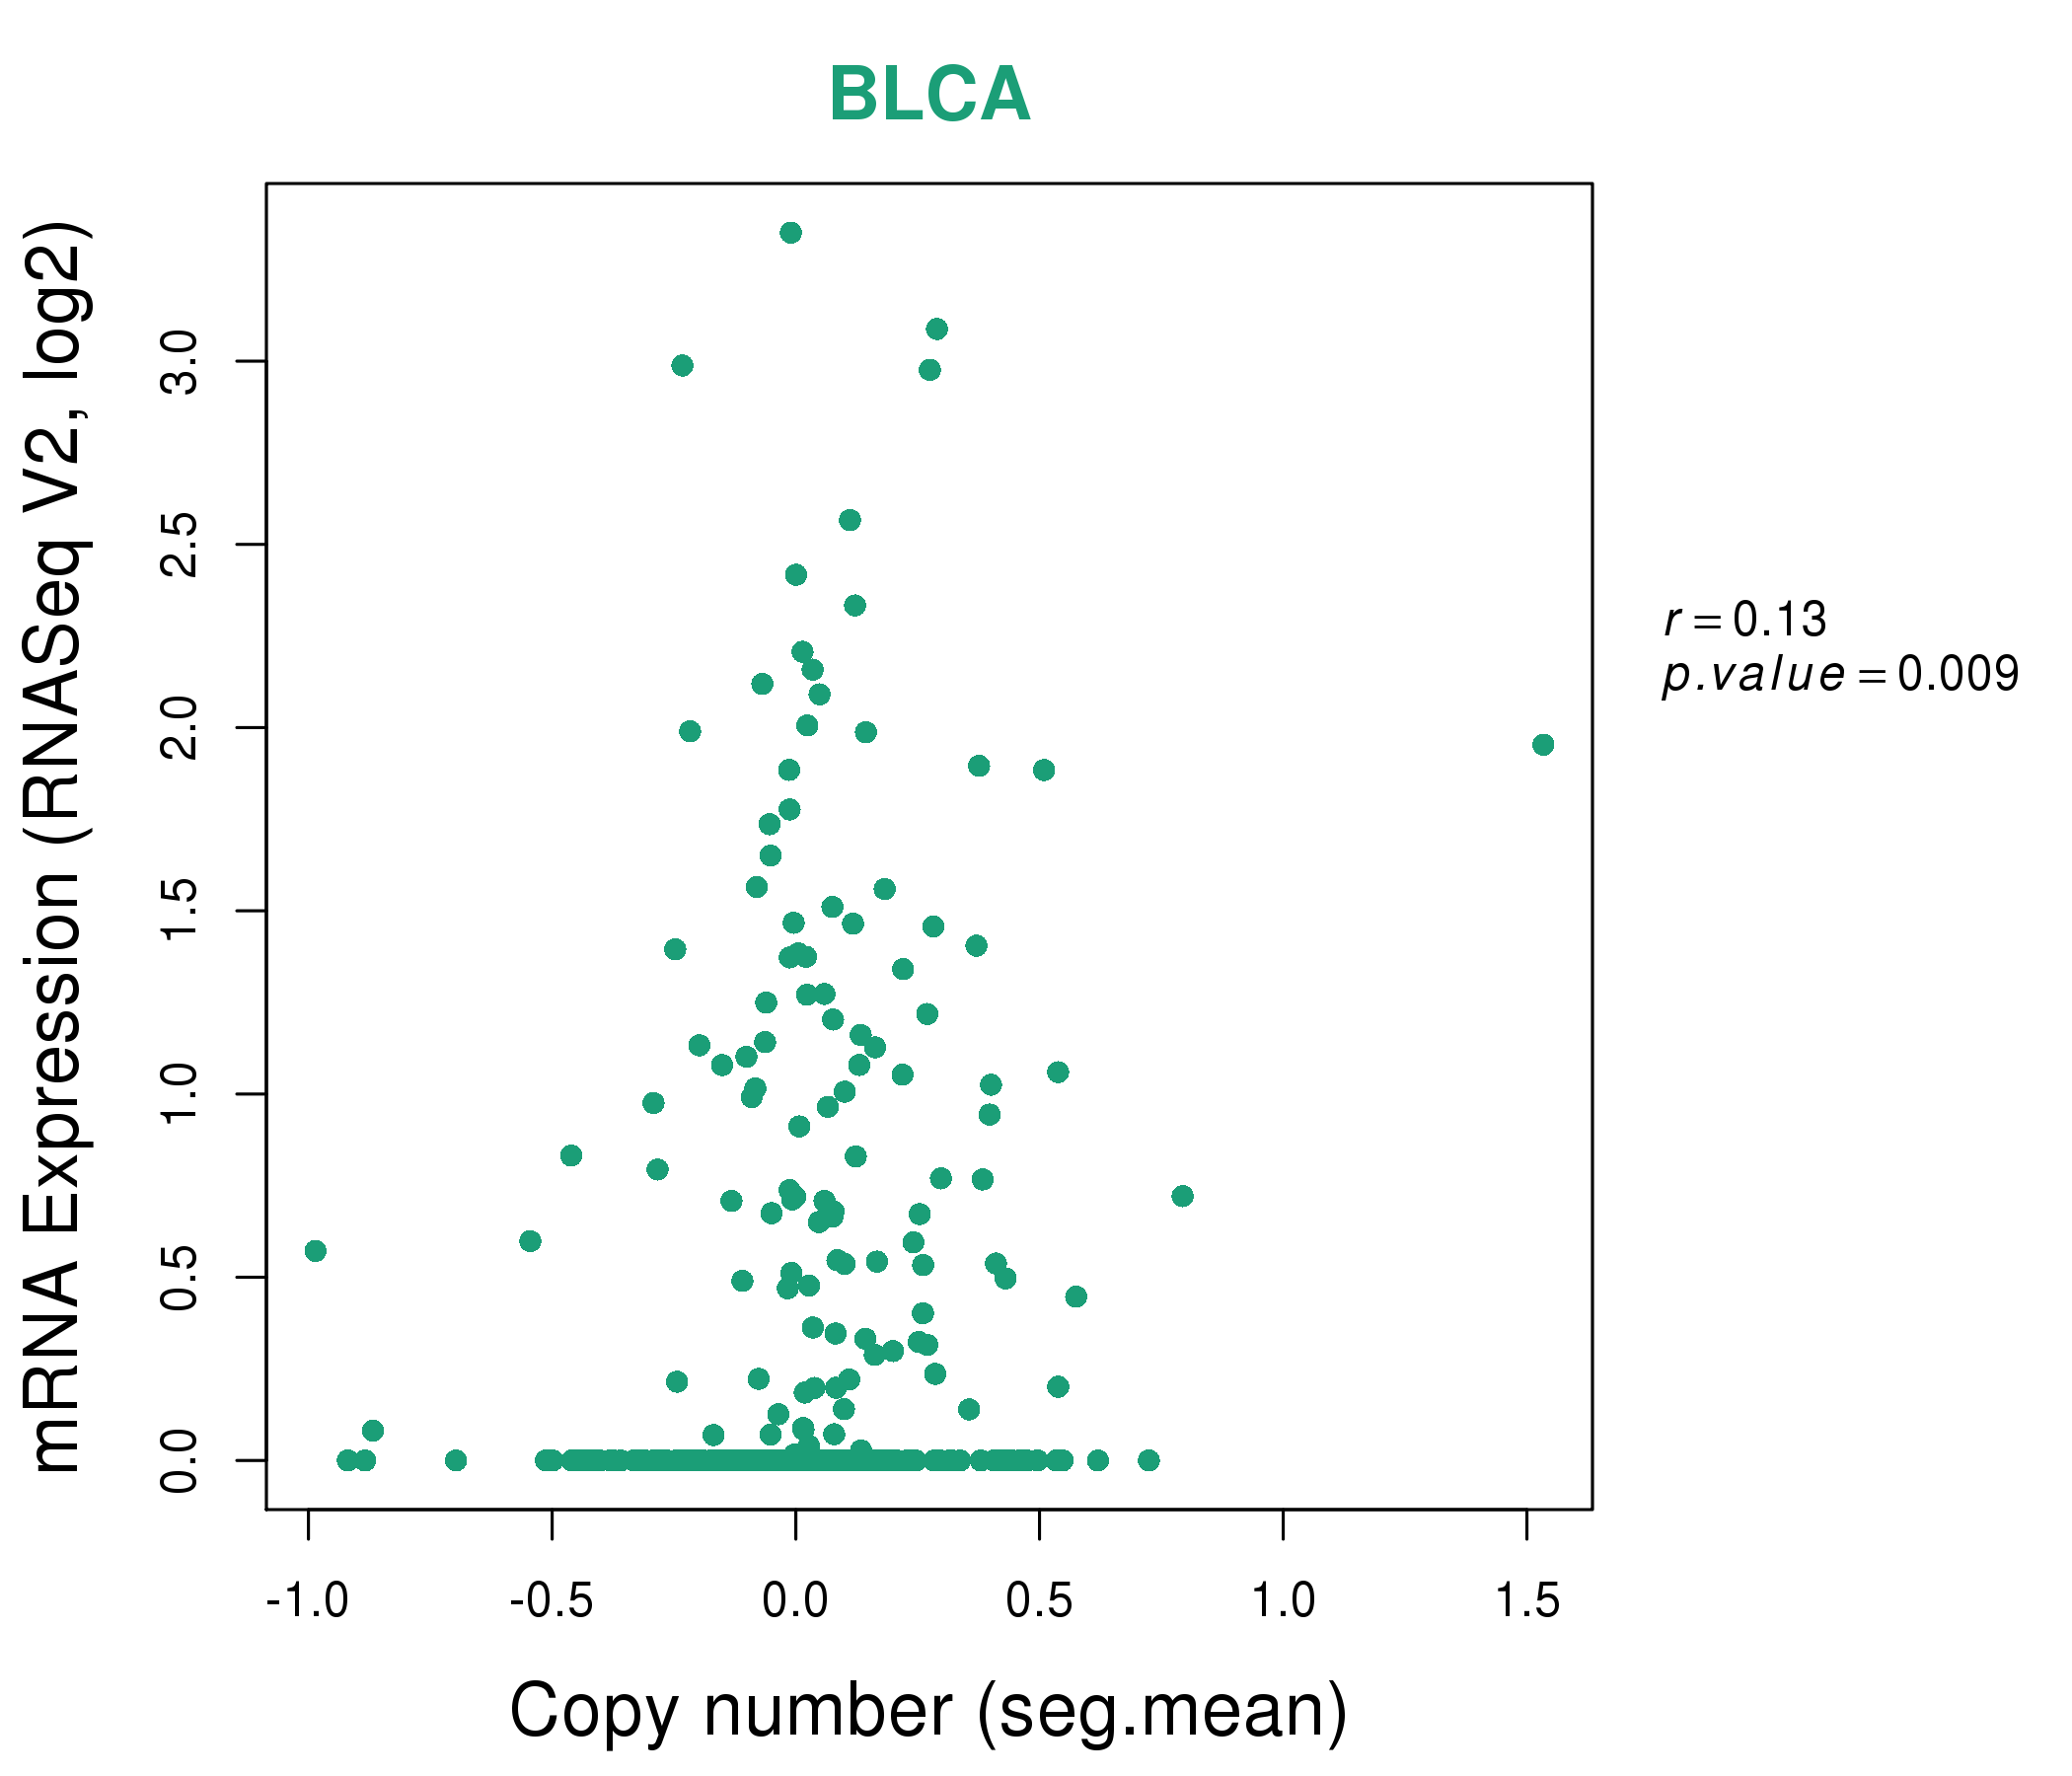
| * Normalized gene expression data of RNASeqV2 was extracted from TCGA using R package TCGA-Assembler. The URLs of all public data files on TCGA DCC data server were gathered at Jan-05-2015. Only eight cancer types have enough normal control samples for differential expression analysis. (t test, adjusted p<0.05 (using Benjamini-Hochberg FDR)) |
 |
| Top |
| * This plots show the correlation between CNV and gene expression. |
: Open all plots for all cancer types
 |
|
 |
|


| Top |
| Gene-Gene Network Information |
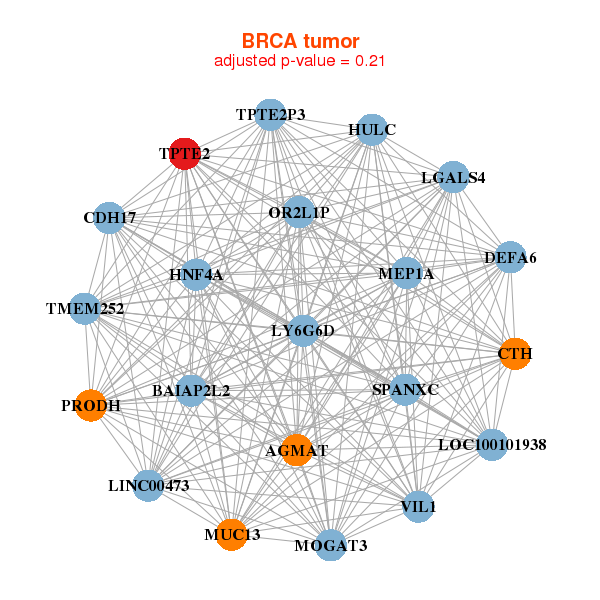
| * Co-Expression network figures were drawn using R package igraph. Only the top 20 genes with the highest correlations were shown. Red circle: input gene, orange circle: cell metabolism gene, sky circle: other gene |
: Open all plots for all cancer types
 |
|
| AGMAT,BAIAP2L2,LINC00473,TMEM252,CDH17,CTH,DEFA6, HNF4A,HULC,LGALS4,LOC100101938,LY6G6D,MEP1A,MOGAT3, MUC13,OR2L1P,PRODH,SPANXC,TPTE2,TPTE2P3,VIL1 | BTN3A1,CTLA4,CXorf65,FLJ40330,GABBR2,GML,HESX1, HLA-DOB,INPP5B,LAG3,LAMP3,LOC100188949,LOC284749,PATL2, PNOC,RUFY4,SLAMF6,SP100,SP110,TPTE2,ZBP1 |
 |
|
| ADAM6,CD180,CPNE5,DERL3,FCRL5,FLJ40330,IRF4, KCNA3,KCNN3,KIAA0125,LAX1,LOC100233209,LOC96610,LTF, MZB1,PARP15,PIM2,PNOC,SLAMF1,TPTE2,TRIM55 | ADA,BFSP2,BTN1A1,C16orf74,C3orf20,CCR4,DOK3, DTHD1,EOMES,KCNA3,KLHL6,LOC100233209,NLRP11,ORAI2, PMS2P3,RASGRP3,RGS14,SUSD3,TLR6,TPTE2,TRAF3IP3 |
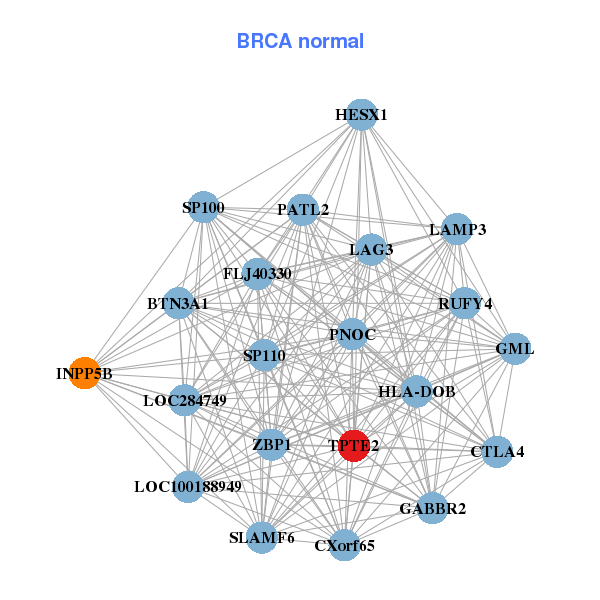
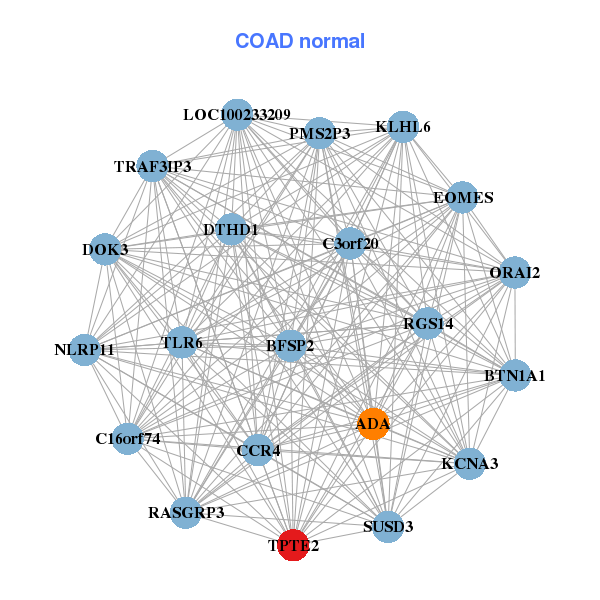
| * Co-Expression network figures were drawn using R package igraph. Only the top 20 genes with the highest correlations were shown. Red circle: input gene, orange circle: cell metabolism gene, sky circle: other gene |
: Open all plots for all cancer types
| Top |
: Open all interacting genes' information including KEGG pathway for all interacting genes from DAVID
| Top |
| Pharmacological Information for TPTE2 |
| There's no related Drug. |
| Top |
| Cross referenced IDs for TPTE2 |
| * We obtained these cross-references from Uniprot database. It covers 150 different DBs, 18 categories. http://www.uniprot.org/help/cross_references_section |
: Open all cross reference information
|
Copyright © 2016-Present - The Univsersity of Texas Health Science Center at Houston @ |