|
||||||||||||||||||||||||||||||||||||||||||||||||||||||||||||||||||||||||||||||||||||||||||||||||||||||||||||||||||||||||||||||||||||||||||||||||||||||||||||||||||||||||||||||||||||||||||||||||||||||||||||||||||||||||||||||||||||||||||||||||||||||||||||||||||||||||||||||||||||||||||||||||||||||||||||||||||||||||||
| |
| Phenotypic Information (metabolism pathway, cancer, disease, phenome) |
| |
| |
| Gene-Gene Network Information: Co-Expression Network, Interacting Genes & KEGG |
| |
|


| Gene Summary for LIPG |
| Basic gene info. | Gene symbol | LIPG |
| Gene name | lipase, endothelial | |
| Synonyms | EDL|EL|PRO719 | |
| Cytomap | UCSC genome browser: 18q21.1 | |
| Genomic location | chr18 :47088426-47119278 | |
| Type of gene | protein-coding | |
| RefGenes | NM_006033.2, | |
| Ensembl id | ENSG00000101670 | |
| Description | endothelial cell-derived lipaseendothelial lipaselipoprotein lipase H | |
| Modification date | 20141211 | |
| dbXrefs | MIM : 603684 | |
| HGNC : HGNC | ||
| HPRD : 04730 | ||
| Protein | UniProt: go to UniProt's Cross Reference DB Table | |
| Expression | CleanEX: HS_LIPG | |
| BioGPS: 9388 | ||
| Gene Expression Atlas: ENSG00000101670 | ||
| The Human Protein Atlas: ENSG00000101670 | ||
| Pathway | NCI Pathway Interaction Database: LIPG | |
| KEGG: LIPG | ||
| REACTOME: LIPG | ||
| ConsensusPathDB | ||
| Pathway Commons: LIPG | ||
| Metabolism | MetaCyc: LIPG | |
| HUMANCyc: LIPG | ||
| Regulation | Ensembl's Regulation: ENSG00000101670 | |
| miRBase: chr18 :47,088,426-47,119,278 | ||
| TargetScan: NM_006033 | ||
| cisRED: ENSG00000101670 | ||
| Context | iHOP: LIPG | |
| cancer metabolism search in PubMed: LIPG | ||
| UCL Cancer Institute: LIPG | ||
| Assigned class in ccmGDB | C | |
| Top |
| Phenotypic Information for LIPG(metabolism pathway, cancer, disease, phenome) |
| Cancer | CGAP: LIPG |
| Familial Cancer Database: LIPG | |
| * This gene is included in those cancer gene databases. |
|
|
|
|
|
| . | ||||||||||||||||||||||||||||||||||||||||||||||||||||||||||||||||||||||||||||||||||||||||||||||||||||||||||||||||||||||||||||||||||||||||||||||||||||||||||||||||||||||||||||||||||||||||||||||||||||||||||||||||||||||||||||||||||||||||||||||||||||||||||||||||||||||||||||||||||||||||||||||||||||||||||||||||||||
Oncogene 1 | Significant driver gene in | |||||||||||||||||||||||||||||||||||||||||||||||||||||||||||||||||||||||||||||||||||||||||||||||||||||||||||||||||||||||||||||||||||||||||||||||||||||||||||||||||||||||||||||||||||||||||||||||||||||||||||||||||||||||||||||||||||||||||||||||||||||||||||||||||||||||||||||||||||||||||||||||||||||||||||||||||||||||||
| cf) number; DB name 1 Oncogene; http://nar.oxfordjournals.org/content/35/suppl_1/D721.long, 2 Tumor Suppressor gene; https://bioinfo.uth.edu/TSGene/, 3 Cancer Gene Census; http://www.nature.com/nrc/journal/v4/n3/abs/nrc1299.html, 4 CancerGenes; http://nar.oxfordjournals.org/content/35/suppl_1/D721.long, 5 Network of Cancer Gene; http://ncg.kcl.ac.uk/index.php, 1Therapeutic Vulnerabilities in Cancer; http://cbio.mskcc.org/cancergenomics/statius/ |
| KEGG_GLYCEROLIPID_METABOLISM | |
| OMIM | |
| Orphanet | |
| Disease | KEGG Disease: LIPG |
| MedGen: LIPG (Human Medical Genetics with Condition) | |
| ClinVar: LIPG | |
| Phenotype | MGI: LIPG (International Mouse Phenotyping Consortium) |
| PhenomicDB: LIPG | |
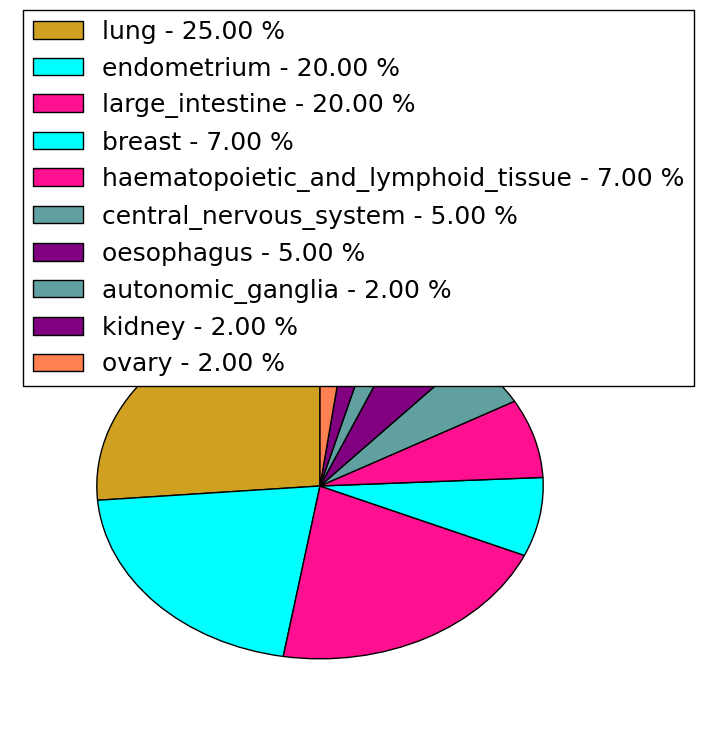
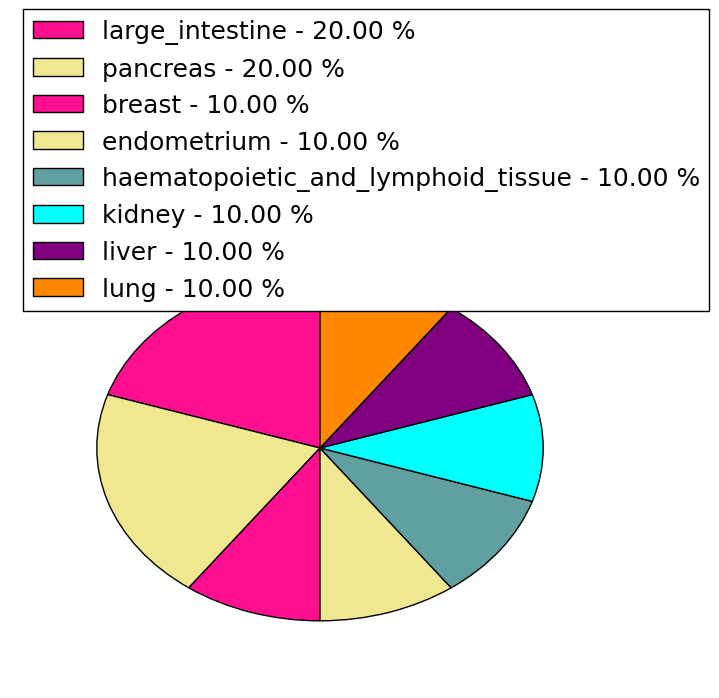
| Mutations for LIPG |
| * Under tables are showing count per each tissue to give us broad intuition about tissue specific mutation patterns.You can go to the detailed page for each mutation database's web site. |
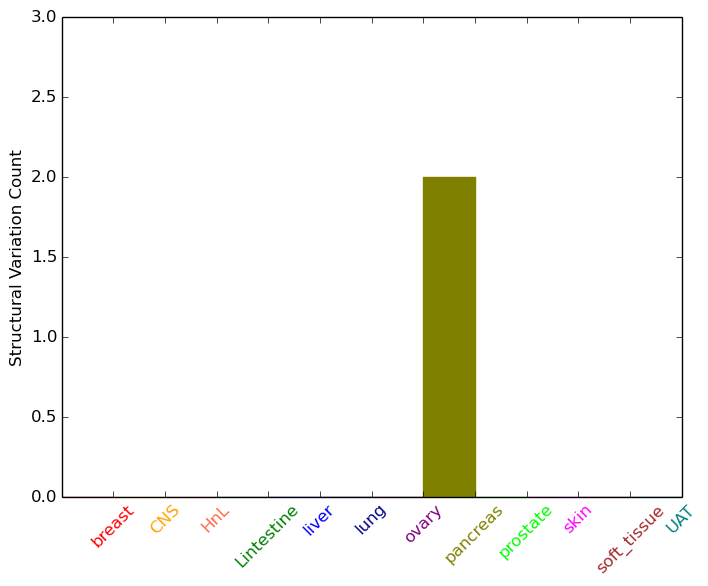
| - Statistics for Tissue and Mutation type | Top |
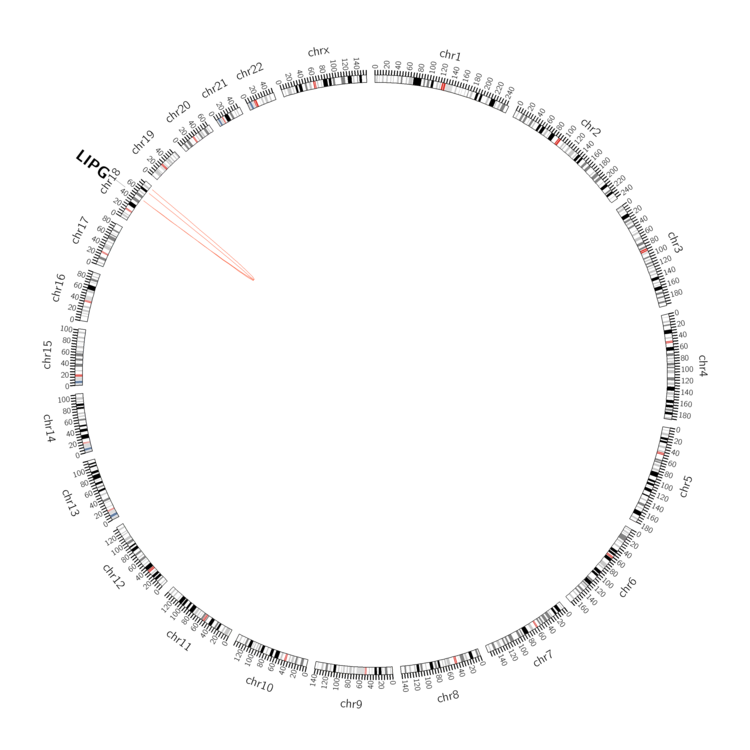 |
| - For Inter-chromosomal Variations |
| There's no inter-chromosomal structural variation. |
| - For Intra-chromosomal Variations |
| * Intra-chromosomal variantions includes 'intrachromosomal amplicon to amplicon', 'intrachromosomal amplicon to non-amplified dna', 'intrachromosomal deletion', 'intrachromosomal fold-back inversion', 'intrachromosomal inversion', 'intrachromosomal tandem duplication', 'Intrachromosomal unknown type', 'intrachromosomal with inverted orientation', 'intrachromosomal with non-inverted orientation'. |
 |
| Sample | Symbol_a | Chr_a | Start_a | End_a | Symbol_b | Chr_b | Start_b | End_b |
| pancreas | LIPG | chr18 | 47088614 | 47088634 | chr18 | 64141086 | 64141106 | |
| pancreas | LIPG | chr18 | 47091766 | 47091786 | chr18 | 73143234 | 73143254 |
| cf) Tissue number; Tissue name (1;Breast, 2;Central_nervous_system, 3;Haematopoietic_and_lymphoid_tissue, 4;Large_intestine, 5;Liver, 6;Lung, 7;Ovary, 8;Pancreas, 9;Prostate, 10;Skin, 11;Soft_tissue, 12;Upper_aerodigestive_tract) |
| * From mRNA Sanger sequences, Chitars2.0 arranged chimeric transcripts. This table shows LIPG related fusion information. |
| ID | Head Gene | Tail Gene | Accession | Gene_a | qStart_a | qEnd_a | Chromosome_a | tStart_a | tEnd_a | Gene_a | qStart_a | qEnd_a | Chromosome_a | tStart_a | tEnd_a |
| AU139929 | STT3A | 1 | 287 | 11 | 125462749 | 125472235 | LIPG | 280 | 654 | 18 | 47091715 | 47095841 | |
| Top |
| Mutation type/ Tissue ID | brca | cns | cerv | endome | haematopo | kidn | Lintest | liver | lung | ns | ovary | pancre | prost | skin | stoma | thyro | urina | |||
| Total # sample | 1 | |||||||||||||||||||
| GAIN (# sample) | ||||||||||||||||||||
| LOSS (# sample) | 1 |
| cf) Tissue ID; Tissue type (1; Breast, 2; Central_nervous_system, 3; Cervix, 4; Endometrium, 5; Haematopoietic_and_lymphoid_tissue, 6; Kidney, 7; Large_intestine, 8; Liver, 9; Lung, 10; NS, 11; Ovary, 12; Pancreas, 13; Prostate, 14; Skin, 15; Stomach, 16; Thyroid, 17; Urinary_tract) |
| Top |
|
 |
| Top |
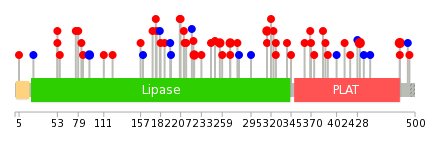
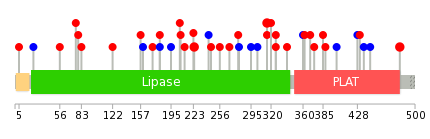
| Stat. for Non-Synonymous SNVs (# total SNVs=39) | (# total SNVs=10) |
 |  |
(# total SNVs=1) | (# total SNVs=0) |
 |
| Top |
| * When you move the cursor on each content, you can see more deailed mutation information on the Tooltip. Those are primary_site,primary_histology,mutation(aa),pubmedID. |
| GRCh37 position | Mutation(aa) | Unique sampleID count |
| chr18:47110059-47110059 | p.R431C | 3 |
| chr18:47113180-47113180 | p.R481C | 3 |
| chr18:47101837-47101837 | p.R224C | 2 |
| chr18:47091868-47091868 | p.T93T | 2 |
| chr18:47107935-47107935 | p.R315H | 2 |
| chr18:47101933-47101933 | p.D256N | 2 |
| chr18:47107796-47107796 | p.V269M | 2 |
| chr18:47110024-47110024 | p.A419V | 1 |
| chr18:47101830-47101830 | p.T221T | 1 |
| chr18:47107823-47107823 | p.V278I | 1 |
| Top |
|
 |
| Point Mutation/ Tissue ID | 1 | 2 | 3 | 4 | 5 | 6 | 7 | 8 | 9 | 10 | 11 | 12 | 13 | 14 | 15 | 16 | 17 | 18 | 19 | 20 |
| # sample | 1 | 2 | 6 | 1 | 3 | 1 | 5 | 4 | 1 | 1 | 8 | 3 | 9 | |||||||
| # mutation | 1 | 2 | 5 | 1 | 3 | 1 | 5 | 4 | 1 | 1 | 8 | 3 | 9 | |||||||
| nonsynonymous SNV | 1 | 1 | 4 | 1 | 5 | 3 | 1 | 1 | 5 | 2 | 8 | |||||||||
| synonymous SNV | 1 | 2 | 3 | 1 | 1 | 3 | 1 | 1 |
| cf) Tissue ID; Tissue type (1; BLCA[Bladder Urothelial Carcinoma], 2; BRCA[Breast invasive carcinoma], 3; CESC[Cervical squamous cell carcinoma and endocervical adenocarcinoma], 4; COAD[Colon adenocarcinoma], 5; GBM[Glioblastoma multiforme], 6; Glioma Low Grade, 7; HNSC[Head and Neck squamous cell carcinoma], 8; KICH[Kidney Chromophobe], 9; KIRC[Kidney renal clear cell carcinoma], 10; KIRP[Kidney renal papillary cell carcinoma], 11; LAML[Acute Myeloid Leukemia], 12; LUAD[Lung adenocarcinoma], 13; LUSC[Lung squamous cell carcinoma], 14; OV[Ovarian serous cystadenocarcinoma ], 15; PAAD[Pancreatic adenocarcinoma], 16; PRAD[Prostate adenocarcinoma], 17; SKCM[Skin Cutaneous Melanoma], 18:STAD[Stomach adenocarcinoma], 19:THCA[Thyroid carcinoma], 20:UCEC[Uterine Corpus Endometrial Carcinoma]) |
| Top |
| * We represented just top 10 SNVs. When you move the cursor on each content, you can see more deailed mutation information on the Tooltip. Those are primary_site, primary_histology, mutation(aa), pubmedID. |
| Genomic Position | Mutation(aa) | Unique sampleID count |
| chr18:47113180 | p.R315H | 2 |
| chr18:47095890 | p.R481C | 2 |
| chr18:47107935 | p.F181L | 2 |
| chr18:47101837 | p.R224C | 2 |
| chr18:47107968 | p.Q436Q | 1 |
| chr18:47110059 | p.L160L | 1 |
| chr18:47095817 | p.F303F | 1 |
| chr18:47101900 | p.R315C | 1 |
| chr18:47107969 | p.L444L | 1 |
| chr18:47110076 | p.A172V | 1 |
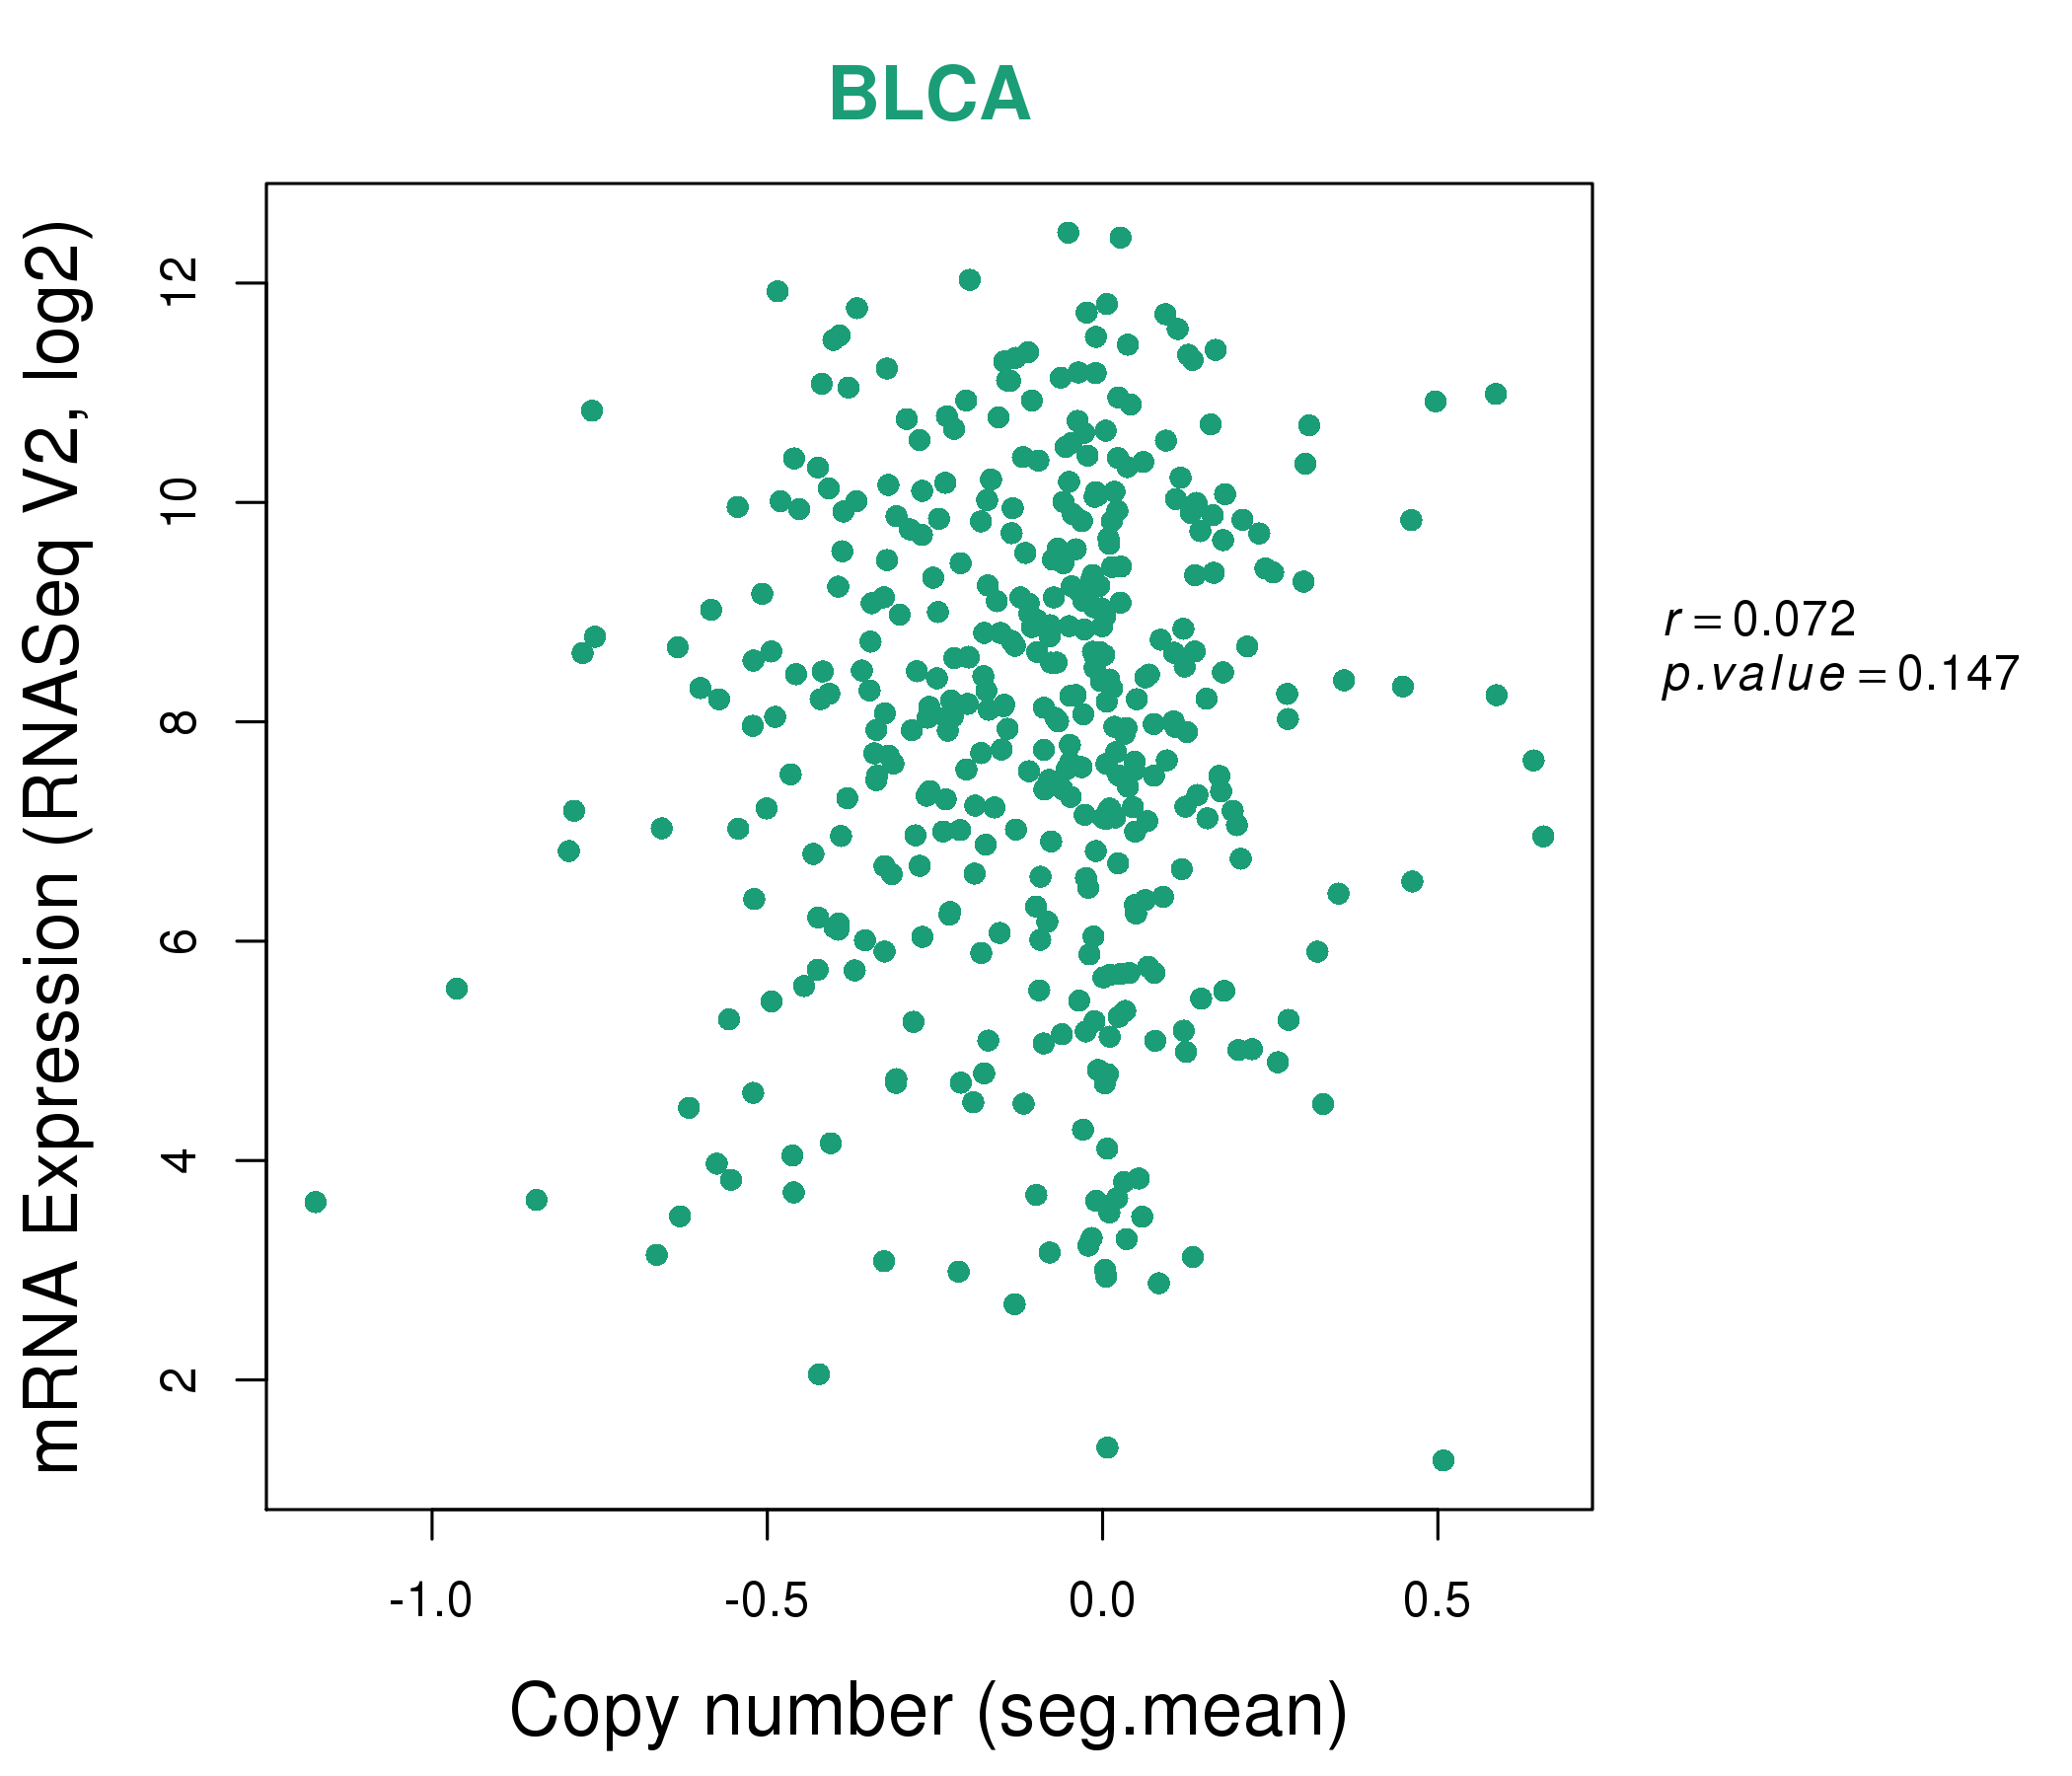
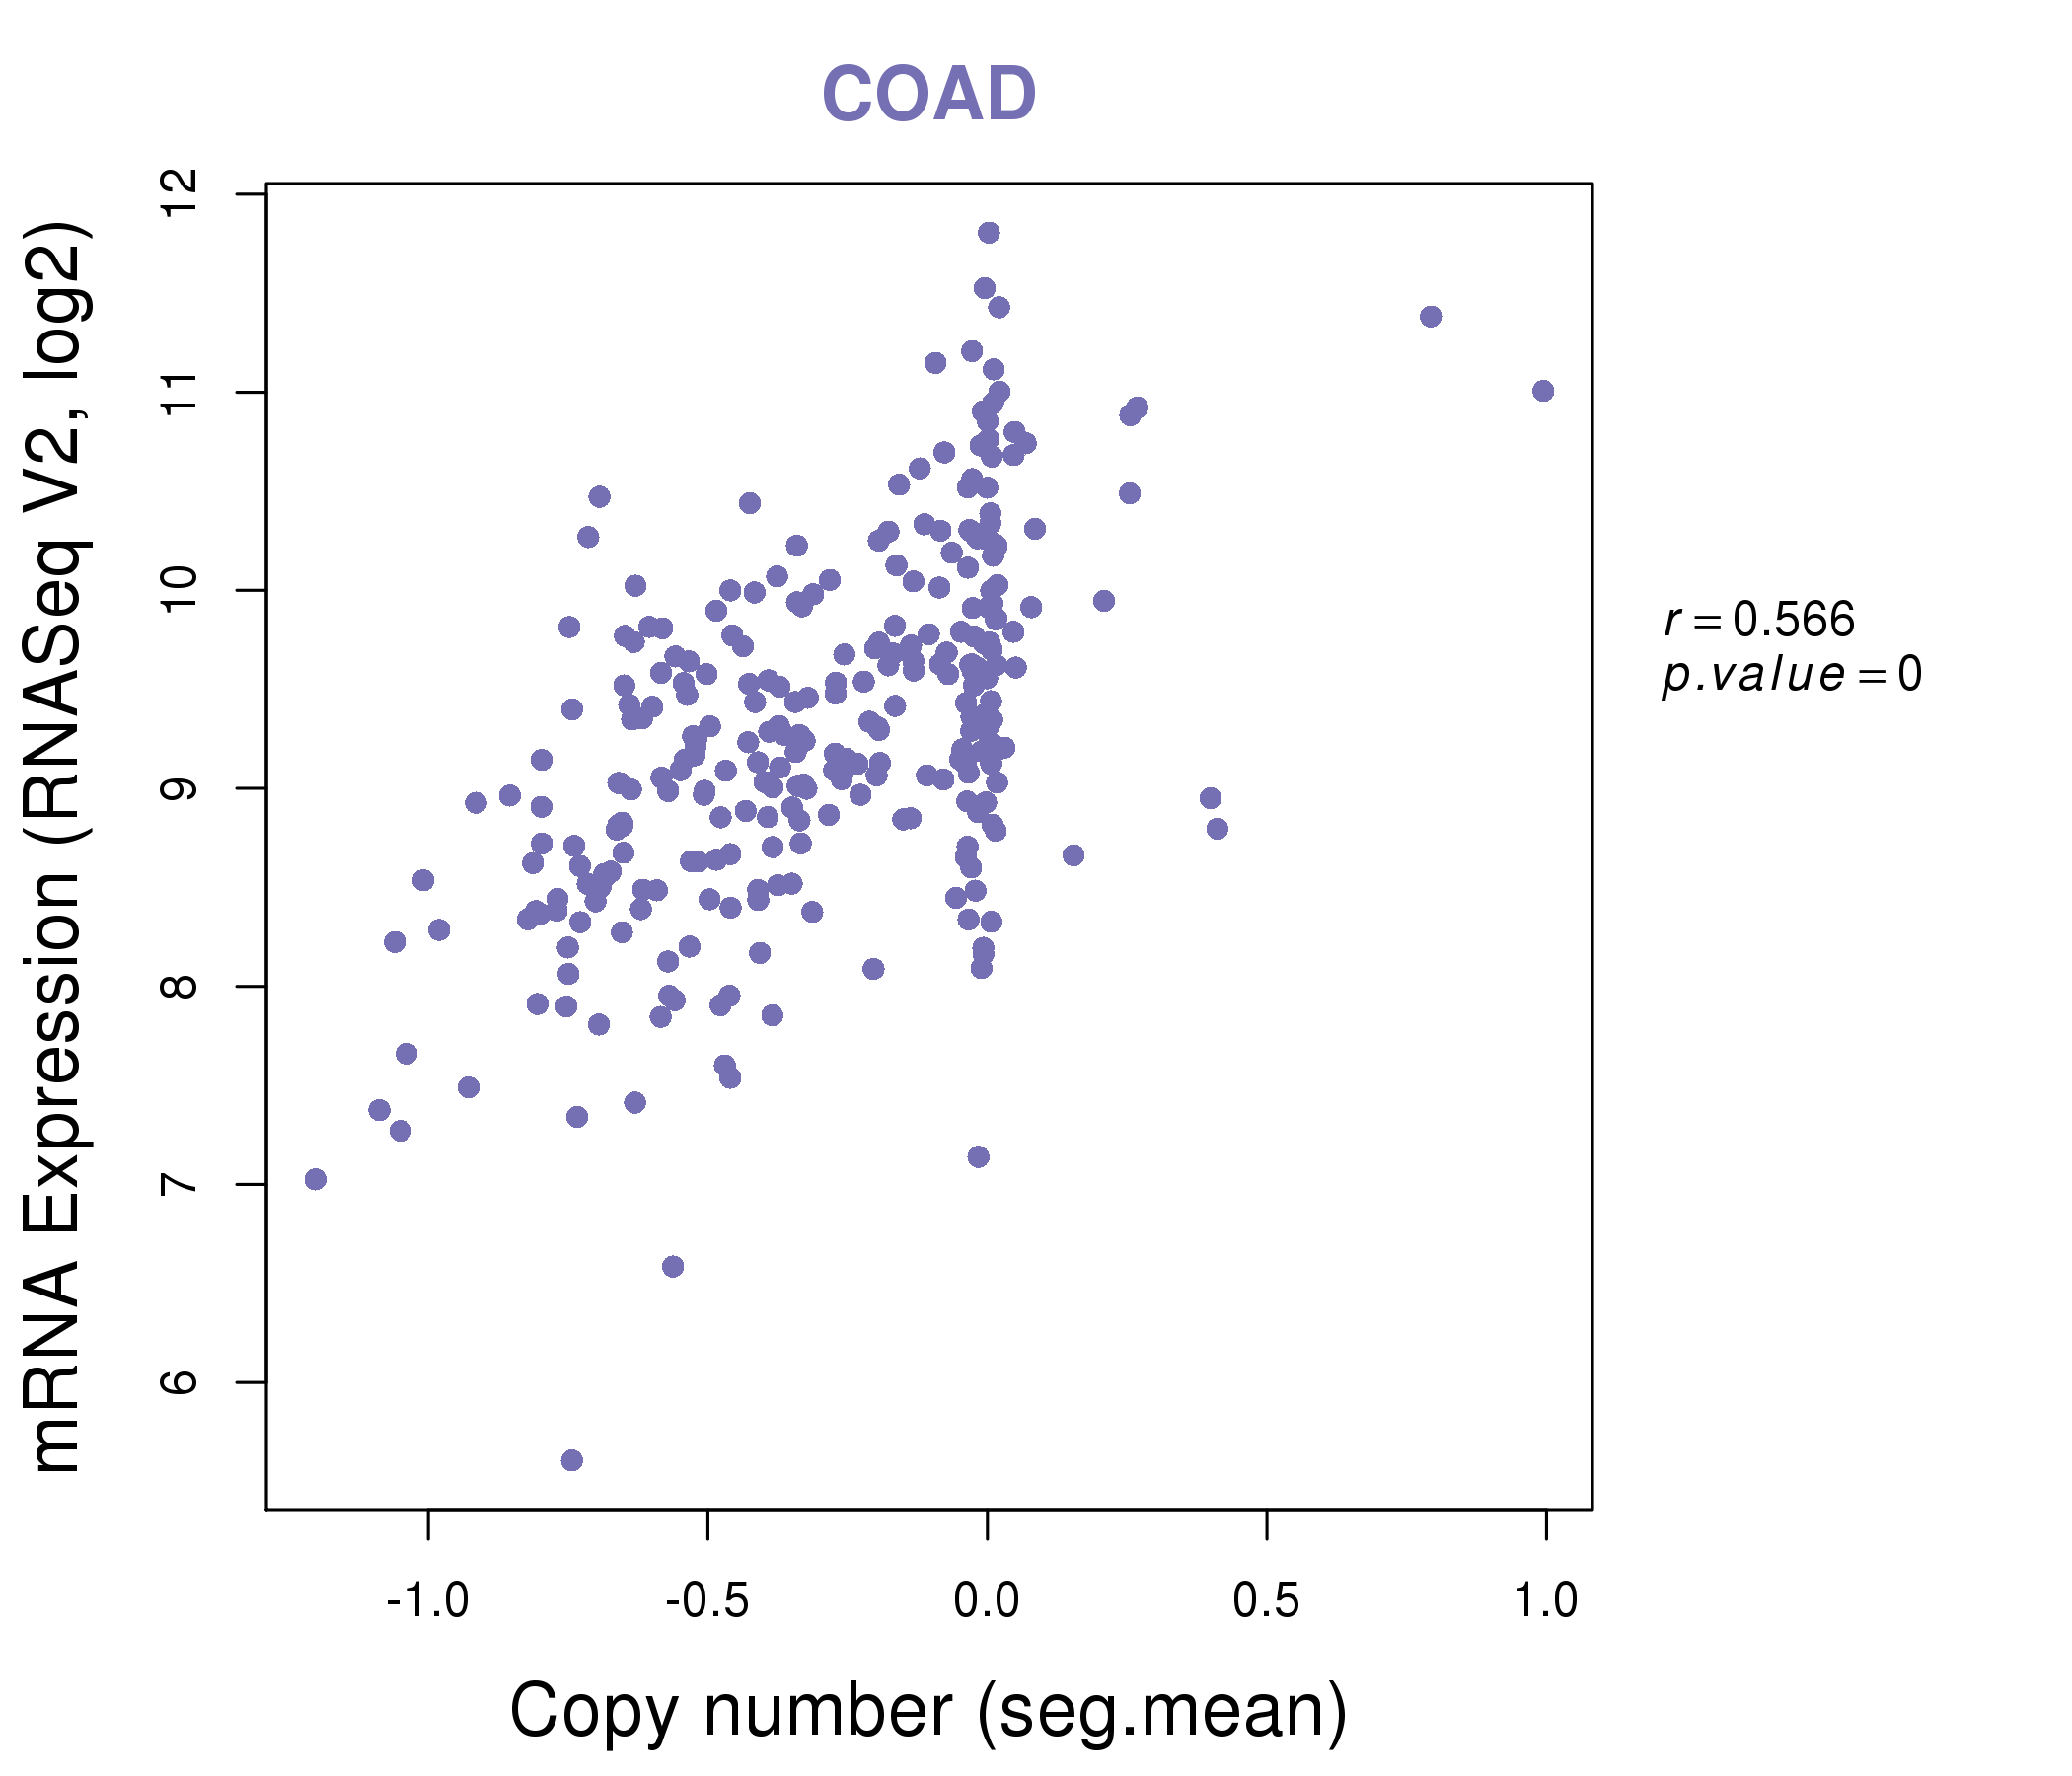
| * Copy number data were extracted from TCGA using R package TCGA-Assembler. The URLs of all public data files on TCGA DCC data server were gathered on Jan-05-2015. Function ProcessCNAData in TCGA-Assembler package was used to obtain gene-level copy number value which is calculated as the average copy number of the genomic region of a gene. |
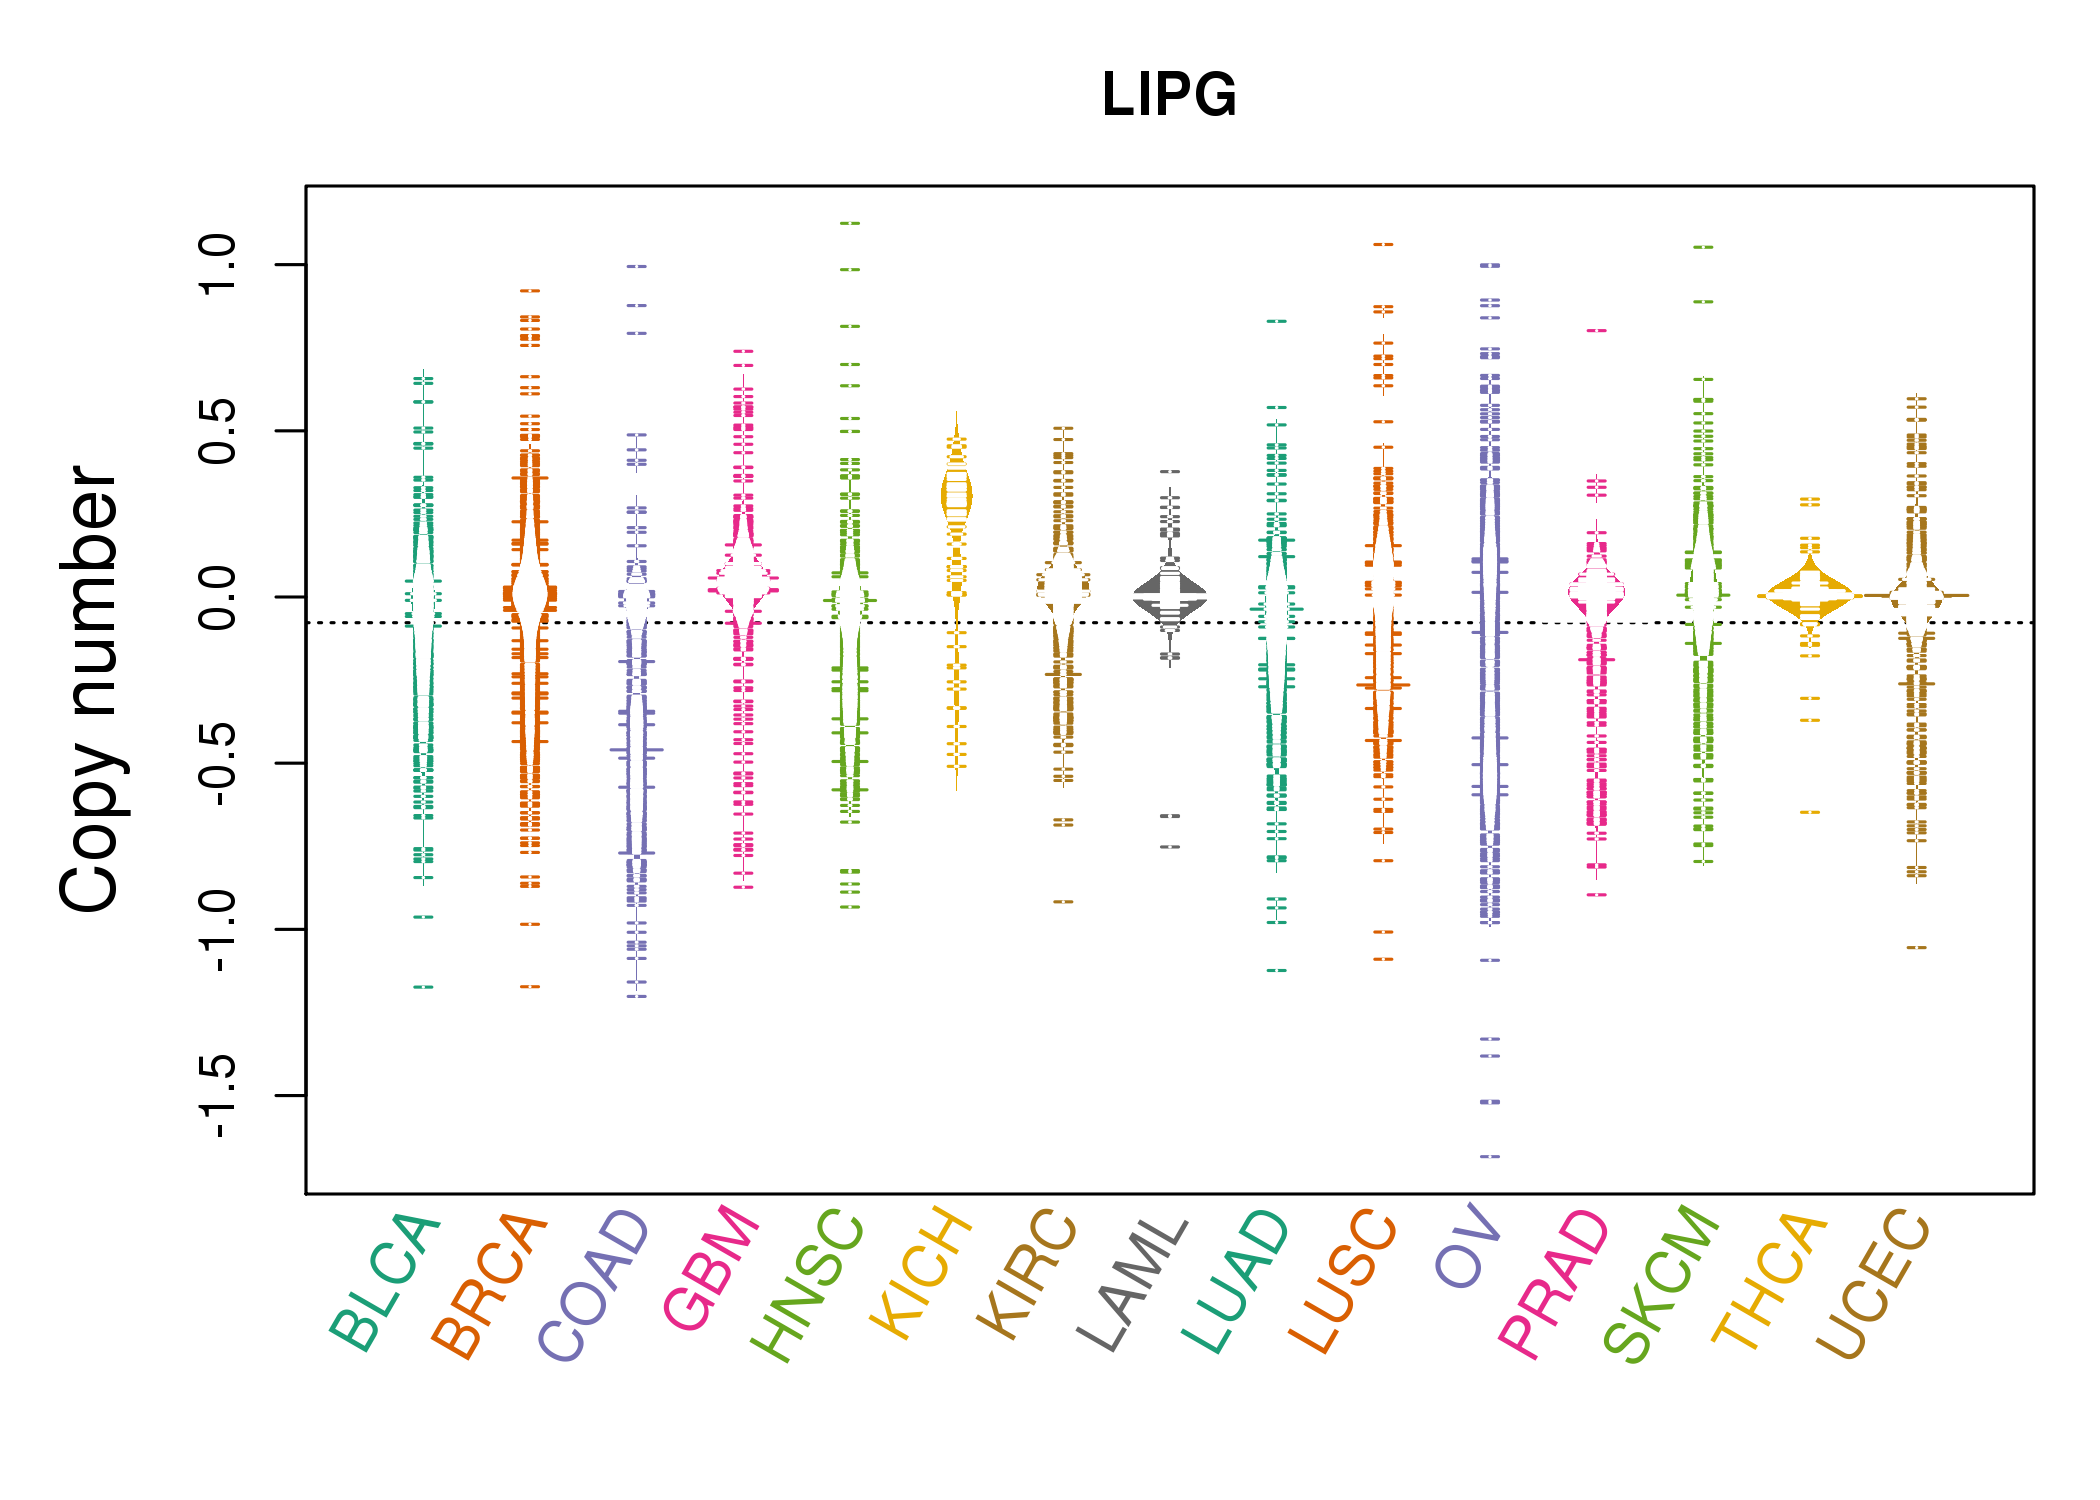 |
| cf) Tissue ID[Tissue type]: BLCA[Bladder Urothelial Carcinoma], BRCA[Breast invasive carcinoma], CESC[Cervical squamous cell carcinoma and endocervical adenocarcinoma], COAD[Colon adenocarcinoma], GBM[Glioblastoma multiforme], Glioma Low Grade, HNSC[Head and Neck squamous cell carcinoma], KICH[Kidney Chromophobe], KIRC[Kidney renal clear cell carcinoma], KIRP[Kidney renal papillary cell carcinoma], LAML[Acute Myeloid Leukemia], LUAD[Lung adenocarcinoma], LUSC[Lung squamous cell carcinoma], OV[Ovarian serous cystadenocarcinoma ], PAAD[Pancreatic adenocarcinoma], PRAD[Prostate adenocarcinoma], SKCM[Skin Cutaneous Melanoma], STAD[Stomach adenocarcinoma], THCA[Thyroid carcinoma], UCEC[Uterine Corpus Endometrial Carcinoma] |
| Top |
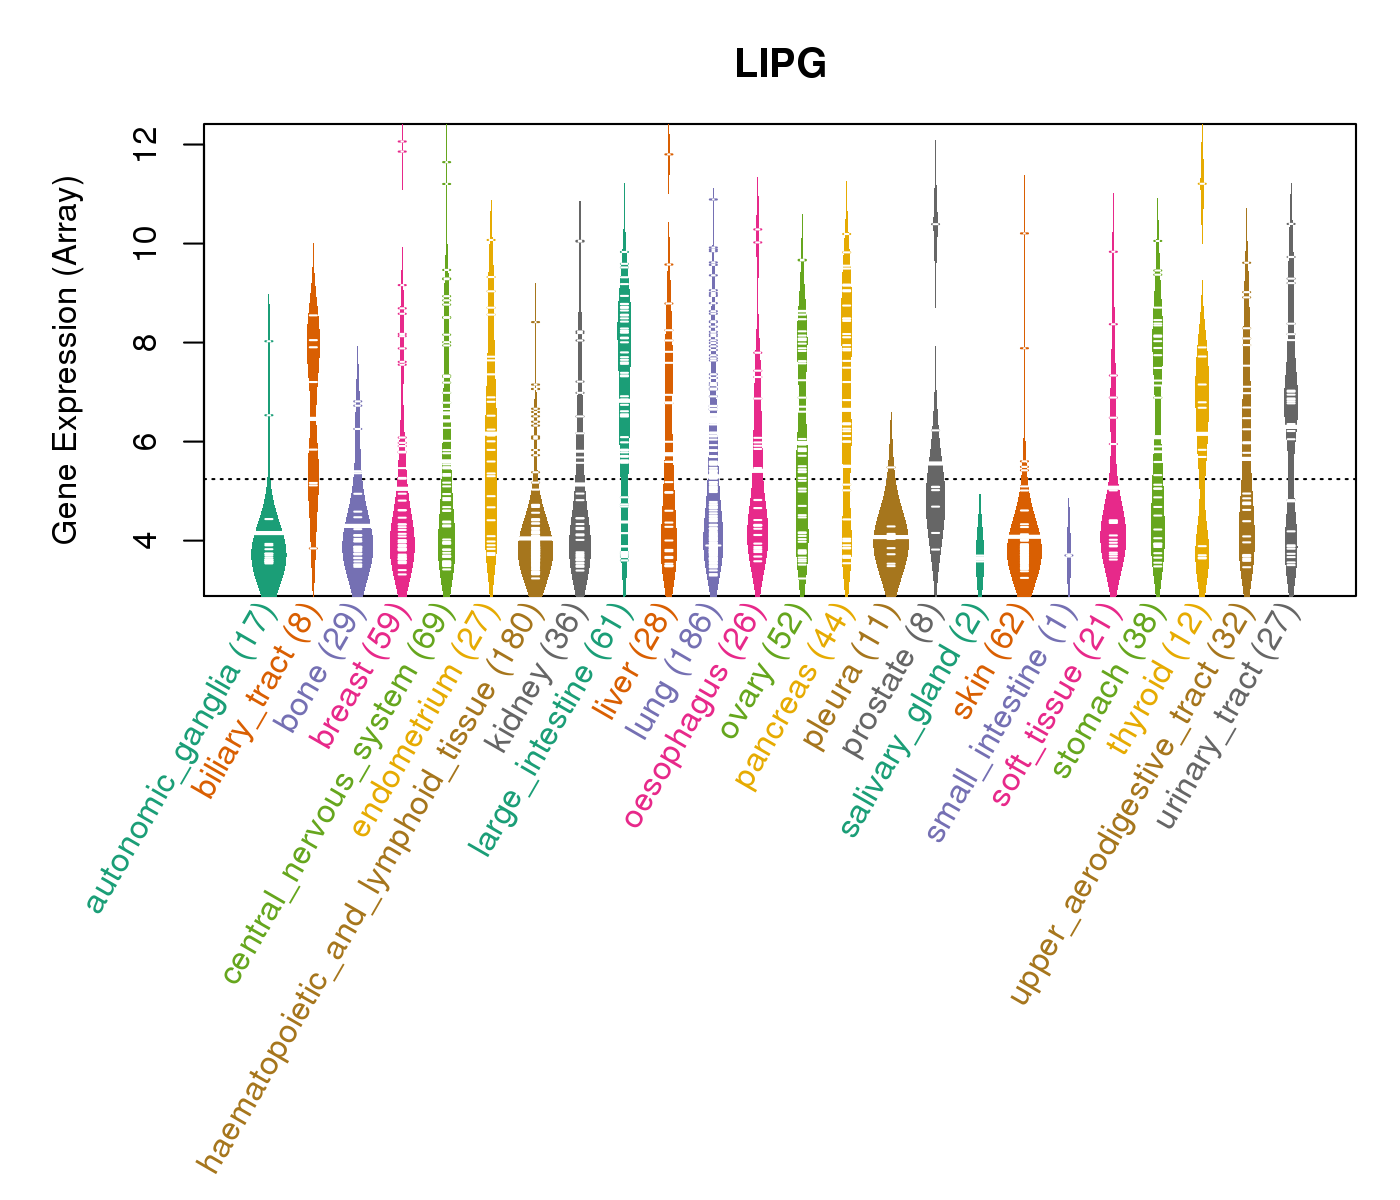
| Gene Expression for LIPG |
| * CCLE gene expression data were extracted from CCLE_Expression_Entrez_2012-10-18.res: Gene-centric RMA-normalized mRNA expression data. |
 |
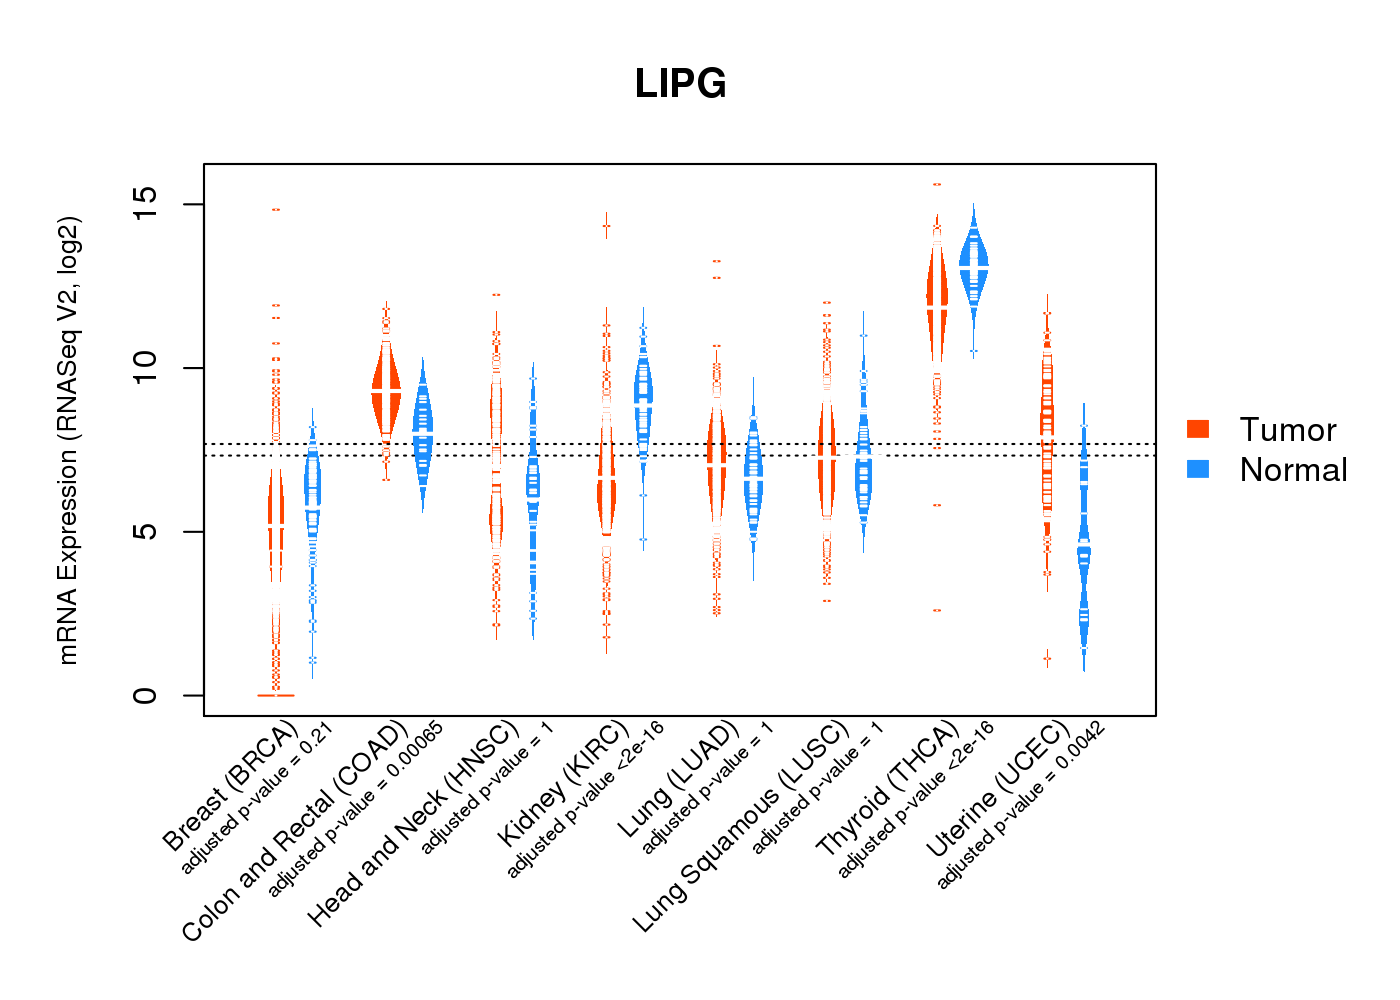
| * Normalized gene expression data of RNASeqV2 was extracted from TCGA using R package TCGA-Assembler. The URLs of all public data files on TCGA DCC data server were gathered at Jan-05-2015. Only eight cancer types have enough normal control samples for differential expression analysis. (t test, adjusted p<0.05 (using Benjamini-Hochberg FDR)) |
 |
| Top |
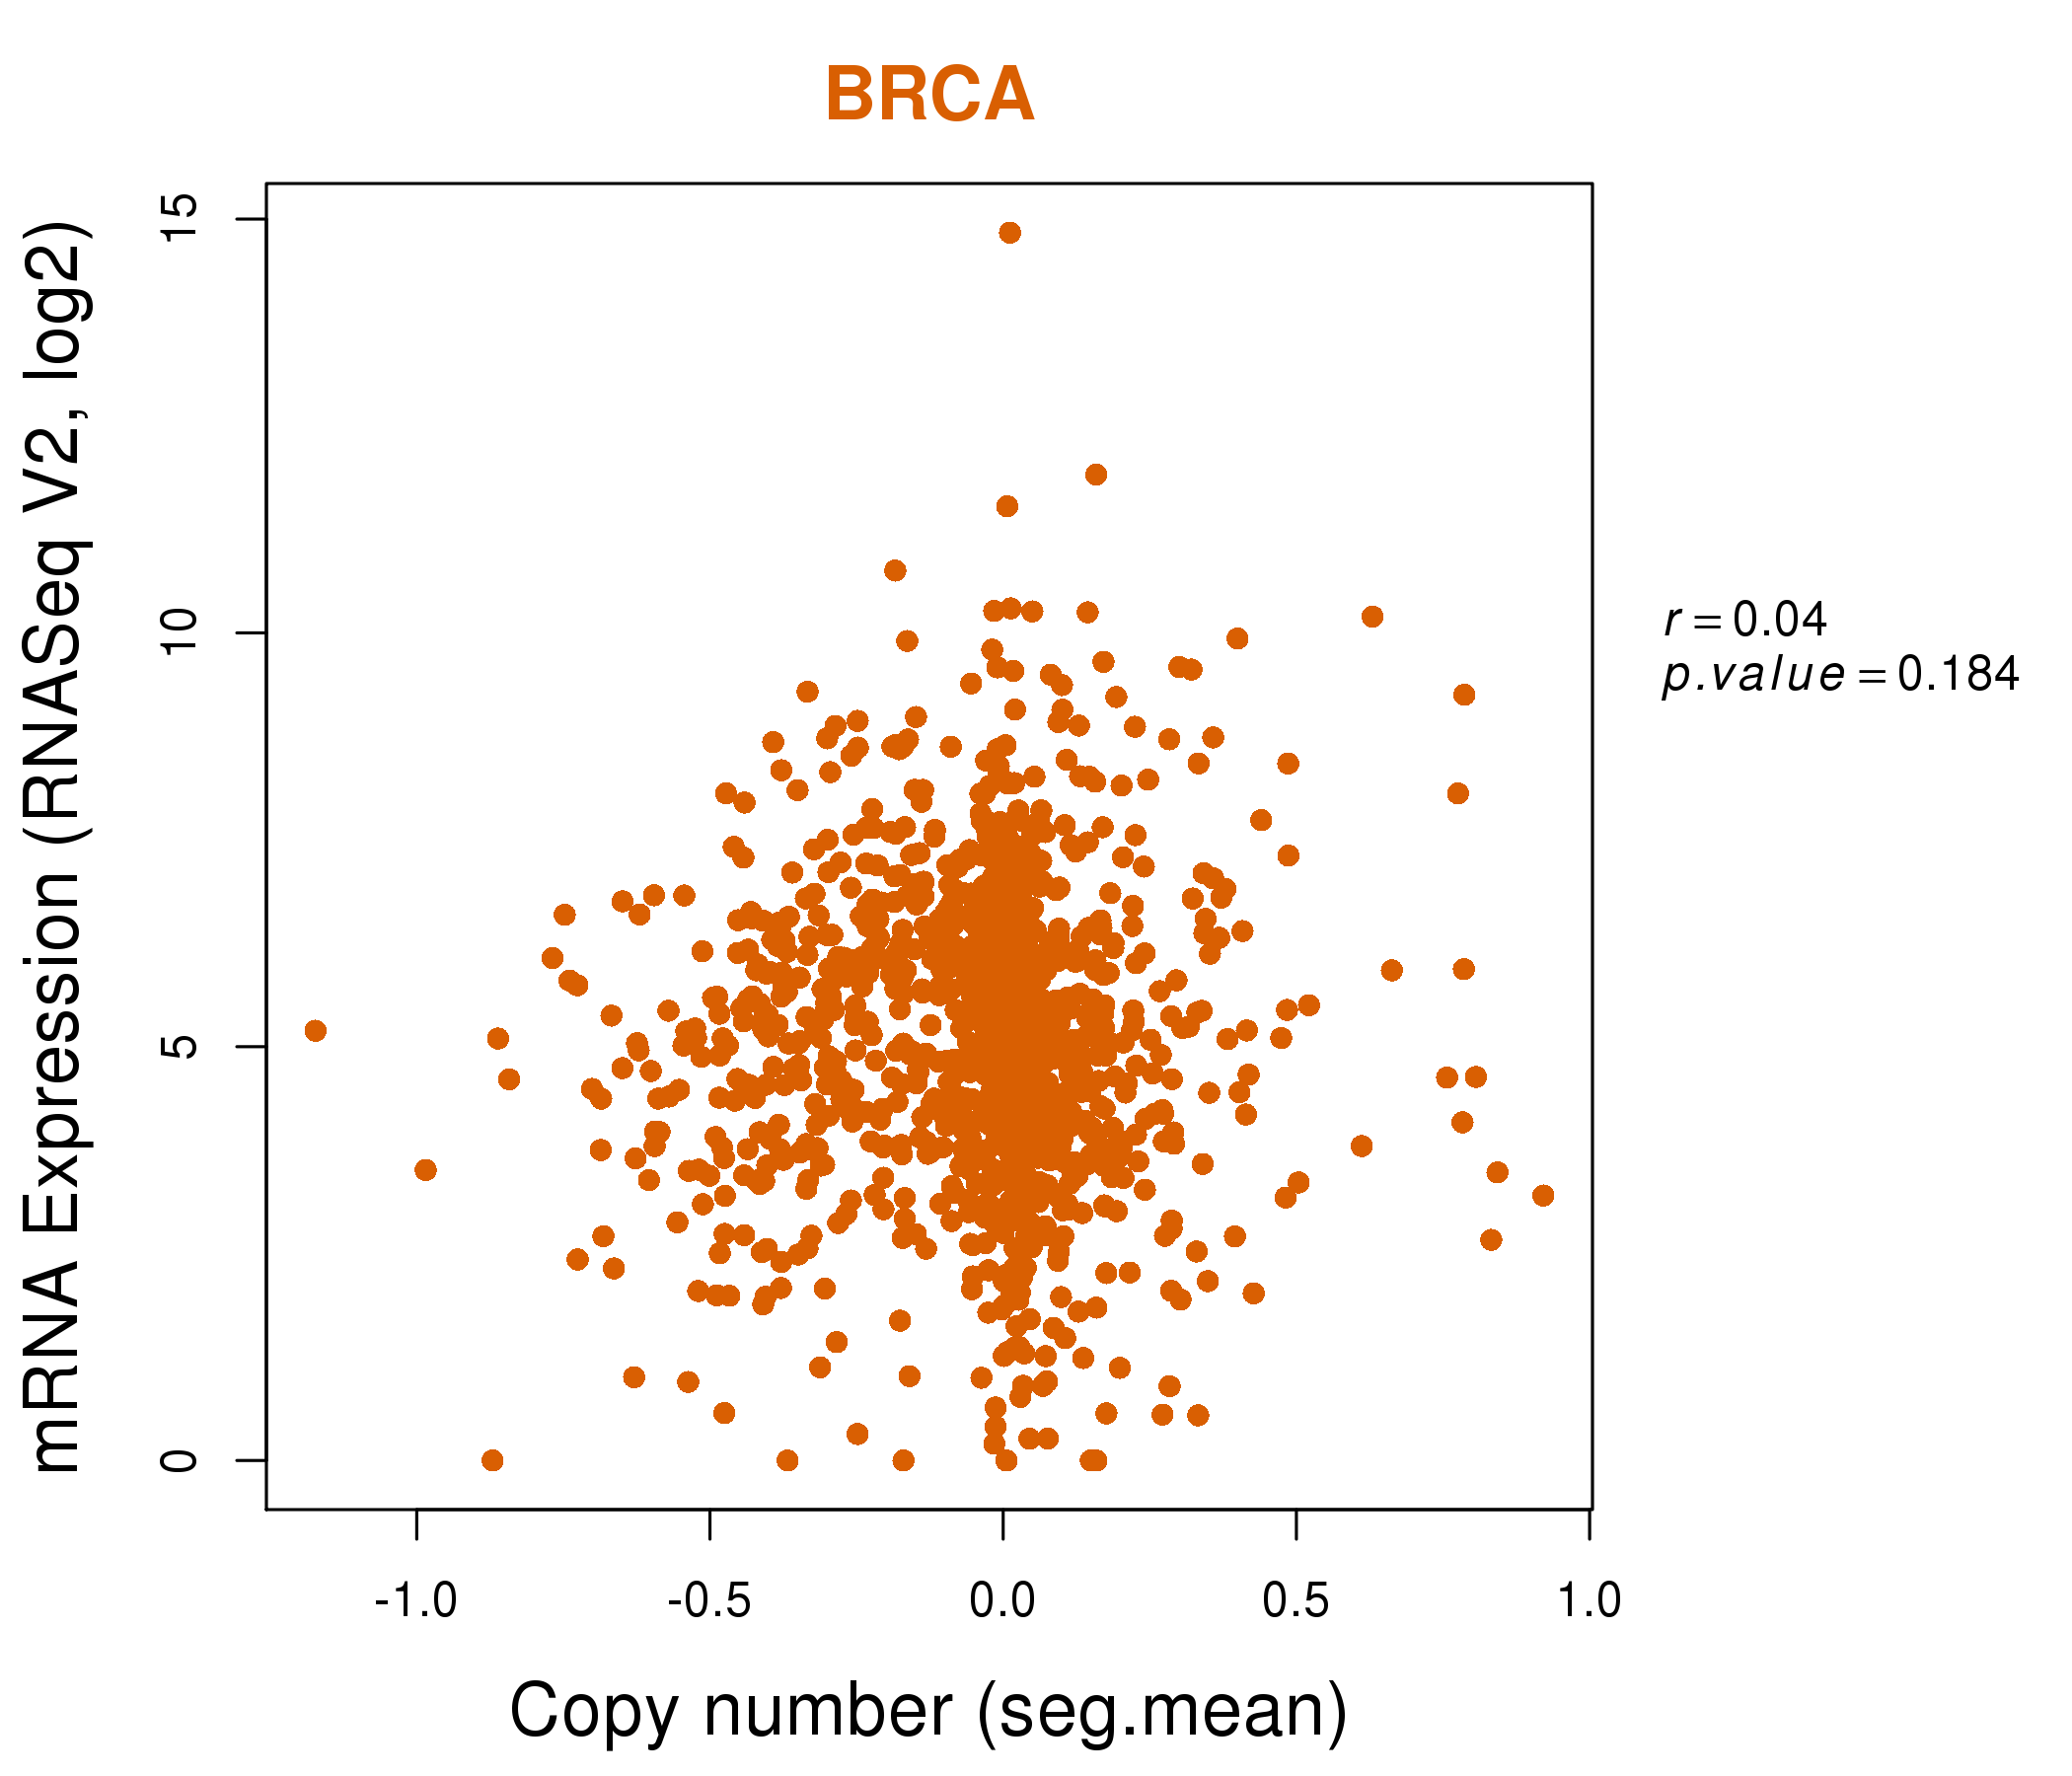
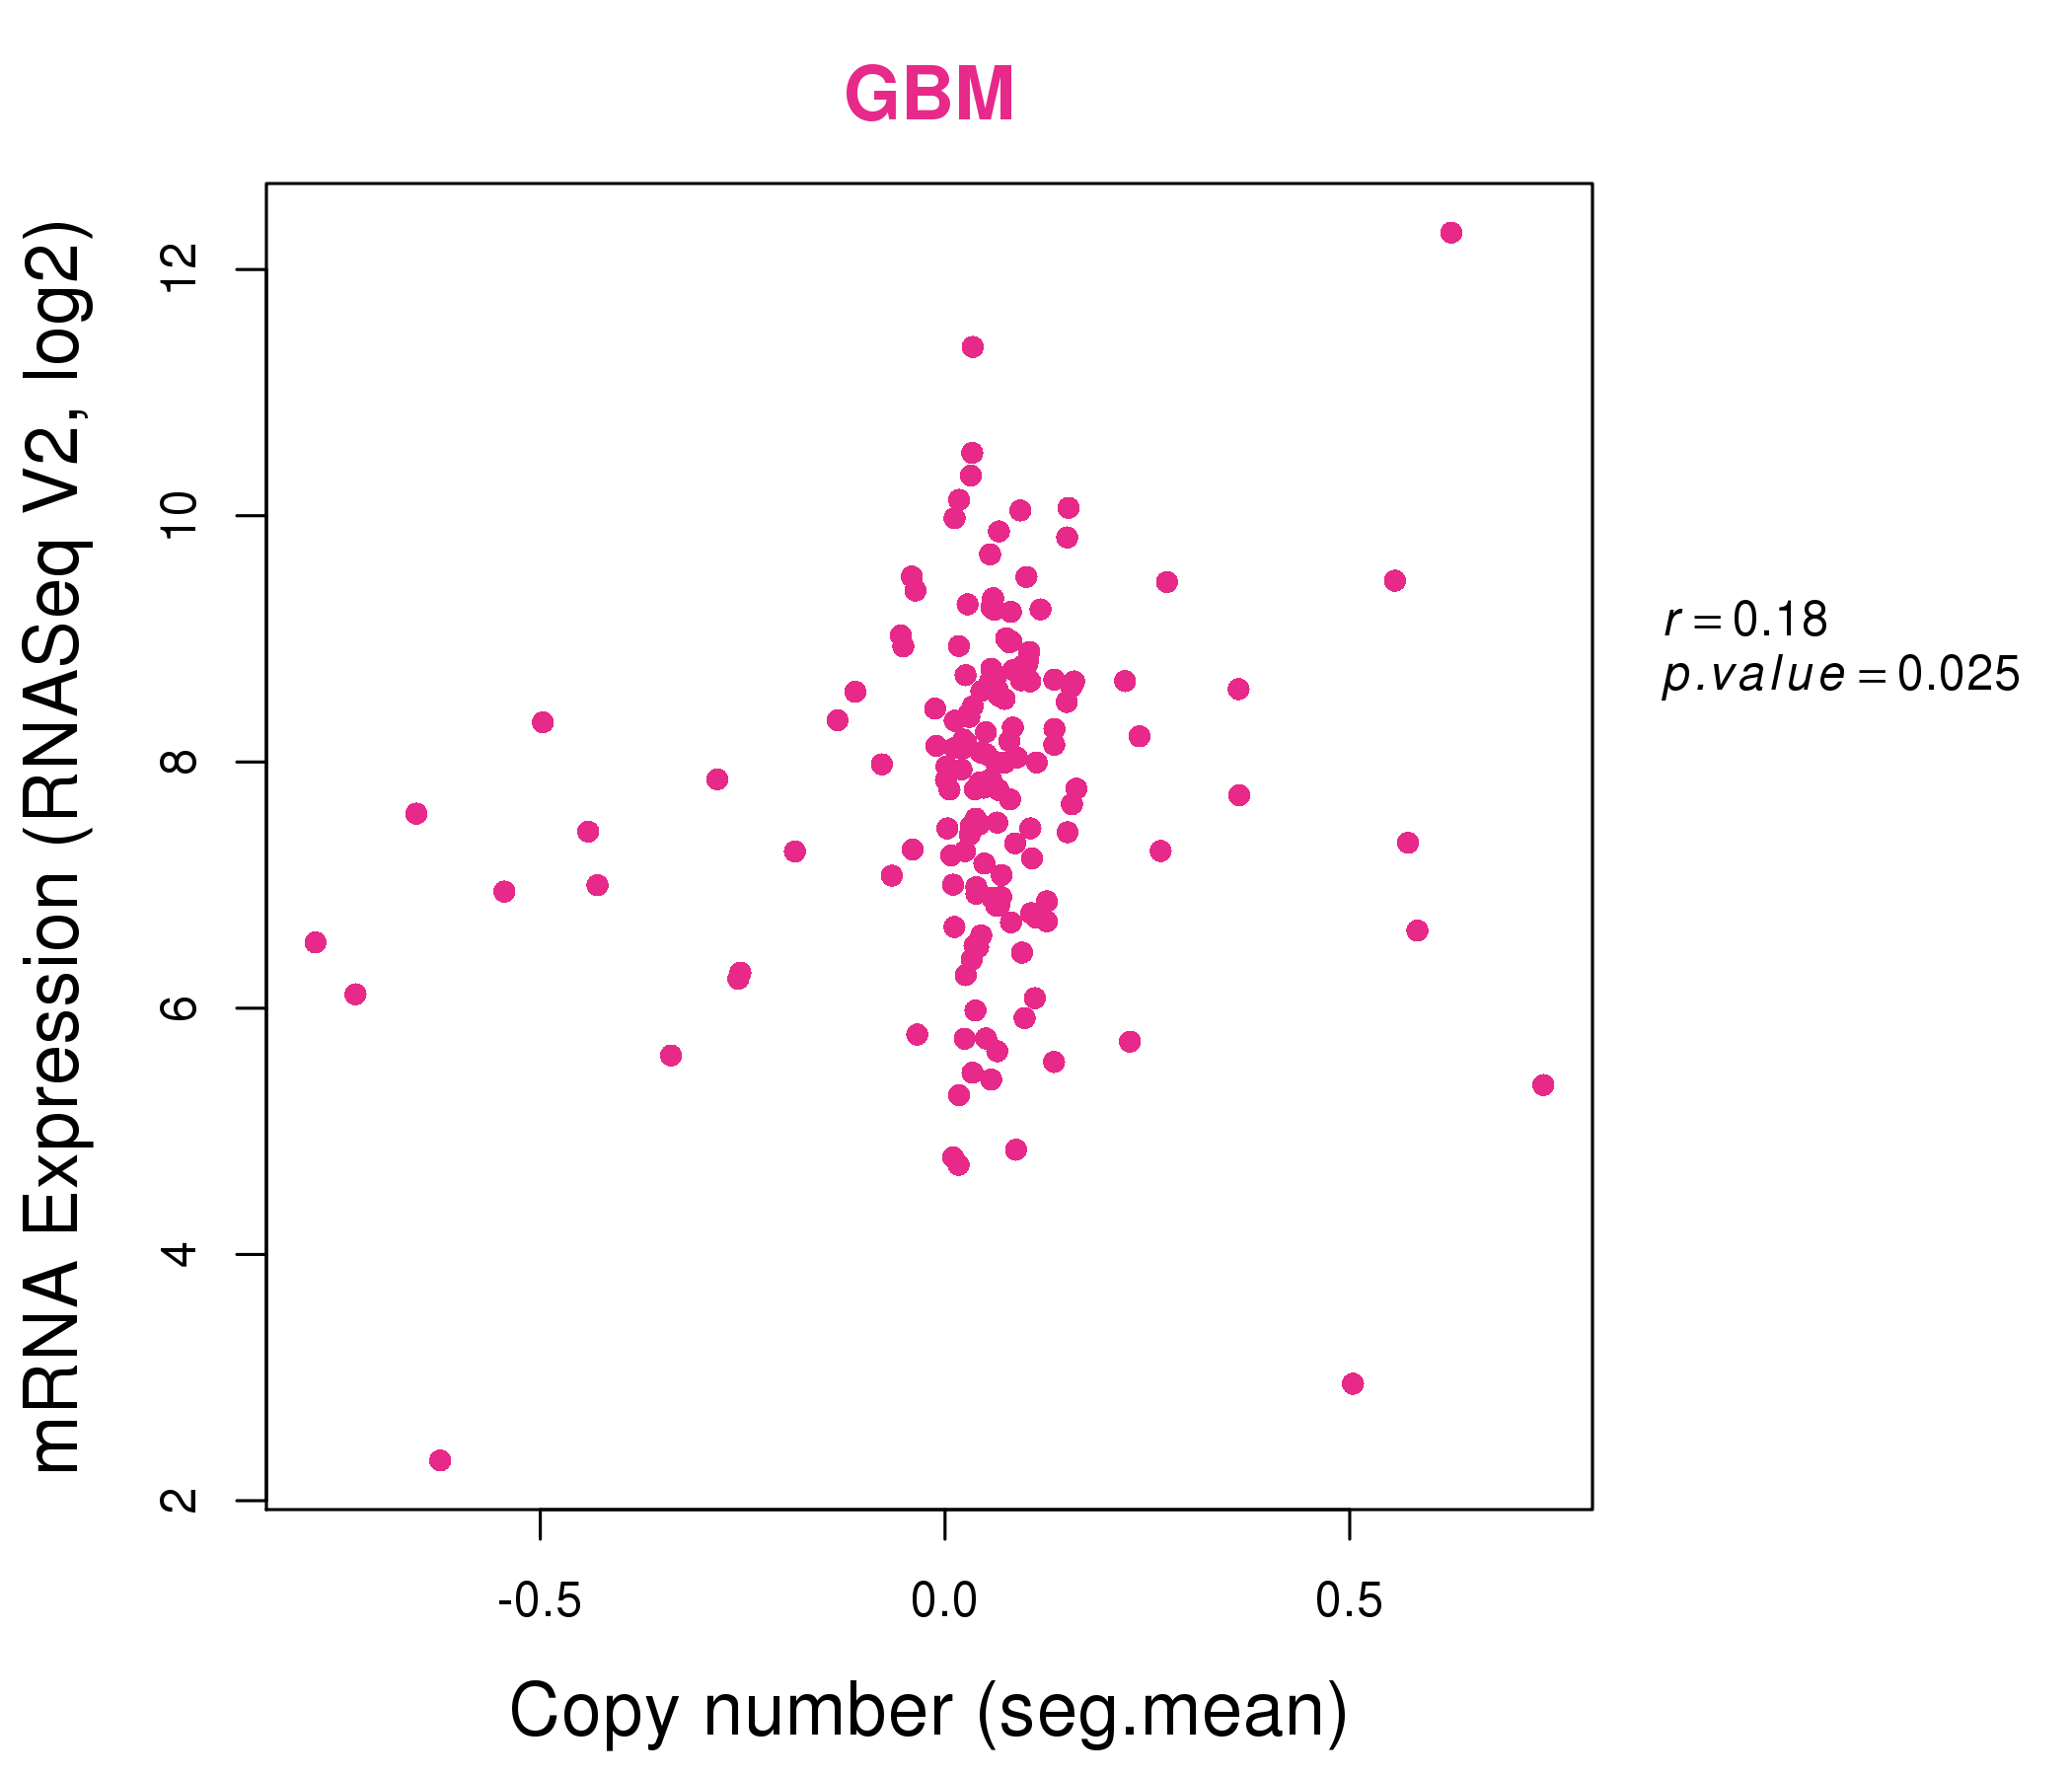
| * This plots show the correlation between CNV and gene expression. |
: Open all plots for all cancer types
 |
|
 |
|
| Top |
| Gene-Gene Network Information |
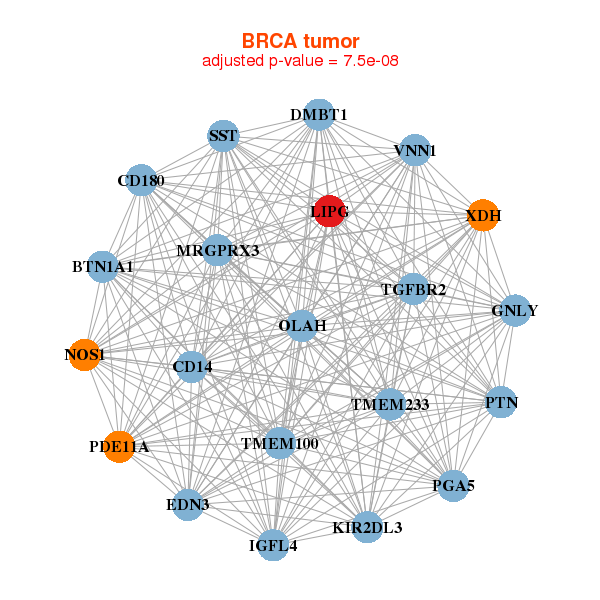
| * Co-Expression network figures were drawn using R package igraph. Only the top 20 genes with the highest correlations were shown. Red circle: input gene, orange circle: cell metabolism gene, sky circle: other gene |
: Open all plots for all cancer types
 |
|
| BTN1A1,CD14,CD180,DMBT1,EDN3,GNLY,IGFL4, KIR2DL3,LIPG,MRGPRX3,NOS1,OLAH,PDE11A,PGA5, PTN,SST,TGFBR2,TMEM100,TMEM233,VNN1,XDH | ARAP2,BBOX1,C22orf23,CD24,CDC42SE1,CDCP1,GABRP, ITGB6,LIPG,MIR31HG,LRRC4C,MICALL1,MPZL1,NLGN4X, PROM1,SRSF12,SLC15A2,SLC2A9,SLC34A2,SLC39A2,ZBED4 |
 |
|
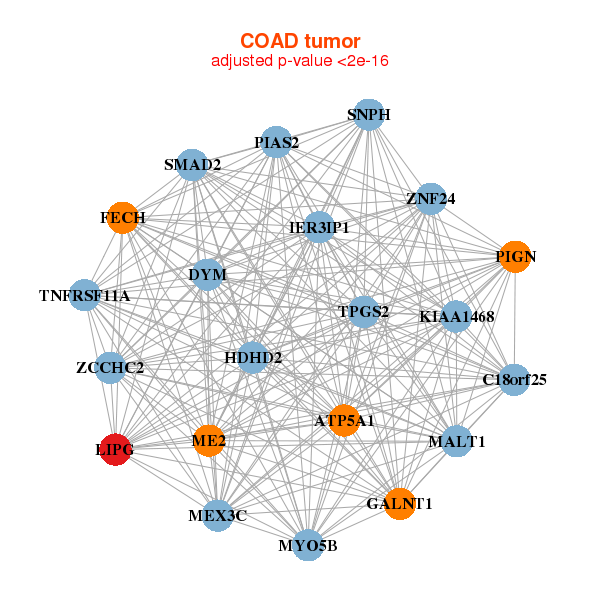
| ATP5A1,TPGS2,C18orf25,DYM,FECH,GALNT1,HDHD2, IER3IP1,KIAA1468,LIPG,MALT1,ME2,MEX3C,MYO5B, PIAS2,PIGN,SMAD2,SNPH,TNFRSF11A,ZCCHC2,ZNF24 | ADAMTS15,AK7,COQ2,CYP19A1,DMBT1,HIF1A,HTR4, IL1RL1,LARS2,LIPG,MLKL,NAMPT,NNMT,OLFM4, PCSK9,PDE11A,PGD,SOD2,STARD4,TEAD4,TKT |
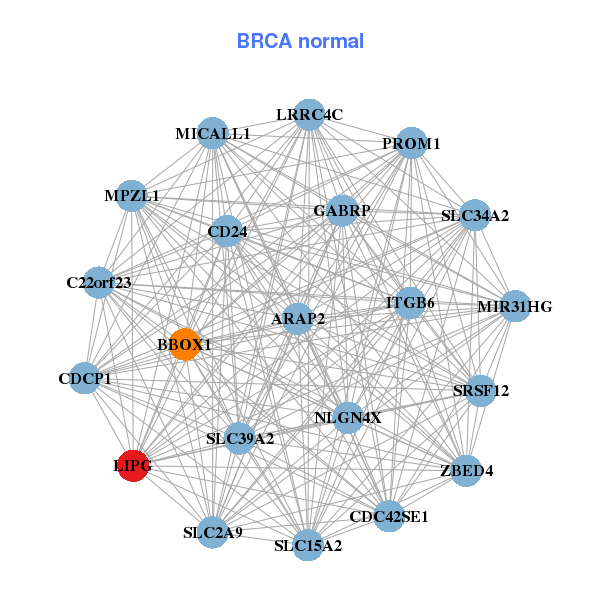
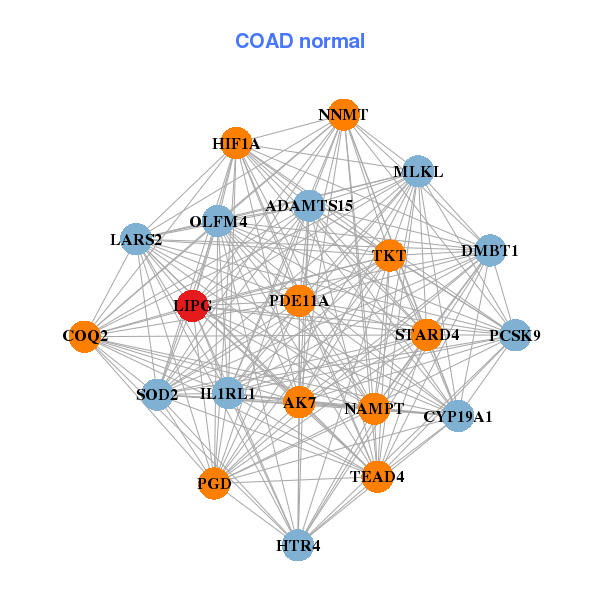
| * Co-Expression network figures were drawn using R package igraph. Only the top 20 genes with the highest correlations were shown. Red circle: input gene, orange circle: cell metabolism gene, sky circle: other gene |
: Open all plots for all cancer types
| Top |
: Open all interacting genes' information including KEGG pathway for all interacting genes from DAVID
| Top |
| Pharmacological Information for LIPG |
| There's no related Drug. |
| Top |
| Cross referenced IDs for LIPG |
| * We obtained these cross-references from Uniprot database. It covers 150 different DBs, 18 categories. http://www.uniprot.org/help/cross_references_section |
: Open all cross reference information
|
Copyright © 2016-Present - The Univsersity of Texas Health Science Center at Houston @ |